 Pierre Larraufie
 Kenza Haroun1‡
 François Blachier
- 1Université Paris-Saclay, AgroParisTech, INRAE, UMR PNCA, Palaiseau, France
- 2Université Paris-Saclay, INRAE, AgroParisTech, Micalis Institute, Jouy-en-Josas, France
Endocrine functions of the gut are supported by a scattered population of cells, the enteroendocrine cells (EECs). EECs sense their environment to secrete hormones in a regulated manner. Distal EECs are in contact with various microbial compounds including hydrogen sulfide (H2S) which modulate cell respiration with potential consequences on EEC physiology. However, the effect of H2S on gut hormone secretion remains discussed and the importance of the modulation of cell metabolism on EEC functions remains to be deciphered. The aim of this project was to characterize the metabolic response of EECs to H2S and the consequences on GLP-1 secretion. We used cell line models of EECs to assess their capacity to metabolize H2S at low concentration and the associated modulation of cell respiration. We confirmed that like what is observed in colonocytes, colonic EEC model, NCI-h716 cell line rapidly metabolizes H2S at low concentrations, resulting in transient increased respiration. Higher concentrations of H2S inhibited this respiration, with the concentration threshold for inhibition depending on cell density. However, increased or inhibited oxidative respiration had little effect on acute GLP-1 secretion. Overall, we present here a first study showing the EEC capacity to detoxify low concentrations of H2S and used this model to acutely address the importance of cell respiration on secretory activity.
Introduction
Enteroendocrine cells (EECs) sense their environment to secrete hormones in a highly controlled manner. These hormones regulate key host functions including glucose metabolism, food intake or digestive functions (1), representing targets of interest for drug development in diseases such as diabetes. Recent single-cell analysis have provided a better description of the different EEC populations along the gut (2, 3) highlighting the different potential regulations of these cells, mainly through the analysis of receptor and nutrient channel expression. Proximal EECs have been shown to be regulated by nutrient absorption, resulting in high postprandial gut hormone levels. Regulations of distal EECs is less known despite their importance (4), and microbial compounds participate in the regulation of these cells (5).
Among these microbial metabolites, hydrogen sulfide (H2S) has been shown to modulate EEC secretion, but with conflicting results. H2S is produced by specific intestinal bacteria through cysteine catabolism and by reduction of sulphate as well as by endogenous production, although this latter production is presumably much lower than the production by the intestinal microbiota (6). Bala and colleagues showed that H2S at millimolar concentration inhibited TGR5-induced secretion, reducing the GLP-1 and PYY secretion in response to bile acids in STC-1 cells, a mouse cell line model of duodenal EECs (7). They showed that H2S reduced the hydrolysis of phosphatidylinositol-4,5-bisphosphate into inositol triphosphate under cAMP stimulation induced by TGR5 activation. In contrast, Pichette and colleagues showed that high concentrations of H2S (10 mM) could directly increase GLP-1 secretion in the mouse colonic EEC cell line GluTag cells and proposed that the mechanism was mediated by MAPK activation (8). Interestingly, they showed that mice fed prebiotics, which increase H2S production, was associated with increased GLP-1 circulating levels. Finally, in stomach EECs, Slade and collaborators showed that H2S donors or H2S cell endogenous production inhibited ghrelin secretion in mouse stomach primary culture and in vivo (9). All these results indicate that different EEC subpopulations may have different sensitivity to H2S depending on their localization, on the experimental conditions, but also on the tested concentrations. Interestingly, no H2S receptor has been identified so far and it is believed that H2S mainly acts through post translational protein persulfidation (10) and modulation of mitochondrial functions with dual functions on the respiration (11).
Regarding this latter aspect, it has been shown that H2S at low (micromolar) concentration is oxidized in absorptive colonocytes by the sulfide oxidation unit (SOU) to thiosulfate in three successive steps involving the sulfide quinone reductase (encoded by SQR or Sqrdl), the sulfur dioxygenase (ETHE1) and the thiosulfate sulfur transferase (TST) (12–15). The first site of oxidation takes place in the inner membrane of the mitochondria, leading to the transfer of two electrons to Co-enzyme Q and then to the electron transport chain. This results in increased oxygen consumption and ATP production, and H2S is therefore considered as an inorganic substrate for oxidative respiration and energy production in cells (16, 17). On the other hand, H2S has a poisoning effect on mitochondrial oxidative respiration by inhibiting complex IV (18, 19) that also prevents its own detoxification. Studies on colonocytes have shown that the main effect of H2S was dependent on its concentration and the capacity of the cell to metabolize it, resulting in this dual effect in which low concentrations are associated with increased oxidative respiration whereas concentrations above 50µM inhibit it (20).
To our knowledge, very little is known about the role of energy metabolism in EECs, and if this can regulate production or secretion of gut hormones. In this study, we propose to analyze the response of EECs to different concentrations of H2S and we use this model to assess the consequences of acute modulation of EEC respiration on hormone secretion.
Materials and methods
Cell culture and secretion assay
NCI-h716 and HuTu-80 cells were cultivated in respectively RPMI and DMEM, both supplemented with 10% Fetal Bovine Serum (FBS), 2 mM L-glutamine and 50 IU ml−1 penicillin and 50 µg ml−1 streptomycin in humidified incubator at 37°C with 5% CO2. Oxygen consumption and secretion assays were performed in a secretion buffer composed of NaCl 140 mM, KCl 5 mM, MgCl2 2 mM, CaCl2 2 mM, Hepes 10 mM, pH adjusted to 7.3. Na2S (from Sigma) was dissolved in the secretory buffer and pH adjusted to 7.3 with NaOH.
For secretion, 4 million cells per sample were rinsed in secretion buffer and resuspended in 2mL. Na2S was added either every 90s or at once, all resulting in the same final volume of 2.1mL. After 15 minutes of experiment, cells were centrifuged at 300g at 4°C and supernatant was frozen at -20°C. GLP-1 was then measured using a GLP-1 Elisa (EZGLP1T-36K from Merck Millipore) and data analyzed using R. Experiments were performed in duplicate and replicated 4 times, resulting in 8 independent measures of GLP-1 in each condition. Data were normalized with the basal secretion of each experiment and differences between conditions assessed using a Kruskall-Wallis test followed by a Dunn test, excluding the positive control Forskolin/IBMX high glucose from the analysis. A p adjusted value below 0.05 was considered to indicate difference between groups.
Oxygen consumption
Cell respiration was assessed by measuring real time O2 concentration in a sealed chamber of an oxygraph (O2k Oroboros) at 37°C. O2 concentrations were kept above 60nmol/mL during each experiments to avoid any effect of low O2 concentrations on cell respiration. Indicated number of cells were suspended in 2mL of secretory buffer and placed in the chamber and treatments were successively added. Oxygen consumption was calculated as the opposite of the oxygen concentration derivate using Oroboros Datlab5 software. Basal respiration was calculated as the average cell respiration during 5 minutes before addition of the first treatment. Additional oxygen consumption was measured as the area of the peak corresponding to increased respiration calculated as the mean respiration over the peak minus basal respiration multiplied by the duration of the peak. Experiments were repeated 3 to 5 times for each condition.
Gene expression analysis
Mouse sorted cells gene expression
Available transcriptomic databases of sorted live EECs from Neurod1-cre x EYFP mice (21), a mouse model enabling the labelling of all EECs in the intestines, were reanalyzed to assess gene of interest expression. Bulk transcriptomics data (22) (GSE114913) were analyzed using Deseq2 R package (23) and single cell transcriptomics (2) (GSE137572) using Seurat package (24), designating the cells high expression of Gcg L-cells, those with high expression of Sst D cells and those with high Tph1 enterochromaffin cells (ECC).
Cell lines gene expression
1 million cells per sample were harvested and lysed in 500µL Trizol. RNA was extracted using phenol/chloroform extraction. 100µL chloroform was added to the homogenates, and after centrifugation at 12000g during 15 minutes at 4°C, the aqueous phase retrieved. RNA was precipitated with 1mL isopropanol and centrifuged at 12000g during 10 minutes at 4°C. RNA precipitate was washed twice with 500µL 70% (vol/vol) ethanol solution before being resuspended in RNAse free water.
0.5µg of RNA was reverse transcribed using the High capacity cDNA Reverse transcription kit (Applied Biosystems) and qPCR performed on a StepOne Real Time PCR system (applied Biosystems) in 12µL reaction (6µL of SybrGreen MasterMix (Applied Biosystems), 1µL of cDNA diluted 20 times and 200nM of reverse and forward primers sequences (Table 1). Data were analyzed using the Stepone software, normalizing gene expression to RNA18S expression.
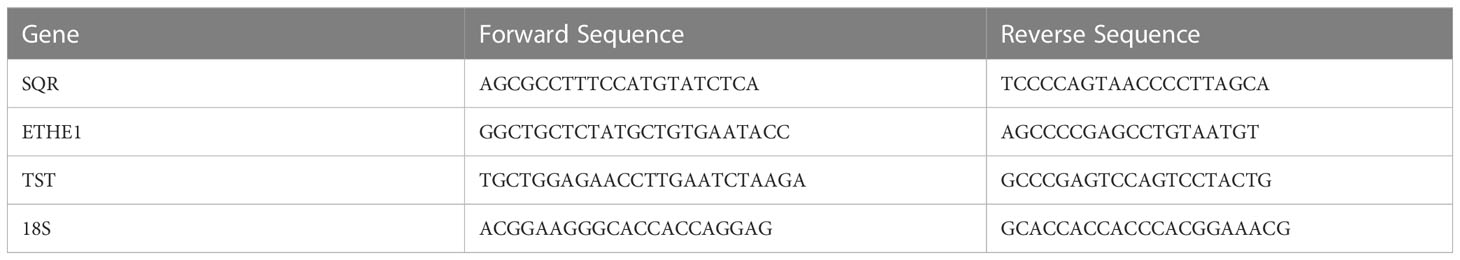
Table 1 Primer sequences.
Calcium signaling
NCI-h716 expressing GCamp5G (25), a protein which fluorescence depends on calcium signaling was used to analyze calcium responses. Rapidly, 50 000 cells were washed twice in secretion buffer and left 30 minutes at room temperature to equilibrate. Cells were then analyzed on a microscope Olympus CKX53, and images were acquired with Infinity Analyser software v6.5 every second. Secretion buffer or Na2S were added after 30s of acquisition. Cell fluorescence was analyzed using ImageJ from 3 experiments and representative cells selected for plotting.
Results
Expression of genes involved in H2S metabolism in EECs and model cell lines
We first assessed whether EECs expressed the three enzymes of the SOU complex involved in H2S oxidation and detoxification. Using bulk transcriptomics analysis of EEC sorted cells from different regions of the mouse gut (22), we found that the three enzymes were expressed in EECs as well as in other epithelial cells (Figure 1A). We also confirmed that the H2S detoxification machinery is more highly expressed in the colon than in the small intestine, in line with the higher production of H2S in the distal gut. Using single-cell transcriptomic data to compare expression of these enzymes in the main colonic EEC subpopulations (2), we found that expression was lower in Sst-expressing D-cells and could be detected in a higher percentage of cells in Gcg-expressing L-cells (Figure 1B). This indicates that probably D-cells are less able to detoxify H2S compared to L-cells, and that only a proportion of enterochromaffin cells can efficiently metabolize H2S. We then measured the expression of these genes in commonly used intestinal cell line models, including NCI-h716 and HuTu-80, respectively models for colonic GLP-1 producing cells and duodenal GLP-1/GIP producing EECs. While NCI-h716 cells expressed the three main enzymes involved in H2S metabolism like HT-29 and Caco2 colonocytes, HuTu-80 cells expressed SQR, the first enzyme involved in H2S detoxification, at much lower level (Figure 1C).
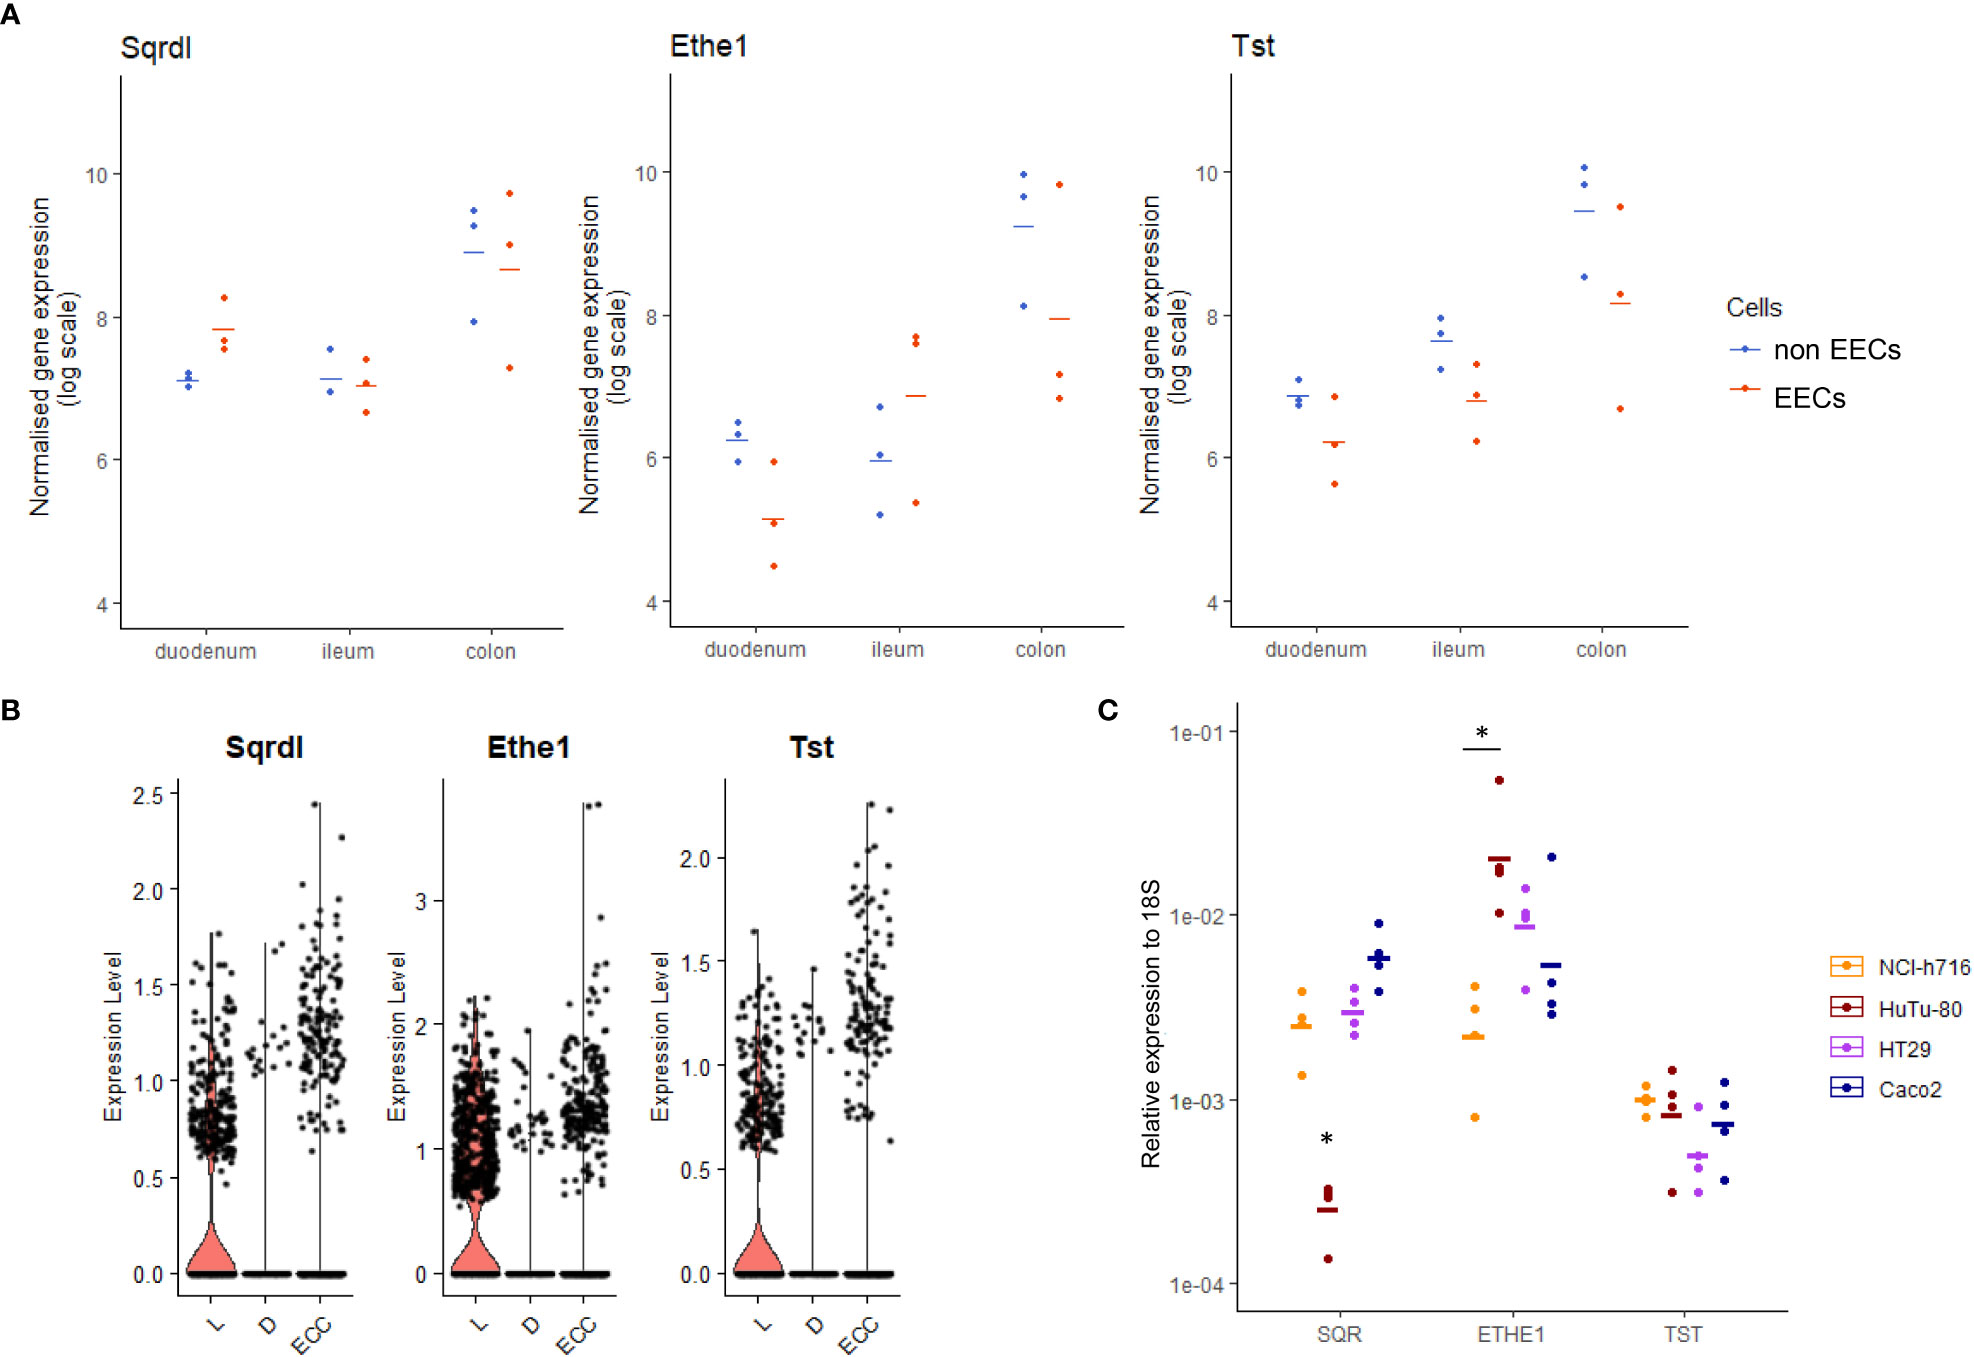
Figure 1 Expression of SOU genes in EECs. (A) Normalized expression from transcriptomics data of main three enzyme coding genes of SOU in sorted EECs (, red) and other intestinal cells (blue) in three different regions of mouse gut. (B) Normalized expression of the three genes of SOU in single cell transcriptomics data in colonic sorted EECs clustered in the three main subpopulations (L for GLP-1 producing cells, D for Somatostatin cells and ECC for enterochromaffin cells). In (A, B) sorted EECs were collected as GFP positive cells from Neurod1-cre x EYFP mice while non-EECs were GFP negative sorted cells (C) Expression of the SOU encoding genes in cell lines NCI-h716, HuTu-80, HT29 and Caco2. * indicates significant differences between two populations using a Dunn test and a confidence of 5%.
Dual responses of NCI-h716 to H2S
Respiration of NCI-h716 cell was measured by oxygen consumption in a liquid sealed chamber with no change of volume, and as with other colonocyte cell lines, the addition of a low quantities of Na2S, a rapid donor of H2S, was associated with a transient increase of oxygen consumption. This is in line with the fact that these cells are able to oxidize H2S, giving electrons to the mitochondrial electron transport chain. Increased amount of Na2S resulted in higher O2 consumption up to a threshold at which respiration was inhibited (Figure 2A). In contrast, HuTu-80 cells did not seem to be able to metabolize H2S, and addition of Na2S only resulted in the inhibition of oxidative respiration without the observed increased O2 consumption at low concentration (Figure 2B), which is consistent with a low expression of SQR.
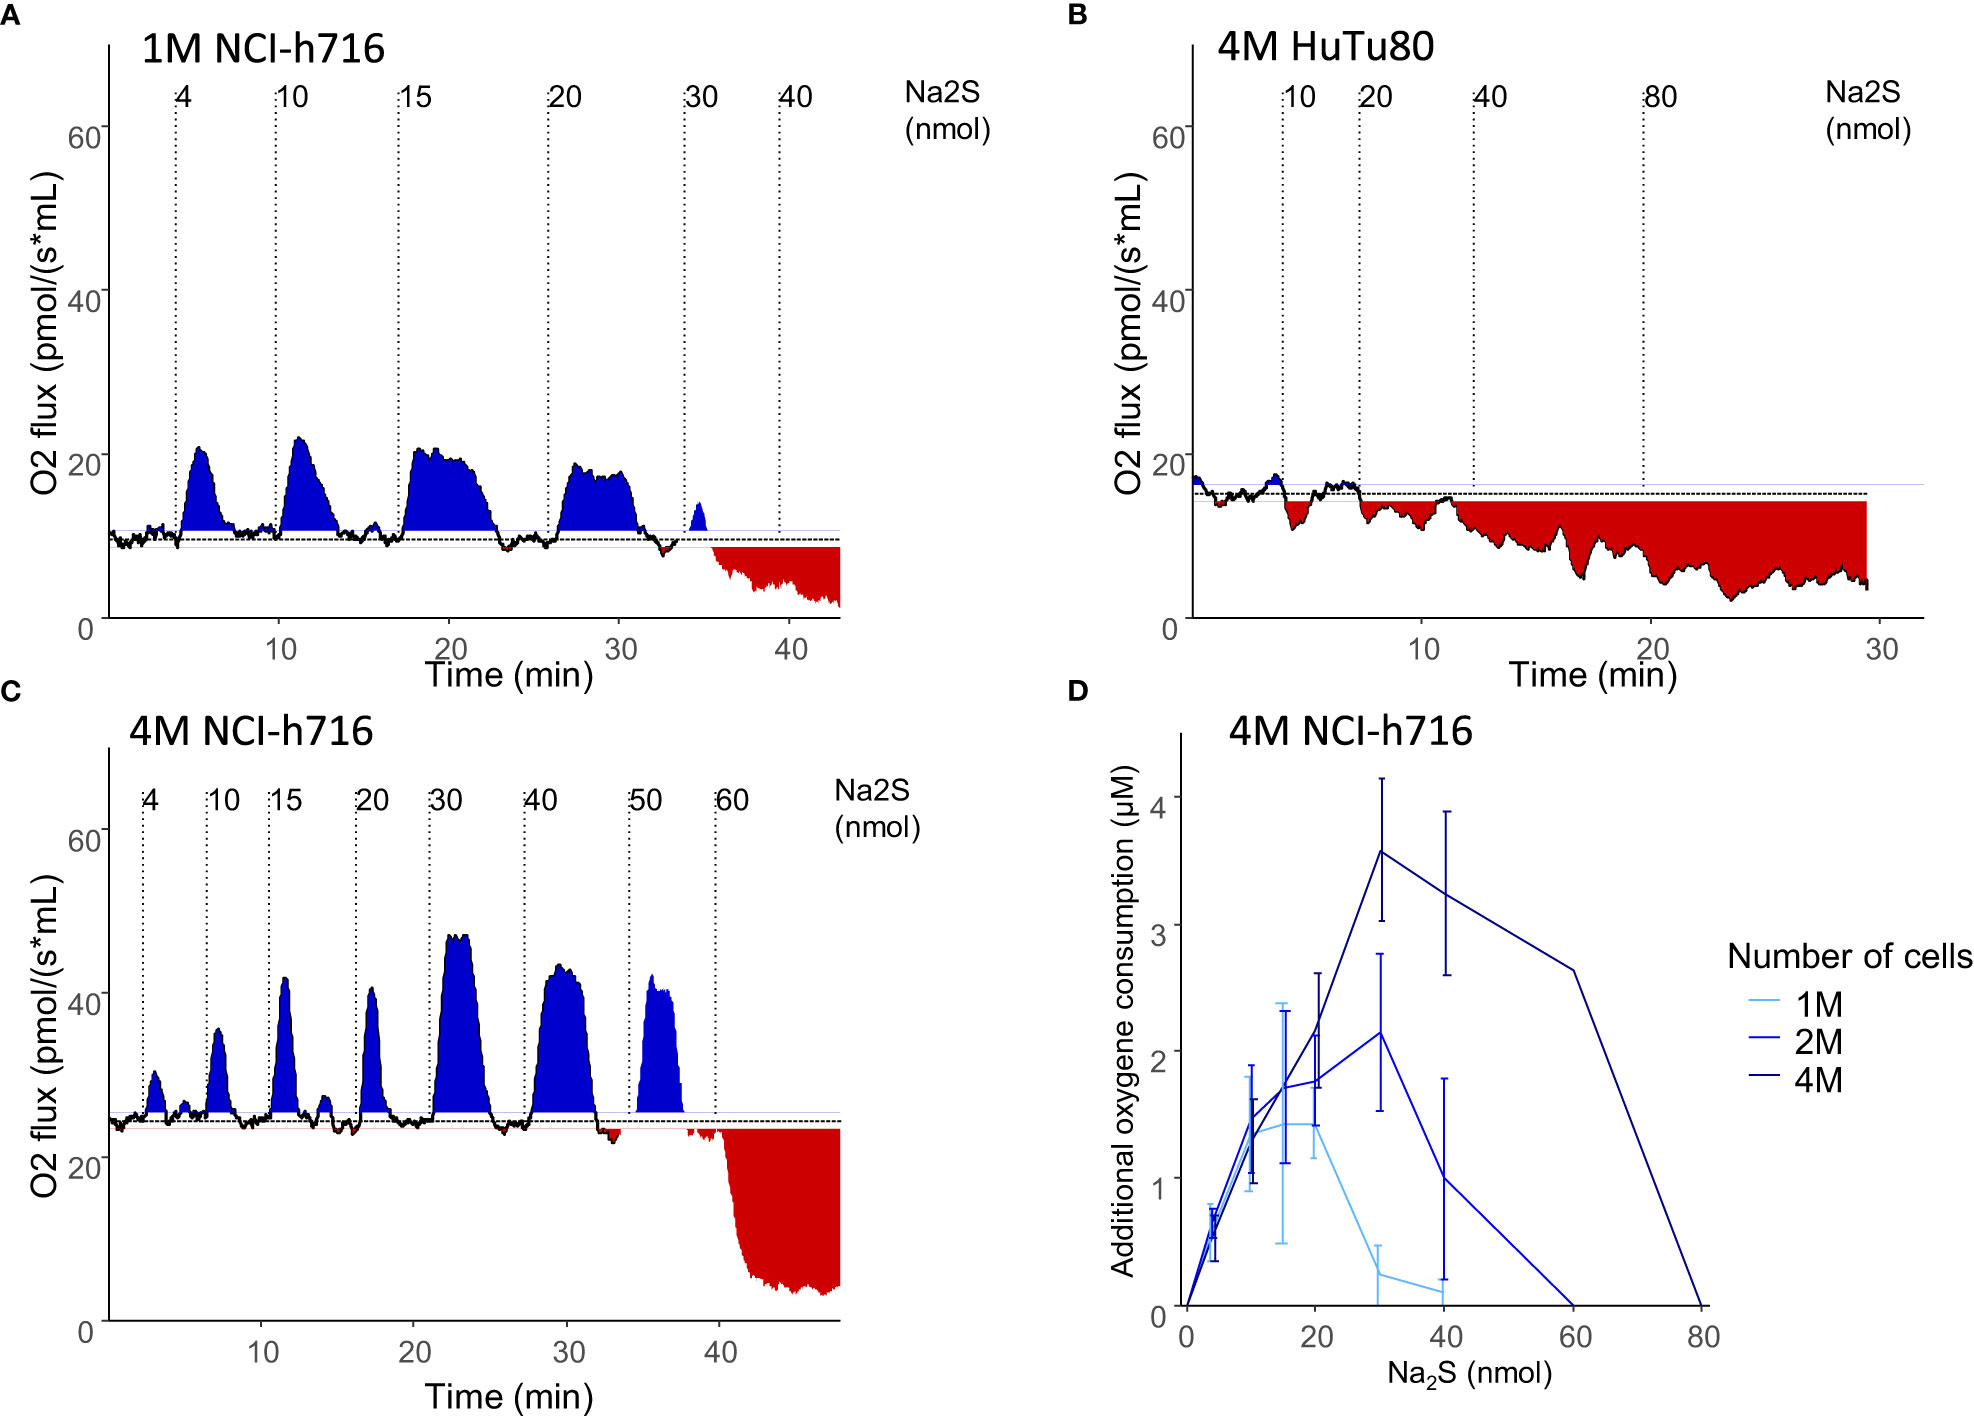
Figure 2 EEC respiration modulation by H2S. (A–C): representative oxygen consumption of different densities (2 (A) or 4 (C) million NCI-h716 cells) or cell types (4 million HuTu-80 cells (C)). Plain line represents the cell respiration over time, and the horizontal dotted line the basal respiration in the experiment. Transient additional respiration is indicated with blue surfaces while respiration inhibition colored in red. Vertical dotted lines indicates the moment different amounts of Na2S were added to the cells. (D) average additional oxygen consumption by NCI-h716 cells in response to different Na2S quantities additions (n=3-6).
Interestingly, increasing cell number increased the quantity threshold at which H2S inhibits cell respiration. This suggests that the rate of H2S oxidation per cell is the important limit to determine the threshold at which H2S poisons the cell respiration (Figures 2C, D). At low quantities, the same amount of oxygen was consumed regardless of the number of cells (Figure 2D). Once all the H2S had been metabolized, cells retrieved their basal respiration and could metabolize additional Na2S added to the media (Figure 2A). We could therefore perform successive additions of Na2S to the media without inhibiting respiration as long as the concentration of H2S in the media did not reach the threshold of inhibition.
We therefore determined a rate at which cells could be maintained with increased oxygen consumption by sequentially adding low quantities of Na2S to the media (Figure 3A). Conversely, adding the same amount of Na2S as a single bolus resulted in the inhibition of respiration (Figure 3B). Altogether, these conditions were used to maintain NCI-h716 cells at high, normal, or low respiratory rate.
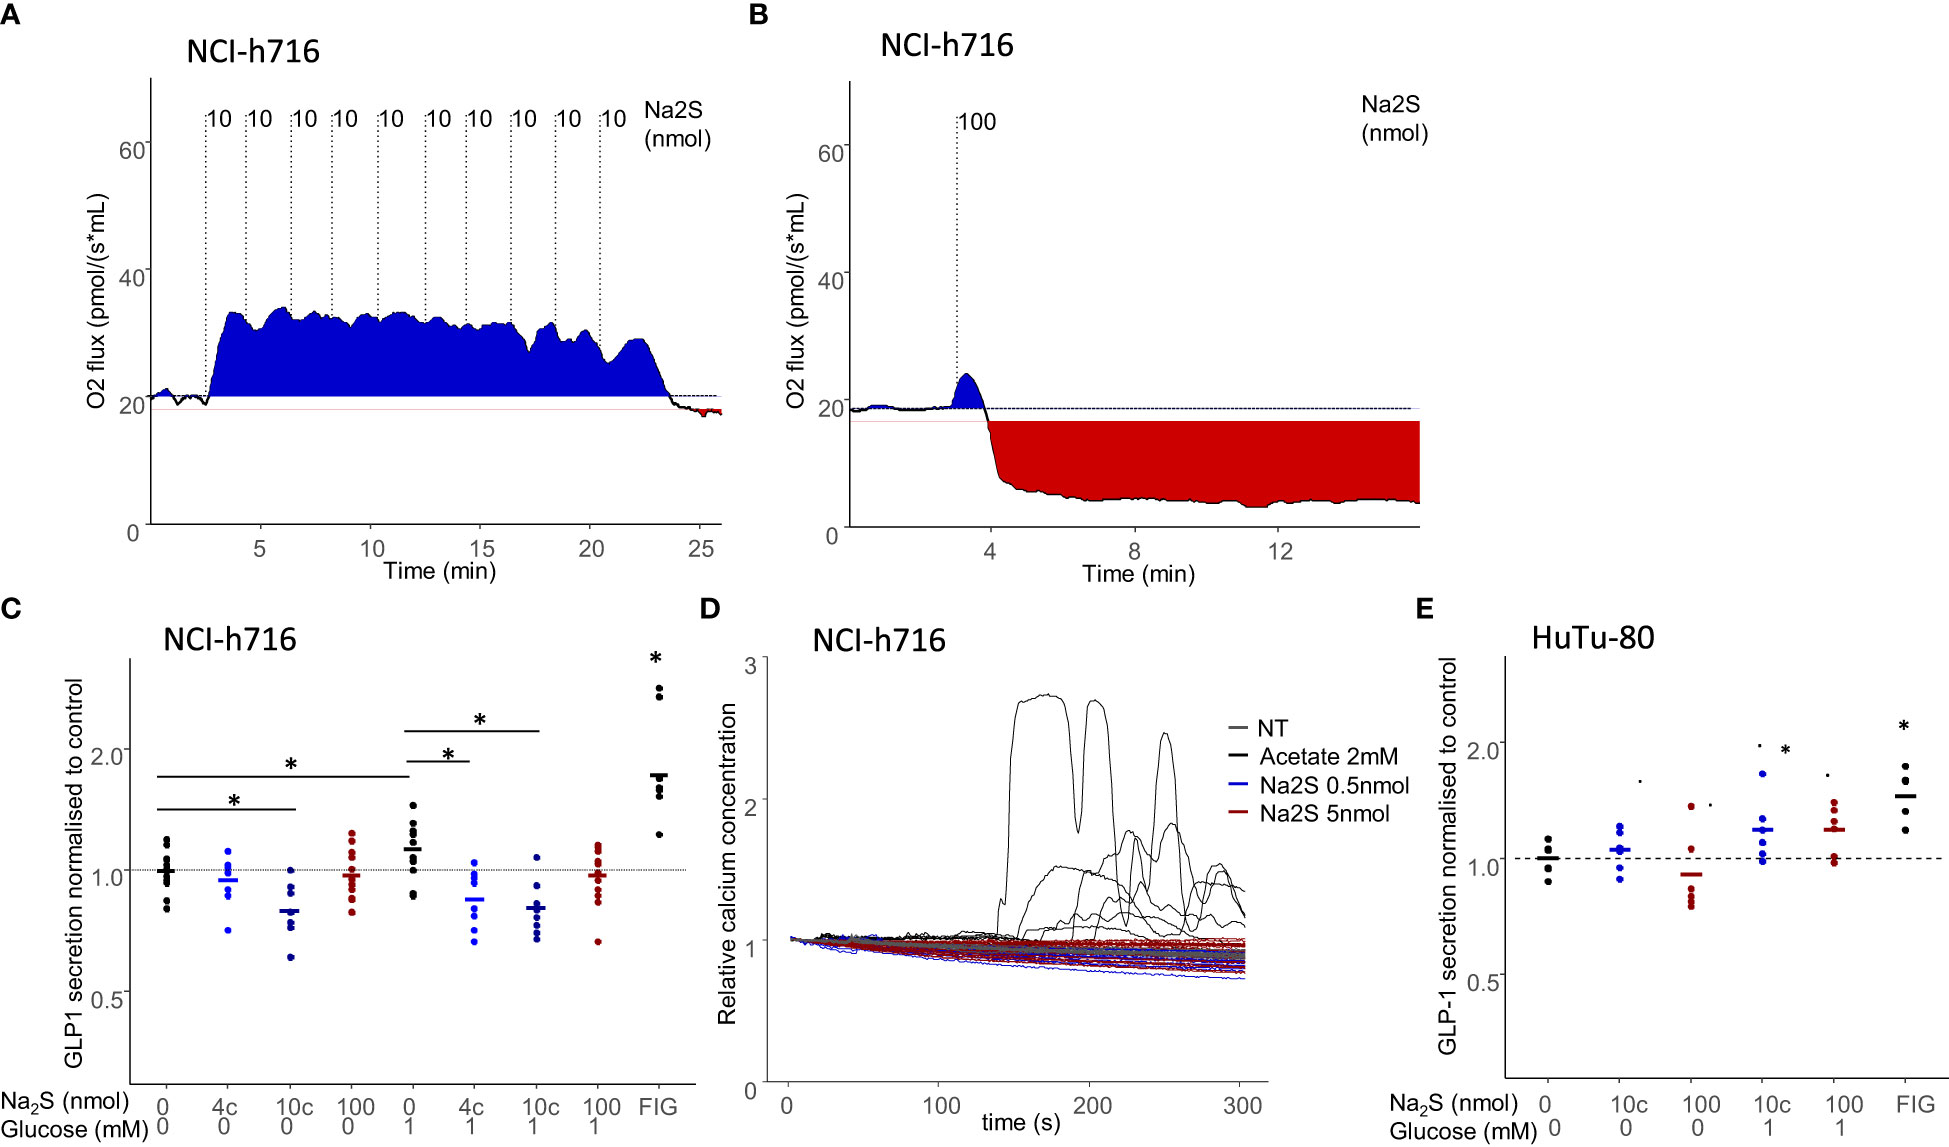
Figure 3 Effect of modulated respiration on acute GLP-1 secretion. (A, B) Respiration of 4million NCI-716 cells in response to the addition of 100nmol Na2S; either as a single bolus (B), inducing cell respiration inhibition or as 10 successive additions of 10nmol doses, resulting in sustained increased respiration. (C, E) GLP-1 secretion in NCI-h716 cells (C) or HuTu-80 cells (E) in response to Na2S addition to cell media, either as a single 100nmol injection or 10 successive injections of 4 or 10nmol (noted 4c and 10c) Na2S. 10µM Forskolin 10µM IBMX in 10mM glucose was used as a control for GLP-1 secretion. Secretion experiments were performed either in the absence of glucose or with 1mM glucose. * indicates significant differences between two populations using a Dunn test and a confidence of 5%. (D) Calcium response to addition of 0.5 nmol and 5 nmol of Na2S in 100µL of media of NCI-h716 cells expressing a Gcamp-5G calcium probe. Acetate 2mM is used as control for calcium response.
Effect of sustained increased or decreased oxygen consumption on GLP-1 secretion
We then asked if the modifications of EEC respiration could have an impact on acute GLP-1 secretion. We considered these conditions both in cells deprived of glucose, and therefore mostly depending on utilization of endogenous oxidative substrates for energy production, or with a low glucose concentration in which glycolysis could provide in addition cytosolic ATP in low amounts. Surprisingly, we observed that oxidative respiration inhibition (with 100nmol of Na2S) had no acute effect on GLP-1 secretion, whereas increased oxidative respiration was associated with a slight but significant GLP-1 secretion decrease (Figure 3C). This decreased secretion was independent of the presence of glucose. We therefore concluded that in the short term, inhibiting oxidative respiration did not alter the secretory activity of the cells, whereas increased oxygen consumption was associated with a slight decreased GLP-1 secretion. Interestingly, this effect was not associated with a detectable change in calcium signaling in these cells, confirming that low concentration of Na2S did not induce an important response in these cells (Figure 3D). In HuTu80 cells, the low concentration of Na2S, which does not increase the respiration within these cells, did not change GLP-1 secretion, nor the higher dose (Figure 3E).
Discussion
Distal but not proximal EECs express the machinery to detoxify H2S. Here, using a cell line model of human colonic L-cells, namely the NCI-h716 cell line, we showed that similar to colonocytes (14), they respond in a dual manner to H2S with low concentrations increasing oxygen consumption while higher concentrations inhibit it. We determined a threshold of H2S poisoning capacity per cell that we estimated at about 15 nmol of H2S per million NCI-h716 cells.
The concentrations we used here were much lower than those used in previous studies studying GLP-1 secretion in response to H2S (7, 8). It is therefore likely that oxidative respiration was inhibited in these studies. Luminal H2S concentration in the human large intestine may reach millimolar levels (26), but is dependent on the dietary conditions and microbial composition and metabolic activity, resulting in high variability of H2S fecal concentration measurements between individuals (27). Most of the luminal sulfide is presumably bound to compounds present in the intestinal content or in form of gaz (28), with micromolar concentrations of free solubilized sulfide being estimated to be likely in contact with cells at the surface of the epithelium that can rapidly be metabolized by colonocytes.
H2S could therefore act as a short term signal to regulate epithelial cell energy metabolism as its effect are reversible, but the importance of this regulation on different intestinal epithelial cell functions remain to be clearly established (11).
In this study, we show that EECs can discard hydrogen sulfide, and by doing so, can use this bacterial metabolite as a substrate for oxidative respiration and thus presumably to produce energy in the form of ATP. To our knowledge, the consequences of a modulation of the metabolic status of EEC remain unclear, even if it can be hypothesized that the energy status in hormone-secreting cells may affect the stimulus-secretion coupling, as observed in other endocrine cells, namely pancreatic beta cells (29). However, in these latter cells, it has been shown that insulin secretion provoked by D-glucose can be further enhanced independently of a modification of the cellular energy status (30) pointing out that numerous mechanisms of action are involved in the process of insulin secretion.
Here we show that in the short term, the inhibition of mitochondria respiration in EECs had no impact on hormone secretion while increased respiration was associated with a slight reduction of GLP-1 secretion. Similar doses of hydrogen sulfide on cells that did not respond through increased respiration had no effect on secretion, pointing towards an association between increased respiration and a small decrease in GLP-1 secretion. As our experiments were limited to the first 15 minutes during mitochondria respiration alteration due to our experimental conditions, we have no information on the long-term effects of change in the metabolic state of the cell on gut hormone production and/or secretion or a possible shift in EEC energy metabolism. The decrease of gut hormone secretion correlated to higher energy production can seem a paradox as these hormones are mostly secreted in response to energy intake to regulate host metabolism, however the role of distal hormones on these functions are not clear. Many distal hormones also modulate intestinal functions, and hormones co-secreted with GLP-1 such as GLP-2 and PYY regulate respectively epithelial proliferation and electrolyte balance and intestinal transit. A reduced secretion can therefore limit the nutrient absorption capacity in the distal gut.
With these reservations in mind, the results of the present study are compatible with the view that colonic enteroendocrine cells, which are facing changing luminal H2S concentrations like colonocytes, are equipped with the enzymatic machinery involved in sulfide disposal. However, in the short term, both effects of low and higher concentrations of H2S on mitochondrial energy metabolism do not appear to represent crucial modulators of hormone secretion.
Data availability statement
The raw data supporting the conclusions of this article will be made available by the authors, without undue reservation.
Author contributions
PL, MA, and FB conceived the project and designed the experiments, KH, CF, PL, and MA performed the experiments and data analysis, PL produced the final analysis of all data and wrote the first draft. All authors contributed to manuscript revision, read, and approved the submitted version.
Funding
This project was funded by AgroParisTech (Fond d’amorçage), and an award supported by EFSD/NovoNordisk (Rising Star 2020).
Conflict of interest
The authors declare that the research was conducted in the absence of any commercial or financial relationships that could be construed as a potential conflict of interest.
Publisher’s note
All claims expressed in this article are solely those of the authors and do not necessarily represent those of their affiliated organizations, or those of the publisher, the editors and the reviewers. Any product that may be evaluated in this article, or claim that may be made by its manufacturer, is not guaranteed or endorsed by the publisher.
References
1. Gribble FM, Reimann F. Function and mechanisms of enteroendocrine cells and gut hormones in metabolism. Nat Rev Endocrinol (2019) 15(4):226–37. doi: 10.1038/s41574-019-0168-8
2. Billing LJLJ, Larraufie P, Lewis JJ, Leiter A, Li J, Lam B, et al. Single cell transcriptomic profiling of large intestinal enteroendocrine cells in mice – identification of selective stimuli for insulin-like peptide-5 and glucagon-like peptide-1 co-expressing cells. Mol Metab (2019) 29:158–69. doi: 10.1016/j.molmet.2019.09.001
3. Beumer J, Artegiani B, Post Y, Reimann F, Gribble F, Nguyen TN, et al. Enteroendocrine cells switch hormone expression along the crypt-to-villus BMP signalling gradient. Nat Cell Biol (2018) 20(8):909–16. doi: 10.1038/s41556-018-0143-y
4. Panaro BL, Yusta B, Matthews D, Koehler JA, Song Y, Sandoval DA, et al. Intestine-selective reduction of gcg expression reveals the importance of the distal gut for GLP-1 secretion. Mol Metab (2020) 37:100990. doi: 10.1016/j.molmet.2020.100990
5. Arora T, Vanslette AM, Hjorth SA, Bä Ckhed F. Microbial regulation of enteroendocrine cells. Med (2021) 2:553–70. doi: 10.1016/j.medj.2021.03.018
6. Cao X, Ding L, Xie ZZ, Yang Y, Whiteman M, Moore PK, et al. A review of hydrogen sulfide synthesis, metabolism, and measurement: is modulation of hydrogen sulfide a novel therapeutic for cancer? Antioxidants Redox Signaling (2019) 31:1. doi: 10.1089/ars.2017.7058
7. Bala V, Rajagopal S, Kumar DP, Nalli AD, Mahavadi S, Sanyal AJ, et al. Release of GLP-1 and PYY in response to the activation of G protein-coupled bile acid receptor TGR5 is mediated by Epac/PLC-ε pathway and modulated by endogenous H2S. Front Physiol (2014) 5(Nov):420. doi: 10.3389/fphys.2014.00420
8. Pichette J, Fynn-Sackey N, Gagnon J. Hydrogen sulfide and sulfate prebiotic stimulates the secretion of GLP-1 and improves glycemia in Male mice. Endocrinology (2017) 158(10):3416–25. doi: 10.1210/en.2017-00391
9. Slade E, Williams L, Gagnon J. Hydrogen sulfide suppresses ghrelin secretion in vitro and delays postprandial ghrelin secretion while reducing appetite in mice. Physiol Rep (2018) 6(19):e13870. doi: 10.14814/phy2.13870
10. Mustafa AK, Gadalla MM, Sen N, Kim S, Mu W, Gazi SK, et al. HS signals through protein s-sulfhydration. Sci Signal (2009) 2(96):ra72. doi: 10.1126/scisignal.2000464
11. Blachier F, Andriamihaja M, Larraufie P, Ahn E, Lan A, Kim E. Production of hydrogen sulfide by the intestinal microbiota and epithelial cells and consequences for the colonic and rectal mucosa. Am J Physiol - Gastrointest Liver Physiol (2021) 320(2):G125–35. doi: 10.1152/ajpgi.00261.2020
12. Libiad M, Vitvitsky V, Bostelaar T, Bak DW, Lee HJ, Sakamoto N, et al. Hydrogen sulfide perturbs mitochondrial bioenergetics and triggers metabolic reprogramming in colon cells. J Biol Chem (2019) 294(32):12077–90. doi: 10.1074/jbc.RA119.009442
13. Hildebrandt TM, Grieshaber MK. Three enzymatic activities catalyze the oxidation of sulfide to thiosulfate in mammalian and invertebrate mitochondria. FEBS J (2008) 275(13):3352–61. doi: 10.1111/j.1742-4658.2008.06482.x
14. Beaumont M, Andriamihaja M, Lan A, Khodorova N, Audebert M, Blouin JM, et al. Detrimental effects for colonocytes of an increased exposure to luminal hydrogen sulfide: the adaptive response. Free Radic Biol Med (2016) 93:155–64. doi: 10.1016/j.freeradbiomed.2016.01.028
15. Mimoun S, Andriamihaja M, Chaumontet C, Atanasiu C, Benamouzig R, Blouin JM, et al. Detoxification of H2S by differentiated colonic epithelial cells: implication of the sulfide oxidizing unit and of the cell respiratory capacity. Antioxid Redox Signal (2012) 17:1–10. doi: 10.1089/ars.2011.4186
16. Goubern M, Andriamihaja M, Nübel T, Blachier F, Bouillaud F. Sulfide, the first inorganic substrate for human cells. FASEB J (2007) 21(8):1699–706. doi: 10.1096/fj.06-7407com
17. Bouillaud F, Blachier F. Mitochondria and sulfide: a very old story of poisoning, feeding, and signaling? Antioxid Redox Signal (2011) 15(2):379–91. doi: 10.1089/ars.2010.3678
18. Cooper CE, Brown GC. The inhibition of mitochondrial cytochrome oxidase by the gases carbon monoxide, nitric oxide, hydrogen cyanide and hydrogen sulfide: chemical mechanism and physiological significance. J Bioenerg Biomembr (2008) 40(5):533–9. doi: 10.1007/s10863-008-9166-6
19. Leschelle X, Goubern M, Andriamihaja M, Blottière HM, Couplan E, Gonzalez-Barroso MDM, et al. Adaptative metabolic response of human colonic epithelial cells to the adverse effects of the luminal compound sulfide. Biochim Biophys Acta (2005) 1725(2):201–12. doi: 10.1016/j.bbagen.2005.06.002
20. Lagoutte E, Mimoun S, Andriamihaja M, Chaumontet C, Blachier F, Bouillaud F. Oxidation of hydrogen sulfide remains a priority in mammalian cells and causes reverse electron transfer in colonocytes. Biochim Biophys Acta (2010) 1797(8):1500–11. doi: 10.1016/j.bbabio.2010.04.004
21. Li HJ, Kapoor A, Giel-Moloney M, Rindi G, Leiter AB. Notch signaling differentially regulates the cell fate of early endocrine precursor cells and their maturing descendants in the mouse pancreas and intestine. Dev Biol (2012) 371(2):156–69. doi: 10.1016/j.ydbio.2012.08.023
22. Roberts GP, Larraufie P, Richards P, Kay RG, Galvin SG, Miedzybrodzka EL, et al. Comparison of human and murine enteroendocrine cells by transcriptomic and peptidomic profiling. Diabetes (2019) 68(5):1062–72. doi: 10.2337/db18-0883
23. Love MI, Huber W, Anders S. Moderated estimation of fold change and dispersion for RNA-seq data with DESeq2. Genome Biol (2014) 15(12):550. doi: 10.1186/s13059-014-0550-8
24. Butler A, Hoffman P, Smibert P, Papalexi E, Satija R. Integrating single-cell transcriptomic data across different conditions, technologies, and species. Nat Biotechnol (2018) 36(5):411–20. doi: 10.1038/nbt.4096
25. Akerboom J, Chen T-W, Wardill TJ, Tian L, Marvin JS, Mutlu S, et al. Optimization of a GCaMP calcium indicator for neural activity imaging. J Neurosci (2012) 32(40):13819–40. doi: 10.1523/JNEUROSCI.2601-12.2012
26. Macfarlane GT, Gibson GR, Beatty E, Cummings JH. Estimation of short-chain fatty acid production from protein by human intestinal bacteria based on branched-chain fatty acid measurements. FEMS Microbiol Lett (1992) 101(2):81–8. doi: 10.1111/j.1574-6968.1992.tb05764.x
27. Magee EA, Richardson CJ, Hughes R, Cummings JH. Contribution of dietary protein to sulfide production in the large intestine: an in vitro and a controlled feeding study in humans. Am J Clin Nutr (2000) 72(6):1488–94. doi: 10.1093/ajcn/72.6.1488
28. Blachier F, Davila AM, Mimoun S, Benetti PH, Atanasiu C, Andriamihaja M, et al. Luminal sulfide and large intestine mucosa: friend or foe? Amino Acids (2010) 39(2):335–47. doi: 10.1007/s00726-009-0445-2
29. Malaisse WJ, Best L, Kawazu S, Malaisse-Lagae F, Sener A. The stimulus-secretion coupling of glucose-induced insulin release: fuel metabolism in islets deprived of exogenous nutrient. Arch Biochem Biophys (1983) 224(1):102–10. doi: 10.1016/0003-9861(83)90193-5
Keywords: enteroendocrine cells, GLP-1, cell respiration, hormone secretion, hydrogen sulfide
Citation: Larraufie P, Haroun K, Fleury C, Andriamihaja M and Blachier F (2023) Regulation of enteroendocrine cell respiration by the microbial metabolite hydrogen sulfide. Front. Endocrinol. 14:1123364. doi: 10.3389/fendo.2023.1123364
Received: 13 December 2022; Accepted: 12 April 2023;
Published: 09 May 2023.
Edited by:
Guilherme Zweig Rocha, State University of Campinas, BrazilReviewed by:
Frank Duca, University of Arizona, United StatesMilos R. Filipovic, Technical University of Dortmund, Germany
Copyright © 2023 Larraufie, Haroun, Fleury, Andriamihaja and Blachier. This is an open-access article distributed under the terms of the Creative Commons Attribution License (CC BY). The use, distribution or reproduction in other forums is permitted, provided the original author(s) and the copyright owner(s) are credited and that the original publication in this journal is cited, in accordance with accepted academic practice. No use, distribution or reproduction is permitted which does not comply with these terms.
*Correspondence: Pierre Larraufie, cGllcnJlLmxhcnJhdWZpZUBpbnJhZS5mcg==
‡ORCID: Pierre Laraufie, orcid.org/0000-0001-7718-6200
Kenza Haroun, orcid.org/0000-0002-3540-4262
Carla Fleury, orcid.org/0000-0001-9154-4158
Mireille Andriamihaja, orcid.org/0000-0001-6322-187X
François Blachier, orcid.org/0000-0002-8501-0990