
95% of researchers rate our articles as excellent or good
Learn more about the work of our research integrity team to safeguard the quality of each article we publish.
Find out more
ORIGINAL RESEARCH article
Front. Endocrinol. , 23 March 2023
Sec. Bone Research
Volume 14 - 2023 | https://doi.org/10.3389/fendo.2023.1117438
This article is part of the Research Topic Imaging of Adipose Tissue in Bone and Muscle: Implications for Osteoporosis, Sarcopenia and Frailty View all 11 articles
 Chen Fu1†
 Dong Yan2†
 Ling Wang2Fangfang Duan3Dalong Gu2Ning Yao2Mingke Sun2Di Wang1Xuya Lin1
 Yanglei Wu4Xiaofei Wang1
 Xiaoguang Cheng2*‡Dongliang Zhang1*‡
Background and purpose: Sarcopenia is highly prevalent (28.5–40.3%) in patients undergoing hemodialysis and leads to poor clinical outcomes. However, the association between muscle quality and sarcopenia in patients receiving hemodialysis remains unclear. Therefore, we aimed to explore the association between muscle cross-sectional area (CSA) and proton-density fat-fraction (PDFF) in patients with sarcopenia undergoing hemodialysis.
Methods: Seventy-six patients undergoing hemodialysis for > 3 months were enrolled. Their handgrip strength (HGS), short physical performance battery (SPPB) performance, and appendicular skeletal muscle mass index (ASMI) were measured. Sarcopenia was defined using the Asian Working Group for Sarcopenia 2019 consensus update. All patients underwent quantitative magnetic resonance imaging. CSA and PDFF were measured for the thigh, trunk, and gluteus muscles.
Results: The prevalence of probable, confirmed, and severe sarcopenia in this study was 73.7%, 51.3%, and 22.4%, respectively. Older age (OR: 1.061, P < 0.003); lower body mass index (BMI) (OR: 0.837, P = 0.008), albumin (OR: 0.765, P = 0.004), prealbumin (OR: 0.987, P = 0.001), predialysis blood urea nitrogen (BUN) (OR: 0.842, P < 0.001), predialysis creatinine (OR: 0.993, P < 0.001), phosphorus (OR: 0.396, P = 0.047); lower CSA of the thigh (OR: 0.58, P = 0.035), third lumbar (L3) trunk (OR: 0.37, P = 0.004), gluteus minimus and medius (OR: 0.28, P = 0.001), and gluteus maximus (OR: 0.28, P= 0.001); and higher PDFF of the thigh (OR: 1.89, P = 0.036) and L3 trunk (OR: 1.71, P = 0.040) were identified as sarcopenia risk factors. The gluteus minimus and medius CSA was lower in patients with sarcopenia than in those without after adjusting for age and BMI (OR: 0.37, P = 0.017). Higher thigh (P = 0.031) and L3 trunk (P = 0.006) muscle PDFF were significantly associated with lower HGS. Furthermore, higher thigh (P = 0.011) and L3 trunk (P = 0.010) muscle PDFF were also inversely correlated with lower ASMI.
Conclusion: Our findings demonstrate the high prevalence of sarcopenia and myosteatosis in patients undergoing hemodialysis and might trigger a paradigm shift in intervention strategies for patients receiving hemodialysis.
Sarcopenia is characterized by a gradual decline in physical performance, strength, and skeletal muscle mass (1, 2). It has a prevalence of between 28.5% and 40.3% in patients receiving hemodialysis (3–7) and results in poor clinical outcomes (7–9). The complex pathophysiology of sarcopenia may be exacerbated by metabolic acidosis, oxidative stress, accumulated uremic toxins, inflammation, insulin resistance, malnutrition, protein restriction, decreased appetite, myostatin overexpression, ubiquitination, and physical inactivity (10). Therefore, sarcopenia is a major problem in patients undergoing hemodialysis.
Skeletal muscle mass is the largest component of human free adipose tissue (11). Muscle quality refers to both micro- and macroscopic changes in muscle architecture and composition, and to the amount of function delivered per unit mass of muscle (12). The loss of skeletal muscle mass is one criterion for sarcopenia (1). Moreover, despite the minimal loss in skeletal muscle mass, skeletal muscle function can be drastically reduced with aging (13). This discrepancy may be partially caused by fatty infiltration, which is an aspect of muscle quality. Most studies on sarcopenia in patients undergoing hemodialysis have measured muscle mass using bioelectrical impedance analysis (BIA) (5, 8). However, while BIA is an easy and inexpensive method, it cannot distinguish fat in muscle individually and can therefore not be used to measure muscle fat infiltration (14), usually known as muscle quality. Therefore, whether muscle fat infiltration, namely myosteatosis, exists in patients undergoing hemodialysis remains unclear. Computerized tomography (CT) is an imaging modality that evaluates fat indirectly based on X-ray attenuation (15, 16). However, as CT attenuation values are affected by a variety of factors, including iron, copper, glycogen, fibrosis, and edema, fat quantification is bound to be inaccurate (15). CT scanners manufactured by different vendors demonstrate inherent variations in attenuation values (17). This variability can lead to a platform dependent measurement of fat content, and is thus an important limitation of CT. What is more, participants are exposed to radiation during measurements.
Previous studies (18, 19) suggest that assessing muscle quantity is more important than quantifying muscle mass in the general population. Muscle quantity can be assessed by measuring proton-density fat-fraction (PDFF) using the multi-echo Dixon technique. Recently, assessing fat and water contents has become possible in various body parts through an advanced chemical shift encoding-based water-fat separate magnetic resonance imaging (MRI) approach without invasive quantitative methods (20–22). As a reliable method for quantifying muscle fat infiltration, this method is similar to MR spectroscopy (the “gold” standard) (23, 24); furthermore, the reproducibility of findings produced with this method is high (25).This indicates that PDFFs calculated using the multi-echo Dixon technique accurately reflect fat content.
Typical anatomical locations for skeletal muscle measurements based on computed tomography (CT) are the thigh, hip, and trunk. Additionally, the size and density of the abdominal and thigh muscle bundles are well-established parameters used in cancer studies (26). However, no studies are available on how these muscles contribute to strength and physical performance in patients receiving hemodialysis. Furthermore, no literature has been published on sarcopenia associated with intramuscular adipose tissue in patients undergoing hemodialysis.
Therefore, this study aimed to identify the prevalence of sarcopenia and myosteatosis in patients undergoing hemodialysis and to explore associations among muscle CSA, myosteatosis, and muscle function. We also aimed to identify the clinical and imaging risk factors for sarcopenia in patients undergoing hemodialysis.
This study was conducted from February 2022 to September 2022. Seventy-six patients undergoing hemodialysis at Beijing Jishuitan Hospital were included. Patients were eligible for inclusion if they were > 18 years of age, had undergone hemodialysis for at least 3 months, three times weekly, on Mondays, Wednesdays, and Fridays, or Tuesdays, Thursdays, and Saturdays, with each session lasting for 3.5–4 h. Exclusion criteria included cognitive or physical disabilities that prevented full participation (e.g., mental retardation, blindness, use of a wheelchair, hand disability, amputated limbs); comorbid medical conditions (e.g., malignant tumors, active inflammatory diseases, pregnancy) or muscular, neuromuscular, or neurologic disorders (e.g., Alzheimer’s or Parkinson’s disease); or antipsychotic medication and corticosteroids use.
This study was conducted in accordance with the principles of the Declaration of Helsinki. The study protocol was reviewed and approved by the Beijing Jishuitan Hospital Ethics Committee (approval number: 202112-11-01). All participants or their legal representatives provided written informed consent. The analyses presented here were based on baseline data taken from a larger, registered trial that can be assessed here: ClinicalTrialsRegistry.gov (NCT05242055).
The following clinical variables were recorded: age, sex, cause of renal disease, and dialysis vintage. Anthropometric variables recorded were height, post-dialysis weight, and BMI (dry weight (kg)/height (m)²). The following biological variables were recorded: hemoglobin, serum albumin (bromocresol green method), prealbumin, predialysis blood urea nitrogen (BUN), predialysis creatinine, serum phosphorus, serum bicarbonate, highly sensitive C-reactive protein (hs-CRP; by nephelometry), and dialysis efficacy (Kt/V urea; serum urea was assessed before and after dialysis sessions to calculate urea Kt/V according to the formula of Daugirdas (27)). Laboratory measurements were performed immediately before initiating the Monday or Tuesday hemodialysis session, which was scheduled exactly 68 h after the previous session (i.e., Friday or Saturday). Blood samples were obtained from the central venous catheter, arteriovenous fistula, or graft.
Muscle mass was measured using dual-energy X-ray absorptiometry (DXA) (28). Each patient underwent whole-body DXA scanning (GE Lunar Corp, Madison, WI, USA; software version enCORE-17) at 20–24 h after completing the dialysis session (4). Appendicular skeletal mass (ASM) was calculated as the sum of lean soft tissue from the arms and legs (29). ASM/height2 (kg/m2) was calculated as the relative ASMI. The Asian Working Group for Sarcopenia (AGWS) 2019 criteria for low muscle mass (low ASMI) in sarcopenia diagnosis are as follows: < 7.0 kg/m2 and < 5.4 kg/m2 in men and women, respectively (1).
Muscle strength was assessed based on handgrip strength (HGS) using a Jamar J00105 hydraulic handheld dynamometer. More precisely, HGS was measured in each hand alternately before and after hemodialysis. First, the patient’s arms were placed on armrests while they sat upright in a chair. Next, the elbow of the arm holding the dynamometer was bent at 90° against the patient’s side.
Subsequently, patients were instructed to squeeze the dynamometer’s handle as hard as possible for approximately 3 seconds (30). The highest values of the four trials were recorded. Reduced muscle strength was defined as an HGS measurement of < 28 kg in men and < 18 kg in women (1).
Muscle function was assessed using five-times chair stand time and the SPPB (short physical performance battery), while physical performance was measured the day before the start of the dialysis session. The SPPB assesses lower-body function, including strength, balance, and mobility (31). The SPPB comprises three subtests: five-times repeated chair sit-to-stand [STS time], gait speed [GS], and balance. The balance subtest consisted of three parts, with increasing difficulty levels: unaided feet-together stand, semi-tandem stand, and full-tandem stand. The patients were timed until they moved for 10 seconds. GS was assessed while patients walked 4 meters at their usual pace, with a stationary start. The average time of the two trials was recorded. Patients were asked to fold their arms across their chest and perform five chair stands as quickly as possible to assess their STS time. There were three subtests, each with a score between 0 and 4, and a total score ranging from 0 to 12. Higher SPPB scores indicate better physical function (7). The AWGS 2019 recommends an SPPB total score ≤9 or a five-time STS ≥ 12 seconds as the cut-off for low physical performance (1).
AWGS 19 criteria were adopted for diagnosing sarcopenia (1). First, possible sarcopenia is defined as reduced muscle strength or poor muscle function. Confirmed sarcopenia is defined as reduced low muscle mass and poor muscle function (low STS or SPPB) or low muscle strength. Lastly, severe sarcopenia is characterized by low muscle mass, low strength, and poor muscle function. Supplementary File S1 shows the details of this classification.
On the same day as the DXA examination, the participants underwent a multi-echo 3D spoiled gradient-echo sequence (q-Dixon) for fat fraction quantification using a 3.0-T MRI system (MAGNETOM VIDA, Siemens Healthcare GmbH, Erlangen, Germany). The MRI scanning protocol for participants included axial 2-pt and 6-point (q-Dixon) Dixon scanning of the lumbar spine and thigh. Two-point Dixon scanning was used to obtain a high-resolution anatomical structure, while the q-Dixon scan generated a water image, fat image, T2* map, and PDFF. The total scan time for each patient was 116 seconds. Supplementary File S2 summarizes the MRI protocols.
The CSA and fat content of the thigh muscles, trunk muscle at the L3 level, gluteus minimus/medius muscle (G. Med/MinM), and gluteus maximus muscle (G. MaxM) were measured. Muscle edges can be visually identified by clear cavities of fat in the muscle. Position criteria for the measurement section are as follows: A) left thigh muscles: 3 cm below the lesser trochanter; B) trunk muscle at the level of the L3 vertebral transverse process; C) left G. Med/MinM muscles at the S3 level; and D) left G.MaxM at the level of the greater trochanter of the femur (Figure 1, Supplementary File S3 show the names of all evaluated muscles).
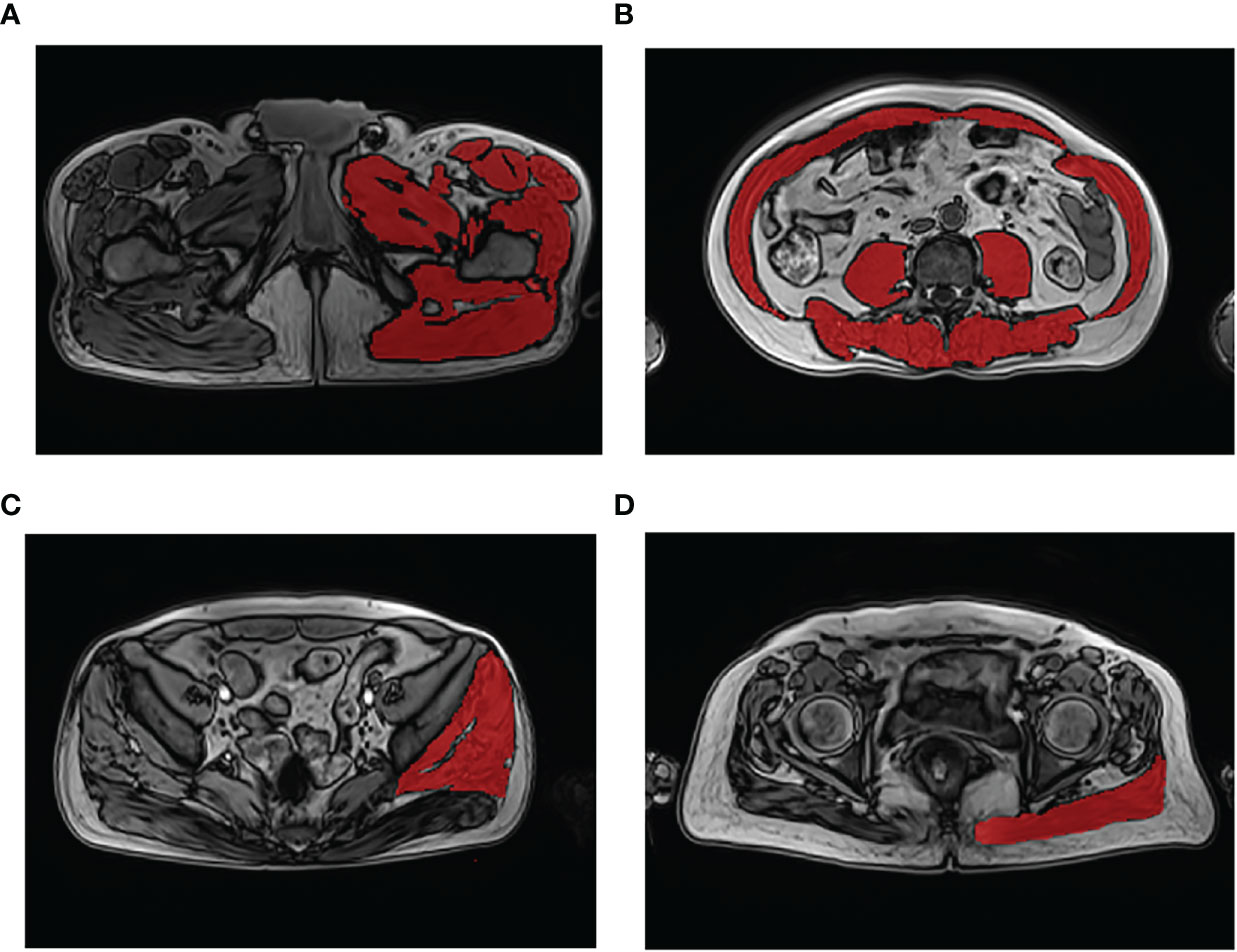
Figure 1 Demonstration of muscle segmentation. Measurement of the left thigh muscle group at the level 3 cm below the lesser trochanter (A); measurement of the trunk muscle at the level of the third lumbar vertebra transverse process (B); measurement of the left gluteus medius and minimus muscles at the third sacral (S3) level (C); measurement of the left gluteus maximus muscle at the level of the greater trochanter of the femur gluteus (D).
ITK-SNAP software (Lite version 3.8.0) (32) was used for manual segmentation of the muscle to obtain the muscle area described above. The segmentation was created by a research staff member blinded to participant outcomes. First, DICOM images of the patients were imported into the ITK-SNAP software. Second, muscle labels were measured by manually delineating the region-of-interest (ROI) on the axial T2 images to obtain the CSA value. Once drawn, a radiologist verified the label location and extent to ensure segmentation accuracy. Third, to obtain the PDFF value, the workstation automatically copied the ROI to the fat-fraction map. Finally, the CSA and PDFF of the muscles were automatically calculated using ITK-SNAP software based on measurements taken at the same level in each patient (32).
Analyses were performed using the Statistical Package for Social Sciences software (version 21.0; SPSS Inc., Chicago, IL, USA). Statistical significance was set at P < 0.05.
Statistical modelling was restricted to confirmed sarcopenia. Continuous variables are presented as either the mean ± standard deviation (SD) or the median and interquartile range. Normality was assessed using the Shapiro–Wilk normality test. Variables were compared between the sarcopenia and non-sarcopenia groups using two-sample t-tests or the Mann–Whitney U test. Categorical variables are expressed as absolute (n) and relative frequency (%). Fisher’s exact test was used to analyze categorical variables regarding the primary cause of disease. Other categorical variables were analyzed using chi-square tests. The odds ratios (ORs) and 95% confidence intervals (95% CIs) of non-sarcopenia/sarcopenia were calculated using logistic regression models with and without adjustments for the potential risk factors, with CSA and PDFF levels fitted as continuous variables and results expressed in per-SD increase. Furthermore, the contribution of CSA and PDFF to skeletal muscle mass, strength, and muscle function, with and without adjustments for age, BMI, albumin, predialysis BUN, predialysis creatinine, and phosphorus, was estimated through multivariate linear regression.
Among the 76 patients on maintenance hemodialysis, 56 (73.7%), 39 (51.3%), and 17 (22.4%) had probable, confirmed, and severe sarcopenia, respectively, according to the AWGS definition. Table 1 summarizes the baseline characteristics of the 76 patients undergoing hemodialysis. Mean age was 61.8 ± 14.35 years, and 51 (67.1%) participants were male. The causes of end-stage kidney disease included diabetes mellitus (36.8%), chronic glomerulonephritis (22.4%), hypertension nephrosclerosis (25%), and other nephropathies (15.7%). A low ASMI, low HSG, slow five-time STS, and low SPPB scores were observed in 64.5%, 48.7%, 50%, and 60.5% of all patients, respectively.

Table 1 Characteristics of the hemodialysis patients in the sarcopenia and the non-sarcopenia group.
Table 1 shows differences in hemodialysis status between the patients with sarcopenia and those without. Patients with sarcopenia were older (P < 0.001); had a lower BMI (P = 0.005), weight (P = 0.001), height (P = 0.048), ASM (P < 0.001), ASMI (P < 0.001), HGS (P < 0.001), SPPB score (P < 0.001), albumin (P = 0.001), prealbumin (P = 0.001), predialysis BUN (P < 0.001), predialysis creatinine (P < 0.001), phosphorus (P = 0.042), thigh muscle CSA (P = 0.028), L3 trunk muscle CSA (P = 0.015), G. Med/MinM CSA (P < 0.001), and G. MaxM CSA (P < 0.001); they also exhibited a higher dialysis vintage in Supplementary File S5 (P = 0.002), and a higher PDFF of the thigh muscle (P = 0.001), L3 trunk muscle (P = 0.033) and G. MaxM (P = 0.015).
Supplementary File S4 shows the risk factors for sarcopenia in patients receiving hemodialysis. Older age (OR: 1.061, P < 0.003); lower BMI (OR: 0.837, P = 0.008), albumin (OR: 0.765, P = 0.004), prealbumin (OR: 0.987, P = 0.001), BUN (OR 0.842, P < 0.001), predialysis creatinine (OR: 0.993, P < 0.001), and phosphorus (OR: 0.396, P = 0.047); and a higher PDFF of the thigh muscle (OR: 1.89, P = 0.036) and the L3 trunk muscle (OR: 1.71, P = 0.040) were identified as sarcopenia risk factors.
Logistic regression showed that muscle CSA and PDFF were significant predictors of sarcopenia among patients undergoing hemodialysis in this study, as shown in Supplementary File S5 and Figure 2. Except for the PDFF of G.MaxM and G. Med/MinM, the CSA and PDFF of the other muscles correlated with sarcopenia. For a per-SD increase in the CSA of G. Med/MinM, the OR for sarcopenia was 0.371 (95% CI: 0.164–0.839) in a multivariable model adjusted for age and BMI.

Figure 2 Association of muscle measurements with sarcopenia in hemodialysis patients. P < 0.05 was considered statistically significant. CI, confidence interval; L3 trunk, third lumbar trunk; G.Med/MinM, gluteus medius and minimus muscles; G.MaxM, gluteus maximus muscle; PDFF, proton-density fat-fraction. circle = significant; square = non-significant.
Tables 2–4 present the simple and multiple linear regression analyses of CSA and PDFF concerning HGS, SPPB score, and ASMI, respectively. In the unadjusted model (model 1), the muscle CSA and PDFF were significantly associated with HGS. Except for the L3 trunk muscle CSA, the CSA and PDFF of the other muscles were significantly associated with the SPPB score. Additionally, the CSA and PDFF of the other muscles were significantly associated with ASMI, excluding the G. Med/MinM PDFF and G. MaxM PDFF. After adjustments for age, BMI, albumin, predialysis BUN, predialysis creatinine, and phosphorus (model 5), a lower HGS was associated with lower thigh muscle CSA (ß = 0.267, P = 0.018) and G. Med/MinM CSA (ß = 0.280, P < 0.020), and a higher PDFF of the thigh muscle (ß = -0.209, P = 0.031) and L3 trunk muscle (ß =-0.287, P = 0.006). However, the muscle CSA and PDFF were not associated with the SPPB score after adjustments for age, BMI, albumin, predialysis BUN, predialysis creatinine, and phosphorus (model 5). Contrary to the SPPB results, in model 5, a lower ASMI was associated with a lower CSA of the thigh muscle (ß = 0.364, P = 0.001), L3 trunk muscle (ß = 0.428, P < 0.001), G. Med/MinM (ß = 0.342, P = 0.003), and G. MaxM (ß = 0.315, P = 0.004). Moreover, a lower ASMI was also associated with a higher PDFF of the thigh muscle (ß = -0.236, P = 0.011) and L3 trunk muscle (ß = -0.259, P = 0.010).

Table 2 Independency of muscle measurements and handgrip strength.

Table 3 Independency of muscle measurements and SPPB score.

Table 4 Independency of muscle measurements and ASMI.
In this study, we identified probable, confirmed, and severe sarcopenia in 73.7%, 51.3%, and 22.4% of patients undergoing hemodialysis, respectively. Older age; lower BMI, albumin, prealbumin, predialysis BUN, predialysis creatinine, and phosphorus levels; lower CSA of the thigh muscle, L3 trunk muscle, G. Med/MinM, and G. MaxM; and a higher PDFF of the thigh and L3 trunk muscle were identified as sarcopenia risk factors. G. Med/MinM CSA was higher in those without sarcopenia after adjusting for age and BMI. The lower thigh and G. Min/Med muscle CSA, as well as the higher thigh and L3 trunk muscle PDFF, were associated with lower HGS after adjustments for known risk factors. Moreover, a higher thigh and L3 trunk muscle PDFF inversely correlated with a lower ASMI.
In a recent meta-analysis including studies with 692 056 participants, the prevalence of sarcopenia in the general population was approximately 10.0%–27.0% (33). Because of the co-existence of factors such as uremic toxins, insulin resistance, or oxidative stress in patients with renal failure (34), they are more likely to develop sarcopenia. Shu et al. (7) recently published a meta-analysis showing that the sarcopenia prevalence was 28.5% (95% CI: 22.9–34.1%) and varied from 25.9% (I2 = 94.9%, 95% CI: 20.4–31.3%; combined criteria) to 34.6% (I2 = 98.1%, 95% CI: 20.9–48.2%; low muscle mass alone) in patients receiving hemodialysis almost two times the prevalence observed in patients without chronic kidney disease (CKD). Interestingly, we found similar results. The prevalence of confirmed sarcopenia in our study was 51.3%, based on the AWGS (2019) definition, and the prevalence of sarcopenia in our patients receiving hemodialysis was higher than that in patients undergoing hemodialysis in previous studies (7). This difference may be due to the following reasons: First, the populations selected differed (hospitalized and outpatients). Second, different instruments were used to assess muscle mass (DXA, bioelectrical impedance analysis, magnetic resonance imaging, and body composition monitors). DXA is the “gold” standard, and other detection methods may overestimate muscle mass due to overhydration in patients undergoing hemodialysis (35). Third, the difference may be due to the large variability in diagnostic criteria, such as those propsed by the European Working Group on Sarcopenia in Older People, the AWGS, the Foundation for the National Institutes of Health Sarcopenia Project, and the International Working Group on Sarcopenia.
The pathogenesis of sarcopenia remains unclear, and only a few reports have discussed the pathogenesis of sarcopenia in patients receiving hemodialysis. To identify the risk factors of sarcopenia in such patients, we categorized our sample into two groups, one with sarcopenia and one without. Our analyses show that older age was a risk factor for sarcopenia in our patients undergoing hemodialysis, which is consistent with previous results in the general population as well as in patients receiving hemodialysis (4, 6), and may be related to alpha motor neuron loss caused by aging (36). Furthermore, we found that a higher BMI and predialysis BUN and higher serum albumin, prealbumin, and phosphate levels were sarcopenia-protective factors in our patients receiving hemodialysis. These results are in agreement with previous findings reported in the literature (4, 5, 9). The reduction in the abovementioned indicators is reflective of poor oral intake, malnutrition, and poor nutritional status (37), which may result in reduced protein synthesis and muscle weakness (38). Therefore, it is appropriate to implement precise nutritional measures for patients undergoing hemodialysis.
A low predialysis creatinine level was found as a risk factor for sarcopenia in patients undergoing hemodialysis in our study. This marker is influenced by muscle mass (6, 9). We identified that the primary cause of the disease was diabetic nephropathy, which was significantly associated with sarcopenia in our patients receiving hemodialysis, in agreement with the literature (38, 39).
Some studies have found no statistically significant association between dialysis vintage and sarcopenia (5, 6, 9). However, a lower dialysis vintage was associated with sarcopenia in our study. We considered the following reason as the cause for this finding: most of our patients had a low dialysis vintage (in 71% of cases, the dialysis vintage was < 12 months); therefore, the dialysis-related indicators may not have had time to develop. Previous studies have reported that sarcopenia in patients receiving hemodialysis is mainly associated with hs-CRP (39), hemoglobin (6), and Kt/V (38). No correlations were found between these indicators and sarcopenia, which may be due to the limited sample as well as to the fact that patients with good control of the above indicators were under dialysis care and receiving a pharmacological intervention.
An individual’s muscle quality can be measured by both micro- and macro-scale changes in muscle architecture and composition, as well as by muscle function per unit of muscle mass (12).. Various imaging techniques, including CT and MRI, have been used to assess muscle quality in study settings, including the measurement of fat infiltration and muscle attenuation (40, 41). There is a strong association between fatty infiltration in the muscles and reduced muscle function (18). Several pathways contribute to the accumulation of fatty acids in muscles, and the accumulation of lipids within myofibers, also known as intramuscular fat, is one direct route. Adipocytes, which accumulate within the skeletal muscle as intermuscular fat, represent another pathway (42). Here, we used MR Dixon technology to quantify the amount of muscle adipose tissue, including intramuscular and intermuscular adipose tissue.
In addition to assessing the traditional risk factors for sarcopenia in patients undergoing hemodialysis, we evaluated new muscle measurements, such as CSA and PDFF. To our knowledge, no previous study has compared CSA and PDFF findings between patients with and without sarcopenia using quantitative MRI scans in those receiving hemodialysis. Using quantitative MRI, our study showed that muscle CSA reduction (thigh muscle, L3 trunk muscle, G.MaxM, and G. Med/MinM) and PDFF increase (thigh muscle, L3 trunk muscle, and G.MaxM) were influencing factors of sarcopenia in patients undergoing hemodialysis. Further analysis using binary logistic regression showed that the muscle CSA reduction (thigh muscle, L3 trunk muscle, G.MaxM, and G.Med/MinM) and PDFF increase (thigh muscle, L3 trunk muscle, and G.MaxM) were risk factors for developing sarcopenia. Our analyses demonstrate that the CSA reduction of G.MaxM and G.Med/MinM independently predicted sarcopenia, even after adjusting for age and BMI. Studies conducted as part of the Health ABC project have also shown age-related decreases in thigh muscle density or increased fatty infiltration in the thigh muscle (43), which may explain why some indicators were not statistically significant after age adjustments. After adjustments for age, BMI, albumin, predialysis BUN, predialysis creatinine, and phosphorus, muscle CSA and PDFF were not significantly associated with sarcopenia, which may partially be explained by low power due to the limited sample size, or by direct effects of chronic kidney disease on muscle function.
The assessment of muscle quality is expected to guide treatment decisions. Therefore, we assessed muscle measurements (CSA and PDFF) and muscle characteristics (muscle mass, strength, and function). We found that low muscle CSA and high PDFF were risk factors for lower muscle strength. After full adjustments for age, BMI, and other laboratory risk factors, CSA reduction (thigh muscle, L3 trunk muscle, and G.MaxM) and PDFF increase (thigh muscle, L3 trunk muscle, and G.Med/MinM) were also identified as risk factors for lower muscle strength. Some previous studies have reached similar conclusions, and muscle strength can be indirectly measured using muscle volume (26, 44, 45). However, Wang et al. (18) found no associations between HGS and midthigh muscle variables (neither muscle area nor density).
Our study suggests that CSA reduction (G. Med/MinM and G.MaxM) and PDFF increase (thigh muscle, L3 trunk muscle, G. Med/MinM, and G.MaxM) are also risk factors for lower muscle function. Particularly, after adjusting for BMI, CSA reduction (G. Med/MinM and G.MaxM) and PDFF increase (thigh muscle, L3 trunk muscle, G. Med/MinM, and G.MaxM) were identified as risk factors for lower muscle function. Our results confirm that muscle CSA and PDFF are important parameters for detecting lower muscle function, which is in line with other studies (16, 46). The fat fraction in the thigh muscle was associated with performance in a timed up-and-go test after adjusting for muscle area in controlled acromegaly (47). Moreover, older adults with low trunk muscle density are more likely to have poor balance and exhibit faster declines in functional capacity (16). Anderson et al. (16) found no association between L2 trunk muscle volume and the SPPB score, as well as between L2 trunk muscle density and the SPPB score, which is inconsistent with our results. Our findings show that only the G. Med/MinM CSA predicted lower muscle function after adjusting for age and BMI. Additionally, we identified low G. Med/MinM CSA as the most sensitive indicator of lower muscle function. Other studies reported similar results: Andrew et al., for example, found that normal gait is largely influenced by the G. Med/Min muscles of the hip (48). The G. Med/MinM, which is known as the “rotator cuff of the hip,” inserts into the greater trochanter of the femur. It maintains balance by acting as an abductor and rotator of the hip during normal walking (49). Similarly, a recent study found that stair climbing, sitting up and standing down, and walking are associated with smaller gluteus muscles (50). Therefore, the G. Med/MinM may be a key muscle group to focus on in future studies.
This study has some limitations. First, since this was a single-center study conducted in China, the results may not be generalizable to other patient populations and countries. Second, this study had a cross-sectional design, which prevented us from analyzing causal relationships between sarcopenia and muscle measurements (CSA and PDFF) in hemodialysis patients. Third, a limited patient sample was enrolled in this study, and some indicators were not found to influence sarcopenia, which may have been due to the resulting low power. Fourth, as image registration was not applied in this study, the absolute values of the cross-sectional area could have been affected by slight changes in image orientation. Fifth, some potentially relevant information was not collected, such as details on peripheral vascular disease, physical activity, nutritional status, and some muscle-affecting medicines (e.g., those belonging to the statin family). Therefore, a multicenter study with a larger sample size would be beneficial in evaluating this issue in the future.
In conclusion, our findings demonstrate the value of fat content assessments within skeletal muscles in patients with sarcopenia undergoing hemodialysis and might trigger a paradigm shift in intervention strategies for sarcopenia. In the future, assessments of muscle fat infiltration and muscle CSA may help guide treatment choices (i.e., precise nutritional exercise interventions) and monitor treatment responses.
The raw data supporting the conclusions of this article will be made available by the authors, without undue reservation.
The studies involving human participants were reviewed and approved by the Beijing Jishuitan Hospital Ethics Committee (ethics committee approval number: 202112-11-01). The patients/participants provided their written informed consent to participate in this study.
XC, DZ, CF, and LW designed the study. CF and DY prepared the first draft of the paper. NY, LW, MS, DW, XL, and XW contributed to the data collection, such as information collection, scanning, and data input. DY and YW edited the draft. FD and CF were responsible for the statistical analysis of the data. CF, DZ, and LW supervised the study and paper organization. All authors contributed to the article and approved the submitted version.
This project was supported by Beijing JST Research Funding (code: ZR-202210, ZR-202214), the National Natural Science Foundation of China (grant no. 81901718), the Beijing Hospitals Authority Youth Programme (code: QML20200402), Beijing Hospitals Authority Clinical Medicine Development of Special Funding Support (code: ZYLX202107), and the Beijing Talents Fund (grant no. 2015000021467G177).
The authors would like to thank Mingjie Wang, Lingran Yuan, and Yunqing Xia; they greatly contributed to the image processing of this paper. We also would like to thank Editage (www.editage.cn) for English language editing. We thank the study participants for contributing their time and effort.
Author YW was employed by Siemens Healthineers Ltd.
The remaining authors declare that the research was conducted in the absence of any commercial or financial relationships that could be construed as a potential conflict of interest.
All claims expressed in this article are solely those of the authors and do not necessarily represent those of their affiliated organizations, or those of the publisher, the editors and the reviewers. Any product that may be evaluated in this article, or claim that may be made by its manufacturer, is not guaranteed or endorsed by the publisher.
The Supplementary Material for this article can be found online at: https://www.frontiersin.org/articles/10.3389/fendo.2023.1117438/full#supplementary-material
1. Chen L, Woo J, Assantachai P, Auyeung T, Chou M, Iijima K, et al. Asian Working group for sarcopenia: 2019 consensus update on sarcopenia diagnosis and treatment. J Am Med Dir Assoc (2020) 21:300–07. doi: 10.1016/j.jamda.2019.12.012
2. Cruz-Jentoft AJ, Bahat G, Bauer J, Boirie Y, Bruyère O, Cederholm T, et al. Sarcopenia: revised European consensus on definition and diagnosis. Age Ageing (2019) 48:601. doi: 10.1093/ageing/afz046
3. Ren H, Gong D, Jia F, Xu B, Liu Z. Sarcopenia in patients undergoing maintenance hemodialysis: incidence rate, risk factors and its effect on survival risk. Ren Fail (2016) 38:364–71. doi: 10.3109/0886022X.2015.1132173
4. Mori K, Nishide K, Okuno S, Shoji T, Emoto M, Tsuda A, et al. Impact of diabetes on sarcopenia and mortality in patients undergoing hemodialysis. BMC Nephrol (2019) 20:105. doi: 10.1186/s12882-019-1271-8
5. Umakanthan M, Li JW, Sud K, Duque G, Guilfoyle D, Cho K, et al. Prevalence and factors associated with sarcopenia in patients on maintenance dialysis in Australia–a single centre, cross-sectional study. Nutrients (2021) 13:3284. doi: 10.3390/nu13093284
6. Ding Y, Chang L, Zhang H, Wang S. Predictive value of phase angle in sarcopenia in patients on maintenance hemodialysis. Nutrition (2022) 94:111527. doi: 10.1016/j.nut.2021.111527
7. Shu X, Lin T, Wang H, Zhao Y, Jiang T, Peng X, et al. Diagnosis, prevalence, and mortality of sarcopenia in dialysis patients: A systematic review and meta-analysis. J Cachexia Sarcopenia Muscle (2022) 13:145–58. doi: 10.1002/jcsm.12890
8. Sánchez-Tocino ML, Miranda-Serrano B, López-González A, Villoria-González S, Pereira-García M, Gracia-Iguacel C, et al. Sarcopenia and mortality in older hemodialysis patients. Nutrients (2022) 14:2354. doi: 10.3390/nu14112354
9. Kittiskulnam P, Chertow GM, Carrero JJ, Delgado C, Kaysen GA, Johansen KL. Sarcopenia and its individual criteria are associated, in part, with mortality among patients on hemodialysis. Kidney Int (2017) 92:238–47. doi: 10.1016/j.kint.2017.01.024
10. Wang XH, Mitch WE, Price SR. Pathophysiological mechanisms leading to muscle loss in chronic kidney disease. Nat Rev Nephrol (2022) 18:138–52. doi: 10.1038/s41581-021-00498-0
11. Janssen I, Heymsfield SB, Wang ZM, Ross R. Skeletal muscle mass and distribution in 468 men and women aged 18-88 yr. J Appl Physiol (1985) (2000) 89:81–8. doi: 10.1152/jappl.2000.89.1.81
12. McGregor RA, Cameron-Smith D, Poppitt SD. It is not just muscle mass: a review of muscle quality, composition and metabolism during ageing as determinants of muscle function and mobility in later life. Longevity Healthspan (2014) 3:9. doi: 10.1186/2046-2395-3-9
13. Goodpaster BH, Park SW, Harris TB, Kritchevsky SB, Nevitt M, Schwartz AV, et al. The loss of skeletal muscle strength, mass, and quality in older adults: the health, aging and body composition study. J Gerontol Biol Sci Med Sci (2006) 61:1059–64. doi: 10.1093/gerona/61.10.1059
14. KYLE U. Bioelectrical impedance analysis?part I: review of principles and methods. Clin Nutr (2004) 23:1226–43. doi: 10.1016/j.clnu.2004.06.004
15. Limanond P, Raman SS, Lassman C, Sayre J, Ghobrial RM, Busuttil RW, et al. Macrovesicular hepatic steatosis in living related liver donors: correlation between CT and histologic findings. Radiology (2004) 230:276–80. doi: 10.1148/radiol.2301021176
16. Anderson DE, Quinn E, Parker E, Allaire BT, Muir JW, Rubin CT, et al. Associations of computed tomography-based trunk muscle size and density with balance and falls in older adults. Journals Gerontology Ser A: Biol Sci Med Sci (2016) 71:811–16. doi: 10.1093/gerona/glv185
17. Birnbaum BA, Hindman N, Lee J, Babb JS. Multi-detector row CT attenuation measurements: assessment of intra- and interscanner variability with an anthropomorphic body CT phantom. Radiology (2007) 242:109–19. doi: 10.1148/radiol.2421052066
18. Wang L, Yin L, Zhao Y, Su Y, Sun W, Chen S, et al. Muscle density, but not size, correlates well with muscle strength and physical performance. J Am Med Dir Assoc (2021) 22:751–59. doi: 10.1016/j.jamda.2020.06.052
19. Delmonico MJ, Harris TB, Visser M, Park SW, Conroy MB, Velasquez-Mieyer P, et al. Longitudinal study of muscle strength, quality, and adipose tissue infiltration. Am J Clin Nutr (2009) 90:1579–85. doi: 10.3945/ajcn.2009.28047
20. Grimm A, Meyer H, Nickel MD, Nittka M, Raithel E, Chaudry O, et al. Evaluation of 2-point, 3-point, and 6-point Dixon magnetic resonance imaging with flexible echo timing for muscle fat quantification. Eur J Radiol (2018) 103:57–64. doi: 10.1016/j.ejrad.2018.04.011
21. Naarding KJ, van der Holst M, van Zwet EW, van de Velde NM, de Groot I, Verschuuren J, et al. Association of elbow flexor MRI fat fraction with loss of hand-to-Mouth movement in patients with duchenne muscular dystrophy. Neurology (2021) 97:e1737–42. doi: 10.1212/WNL.0000000000012724
22. Koch G. Editorial for “Bone marrow fat measured by a chemical shift-encoded sequence (IDEAL-IQ) in patients with and without metabolic syndrome”. J Magn Reson Imaging (2021) 54:154. doi: 10.1002/jmri.27645
23. Marty B, Reyngoudt H, Boisserie JM, Le Louer J, AAE C, Fromes Y, et al. Water-fat separation in MR fingerprinting for quantitative monitoring of the skeletal muscle in neuromuscular disorders. Radiology (2021) 300:652–60. doi: 10.1148/radiol.2021204028
24. Schweitzer L, Geisler C, Pourhassan M, Braun W, Glüer C, Bosy-Westphal A, et al. What is the best reference site for a single MRI slice to assess whole-body skeletal muscle and adipose tissue volumes in healthy adults? Am J Clin Nutr (2015) 102:58–65. doi: 10.3945/ajcn.115.111203
25. Grimm A, Meyer H, Nickel MD, Nittka M, Raithel E, Chaudry O, et al. Repeatability of Dixon magnetic resonance imaging and magnetic resonance spectroscopy for quantitative muscle fat assessments in the thigh. J cachexia sarcopenia Muscle (2018) 9:1093–100. doi: 10.1002/jcsm.12343
26. Linder N, Schaudinn A, Langenhan K, Krenzien F, Hau HM, Benzing C, et al. Power of computed-tomography-defined sarcopenia for prediction of morbidity after pancreaticoduodenectomy. BMC Med Imaging (2019) 19:32. doi: 10.1186/s12880-019-0332-6
27. Daugirdas JT. Second generation logarithmic estimates of single-pool variable volume Kt/V: an analysis of error. J Am Soc Nephrol JASN (1993) 4:1205–13. doi: 10.1681/ASN.V451205
28. Scafoglieri A, Clarys JP. Dual energy X-ray absorptiometry: gold standard for muscle mass? J Cachexia Sarcopenia Muscle (2018) 9:786–87. doi: 10.1002/jcsm.12308
29. Heymsfield SB, Smith R, Aulet M, Bensen B, Lichtman S, Wang J, et al. Appendicular skeletal muscle mass: measurement by dual-photon absorptiometry. Am J Clin Nutr (1990) 52:214–18. doi: 10.1093/ajcn/52.2.214
30. Esteban-Cornejo I, Ho FK, Petermann-Rocha F, Lyall DM, Martinez-Gomez D, Cabanas-Sánchez V, et al. Handgrip strength and all-cause dementia incidence and mortality: findings from the UK biobank prospective cohort study. J Cachexia sarcopenia Muscle (2022) 13:1514–25. doi: 10.1002/jcsm.12857
31. Guralnik JM, Simonsick EM, Ferrucci L, Glynn RJ, Berkman LF, Blazer DG, et al. A short physical performance battery assessing lower extremity function: association with self-reported disability and prediction of mortality and nursing home admission. J Gerontol (Kirkwood) (1994) 49:M85. doi: 10.1093/geronj/49.2.M85
32. Yushkevich PA, Gao Y, Gerig G. ITK-SNAP: An interactive tool for semi-automatic segmentation of multi-modality biomedical images. Annu Int Conf IEEE Eng Med Biol Society. IEEE Eng Med Biol Society. Annu Int Conf (2016) 2016:3342–45. doi: 10.1109/EMBC.2016.7591443
33. Petermann Rocha F, Balntzi V, Gray SR, Lara J, Ho FK, Pell JP, et al. Global prevalence of sarcopenia and severe sarcopenia: a systematic review and meta-analysis. J Cachexia Sarcopenia Muscle (2022) 13:86–99. doi: 10.1002/jcsm.12783
34. Noor H, Reid J, Slee A. Resistance exercise and nutritional interventions for augmenting sarcopenia outcomes in chronic kidney disease: A narrative review. J Cachexia Sarcopenia Muscle (2021) 12:1621–40. doi: 10.1002/jcsm.12791
35. Hoppe K, Schwermer K, Klysz P, Radziszewska D, Sawatiuk P, Baum E, et al. Cardiac troponin T and hydration status as prognostic markers in hemodialysis patients. Blood Purif (2015) 40:139–45. doi: 10.1159/000376603
36. Valenzuela PL, Cobo F, Diez-Vega I, Sanchez-Hernandez R, Pedrero-Chamizo R, Verde-Rello Z, et al. Physical performance, plasma s-klotho, and all-cause mortality in elderly dialysis patients: A prospective cohort study. Exp Gerontol (2019) 122:123–28. doi: 10.1016/j.exger.2019.05.003
37. Akchurin OM, Kaskel F. Update on inflammation in chronic kidney disease. Blood Purif (2015) 39:84–92. doi: 10.1159/000368940
38. Uemura K, Doi T, Lee S, Shimada H. Sarcopenia and low serum albumin level synergistically increase the risk of incident disability in older adults. J Am Med Dir Assoc (2019) 20:90–3. doi: 10.1016/j.jamda.2018.06.011
39. Wilkinson TJ, Miksza J, Yates T, Lightfoot CJ, Baker LA, Watson EL, et al. Association of sarcopenia with mortality and end-stage renal disease in those with chronic kidney disease: A UK biobank study. J Cachexia Sarcopenia Muscle (2021) 12:586–98. doi: 10.1002/jcsm.12705
40. Ruan XY, Gallagher D, Harris T, Albu J, Heymsfield S, Kuznia P, et al. Estimating whole body intermuscular adipose tissue from single cross-sectional magnetic resonance images. J Appl Physiol (1985) (2007) 102:748–54. doi: 10.1152/japplphysiol.00304.2006
41. Larsen BA, Wassel CL, Kritchevsky SB, Strotmeyer ES, Criqui MH, Kanaya AM, et al. Association of muscle mass, area, and strength with incident diabetes in older adults: The health ABC study. J Clin Endocrinol Metab (2016) 101:1847–55. doi: 10.1210/jc.2015-3643
42. Wang L, Yin L, Yang M, Ge Y, Liu Y, Su Y, et al. Muscle density is an independent risk factor of second hip fracture: A prospective cohort study. J Cachexia Sarcopenia Muscle (2022) 13:1927–37. doi: 10.1002/jcsm.12996
43. Cao L, Chen S, Zou C, Ding X, Gao L, Liao Z, et al. A pilot study of the SARC-f scale on screening sarcopenia and physical disability in the Chinese older people. J Nutr Health Aging (2014) 18:277–83. doi: 10.1007/s12603-013-0410-3
44. Hayashida I, Tanimoto Y, Takahashi Y, Kusabiraki T, Tamaki J. Correlation between muscle strength and muscle mass, and their association with walking speed, in community-dwelling elderly Japanese individuals. PloS One (2014) 9:e111810. doi: 10.1371/journal.pone.0111810
45. Engelke K, Museyko O, Wang L, Laredo J. Quantitative analysis of skeletal muscle by computed tomography imaging–state of the art. J Orthop Translat (2018) 15:91–103. doi: 10.1016/j.jot.2018.10.004
46. Wang L, Yin L, Zhao Y, Su Y, Sun W, Liu Y, et al. Muscle density discriminates hip fracture better than computed tomography X-ray absorptiometry hip areal bone mineral density. J Cachexia Sarcopenia Muscle (2020) 11:1799–812. doi: 10.1002/jcsm.12616
47. Martel-Duguech L, Alonso-Pérez J, Bascuñana H, Díaz-Manera J, Llauger J, et al. Intramuscular fatty infiltration and physical function in controlled acromegaly. Eur J Endocrinol (2021) 185:167–77. doi: 10.1530/EJE-21-0209
48. Chi AS, Long SS, Zoga AC, Parker L, Morrison WB. Association of gluteus medius and minimus muscle atrophy and fall-related hip fracture in older individuals using computed tomography. J Comput Assist Tomogr (2016) 40:238–42. doi: 10.1097/RCT.0000000000000341
49. Addison O, Inacio M, Bair WN, Beamer BA, Ryan AS, Rogers MW. Role of hip abductor muscle composition and torque in protective stepping for lateral balance recovery in older adults. Arch Phys Med Rehabil (2017) 98:1223–28. doi: 10.1016/j.apmr.2016.10.009
50. Damm P, Brackertz S, Streitparth F, Perka C, Bergmann G, Duda GN, et al. ESB clinical biomechanics award 2018: Muscle atrophy-related increased joint loading after total hip arthroplasty and their postoperative change from 3 to 50months. Clin Biomech (Bristol Avon) (2019) 65:105–09. doi: 10.1016/j.clinbiomech.2019.04.008
Keywords: hand-grip strength, hemodialysis, muscle cross-sectional area, proton-density fat-fraction, sarcopenia, myosteatosis, quantitative MRI
Citation: Fu C, Yan D, Wang L, Duan F, Gu D, Yao N, Sun M, Wang D, Lin X, Wu Y, Wang X, Cheng X and Zhang D (2023) High prevalence of sarcopenia and myosteatosis in patients undergoing hemodialysis. Front. Endocrinol. 14:1117438. doi: 10.3389/fendo.2023.1117438
Received: 06 December 2022; Accepted: 09 March 2023;
Published: 23 March 2023.
Edited by:
Jiang Du, University of California, San Diego, United StatesReviewed by:
Dina Moazamian, University of California, San Diego, United StatesCopyright © 2023 Fu, Yan, Wang, Duan, Gu, Yao, Sun, Wang, Lin, Wu, Wang, Cheng and Zhang. This is an open-access article distributed under the terms of the Creative Commons Attribution License (CC BY). The use, distribution or reproduction in other forums is permitted, provided the original author(s) and the copyright owner(s) are credited and that the original publication in this journal is cited, in accordance with accepted academic practice. No use, distribution or reproduction is permitted which does not comply with these terms.
*Correspondence: Xiaoguang Cheng, eGlhbzY1QDI2My5uZXQ=; Dongliang Zhang, emhhbmdkb25nbGlhbmdASnN0LWhvc3AuY29tLmNu
†These authors have contributed equally to this work and share first authorship
‡These authors have contributed equally to this work
Disclaimer: All claims expressed in this article are solely those of the authors and do not necessarily represent those of their affiliated organizations, or those of the publisher, the editors and the reviewers. Any product that may be evaluated in this article or claim that may be made by its manufacturer is not guaranteed or endorsed by the publisher.
Research integrity at Frontiers
Learn more about the work of our research integrity team to safeguard the quality of each article we publish.