 Hongyu Li
 Yan Lv
 Ying Hu
94% of researchers rate our articles as excellent or good
Learn more about the work of our research integrity team to safeguard the quality of each article we publish.
Find out more
ORIGINAL RESEARCH article
Front. Endocrinol., 20 January 2023
Sec. Bone Research
Volume 14 - 2023 | https://doi.org/10.3389/fendo.2023.1117111
This article is part of the Research TopicRare Musculoskeletal Disorders: Disease Mechanisms and TherapiesView all 6 articles
Introduction: Gnathodiaphyseal dysplasia (GDD; OMIM#166260) is a rare autosomal dominant disorder characterized by diaphyseal sclerosis of tubular bones and cemento-osseous lesions in mandibles. GDD is caused by point mutations in the ANO5 gene. However, the mechanisms underlying GDD have not been disclosed. We previously generated the first knock-in mouse model for GDD expressing a human mutation (p.Cys360Tyr) in ANO5 and homozygous Ano5 knock-in (Ano5KI/KI) mice exhibited representative traits of human GDD especially including enhanced osteogenesis.
Methods: Metabolomics and transcriptomics analyses were conducted for wildtype (Ano5+/+) and Ano5KI/KI mature mouse calvarial osteoblasts (mCOBs) grown in osteogenic cultures for 14 days to identify differential intracellular metabolites and genes involved in GDD. Subsequently, related differential genes were validated by qRT-PCR. Cell proliferation was confirmed by CCK8 assay and calcium content in mineral nodules was detected using SEM-EDS.
Results: Metabolomics identified 42 differential metabolites that are primarily involved in amino acid and pyrimidine metabolism, and endocrine and other factor-regulated calcium reabsorption. Concomitantly, transcriptomic analysis revealed 407 differentially expressed genes in Ano5KI/KI osteoblasts compared with wildtype. Gene ontology and pathway analysis indicated that Ano5Cys360Tyr mutation considerably promoted cell cycle progression and perturbed calcium signaling pathway, which were confirmed by validated experiments. qRT-PCR and CCK-8 assays manifested that proliferation of Ano5KI/KI mCOBs was enhanced and the expression of cell cycle regulating genes (Mki67, Ccnb1, and Ccna2) was increased. In addition, SEM-EDS demonstrated that Ano5KI/KI mCOBs developed higher calcium contents in mineral nodules than Ano5+/+ mCOBs, while some calcium-related genes (Cacna1, Slc8a1, and Cyp27b1) were significantly up-regulated. Furthermore, osteocalcin which has been proved to be an osteoblast-derived metabolic hormone was upregulated in Ano5KI/KI osteoblast cultures.
Discussion: Our data demonstrated that the Ano5Cys360Tyr mutation could affect the metabolism of osteoblasts, leading to unwonted calcium homeostasis and cellular proliferation that can contribute to the underlying pathogenesis of GDD disorders.
Gnathodiaphyseal dysplasia (GDD; OMIM#166260) is a rare skeletal disorder mainly characterized by cemento-osseous lesions of mandibles and tubular bone fragility (1). GDD is inherited in an autosomal dominant pattern or sporadically occurs. Tsutsumi used linkage analysis to identify that this syndrome is associated with mutations of GDD1, also referred to as Anoctamin 5 (ANO5; TMEM16E) that is mapped to chromosome 11p14.3-15.1 (2). The protein encoded by ANO5 belongs to the TMEM16/anoctamin protein family and is widely expressed in skeletal muscle and bone tissues (3, 4). Unlike other TMEM16 family members that are localized within plasma membranes, ANO5 is predominantly located in intracellular vesicles, including in the endoplasmic reticulum, Golgi apparatus, and endosomes (3). Thus, it remains controversial whether ANO5 exhibits activities related to calcium-activated chloride channels (CaCCs) or phospholipid scrambling (5–8).
Heretofore, GDD-related ANO5 missense mutations have been identified at seven positions, including p.Arg215Gly, p.Cys356Gly, p.Cys356Arg, p.Cys356Tyr, p.Cys356Phe, p.Cys360Tyr, p.Ser500Phe, p.Thr513Ile, p.Gly518Glu, and Arg597Ile (3, 9–17). Enhanced bone formation is a momentous clinical feature of patients with GDD, as evinced by radiographic examinations revealing relatively elevated bone mineral density (BMD) and laboratory data documenting high serum levels of alkaline phosphatase (ALP). Consequently, greater attention has been paid to the effects of ANO5 mutations on osteoblast functions in recent years. Ano5 silencing in MC3T3 promoted the formation of bone mineral nodules and the expression of osteoblast differentiation markers, including the runt-related transcription factor 2 (Runx2), collagen I (Col1a1), and osteocalcin (Ocn) (13). In addition, Ano5 deletion in mice replicated some typical traits of human GDD, including elevated serum ALP activity, high BMD and bone mineral content (BMC) of mandibles and diaphyseal of long bones, and increased osteogenesis (18). However, the specific mechanisms underlying the aberrant bone formation in GDD remain unclear. Thus, there is an urgent need to provide a systematically reliable observation of osteogenic alternation caused by GDD-related mutations.
Bone is a multitasking tissue with mechanical, hematopoietic, and metabolic functions, which depends on the precise cooperation of osteoblasts and osteoclasts. Various metabolic pathways are indispensable for maintaining bone tissue (19). Osteoblasts require substantial amounts of energy during new bone formation and remodeling. Clinical disorders related to substrate availability, like diabetes mellitus, anorexia nervosa, and aging, dysregulate osteogenesis ultimately leading to osteoporosis (20). Many lines of evidence have shown that osteoblasts secrete endocrine factors including OCN, sclerostin (SOST), and fibroblast growth factor 23 (FGF23) that connect the metabolic requirements of bone formation with global energy balance (20, 21). Beyond aerobic glycolysis, which produces 80% adenosine triphosphate (ATP) through utilizing glucose, glutamine via the TCA cycle and fatty acids via oxidative phosphorylation are also important fuel sources for osteoblasts and necessary for generating metabolic intermediates to support matrix protein synthesis (20). Furthermore, it has been proposed that higher uptake and utilization of protein, a potential energy source in addition to the above, is beneficial for bone health, as mediated by its role in forming bone matrix structures and stimulating osteoblast activity (22, 23). Ionic calcium metabolism is one of the mineral components in the extracellular matrix (ECM) and is required for bone matrix formation, the synthesis of mineral scaffolding ECM, and mineral crystal formation (24). Metabolomics has become popular in recent years for understanding bone diseases including osteonecrosis, osteoarthritis, intervertebral disc degeneration, and osteoporosis due to the synchronized relationships between metabolism and bone development (25, 26). Indeed, metabolomics is an emerging tool for biomarker identification via comprehensive and systematic profiling of low molecular weight metabolites that are the substrates and products of metabolism driving essential cellular functions involved in signal transduction, cellular proliferation, ion transport, and energy production (27). Concomitantly, RNA-Seq methods that allow profiling of whole transcriptome and therefore revealing alterations in entire signaling networks, have also been routinely used in skeletal biology research (28).
We previously reported a Chinese GDD family carrying the p.Cys360Tyr mutation in ANO5. Further, an Ano5Cys360Tyr knock-in mouse model was successfully established that resembled some phenotypes of GDD patients and exhibited enhanced osteogenesis (29). In the present study, RNA-seq and metabolomics analyses were used to explore differentially expressed genes and intracellular metabolites of mature mouse calvarial osteoblasts (mCOBs) after 14-day osteogenic cultures from Ano5Cys360Tyr compared with Ano5+/+ mice, and the underlying metabolic pathways were predicted followed by verification with functional experiments.
The Ano5KI/KI mouse model carrying a Han GDD mutation was generated using CRISPR Cas9 genomic editing technology and by introducing a transformation of cysteine into tyrosine at codon 360 of Ano5. C57BL/6 female mice and KM mouse strains were used as embryo donors and pseudo-pregnant foster mothers, respectively, and were purchased from the Beijing Vital River Laboratory Animal, Co., Ltd. Genotyping of the Ano5 knock-in mice was verified by PCR amplification and Sanger sequencing (forward primer: 5’-GCTTAGGTCTTCTACATCGGGCTGT-3’ and reverse primer: 5’-ATCCCCATGAAGAGCGCAAAGAACA-3’). Details related to generation and genotype identification of the knock-in mouse model were previously published (29). Mice were housed in a pathogen-free environment under 12 hours light-dark cycles and given standard food ad libitum. All animal experimentation protocols were approved by the Institutional Animal Care and Use Committee of the Beijing Stomatological Hospital (the approval number: KQYY-201611-001).
mCOBs from Ano5+/+ and Ano5KI/KI mice were isolated from postnatal 24 hour old littermates and cultured in DMEM after adding 20% fetal bovine serum (FBS; Gibco, USA) until reaching 80% confluence. mCOBs at the third passage were used for osteoblast differentiation in osteogenic medium, as previously described. Mature osteoblasts represent mCOBs after 14 days of osteoblast differentiation. Cultivation medium was exchanged every two days.
2×10⁷ mCOBs/well from Ano5+/+ (n=6) and Ano5KI/KI mice (n=8) after 14 days of osteogenic induction were collected into centrifuge tube after washing three times with PBS buffer and all subsequent operations were carried out on ice. Cell extracts (500 μl comprising 80% methanol and internal standards, 20% H2O) were added and vortexed for 3 minutes to achieve complete sample suspension. Samples were placed on liquid nitrogen for 5 minutes to achieve rapid freezing, then thawed on dry ice and ice for 5 min each, and then mixed by vortex for 2 minutes. The entire procedure was repeated in triplicate. Centrifugation was subsequently conducted for 10 min at 12,000 rpm/min and 4°C. Supernatants from samples (300 μl) were transferred into another centrifuge tube and incubated at -20°C for 30 min. Insoluble fragments were discarded by centrifugation at 12,000 rpm/min for 3 min and 4°C for 3 min and then 200 μl of supernatant was removed into the liner column of the sampling bottle for LC-MS analysis.
Chromatographic separation was firstly performed in a ThermoUltimate 3,000 system equipped with a Waters ACQUITY UPLC HSS T3 C18 column (100 × 2.1 mm, 1.8 μm, Waters) maintained at 40°C. Gradient elution analysis was carried out with 0.1% formic acid in water (A) and 0.1% formic acid in acetonitrile (B) at a flow rate of 0.4 ml/min. The injection volume of each sample was 2 μl. A gradient of water/solvent B (v/v) was used as follows: 0 min, 95%/5%; 11.0 min, 10%/90%; 12.0 min, 10%/90%; 12.1 min, 95%/5%; 14 min: 95%/5%. Liquid chromatography was then accomplished with a Waters ACQUITY UPLC BEH Amide column (100 × 2.1 mm, 1.7 μm, Waters) maintained at 40°C. Gradient elution was proceeded in water with 20 mM ammonium formate and 0.4% ammonia solution (A) and acetonitrile (B) at a flow rate of 0.4 ml/min. The injection volume of each sample also was 2 μl. A gradient of water/acetonitrile (v/v) was used as follows: 0 min, 10%/90%; 9.0 min, 40%/60%; 10.0 min, 60%/40%; 11.0 min, 60%/40%; 11.1 min, 10%/90%; 15.0 min, 10%/90%. The mass spectroscopy acquisition conditions included an electrospray ionization (ESI) temperature of 500°C, positive voltage of 5,500 V, a negative voltage of -4,500 V, the ion source gas I (GS I) at 55 psi, the GS II at 60 psi, the curtain gas (CUR) at 25 psi; and with the high collision-activated ionization (CAD) parameter. Full scan detection was performed in triple quadrupole (Qtrap) mode according to the optimized declustering potential (DP) and collision energy (CE).
Raw UPLC-MS/MS data were processed using Analyst (version 1.6.3). Integration and correction of chromatographic peaks were conducted using the MultiaQuant software package. Principal component analysis (PCA) was carried out using the base R software package (version 3.5.1). Intracellular metabolites significantly differential between groups were determined based on variable importance in projection (VIP) values ≥1 and p-values < 0.05. VIP values extracted from the orthogonal projection to latent structures discriminant analysis (OPLS-DA) results and associated score plots and permutation plots, as generated with the R package MetaboAnalystR (version 1.0.1). In order to avoid overfitting, a permutation test with 200 permutations was performed. Hierarchical cluster analysis (HCA) was conducted using the R package heatmaply (version 1.2.1) and ComplexHeatmap (version 2.7.1.1009). Pearson correlation coefficients between sample profiles were calculated using the cor function of R (version 3.5.1) and were visualized as heatmaps. Identified metabolites were annotated using the KEGG compound database and then mapped to the KEGG pathway database. Significantly enriched pathways were identified using the p-value from hypergeometric tests for a given set of metabolites.
Total RNAs of 5×10⁶ mCOBs from Ano5+/+ and Ano5KI/KI mice (n=3 per group) cultured after 14 days of osteogenic induction were extracted using the Trizol reagent (Ambion, Thermo Fisher Scientific, USA). The integrity of the total RNA was evaluated with an Agilent 2100 Bioanalyzer and with agarose gel electrophoresis (28S:18S values ≥1, RNA integrite number (RIN) values ≥7), along with purity and quantification analysis with a Nanodrop spectrophotometer (concentration ≥ 50 ng/μl, 260/280 absorbance ≥1.8, 28S/18S ≥1). mRNA was enriched using magnetic beads with Oligo (dT) and then fragmented. One-strand cDNA was synthesized from the mRNA templates using reverse transcription with random hexamers. Double-stranded cDNA was then synthesized by adding dNTPs and DNA polymerase I. AMPure XP beads were used to purify and select desired fragment size ranges of double-stranded cDNA, and finally PCR amplification was performed to construct cDNA libraries. Subsequently, qPCR was used to measure RNA concentrations (> 4 nM). Paired-end sequencing with a read length of 200-300 bp was then conducted on the Illumina HiSeqTM2500/4000 platform (Illumina Inc., San Diego, CA, United States).The experiments were carried out in triplicates and mCOBs cultures from at least three different mice.
Transcript expression levels are expressed as fragments per kilobase of exon model per million mapped reads (FPKM). Genes or transcripts with mean FPKM values > 1.0 are considered to be expressed in the group for statistical analysis. The HTSeq software package was used to analyze the expression levels in each sample using the UNION model. The Trimmomatic software program (version 0.33) was used to perform quality control of reads based on RNA-seq. Sequence reads were mapped to the reference genome using the STAR program (version 2.5.2b) software package. The DEGSeq 1.12.0 and DESeq package for R (version 1.10.1) were used to identify differentially expressed genes (DEGs) in Ano5KI/KI mCOBs compared to Ano5+/+ mCOBs. The negative binomial distribution and Benjamini–Hochberg methods were used to calculate p and FDR values, respectively. A total of 407 DEGs were filtered out under a reasonable threshold and effective criteria of fold change >1.2 and padj < 0.05. The GOseq (version 1.22) and KOBAS (version 2.0) packages for R were used to conduct Gene ontology (GO) and KEGG pathway enrichment to identify the physiological associations of DEGs. Significantly enriched items and pathways are identified using q values (corrected p-values) that were calculated by hypergeometric tests with BH correction.
mCOBs from Ano5+/+ and Ano5KI/KI mice were cultured on 24-well glass coverslips in osteogenic induction medium for 21 days. Samples (n=5 per group) were fixed with 2.5% glutaraldehyde and dehydrated with an ethanol gradient. The micromorphology of the nodules was then examined by SEM (TESCAN S9000X), while calcium and phosphate contents were analyzed by EDS using a MERLIN VP Compact system (Zeiss, Germany) in the UH-resolution scan mode under an acceleration voltage of 5 kV.
The proliferative ability of mCOBs was tested using a cell counting kit-8 (CCK-8) assay (Dojindo, Tokyo, Japan) according to the manufacturer’s instructions. Cells were plated at a density of 5 × 10³ cells/well in 96-well plates. Complete exchange of the medium was conducted at days 1, 3, and 4 using serum-free medium containing the CCK-8 reagent, followed by incubation with the cells at 37°C for 2 hours and OD measurements at 450 nm using a microplate reader. Meanwhile, the viability of mCOBs after 14 and 21 days of osteoblast differentiation was also measured. Cell proliferation rate was calculated as follows: cell proliferation rate = ((ODtreat-ODBlank) - (OD12h-ODBlank))/(OD12h-ODBlank) x 100%.
Ano5+/+ and Ano5KI/KI mCOBs were seeded at a density of 3×10⁵ cells/well into 6-well plates and then cultured with α-MEM for 24 hours or with 14 day osteoblast differentiation. Cells were then digested and resuspended in a centrifuge tube and the supernatant was discarded after centrifugation at 1,000 g/minfor 5 min. After washing twice with cooled PBS, cells were fixed in 70% methyl alcohol at 4°C overnight. Cells were then incubated with 500 μL propidium iodide (PI) staining buffer for 30 min in the dark at 37°C. A BD Accuri C6 flow cytometer was applied to detect red fluorescence at an excitation wavelength of 488 nm, while ModFitLT V3.2 was utilized to analyze cell cycle distributions (G1, S, and G2).
Serum was collected from the retroorbital veins of 16 week old Ano5+/+ and Ano5KI/KI male mice (n=10) using a glass capillary. After allowing to naturally solidify at room temperature, supernatants were collected after centrifugation at 1,000 g for 20 min. In addition, cell-free extracts and corresponding culture supernatants from Ano5+/+ and Ano5KI/KI mCOBs were acquired at days 0 and 14. Calcitriol levels were determined using a calcitriol ELISA Kit (Sango, Shanghai, China) and FGF23 levels were examined with Mouse FGF23 ELISA Kit (Beyotime, Shanghai, China) according to the manufacturer’s instructions. OD values were immediately measured at 450 nm with a microplate reader.
mCOBs after 14 days of osteogenic induction were collected and lysed in RIPA buffer, as previously described (29). The protein concentrations in each sample were measured using Bradford assays with Coomassie brilliant blue G-250 (Bio-Rad, California, USA). A total of 20 μg protein was subjected to sodium dodecyl sulfate polyacrylamide gel electrophoresis (SDS‐PAGE). The SDS membranes were blocked with 5% nonfat milk for 1 hour and incubated with primary OCN antibodies overnight (DF12303, Affinity Biosciences, Beijing, China). ACTB (Abclonal, Wuhan, China) was examined as the housekeeping reference protein. After incubation for 1 hour with horseradish peroxidase (HRP)-conjugated anti-rabbit secondary antibody at a dilution of 1:5,000, band signals were detected using a Bio-Rad imaging system (Bio-Rad, USA) with NcmECL High (NCM Biotech, Jiangsu, China). The Image lab software program (Bio-Rad, USA) was utilized to perform relatively quantitative analysis of protein levels.
Total RNA was extracted using the TRIzol reagent (Ambion, Life Technologies, USA), and RNA quality was subsequently assessed using the Infinite M200 PRO NanoQuant absorbance microplate reader (TECAN, Chapel Hill, NC, USA). Reverse transcription was conducted with a SuperRT cDNA Synthesis Kit (CWbio, Beijing, China) and real-time quantitative reverse transcriptase-polymerase chain reactions (qRT-PCR) were performed using the Ultra SYBR Mixture with low ROX (CWbio), as previously described (29). Gene expression was calculated using the 2−ΔΔCt method and Actb expression was used as the internal control. PCR primer sequences used in qPCRs are listed in Supplementary Table 1 and all assays were performed in triplicate.
A widely targeted metabolomics analysis was conducted using UPLC-MS/MS to explore critical biochemical compounds involved in GDD due to the Ano5Cys360Tyr mutation. The stability and precision of the data were verified based on the typical base peak intensity chromatograms of the Ano5+/+ and Ano5KI/KI mCOBs cultured in osteogenic medium for 14 days (Figure 1A). The influence of the Ano5Cys360Tyr mutation on the metabolic patterns of mature mCOBs was analyzed using OPLS-DA model and the result revealed that Ano5KI/KI mCOBs metabolite profiles were clearly distinguished from the wildtype profiles (Figure 1B).
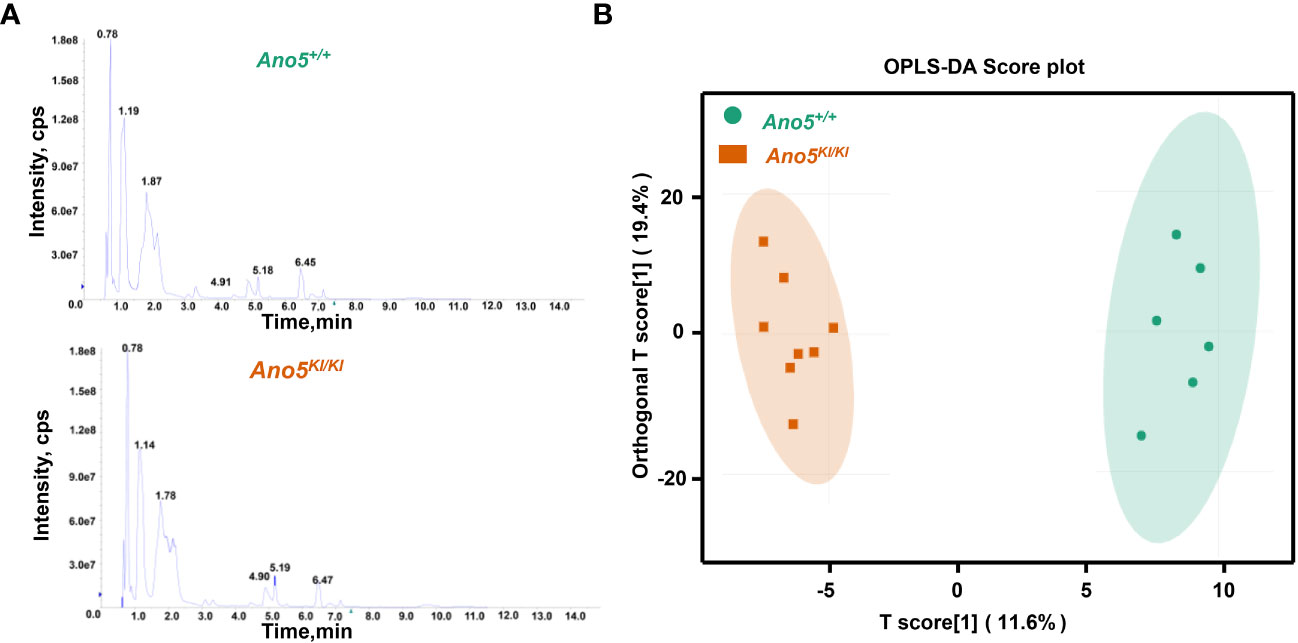
Figure 1 Multivariate statistical analysis of metabolite profiles. (A) Total ion current (TIC) diagram of Ano5+/+ (upper panel) and Ano5KI/KI (lower panel) mCOBs. The X-axis indicating retention time (Rt, min) for metabolite detection and the Y-axis representing ion flow intensity (CPS, count per second); (B) OPLS-DA multivariate statistical analysis. Separation of the Ano5+/+ and Ano5KI/KI groups occurs in the horizontal (T1) direction, while the vertical (orthogonal T1) axis reflects intra-group variability.
Significantly altered metabolites were identified via VIP values from the OPLS-DA analysis using the strict threshold of VIP > 1 and p-values < 0.05 from independent Student’s t-tests to identify significantly different metabolites. A total of 20 down-regulated and 22 up-regulated metabolites were screened out in Ano5KI/KI mCOBs compared with wildtype cultures (Figure 2A and Table 1). The 20 most differential metabolites based on |Log2FoldChange| (|Log2Fc|) values were further scrutinized and comprised calcitriol, carnitine C4:DC, 17a-estradiol, 17β-estradiol, N-acetyl-D-phenylalanine, cytosine, cytidine, DL-phenylmercapto uric acid, and cyclo (Pro-Leu) (Figure S1). To visualize strengths of correlations across differential metabolites, Pearson correlation analysis was conducted and indicated that 31 metabolites were closely associated with calcitriol (|r| > 0.5) and 30 with carnitine C4:DC (|r| > 0.5), suggesting that these two metabolites considerably affected metabolic disturbances in Ano5Cys360Tyr osteoblasts (Figure S2).
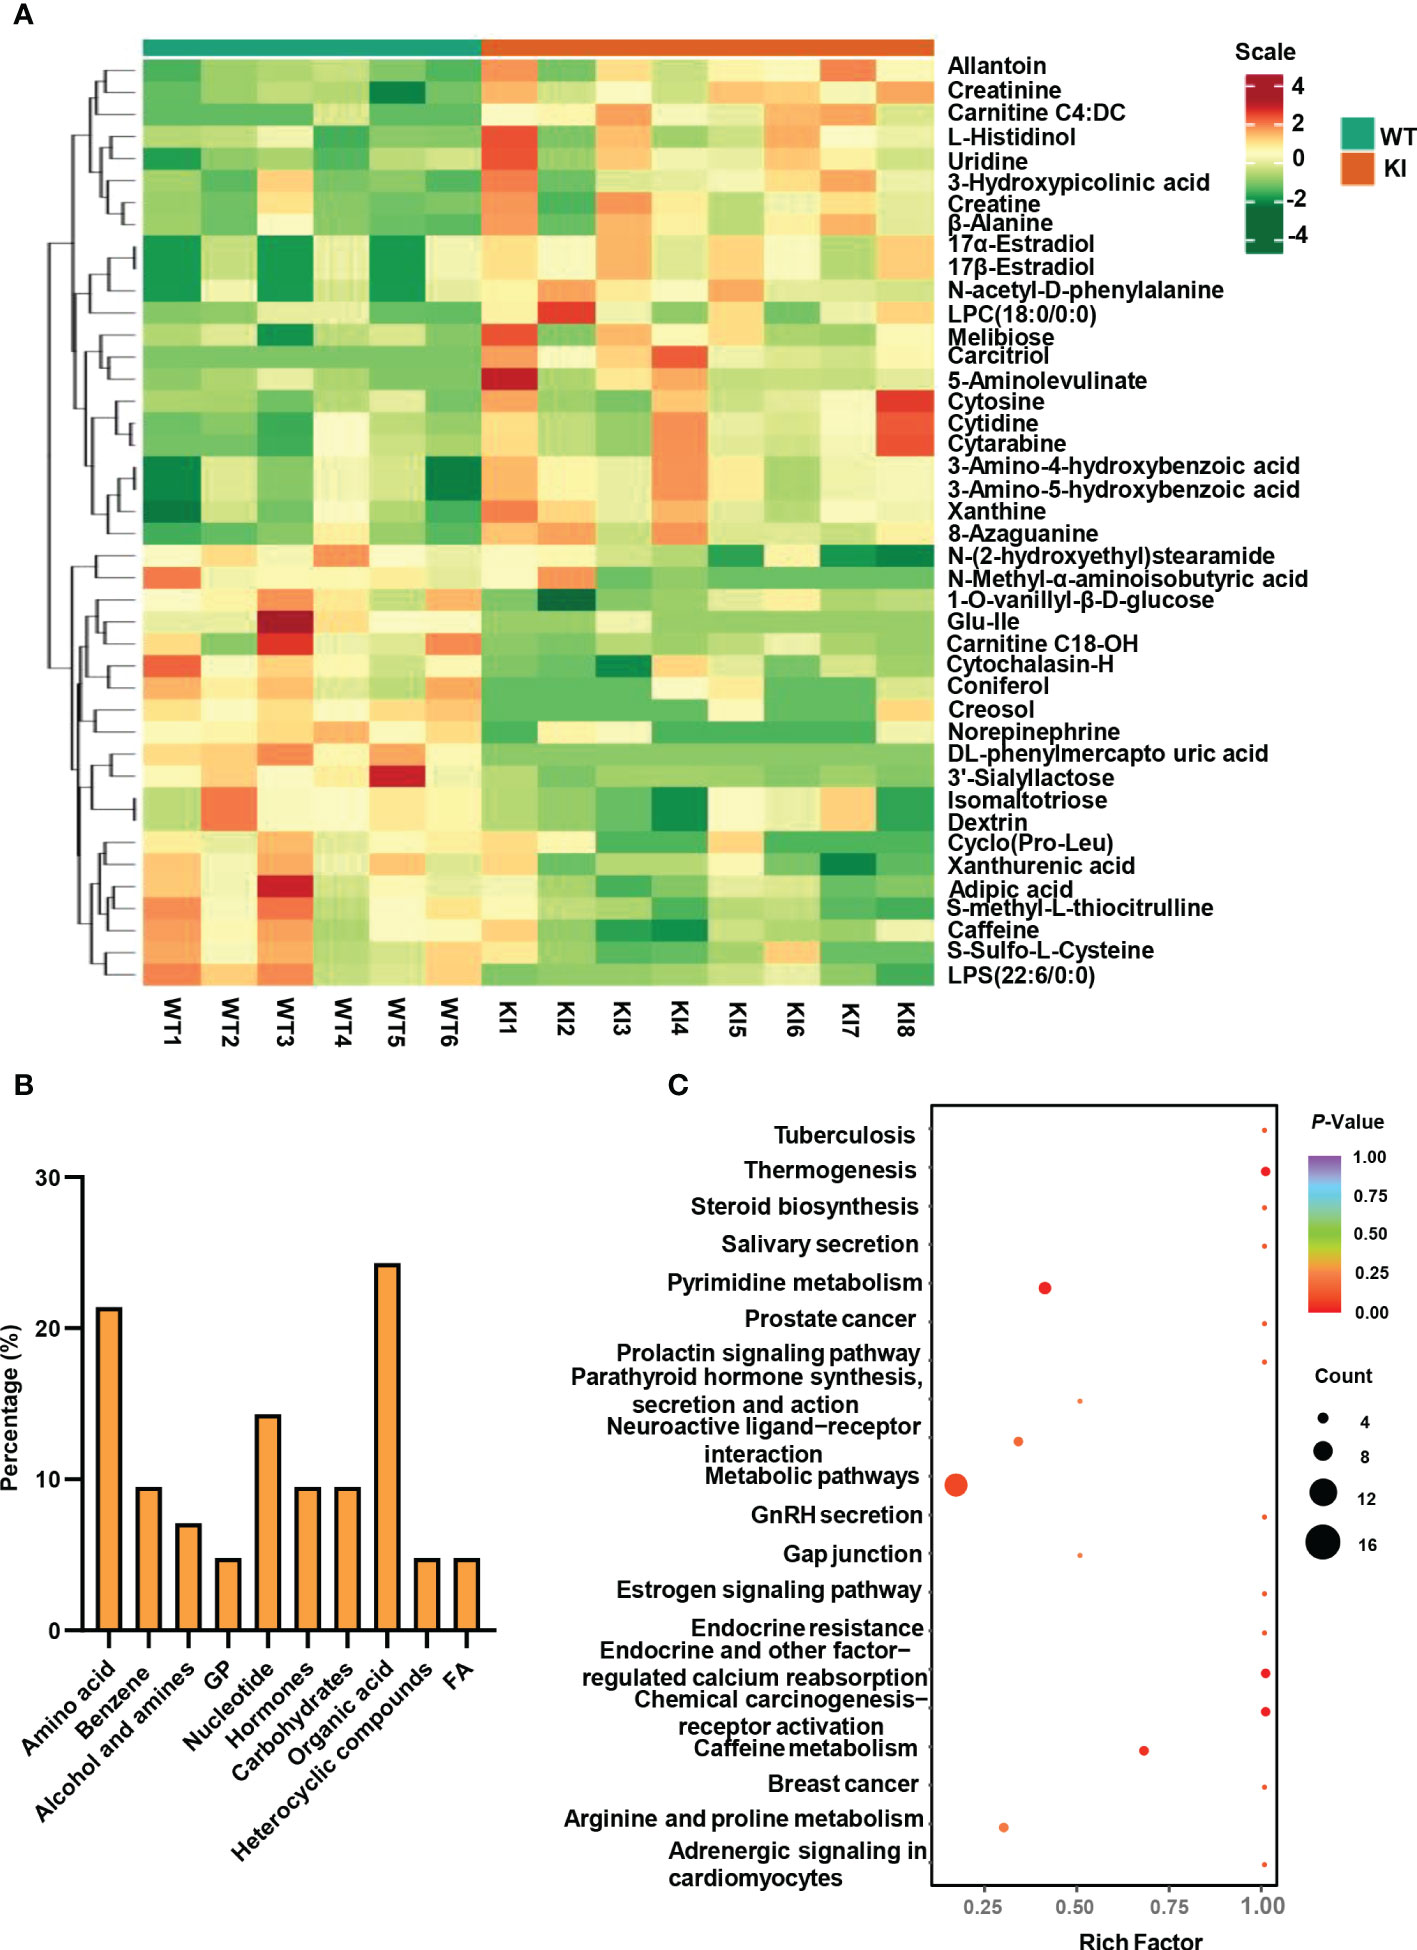
Figure 2 Metabolite analysis of Ano5+/+ and Ano5KI/KI mCOBs. (A) Heat map showing abundances of metabolites with significant differences between Ano5KI/KI and Ano5+/+ mCOBs. Each row represents a sample, and each column represents a metabolite. Orange shows high expression levels and green represents low expression levels. (WT: Ano5+/+; KI: Ano5KI/KI); (B) Bar plot of classification of detected metabolites into major functional classes; (C) Metabolic pathways enriched in Ano5KI/KI mCOBs compared to Ano5+/+ mCOBs. Each bubble represents a metabolic pathway and the size indicates the number of associated metabolites. Different levels of significance are symbolled by the color gradient.
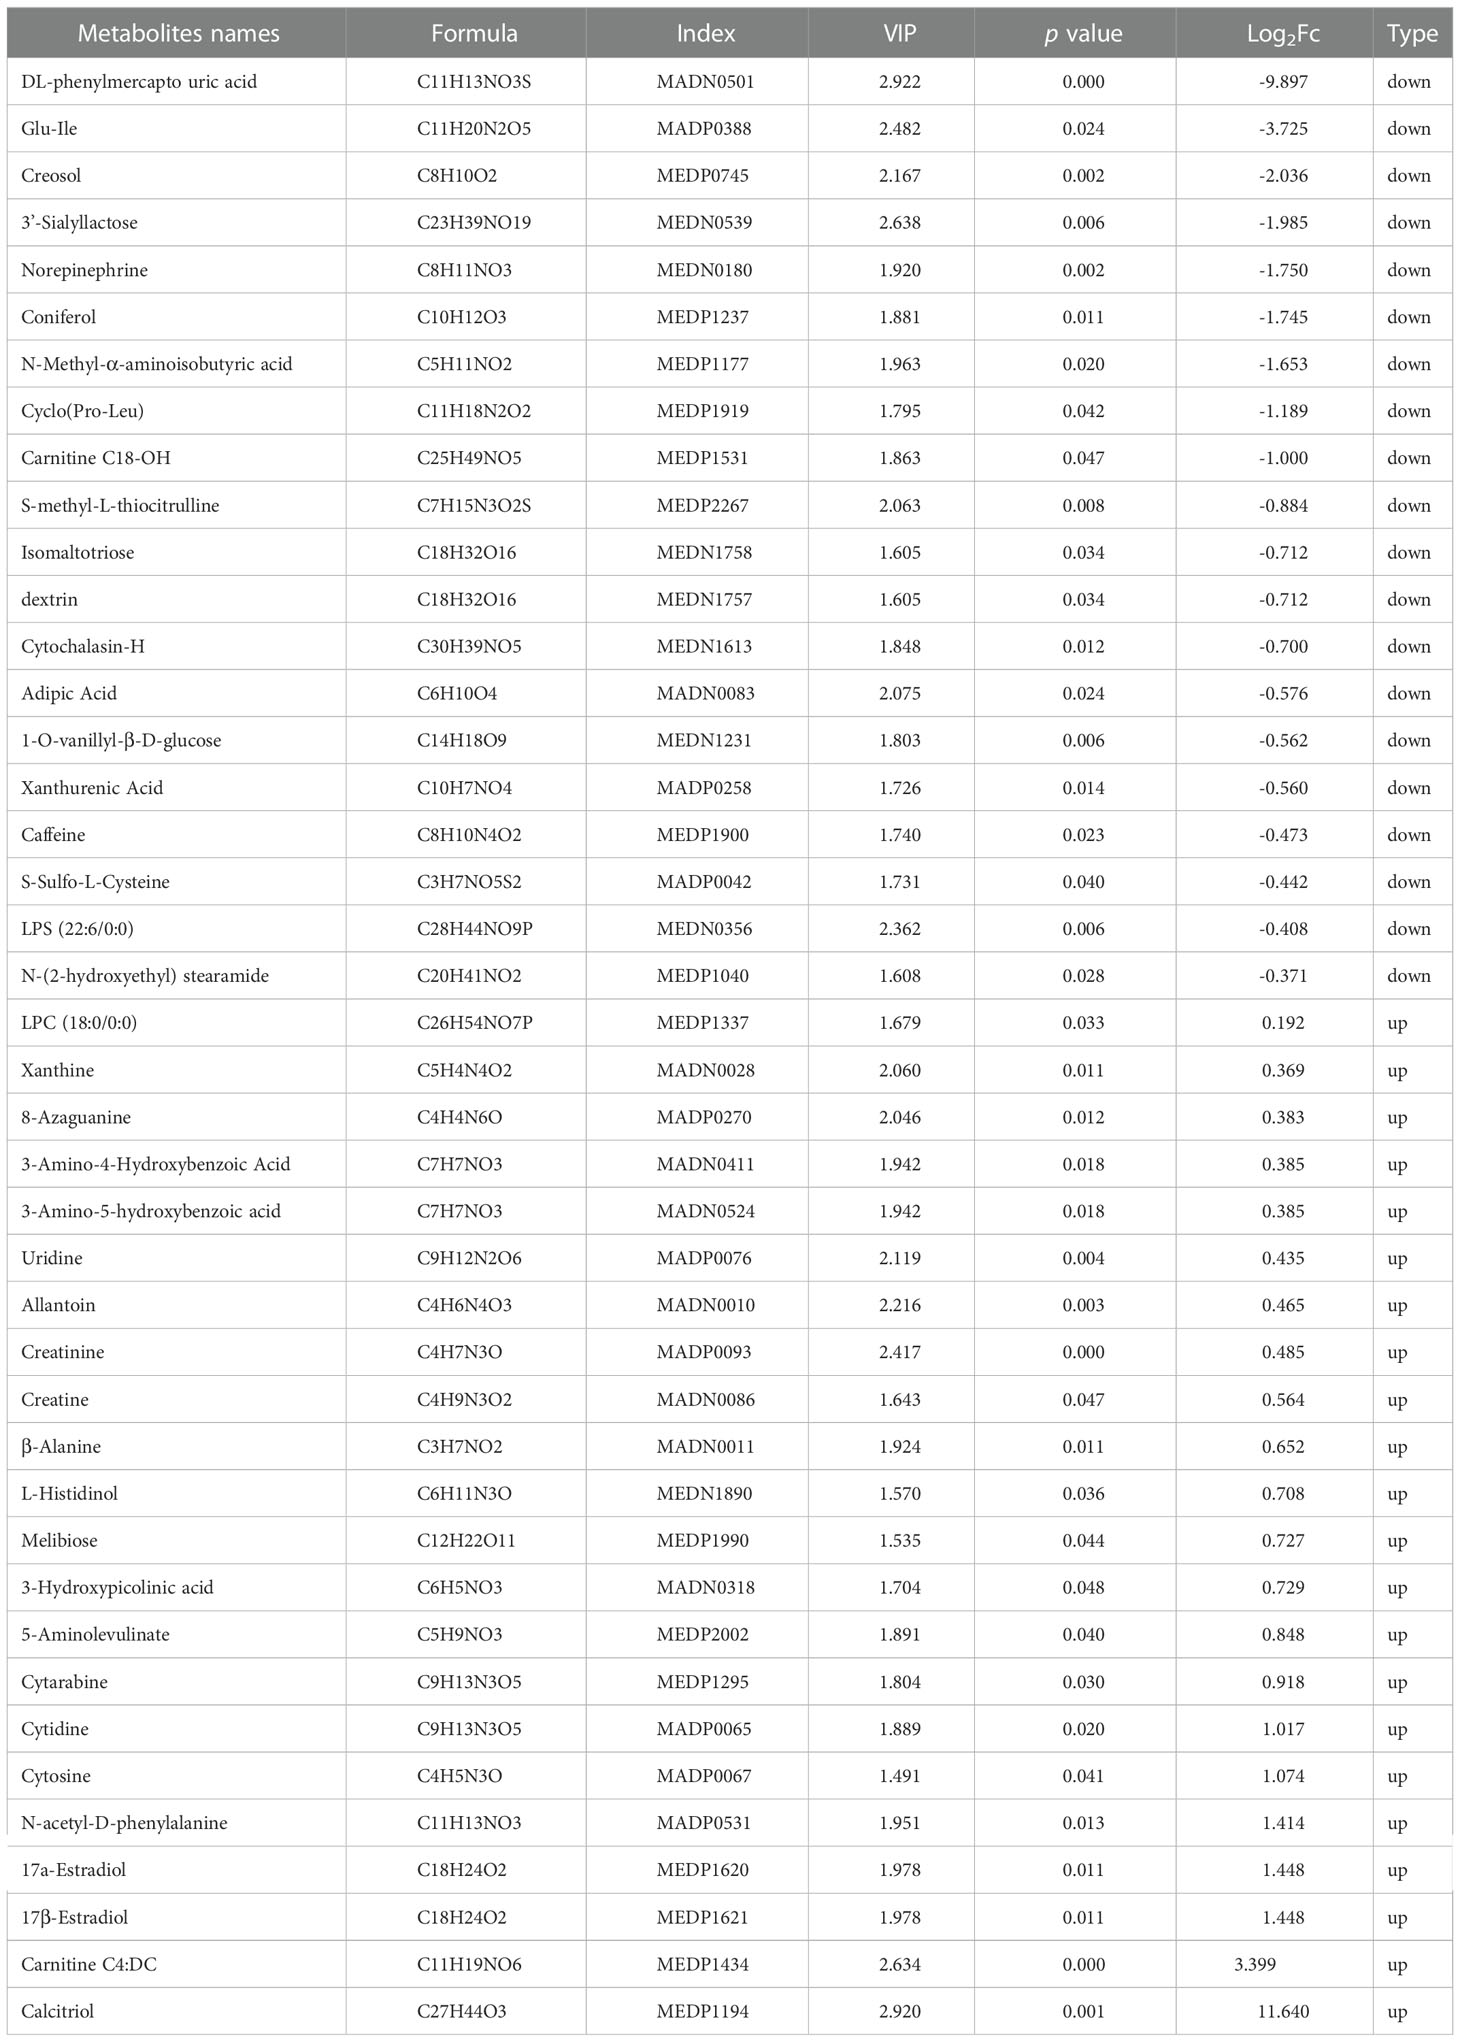
Table 1 Significantly differential metabolites in Ano5Cys360Tyr vs wild type mCOBs.
The 42 differential metabolites belonged to ten classes including amino acid (21.4%), nucleotide (14.3%), organic acid (14.3%), benzene and substituted derivatives (9.5%), carbohydrates (9.5%), hormones and hormone related compounds (9.5%), alcohol and amines (7.1%), fatty acid (FA, 4.8%), glycerophospholipid (GP, 4.8%) and heterocyclic compound (Figure 2B). Collagen structure stability is closely associated with amino acid composition and sequence and thus, the most up-regulated amino acids potentially take part in enhanced bone formation in GDD (30). The metabolic pathways possibly influenced by Ano5Cys360Tyr mutation were explored using metabolite enrichment analysis. A total of 44 metabolic pathways were altered, including pyrimidine metabolism, steroid biosynthesis, parathyroid hormone synthesis, secretion and action, endocrine and other factor-regulated calcium reabsorption, and mineral absorption (Figure 2C). The five most enriched metabolic pathways were highlighted in Table 2, in which the activated metabolism of pyrimidine is positively associated with bone cell growth due to its capacity to provide energy and most metabolic substrates for living organisms (31). Additionally, obvious elevation of calcitriol, belonging to alcohol and amines class of metabolites, involved in endocrine and factor-regulated calcium reabsorption, which also plays a vital role in bone regeneration.
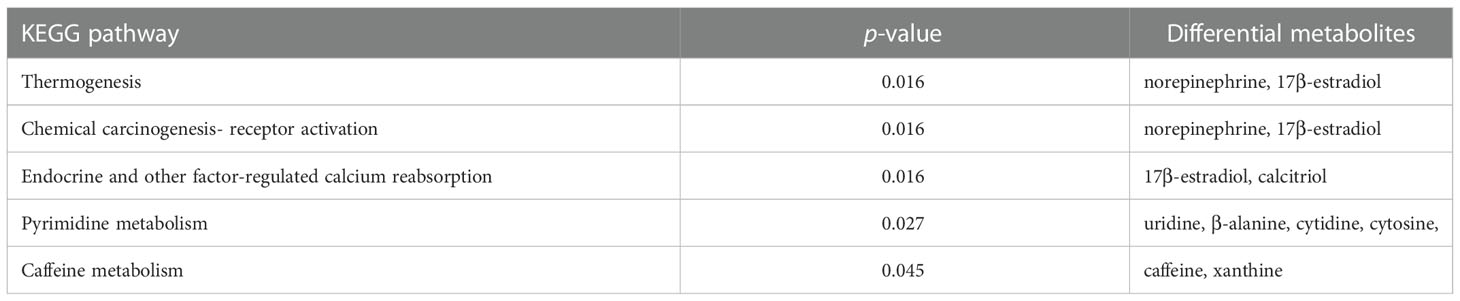
Table 2 The top five altered metabolic pathways in Ano5Cys360Tyr mCOBs compared to wild type mCOBs.
In order to explore the deep root of impaired Ano5KI/KI osteoblast metabolism, the gene expression profiles of mCOBs after 14 days of osteogenic induction from Ano5+/+ and Ano5KI/KI mice were evaluated with RNA-seq. PCA revealed a clear distribution in gene expression profiles between Ano5+/+ and Ano5KI/KI mCOBs (Figure 3A). A total of 407 differentially expressed genes (DEGs) were screened out based on the criteria of fold change >1.2 and p-adj < 0.05. Volcano plots indicated that 239 DEGs were up-regulated and 168 were down-regulated compared to the wild type group (Figure 3B). In addition, the relative levels of DEGs in Ano5+/+ and Ano5KI/KI mCOBs were visualized with a heat map, which also revealed an obviously different clustering (Figure 3C). Based on log2Fc, the top 25 up-regulated DEGs were highlighted in Table 3. Mki67 is a standard marker of cellular proliferation and exhibited an obvious elevation. Cell Division Cycle 25C (Cdc25c) participates in regulating the G2/M transition and mediating DNA damage repair through activating the cyclin B1 (CACNB1)/CDK1 complex (27, 32, 33). Gad2 encodes glutamic acid decarboxylase that is responsible for catalyzing γ-aminobutric acid (GABA) production that has a positive effect on proliferation and osteogenic differentiation of mesenchymal stem cells (34).Simultaneously, Table 4 illustrated the top 25 down-regulated DEGs. Notably, Cytokine-like 1 (Cytl1) depletion exhibited a high bone mass phenotype due to enhanced osteogenesis and inhibited osteoclast activity (35). Sost is a potent negative regulator of bone formation by means of competitive interaction with the low‐density lipoprotein receptor‐related protein (LRP) 5/6 to antagonize WNT signaling (36, 37).
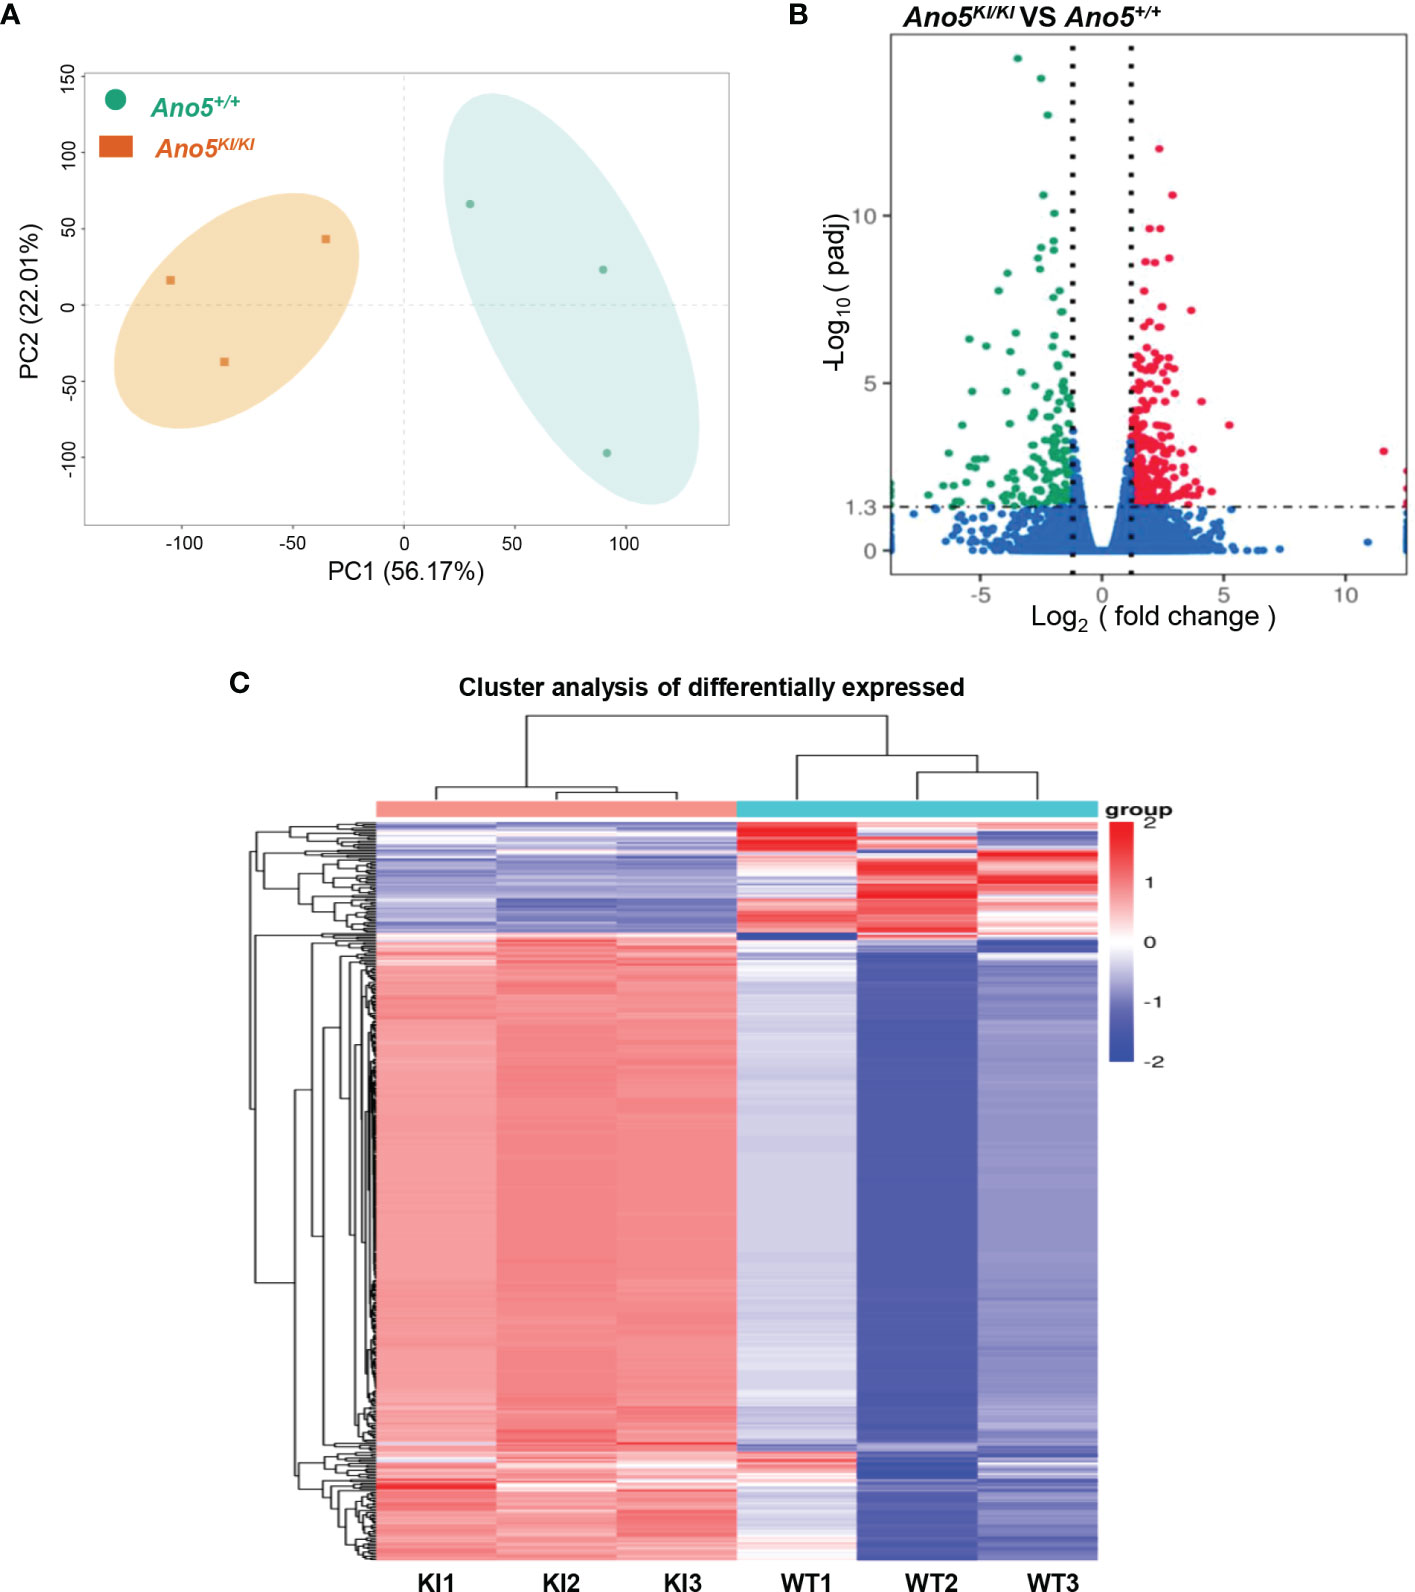
Figure 3 Differential gene expression analysis of Ano5KI/KI (KI) and Ano5+/+ (WT) groups. (A) PCA of DEGs profiles. PC1 and PC2 indicate the degree of interpretation of the principal component analysis model, with the first and second ranked principal components, respectively; (B) Volcano plots of mRNA expression levels. The volcano map is drawn with −log10(padj) as the vertical axis and log2(fold change) as the horizontal axis. The red dots mean up-regulated mRNAs and the blue dots represent down-regulated mRNAs, and the mRNAs with no significant changes were shown in grey dots; (C) Hierarchical heatmap of DEG profiles. Each row represents a sample, and each column represents an mRNA transcript. The color scale (from bright blue to bright red) indicates increasing transcript levels.
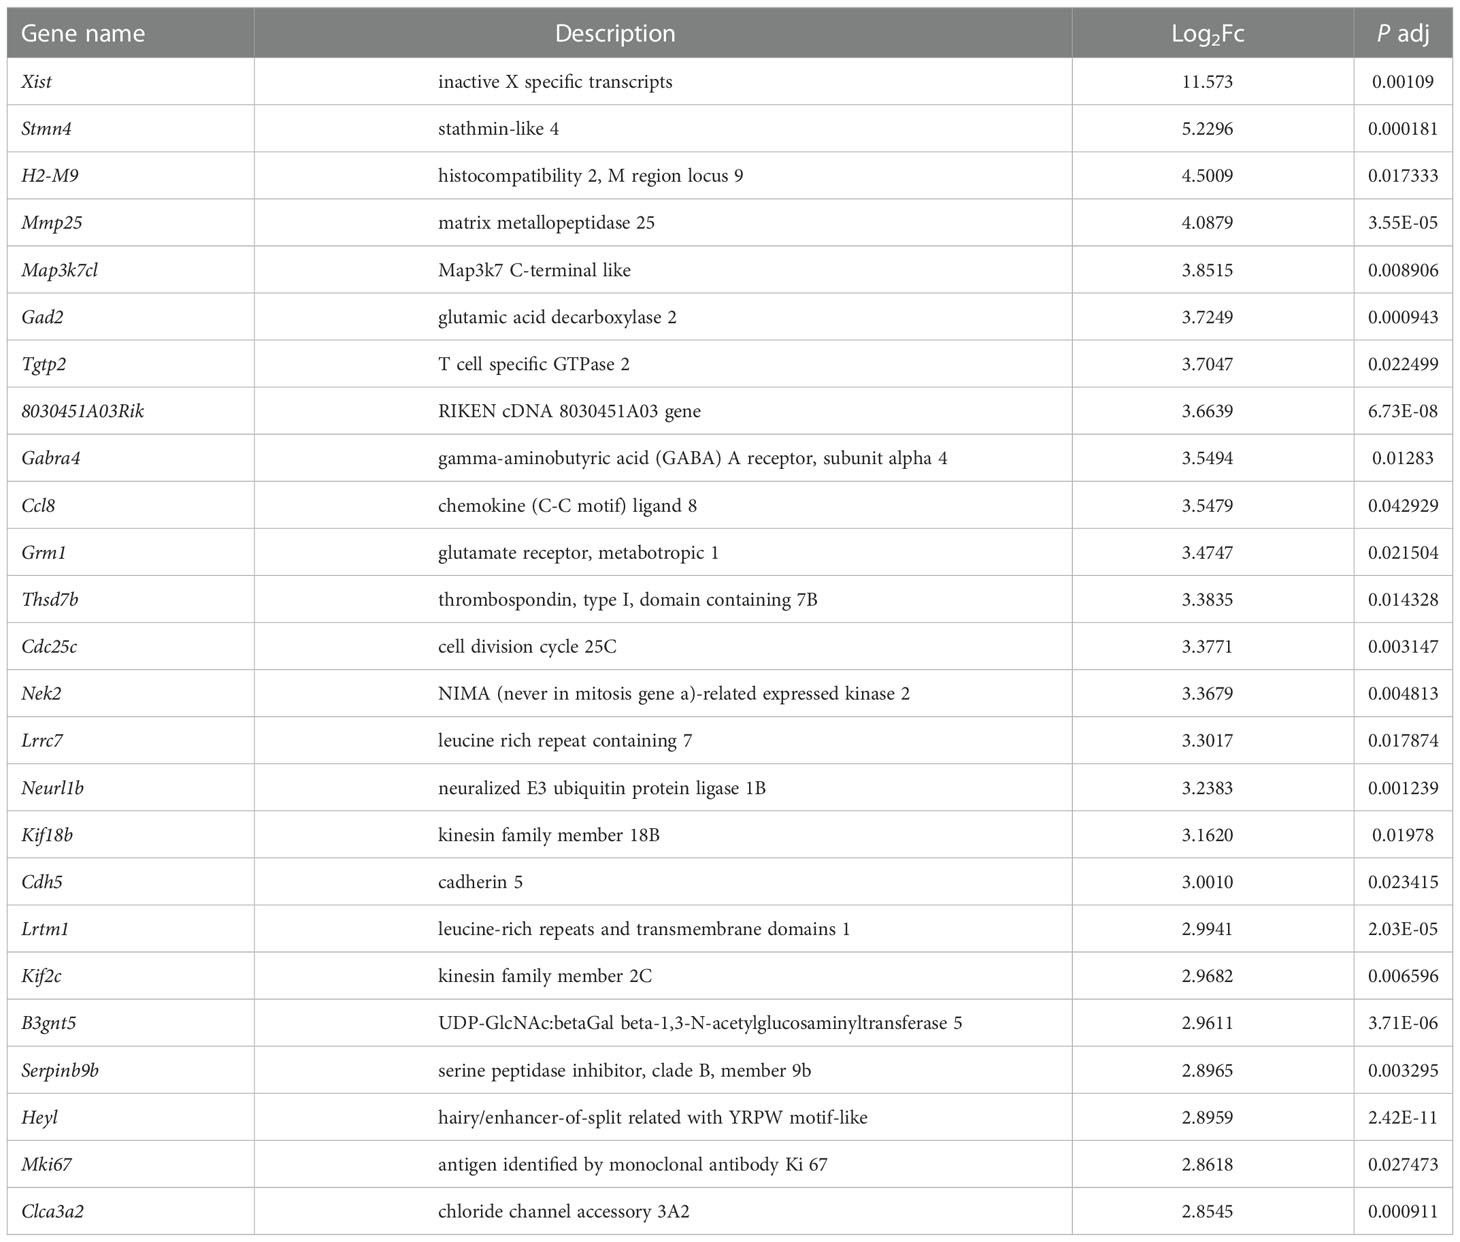
Table 3 The 25 most up-regulated genes in Ano5Cys360Tyr mCOBs.
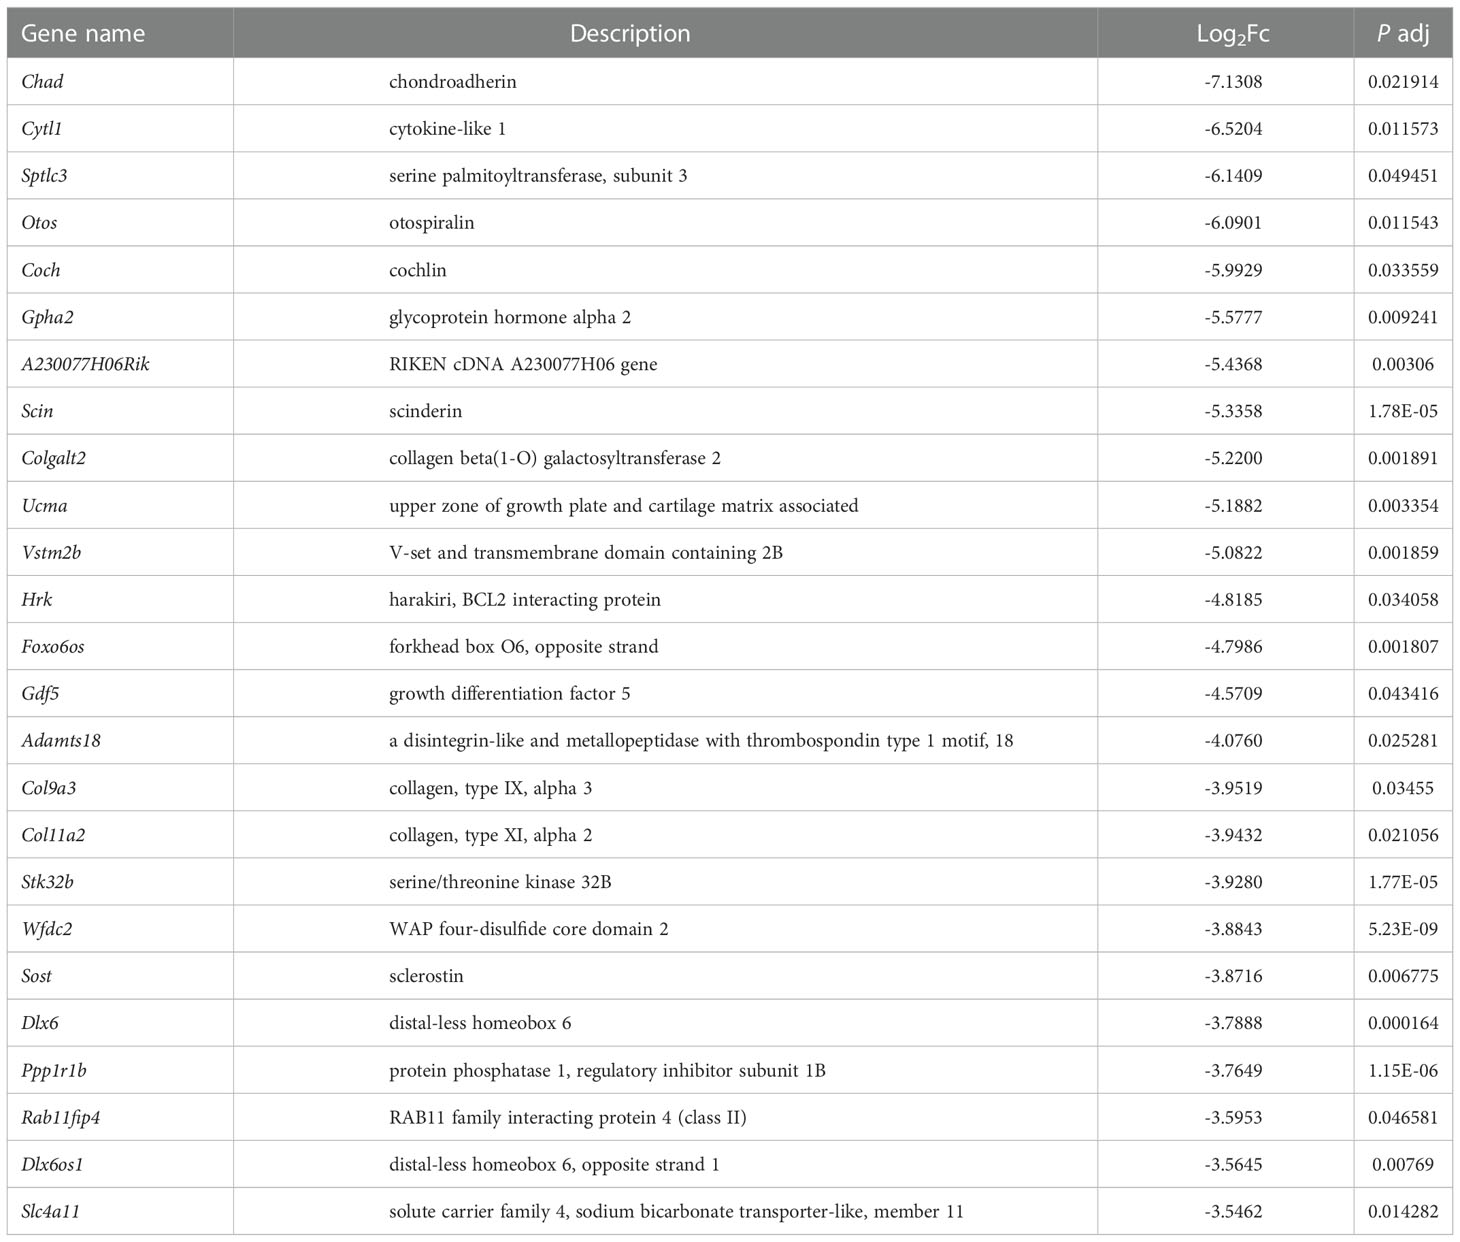
Table 4 The 25 most down-regulated genes in Ano5Cys360Tyr mCOBs.
GO enrichment analysis was used to enrich the function of differentially expressed genes. Only four down-regulated categories were statistically enriched, including skeletal system development, tissue development, extracellular region, and extracellular matrix development (Figure 4A). While 251 significantly up-regulated terms were identified and mainly involved in system development, cell cycle process, and nuclear division (Figure 4B). Functional pathway analysis was also conducted based on KEGG enrichment, although only part of the ECM-receptor interaction signaling pathways exhibited significant down-regulation (Figure 4C). It is worth noting that prominent signaling pathways with elevated tendency were closely associated with osteogenic alteration of Ano5KI/KI mCOBs, including ECM-receptor interaction, protein digestion and absorption, and calcium signaling pathway (Figure 4D).
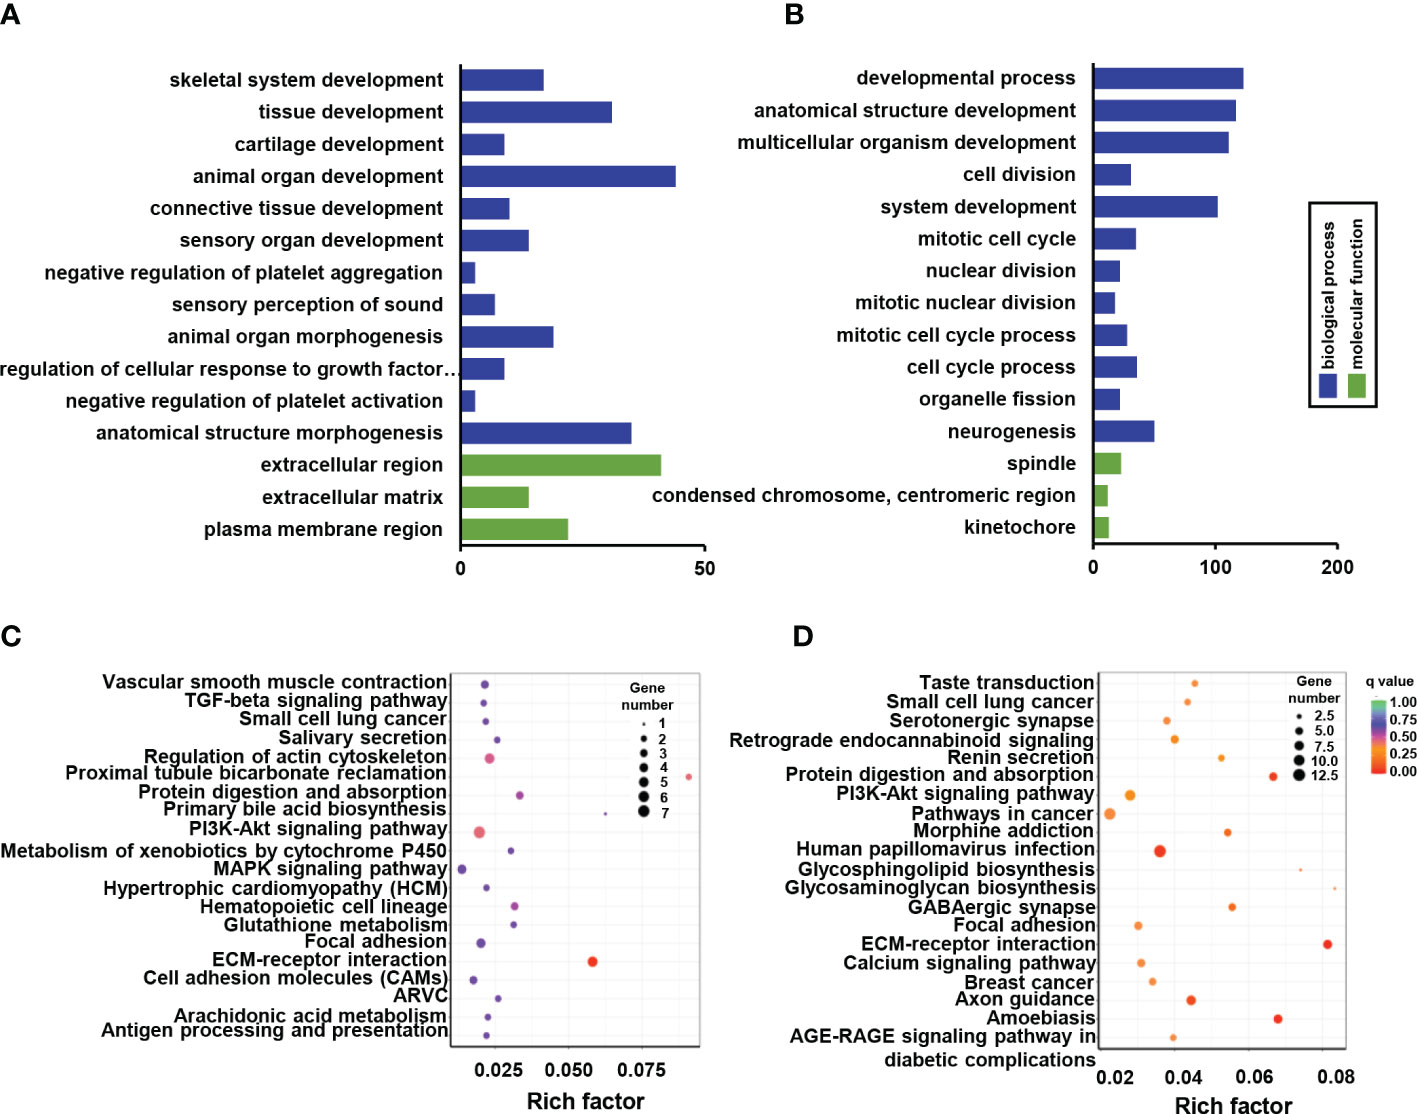
Figure 4 GO and KEGG pathway enrichment of DEGs between Ano5+/+ and Ano5KI/KI groups. (A, B) GO enrichment analysis of down-regulated DEGs (A) and up-regulated DEGs (B), including the categories of biological process (BP) and molecular function (MF); (C, D) KEGG enrichment analysis of down-regulated DEGs (C) and up-regulated DEGs (D).
In order to better understand the correction patterns of among significantly differentiated genes and metabolites, cluster analysis was performed (Figure 5A). Functional enrichment analysis revealed 26 shared pathways of DEGs and differential metabolites as illustrated by the Veen diagram (Figure 5B). The ten most enriched KEGG pathways were particularly scrutinized to reveal critical metabolic processes differing between Ano5KI/KI and Ano5+/+mCOBs (Figure 5C). The analysis indicated that Slc8a1, accompanied by 17β-estradiol and calcitriol that participate in endocrine and other factor-regulated calcium reabsorption. Furthermore, β-alanine metabolism, biosynthesis of amino acids, and mineral absorption may be key processes associated with enhanced osteogensis in GDD.
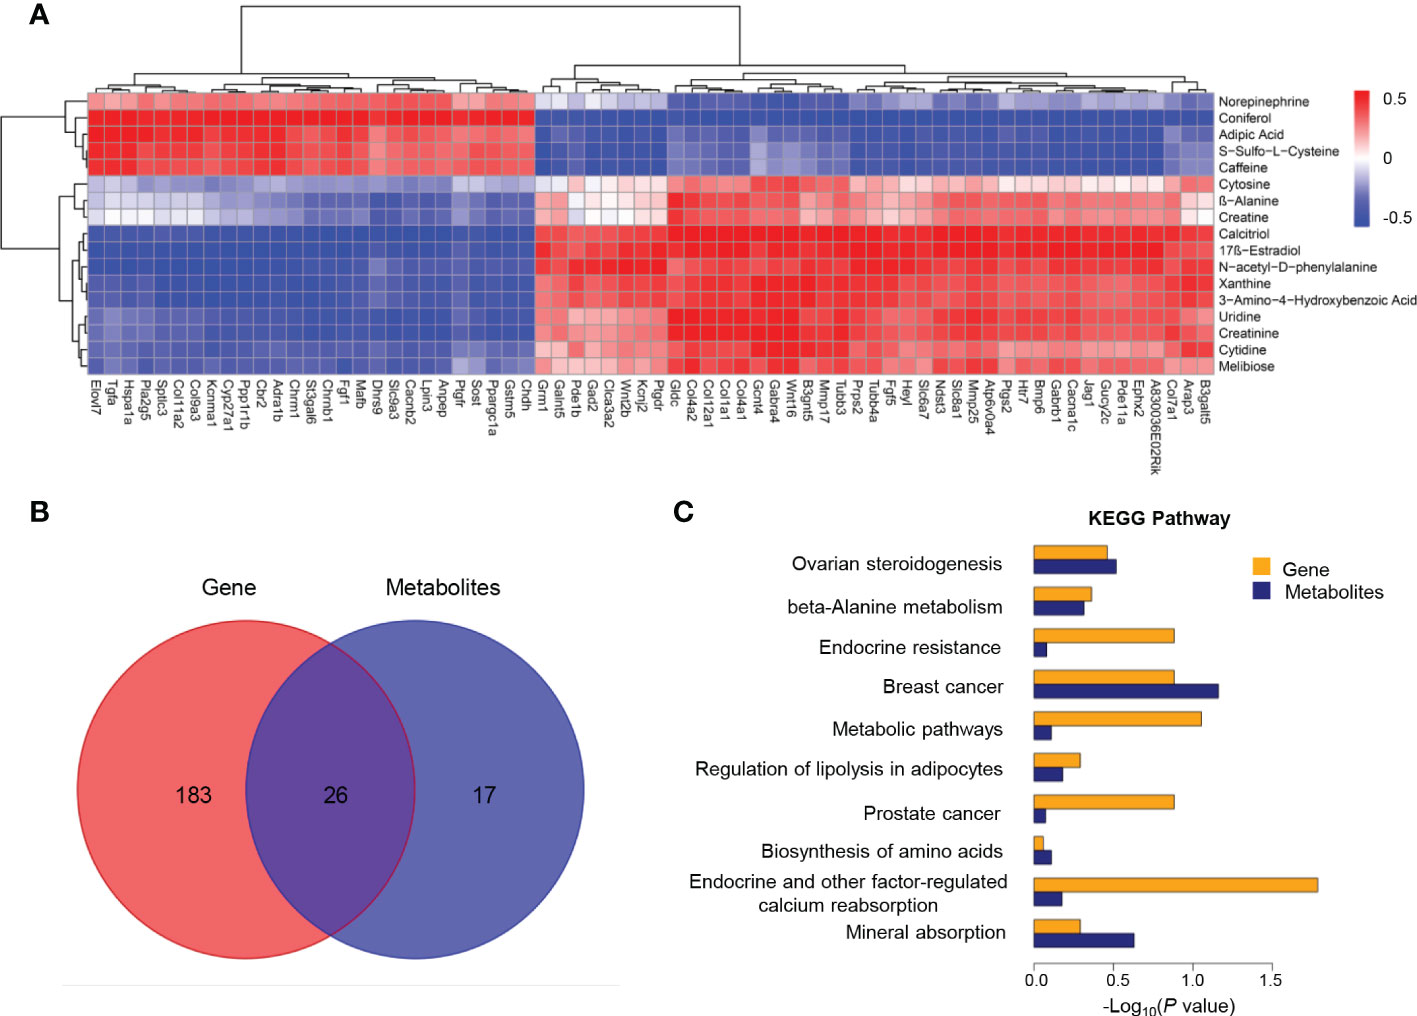
Figure 5 Co-analysis of mCOB transcriptomes and metabolomes. (A) Heat map showing the Spearman correlation hierarchical cluster analysis of DEGs and differential metabolites. Horizontal direction representing genes and the vertical axis showing metabolites; (B) Venn diagram illustrating the overlap of pathways associated with DEGs and metabolites; (C) The top 10 shared KEGG pathways. The horizontal length reflecting FDR value. Blue color for genes and orange for metabolites.
GO analysis implied that cell cycle and nuclear division were abnormally activated in the Ano5KI/KI mCOBs. Therefore, subsequent studies focused on the effects of the Ano5Cys360Tyr mutation on cell proliferation. In addition to Mki67, cyclin A2 (Ccna2), an essential regulator of the G1/S and G2/M transition mediating binding and activating CDK2 (38) was up-regulated in Ano5KI/KI mCOBs based on RNA-seq analysis. Likewise, Ccnb1 that forms a complex with CDK1 to promote the transition from the G2 phase of cell cycle to mitosis was also increased. qRT-PCR further confirmed that the p.Cys360Tyr mutation in Ano5 enhanced expression of those genes in both preosteoblasts at day 0 and mature mCOBs at day 14 after osteogenic induction (Figure 6A). Interestingly, the upward trend was more obvious at day 14. Subsequently, we are driven to disclose the proliferation ability of GDD-related osteoblasts and CCK8 indicated that either preosteoblasts or mature mCOBs from Ano5KI/KI mice grew faster than those from wildtype mice (Figures 6B, C). To explore whether GDD-induced hyperproliferation was associated with cell cycle alternation, we detected the cell cycle distribution of mCOB from Ano5+/+ and Ano5KI/KI mice using flow cytometry to analyze cellular DNA content. mCOBs from Ano5KI/KI mice displayed greater numbers of cells in the G2 phase compared with the wildtype group at day 0 (Figure 6D). Furthermore, Ano5KI/KI mature osteoblasts exhibited decreased cell proportions in the G1 phase and significantly increased abundances of cells in the G2 phase (31.56 ± 0.94 vs. 21.74 ± 0.61) (Figure 6E). In conclusion, these observations suggested that increased osteogenesis in GDD can be partially explained by enhanced Ano5KI/KI osteoblast proliferation.
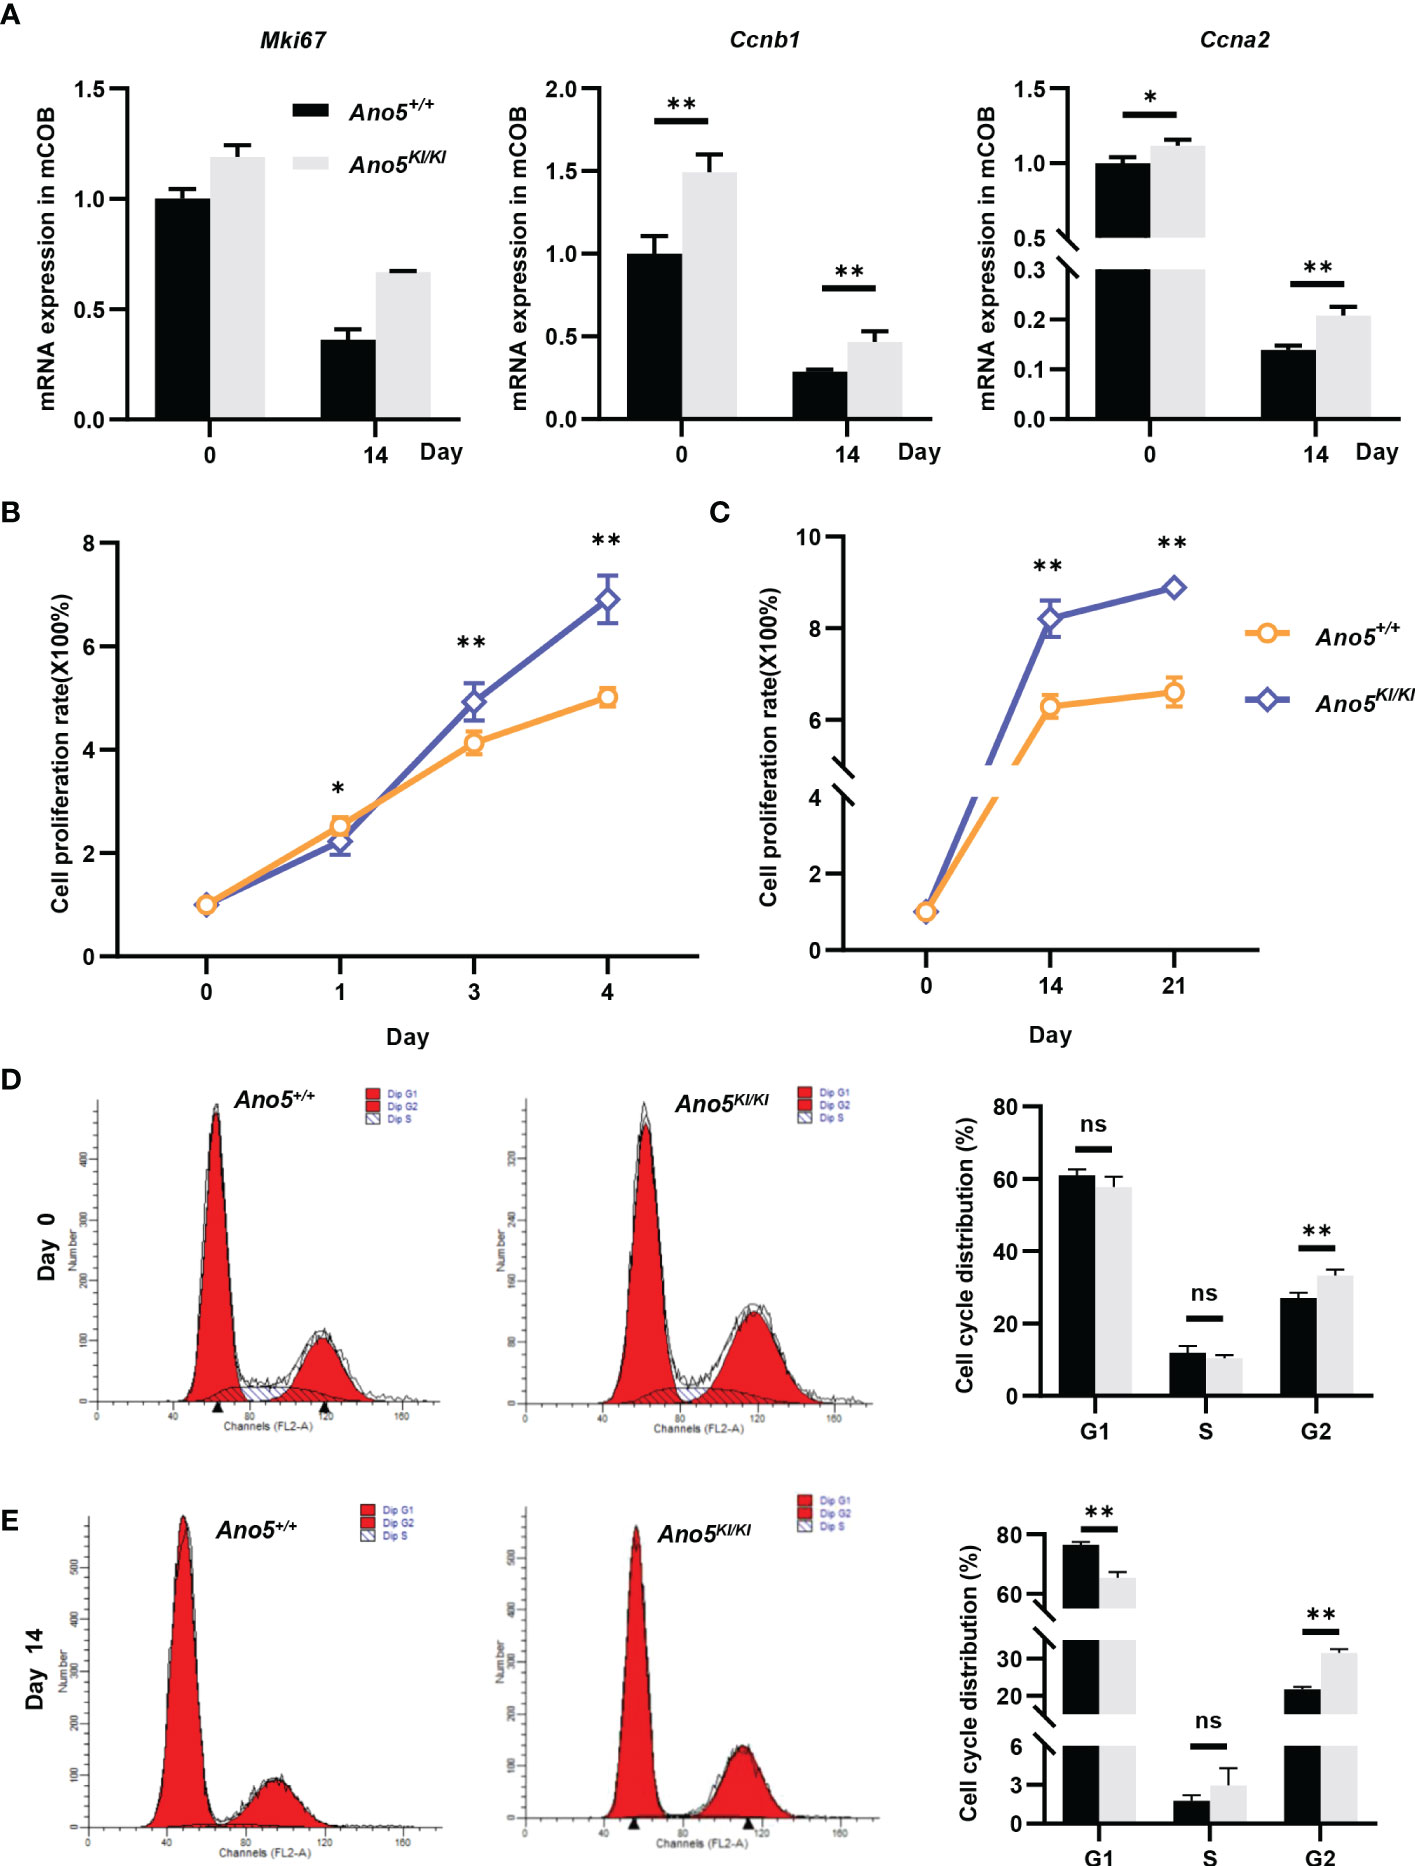
Figure 6 Cellular prolieration and cell cycle analysis in Ano5+/+ and Ano5KI/KI mCOBs. (A) Relative expression of Mki67, Ccnb1, and Ccna2 in Ano5KI/KI compared with Ano5+/+ mCOBs at days 0 and 14 after osteogenic induction; (B, C) Cellular proliferation was evaluated using CCK-8 assays at days 1, 3, and 4 without os Please expand the term "ns" in Figures 6, 7 if applicable Please expand the term "ns" in Figures 6, 7 if applicableteoblast differentiation (B) and at days 14 and 21 with osteogenic induction (C); (D, E) Cell cycle distributions were assessed with flow cytometry at days 0 (D) and 14 after osteogenic differentiation (E). Data were analyzed using Student’s t-tests or one-way ANOVA tests with Dunnett’s multiple comparison tests. ns, no significance; *p < 0.05; **p < 0.01.
GDD lesions are mainly characterized by disturbances in bone regeneration, wherein calcium is a structural inorganic component and plays a prominent role in bone matrix mineralization and osteoblast differentiation. Accordingly, subsequent studies are needed to evaluate calcium signaling in this context. Both transcriptomics and metabolomics analysis suggested that Ano5Cys360Tyr mutation could influence calcium reabsorption and calcium signaling pathways. Further, RNA-seq data also indicated significant up-regulation of solute carrier family 8 member A1 (Slc8a1), calcium voltage-gated channel subunit alpha 1 C (Cacna1c), Htrt1, Grm1, Pde1b, Erbb3, Pdgfra, and Ptk2b combined with down-regulation of Chrm1, Adra1b, and Ptgfr; all resulting in disturbed calcium homeostasis (Supplementary Table 2). Cacna1c is of particular interest, because a specific gain-of-function mutation (G406R) in its encoded protein is responsible for Timothy Syndrome (TS) that is clinically manifested by small teeth and dysmorphic facial features beyond classical cardiac arrhythmia (39). qRT-PCR indicated that the Ano5Cys360Tyr mutation promoted the expression of Cacna1c at days 14 after osteoblast differentiation, although no significant difference was observed at day 0 (Figure 7A). In addition, Slc8a1 was upregulated in Ano5Cys360Tyr mature mCOBs, which participates in calcium transport to the extracellular depending on sodium (Na+) concentration gradients. These trends were further verified by qRT-PCR analysis (Figure 7B). It has been reported that Slc8a1 is regulated by calcitriol also known as active 1,25(OH)2D (1,25-dihydroxy vitamin D), was classically involved in bone homeostasis. An ELISA experiment was further performed and revealed obvious intracellular calcitriol elevation in Ano5KI/KI mCOBs at days 0 and 14, even though the supernatants did not exhibit significant differences (Figure 7C and Figure S3). Calcitriol also plays an important role in the systemic circulation of calcium and phosphate (40). Ano5KI/KI mice manifested a massive up-regulation of serum calcitriol (217.523 ± 98.963 pmol/ml) compared with Ano5+/+ mice (98.026 ± 53.298 pmol/ml) and this was combined with slight phosphate increases, which indicated high bone turnover (Figures 7D, E). Calcitriol is synthesized by the mitochondrial enzyme 25-hydroxyvitamin D-1a-hydroxylase encoded by CYP27B1 using hydroxylation of 25(OH)D3 as the substrate (41, 42). Meaningfully, qRT-PCR showed that Cyp27b1 was significantly elevated in the kidneys of Ano5KI/KI mice and a three-fold increase in Cyp27b1 mRNA accumulation was also observed in Ano5Cys360Tyr mCOBs after 14 days of osteoblast differentiation, but not at day 0 (Figures 7F, G). Some studies have reported that calcitriol and Cyp27b1 cooperatively regulate OCN during osteogenic differentiation (43, 44). Consistently, the protein levels of OCN, the most abundant non-collagenous bone matrix protein that is specifically synthesized by osteoblasts, was elevated in differentiated Ano5KI/KI mCOBs (Figure 7H).
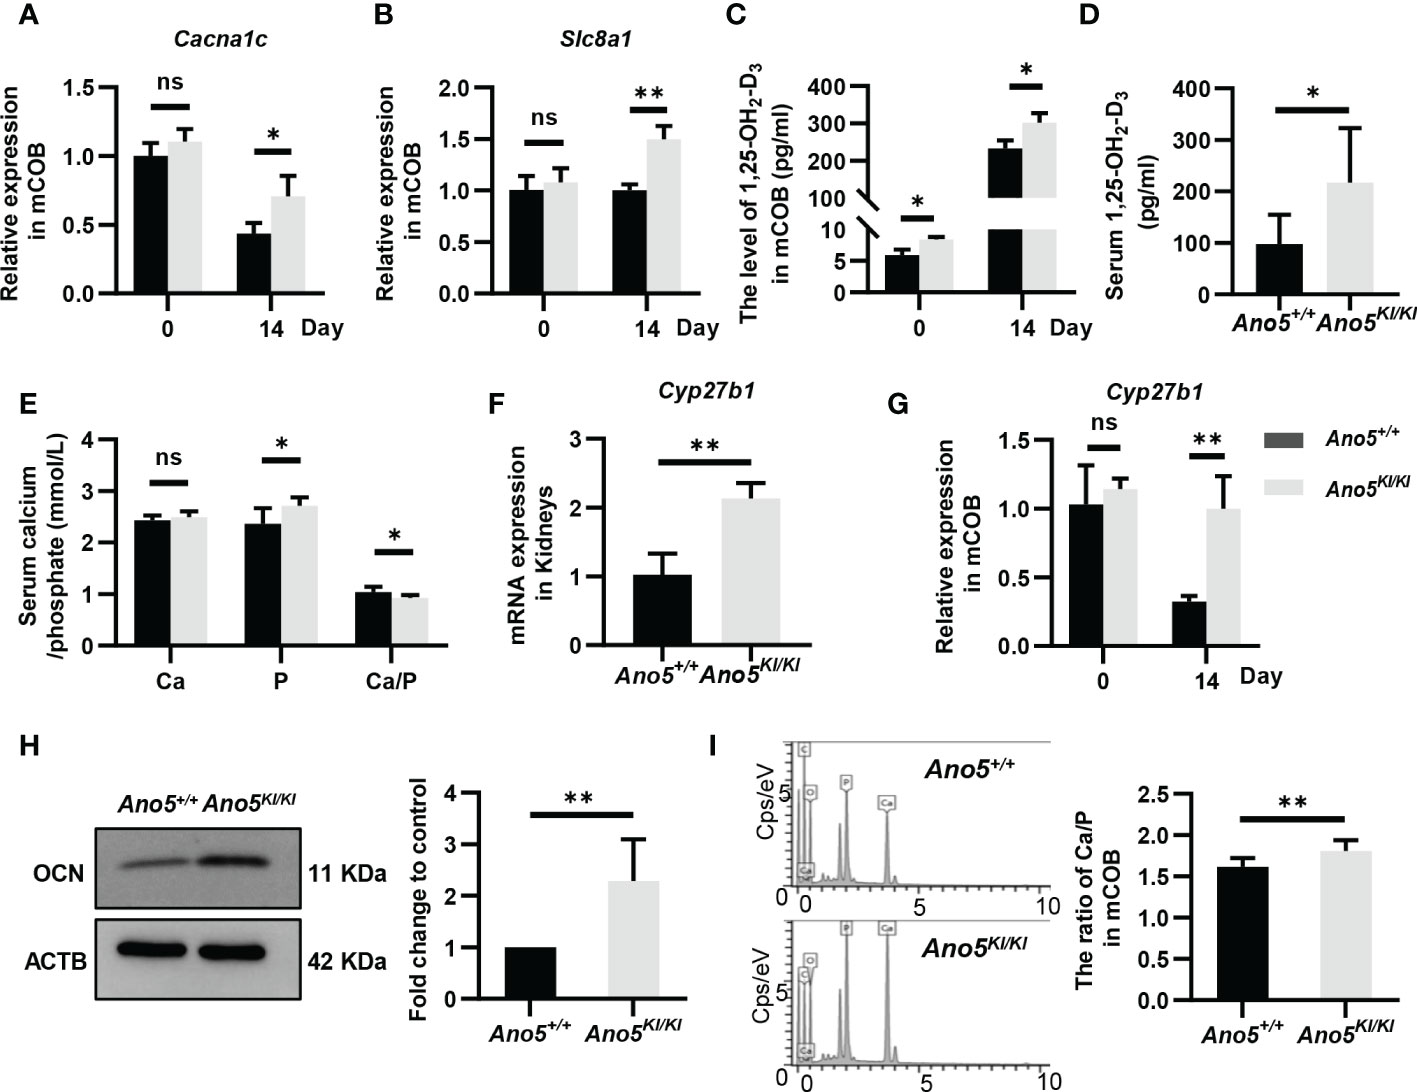
Figure 7 Detection of calcium-related genes and calcium content in mineral nodules. (A, B) Relative expression of Cacna1c and Slc8a1 in Ano5KI/KI mCOBs at days 0 and 14 normalized to levels in Ano5+/+ cells; (C) Calcitriol levels (pg/ml) were measured by ELISA in intracellular of mCOBs from Ano5+/+ and Ano5KI/KI mice at days 0 and 14 after osteogenic induction; (D, E) Serum calcitriol, calcium, phosphate contents in Ano5+/+ and Ano5KI/KI male mice (n=10) at 16 weeks of age; (F) qRT-PCR analysis of Cyp27b1 in kidneys of Ano5+/+ and Ano5KI/KI male mice (n=4); (G) Relative expression of Cyp27b1 in Ano5KI/KI mCOBs at days 0 and 14 normalized to levels in Ano5+/+ cells; (H) Immunoblotting and quantitative analysis of OCN in Ano5KI/KI compared with Ano5+/+ mCOBs after 14 days of osteogenic induction; (I) The distribution of elements detected by energy dispersive X-ray spectroscopy and ratio of calcium and phosphate in the mineralized matrix of Ano5+/+ and Ano5KI/KI cultures. Data were analyzed using t-tests or one-way ANOVA tests with Dunnett’s multiple comparison tests. ns, no significance; *p < 0.05; **p < 0.01.
The fact of calcium signaling alteration provides a reasonable explanation for lower levels of free calcium in the cytoplasm of Ano5Cys360Tyr mCOBs compared to Ano5+/+ mCOBs as we previously observed (29). In the present study, SEM-EDS were further performed to measure the contents of calcium and phosphorous in mineralized nodules. The ratio of calcium versus phosphorous was higher in Ano5Cys360Tyr than Ano5+/+ mCOBs (Figure 7I). This phenomenon implies that Ano5Cys360Tyr mutation may perturb calcium balance between extracellular environments and the cytoplasm, leading to enhanced bone formation that can be attributed to up-regulation of calcitriol and Cyp27b1 expression.
We previously successfully built a knock-in mouse model equivalent of the ANO5 p.Cys360Tyr mutation, which displayed some bone phenotypes consistent with GDD patients, including gross thickening of cortical diaphysis, increasing bone fragility, and enhanced serum ALP levels. Most importantly, mCOB cultures from Ano5Cys360Tyr mice exhibited aberrant enhancement of osteogenic differentiation and matrix mineralization (29). Various metabolic pathways are highly coordinated that participate in bone formation and maintain bone homeostasis. However, it remains unclear how the ANO5 dominant mutation excessively activates bone formation. Systematic observations on differential gene expression and metabolic pathways were conducted between wild type and Ano5KI/KI mature mCOBs after 14 days of osteogenic induction to establish a comprehensive understanding of the molecular mechanisms underlying enhanced osteogenesis in GDD.
GDD-related ANO5 mutations result in disturbed bone lesions and thus, calcium metabolism was a focus of our present study due to its role in the fate of osteoblasts and the formation of bone matrix. Bone is the largest store for calcium and exists in the form of calcium phosphate hydroxyapatite [Ca10(PO4)6(OH)2]. Consequently, calcium has long been regarded as a fundamental component of preventing and treating osteoporosis (45). A previous study revealed that the C356R and C356G mutations of ANO5 induced rounded cell morphologies that could occur due to excessive calcium release from the endoplasmic reticulum (4). Additionally, an Ano5 deficiency disturbs the ability of endoplasmic reticulum to clear injury-triggered calcium accumulation, which is associated with blocked plasma membrane repair and serves as an important pathological mechanism dedicated to muscular dystrophies - limb girdle muscular dystrophy type 2L (LGMD2L) and Miyoshi myopathy type 3 (MMD3) caused by ANO5 recessive mutations (46, 47). However, the direct effects of ANO5 mutation on calcium homeostasis in osteoblasts have not been clarified. The SEM-EDS analyses of this study indicated a higher ratio of calcium versus phosphate in mineral nodules from Ano5KI/KI mCOB cultures that were accompanied by decreased free calcium levels in the cytoplasm. Although there is upregulation of some genes responsible for calcium influx, including Cacna1c and Pdgfra, we speculated these dynamics could be mainly attributed to upregulation of Slc8a1, one of the vital regulators of Ca2+ homeostasis, which could facilitate two calcium efflux and three Na+ influx depending on gradients of transported ions and membrane potentials. It is reported that ANO6, the closest paralog of ANO5, activates SLC8A1 to promote osteogenesis, in which the potential imbalance caused by SLC8A1 requires ANO6-mediated Ca2+ activated anion currents to compensate (48), and thus we speculated that an ionic equilibrium in GDD-related osteoblasts may be achieved by coordination of enhanced Slc8a1 and ANO5 gain of function of Ca2+ dependent outwardly rectifying ionic currents as reported by Anna using HEK293T cell lines (7). However, the regulatory outcome of Ano5Cys360Tyr mutation in calcium homeostasis requires more comprehensive exploration.
Notably, our integrated analysis indicated that calcitriol, estradiol, and Slc8a1, cooperatively interact to disturb calcium homeostasis in Ano5Cys360Tyr mCOBs. Both metabolomics and ELISA analysis demonstrated that the p.Cys360Tyr mutation led to massive elevation of calcitriol levels in mCOBs. While we failed to collect biochemical index of 25(OH)D3 from in the Han GDD patient, Ano5KI/KI mice manifested higher calcitriol levels in serum and Cyp27b1 expression in kidneys than wild type mice, which indicated that the generation of calcitriol from 25(OH)D3 was facilitated. Importantly, serum 25(OH)D3 concentration, one of the most reliable biomarkers of calcitriol metabolic status, is decreased in GDD patients caused by p.Ser500Phe and p.Arg597Ile mutations in ANO5, which is a manifestation of increased calcitriol synthesis (14, 49). It is worth noting that calcitriol is involved in calcium reabsorption and mineral deposition by activating calcium channels so as to play a vital role in bone regeneration. Calcitriol can stimulate the absorption of calcium and phosphate in the small intestine, leading to generation of optimal circumstances for matrix mineralization (43, 50–52). More and more scholars have recommended adequate 1,25(OH)2D3 uptake to prevent osteoporosis, wherein its anti-aging mechanism depends on promoting matrix mineralization and preventing bone resorption (53). In addition to bone formation, calcitriol also plays a critical role in osteoclast differentiation and even bone resorption, which relies on whether it regulates osteoclastogenesis in a direct manner or mediated by osteoblast-secreted RANKL and osteoprotegerin (OPG) (54). Based on the higher ratio of OPG/RANKL and impaired osteoclastogenesis in Ano5KI/KI mice compared to wild type individuals, it is reasonable to speculate that increased calcitriol is crucial for bone turnover underlying GDD. In order to explore the mechanisms contributing to excessive production of calcitriol caused by the Ano5Cys360Tyr mutation, we detected the expression levels of fibroblast growth factor 23 (Fgf23) that is primarily secreted by osteoblasts and osteocytes and regulates phosphate homeostasis and calcitriol metabolism (43), while result showed both its expression in mCOB and serum FGF23 level were comparable between Ano5+/+ and Ano5KI/KI group (Figure S4). In addition to FGF23, elevated serum phosphate may be attributed to abnormal metabolism of calcitriol and parathyroid hormone, and the specific mechanism remains to be further explored. Moreover, elevated Cyp27b1 expression was observed in mature Ano5KI/KI osteoblasts, which is identical to previous reports that the overexpression of CYP27B1 in osteoblasts leads to increased bone volume, consistent with the bone phenotype of Ano5KI/KI mice. Both calcitriol and Cyp27b1 could stimulate the expression of 25-hydroxyvitamin D 24-hydroxylase (Cyp24a1) (44), which was consistently up-regulated in both Ano5KI/KI osteoblasts at day 14 and kidneys of Ano5KI/KI mice to attenuate the excessive calcitriol activity (Figure S5). Interestingly, Ano5KI/KI mature osteoblasts exhibited profound increases in OCN protein levels that is a downstream factor of calcitriol and located in intrafibrillar or interfibrillar regions of mineralized nodules to participate in the formation of crystal thickness, shape, and orientation. More importantly, OCN is a osteoblast-specific secreted hormone, which stimulates the production and secretion of insulin, but also favors glucose and fatty acid homeostasis to provide an an interaction point between calcium and energy metabolism (55).
Apart from osteogenic differentiation, calcitriol has a crucial impact on cellular growth. Many lines of evidence have indicated that 1,25(OH)2D3 could contribute to promoting proliferation of bone ancestor cells, such as stem cells from the apical papilla and human bone marrow mesenchymal stem cells (43, 56). Additionally, ANO5 is known to participate in proliferation of myoblasts and some cancer cells (57). Interestingly, Ano5KI/KI mCOBs exhibited an obvious enhancement in proliferation ability regardless of whether osteogenesis was induced, as was consistently observed in Ano5 knockout osteoblasts (data not shown). All somatic cells proliferate determined by the cell cycle via mitotic processes that were correspondingly up-regulated in Ano5KI/KI mCOBs, as suggested by GO analysis. Nevertheless, cellular division is a complex process that is tightly controlled by the coordinated action of multiple molecular mechanisms. In addition to Mki67, RNA-seq revealed that regulators of the cell cycle like Ccna2, Ccnb1, Bub1b, and Cdc25c were significantly elevated in Ano5KI/KI mCOBs compared to Ano5+/+ mCOBs. Accordingly, Ano5KI/KI mCOBs at days 0 and 14 displayed significantly prolonged G2 phases accompanied by elevated Ccna2 and Ccnb1 expression that promotes the transition from the G2 phase to mitosis (32, 38). A slightly declined G1 phase in Ano5KI/KI mature mCOBs may be mediated by Ccna2 up-regulation that is also responsible for the G1/S transition. The heightened activity of cellular growth was supported by plentiful metabolic substrates, as indicated by heightened purine and pyrimidine metabolism that could provide necessary components for RNA and DNA biosynthesis (31). Over 10 purine antimetabolites have been approved for cancer treatments, which provides potential prospects for GDD treatment (58).
Abundant energy-generating capacity is indispensable for osteoblasts to facilitate proliferation and differentiation. In addition to glucose utilization, long-chain fatty acid β-oxidation is also an important energy source for osteoblasts to promote bone formation. The clearly decreased expression levels of Sost as shown in RNA-seq results, indicated that β-oxidation of fatty acids may be excessively stimulated by the Ano5Cys360Tyr mutation that is mediated by activated WNT-LRP5 signaling (59). Notably, carnitine C4:DC is involved in the transport of acetyl-CoA into mitochondria to generate ATP and was highly enriched by approximately 10-fold in Ano5KI/KI mCOBs compared to Ano5+/+cultures. We also noticed that the p.Cys360Tyr mutation in Ano5 exhibited a momentous impact on amino acid metabolism. β-alanine levels are positively correlated with high BMD in human (60) and were emerging in mCOBs from mice expressing the Ano5Cys360Tyr mutation. β-alanine exerts a key influence on bone formation primarily by promoting insulin production that further improves osteoblast proliferation, differentiation, and collagen synthesis. In addition to alanine, L-histidine also is a key component of the collagen spiral structure and metabolized by histidinol dehydrogenase using the substrate L-histidinol, which showed an increased tendency in Ano5 knock-in mCOBs (30). Overall, the metabolic disorders of energy metabolism observed here provide avenues for exploring the mechanisms underlying GDD particularly including enhanced cell proliferation, aberrant matrix mineralization, and abnormal collagen arrangement in diaphysis.
To our knowledge, this is the first study to conduct a comprehensive multi-’omics integrative analysis to systematically assess the mechanisms underlying abnormal osteogenesis caused by GDD-related mutations using the Ano5Cys360Tyr mouse model. The data indicates that alterations of amino acid, fatty acid, and purine metabolism, combined with abnormal calcium-related signaling pathway may be responsible for promoting osteoblast proliferation and differentiation due to GDD-related mutations. Further investigations targeting key downstream molecular and signaling pathways of ANO5 would be promising avenues to identify effective therapeutic targets.
The datasets presented in this study can be found in online repositories. The names of the repository/repositories and accession number(s) can be found below: https://www.ncbi.nlm.nih.gov/, PRJNA899301.
The animal study was reviewed and approved by Institutional Animal Care and Use Committee of the Beijing Stomatological Hospital (the approval number: KQYY-201611-001).
YH and HL were responsible for the conception and design of the study. HL, SL, and CM contributed data collection. YH, HL, and YL performed formal analysis. YH and HL drafted and revised the manuscript. All authors contributed to the article and approved the submitted version.
This research was funded by the National Natural Science Foundation of China (Grant No. 82071103, Grant No. 81570958).
We gratefully acknowledge all individuals for participating in this study and institutional support from the Beijing Stomatological Hospital, Capital Medical University. We thank Beijing Allwegene Technology Company Limited (Beijing, China) for guidance of omics analysis.
The authors declare that the research was conducted in the absence of any commercial or financial relationships that could be construed as a potential conflict of interest.
All claims expressed in this article are solely those of the authors and do not necessarily represent those of their affiliated organizations, or those of the publisher, the editors and the reviewers. Any product that may be evaluated in this article, or claim that may be made by its manufacturer, is not guaranteed or endorsed by the publisher.
The Supplementary Material for this article can be found online at: https://www.frontiersin.org/articles/10.3389/fendo.2023.1117111/full#supplementary-material
1. Riminucci M, Collins MT, Corsi A, Boyde A, Murphey MD, Wientroub S, et al. Gnathodiaphyseal dysplasia: A syndrome of fibro-osseous lesions of jawbones, bone fragility, and long bone bowing. J Bone Miner Res (2001) 16(9):1710–8. doi: 10.1359/jbmr.2001.16.9.1710
2. Tsutsumi S, Kamata N, Maruoka Y, Ando M, Tezuka O, Enomoto S, et al. Autosomal dominant gnathodiaphyseal dysplasia maps to chromosome 11p14.3-15.1. J Bone Miner Res (2003) 18(3):413–8. doi: 10.1359/jbmr.2003.18.3.413
3. Tsutsumi S, Kamata N, Vokes TJ, Maruoka Y, Nakakuki K, Enomoto S, et al. The novel gene encoding a putative transmembrane protein is mutated in gnathodiaphyseal dysplasia (Gdd). Am J Hum Genet (2004) 74(6):1255–61. doi: 10.1086/421527
4. Tsutsumi S, Inoue H, Sakamoto Y, Mizuta K, Kamata N, Itakura M. Molecular cloning and characterization of the murine gnathodiaphyseal dysplasia gene Gdd1. Biochem Biophys Res Commun (2005) 331(4):1099–106. doi: 10.1016/j.bbrc.2005.03.226
5. Tran TT, Tobiume K, Hirono C, Fujimoto S, Mizuta K, Kubozono K, et al. Tmem16e (Gdd1) exhibits protein instability and distinct characteristics in chloride Channel/Pore forming ability. J Cell Physiol (2014) 229(2):181–90. doi: 10.1002/jcp.24431
6. Pedemonte N, Galietta LJ. Structure and function of Tmem16 proteins (Anoctamins). Physiol Rev (2014) 94(2):419–59. doi: 10.1152/physrev.00039.2011
7. Di Zanni E, Gradogna A, Scholz-Starke J, Boccaccio A. Gain of function of Tmem16e/Ano5 scrambling activity caused by a mutation associated with gnathodiaphyseal dysplasia. Cell Mol Life Sci (2018) 75(9):1657–70. doi: 10.1007/s00018-017-2704-9
8. Suzuki J, Fujii T, Imao T, Ishihara K, Kuba H, Nagata S. Calcium-dependent phospholipid scramblase activity of Tmem16 protein family members. J Biol Chem (2013) 288(19):13305–16. doi: 10.1074/jbc.M113.457937
9. Marconi C, Brunamonti Binello P, Badiali G, Caci E, Cusano R, Garibaldi J, et al. A novel missense mutation in Ano5/Tmem16e is causative for gnathodiaphyseal dyplasia in a Large Italian pedigree. Eur J Hum Genet (2013) 21(6):613–9. doi: 10.1038/ejhg.2012.224
10. Vengoechea J, Carpenter L. Gnathodiaphyseal dysplasia presenting as polyostotic fibrous dysplasia. Am J Med Genet A (2015) 167(6):1421–2. doi: 10.1002/ajmg.a.36986
11. Andreeva TV, Tyazhelova TV, Rykalina VN, Gusev FE, Goltsov AY, Zolotareva OI, et al. Whole exome sequencing links dental tumor to an autosomal-dominant mutation in Ano5 gene associated with gnathodiaphyseal dysplasia and muscle dystrophies. Sci Rep (2016) 6:26440–8. doi: 10.1038/srep26440
12. Duong HA, Le KT, Soulema AL, Yueh RH, Scheuner MT, Holick MF, et al. Gnathodiaphyseal dysplasia: Report of a family with a novel mutation of the Ano5 gene. Oral Surg Oral Med Oral Pathol Oral Radiol (2016) 121(5):e123–8. doi: 10.1016/j.oooo.2016.01.014
13. Jin L, Liu Y, Sun F, Collins MT, Blackwell K, Woo AS, et al. Three novel Ano5 missense mutations in Caucasian and Chinese families and sporadic cases with gnathodiaphyseal dysplasia. Sci Rep (2017) 7:40935–44. doi: 10.1038/srep40935
14. Rolvien T, Koehne T, Kornak U, Lehmann W, Amling M, Schinke T, et al. A novel Ano5 mutation causing gnathodiaphyseal dysplasia with high bone turnover osteosclerosis. J Bone Miner Res (2017) 32(2):277–84. doi: 10.1002/jbmr.2980
15. Zeng B, Liao J, Zhang H, Fu S, Chen W, Pan G, et al. Novel Ano5 mutation C.1067g>T (P.C356f) identified by whole genome sequencing in a big family with atypical gnathodiaphyseal dysplasia. Head Neck (2019) 41(1):230–8. doi: 10.1002/hed.25516
16. Marechal G, Schouman T, Mauprivez C, Benassarou M, Chaine A, Diner PA, et al. Gnathodiaphyseal dysplasia with a novel R597i mutation of Ano5: Mandibular reconstruction strategies. J Stomatol Oral Maxillofac Surg (2019) 120(5):428–31. doi: 10.1016/j.jormas.2019.01.005
17. Shaibani A, Khan S, Shinawi M. Autosomal dominant Ano5-related disorder associated with myopathy and gnathodiaphyseal dysplasia. Neurol Genet (2021) 7(4):e612–7. doi: 10.1212/NXG.0000000000000612
18. Wang X, Liu X, Dong R, Liang C, Reichenberger EJ, Hu Y. Genetic disruption of anoctamin 5 in mice replicates human gnathodiaphyseal dysplasia (Gdd). Calcif Tissue Int (2019) 104(6):679–89. doi: 10.1007/s00223-019-00528-x
19. Suzuki A, Minamide M, Iwaya C, Ogata K, Iwata J. Role of metabolism in bone development and homeostasis. Int J Mol Sci (2020) 21(23):8992–9019. doi: 10.3390/ijms21238992
20. Lee WC, Guntur AR, Long F, Rosen CJ. Energy metabolism of the osteoblast: Implications for osteoporosis. Endocr Rev (2017) 38(3):255–66. doi: 10.1210/er.2017-00064
21. Dirckx N, Moorer MC, Clemens TL, Riddle RC. The role of osteoblasts in energy homeostasis. Nat Rev Endocrinol (2019) 15(11):651–65. doi: 10.1038/s41574-019-0246-y
22. Jennings A, MacGregor A, Spector T, Cassidy A. Amino acid intakes are associated with bone mineral density and prevalence of low bone mass in women: Evidence from discordant monozygotic twins. J Bone Miner Res (2016) 31(2):326–35. doi: 10.1002/jbmr.2703
23. Conigrave AD, Brown EM, Rizzoli R. Dietary protein and bone health: Roles of amino acid-sensing receptors in the control of calcium metabolism and bone homeostasis. Annu Rev Nutr (2008) 28:131–55. doi: 10.1146/annurev.nutr.28.061807.155328
24. Murshed M. Mechanism of bone mineralization. Cold Spring Harb Perspect Med (2018) 8(12):a031229–40. doi: 10.1101/cshperspect.a031229
25. Anderson JR, Phelan MM, Foddy L, Clegg PD, Peffers MJ. Ex vivo equine cartilage explant osteoarthritis model: A metabolomics and proteomics study. J Proteome Res (2020) 19(9):3652–67. doi: 10.1021/acs.jproteome.0c00143
26. Swank KR, Furness JE, Baker EA, Gehrke CK, Biebelhausen SP, Baker KC. Metabolomic profiling in the characterization of degenerative bone and joint diseases. Metabolites (2020) 10(6):223–37. doi: 10.3390/metabo10060223
27. Johnson CH, Ivanisevic J, Siuzdak G. Metabolomics: Beyond biomarkers and towards mechanisms. Nat Rev Mol Cell Biol (2016) 17(7):451–9. doi: 10.1038/nrm.2016.25
28. Ayturk U. Rna-seq in skeletal biology. Curr Osteoporos Rep (2019) 17(4):178–85. doi: 10.1007/s11914-019-00517-x
29. Li H, Wang X, Chen E, Liu X, Ma X, Miao C, et al. Introduction of a Cys360tyr mutation in Ano5 creates a mouse model for gnathodiaphyseal dysplasia. J Bone Miner Res (2022) 37(3):515–30. doi: 10.1002/jbmr.4481
30. Gauza-Wlodarczyk M, Kubisz L, Wlodarczyk D. Amino acid composition in determination of collagen origin and assessment of physical factors effects. Int J Biol Macromol (2017) 104(Pt A):987–91. doi: 10.1016/j.ijbiomac.2017.07.013
31. Hoebertz A, Arnett TR, Burnstock G. Regulation of bone resorption and formation by purines and pyrimidines. Trends Pharmacol Sci (2003) 24(6):290–7. doi: 10.1016/s0165-6147(03)00123-8
32. Cho YC, Park JE, Park BC, Kim JH, Jeong DG, Park SG, et al. Cell cycle-dependent Cdc25c phosphatase determines cell survival by regulating apoptosis signal-regulating kinase 1. Cell Death Differ (2015) 22(10):1605–17. doi: 10.1038/cdd.2015.2
33. Hiraoka D, Aono R, Hanada S, Okumura E, Kishimoto T. Two new competing pathways establish the threshold for cyclin-B-Cdk1 activation at the meiotic G2/M transition. J Cell Sci (2016) 129(16):3153–66. doi: 10.1242/jcs.182170
34. Li H, Wu Y, Huang N, Zhao Q, Yuan Q, Shao B. Gamma-aminobutyric acid promotes osteogenic differentiation of mesenchymal stem cells by inducing Tnfaip3. Curr Gene Ther (2020) 20(2):152–61. doi: 10.2174/1566523220999200727122502
35. Shin Y, Won Y, Yang J-I, Chun J-S. Cytl1 regulates bone homeostasis in mice by modulating osteogenesis of mesenchymal stem cells and osteoclastogenesis of bone marrow-derived macrophages. Cell Death Dis (2019) 10(2):47–59. doi: 10.1038/s41419-018-1284-4
36. Burgers TA, Williams BO. Regulation of Wnt/Beta-catenin signaling within and from osteocytes. Bone (2013) 54(2):244–9. doi: 10.1016/j.bone.2013.02.022
37. Delgado-Calle J, Sato AY, Bellido T. Role and mechanism of action of sclerostin in bone. Bone (2017) 96:29–37. doi: 10.1016/j.bone.2016.10.007
38. Jones MC, Askari JA, Humphries JD, Humphries MJ. Cell adhesion is regulated by Cdk1 during the cell cycle. J Cell Biol (2018) 217(9):3203–18. doi: 10.1083/jcb.201802088
39. Dufendach KA, Timothy K, Ackerman MJ, Blevins B, Pflaumer A, Etheridge S, et al. Clinical outcomes and modes of death in Timothy syndrome: A multicenter international study of a rare disorder. JACC Clin Electrophysiol (2018) 4(4):459–66. doi: 10.1016/j.jacep.2017.08.007
40. Christakos S, Dhawan P, Verstuyf A, Verlinden L, Carmeliet G. Vitamin d: Metabolism, molecular mechanism of action, and pleiotropic effects. Physiol Rev (2016) 96(1):365–408. doi: 10.1152/physrev.00014.2015
41. Khuituan P, Wongdee K, Jantarajit W, Suntornsaratoon P, Krishnamra N, Charoenphandhu N. Fibroblast growth factor-23 negates 1,25(Oh)2d3-induced intestinal calcium transport by reducing the transcellular and paracellular calcium fluxes. Arch Biochem Biophys (2013) 536(1):46–52. doi: 10.1016/j.abb.2013.05.009
42. Anderson PH. Vitamin d activity and metabolism in bone. Curr Osteoporos Rep (2017) 15(5):443–9. doi: 10.1007/s11914-017-0394-8
43. Luo W, Jiang Y, Yi Z, Wu Y, Gong P, Xiong Y. 1a,25-dihydroxyvitamin D3 promotes osteogenesis by down-regulating Fgf23 in diabetic mice. J Cell Mol Med (2021) 25(8):4148–56. doi: 10.1111/jcmm.16384
44. Anderson PH, Atkins GJ, Findlay DM, Oloughlin PD, Welldon K, Vincent C, et al. Rnai-mediated silencing of Cyp27b1 abolishes 1,25(Oh)2d3 synthesis and reduces osteocalcin and Cyp24 mrna expression in human osteosarcoma (Hos) cells. J Steroid Biochem Mol Biol (2007) 103(3-5):601–5. doi: 10.1016/j.jsbmb.2006.12.084
45. Weaver CM, Alexander DD, Boushey CJ, Dawson-Hughes B, Lappe JM, LeBoff MS, et al. Calcium plus vitamin d supplementation and risk of fractures: An updated meta-analysis from the national osteoporosis foundation. Osteoporos Int (2016) 27(1):367–76. doi: 10.1007/s00198-015-3386-5
46. Chandra G, Defour A, Mamchoui K, Pandey K, Mishra S, Mouly V, et al. Dysregulated calcium homeostasis prevents plasma membrane repair in anoctamin 5/Tmem16e-deficient patient muscle cells. Cell Death Discovery (2019) 5:118–32. doi: 10.1038/s41420-019-0197-z
47. Chandra G, Sreetama SC, Mazala DAG, Charton K, VanderMeulen JH, Richard I, et al. Endoplasmic reticulum maintains ion homeostasis required for plasma membrane repair. J Cell Biol (2021) 220(5):e202006035–50. doi: 10.1083/jcb.202006035
48. Ousingsawat J, Wanitchakool P, Schreiber R, Wuelling M, Vortkamp A, Kunzelmann K. Anoctamin-6 controls bone mineralization by activating the calcium transporter Ncx1. J Biol Chem (2015) 290(10):6270–80. doi: 10.1074/jbc.M114.602979
49. Sandal S, Arora V, Verma IC. Ano5-associated gnathodiaphyseal dysplasia with calvarial doughnut lesions: First report in an Asian Indian with an expanded phenotype. Congenit Anom (Kyoto) (2021) 61(1):25–6. doi: 10.1111/cga.12391
50. Wongdee K, Charoenphandhu N. Vitamin d-enhanced duodenal calcium transport. Vitam Horm (2015) 98:407–40. doi: 10.1016/bs.vh.2014.12.010
51. Turner AG, Hanrath MA, Morris HA, Atkins GJ, Anderson PH. The local production of 1,25(Oh)2d3 promotes osteoblast and osteocyte maturation. J Steroid Biochem Mol Biol (2014) 144 Pt A:114–8. doi: 10.1016/j.jsbmb.2013.10.003
52. Atkins GJ, Anderson PH, Findlay DM, Welldon KJ, Vincent C, Zannettino AC, et al. Metabolism of vitamin D3 in human osteoblasts: Evidence for autocrine and paracrine activities of 1 Alpha,25-dihydroxyvitamin D3. Bone (2007) 40(6):1517–28. doi: 10.1016/j.bone.2007.02.024
53. Yang R, Chen J, Zhang J, Qin R, Wang R, Qiu Y, et al. 1,25-dihydroxyvitamin d protects against age-related osteoporosis by a novel vdr-Ezh2-P16 signal axis. Aging Cell (2020) 19(2):e13095–114. doi: 10.1111/acel.13095
54. Suda T, Takahashi F, Takahashi N. Bone effects of vitamin d - discrepancies between in vivo and in vitro studies. Arch Biochem Biophys (2012) 523(1):22–9. doi: 10.1016/j.abb.2011.11.011
55. Garcia-Martin A, Reyes-Garcia R, Avila-Rubio V, Munoz-Torres M. Osteocalcin: A link between bone homeostasis and energy metabolism. Endocrinol Nutr (2013) 60(5):260–3. doi: 10.1016/j.endonu.2012.06.008
56. Ma Y, Yang J, Li Y, Sun L, Liu Z, Qian J, et al. Effect of 1,25-dihydroxyvitamin D3 on stem cells from human apical papilla: Adhesion, spreading, proliferation, and osteogenic differentiation. BioMed Res Int (2021) 2021:1481215–24. doi: 10.1155/2021/1481215
57. Pan R, Lu Q, Ren C, Li H, Zeng F, Tian X, et al. Anoctamin 5 promotes osteosarcoma development by increasing degradation of nel-like proteins 1 and 2. Aging (Albany NY) (2021) 13(13):17316–27. doi: 10.18632/aging.203212
58. Yin J, Ren W, Huang X, Deng J, Li T, Yin Y. Potential mechanisms connecting purine metabolism and cancer therapy. Front Immunol (2018) 9:1697. doi: 10.3389/fimmu.2018.01697
59. Karner CM, Long F. Wnt signaling and cellular metabolism in osteoblasts. Cell Mol Life Sci (2017) 74(9):1649–57. doi: 10.1007/s00018-016-2425-5
Keywords: Gnathodiaphyseal dysplasia, ANO5, metabolomics, transcriptomics, cell proliferation, calcium, osteogenesis
Citation: Li H, Liu S, Miao C, Lv Y and Hu Y (2023) Integration of metabolomics and transcriptomics provides insights into enhanced osteogenesis in Ano5Cys360Tyr knock-in mouse model. Front. Endocrinol. 14:1117111. doi: 10.3389/fendo.2023.1117111
Received: 06 December 2022; Accepted: 04 January 2023;
Published: 20 January 2023.
Edited by:
Lothar Seefried, Julius Maximilian University of Würzburg, GermanyReviewed by:
Toshimi Michigami, Osaka Women’s and Children’s Hospital, JapanCopyright © 2023 Li, Liu, Miao, Lv and Hu. This is an open-access article distributed under the terms of the Creative Commons Attribution License (CC BY). The use, distribution or reproduction in other forums is permitted, provided the original author(s) and the copyright owner(s) are credited and that the original publication in this journal is cited, in accordance with accepted academic practice. No use, distribution or reproduction is permitted which does not comply with these terms.
*Correspondence: Ying Hu, c2h1YWl5dTM2OUAxNjMuY29t
Disclaimer: All claims expressed in this article are solely those of the authors and do not necessarily represent those of their affiliated organizations, or those of the publisher, the editors and the reviewers. Any product that may be evaluated in this article or claim that may be made by its manufacturer is not guaranteed or endorsed by the publisher.
Research integrity at Frontiers
Learn more about the work of our research integrity team to safeguard the quality of each article we publish.