 Yingying Hu1,2†
 Fan Zhou3,4†
 Fang Lei2,5Lijin Lin1,2
 Xuewei Huang6Tao Sun1,2Weifang Liu1,2
 Xingyuan Zhang2,5
 Jingjing Cai2,6
 Zhi-Gang She1,2*
 Hongliang Li1,2*
- 1Department of Cardiology, Renmin Hospital of Wuhan University, Wuhan, China
- 2Institute of Model Animal, Wuhan University, Wuhan, China
- 3Department of Gastroenterology, Huanggang Central Hospital of Yangtze University, Huanggang, China
- 4Huanggang Institute of Translational Medicine, Huanggang, China
- 5School of Basic Medical Science, Wuhan University, Wuhan, China
- 6Department of Cardiology, The Third Xiangya Hospital, Central South University, Changsha, China
Background: The relationship between thyroid function parameters and metabolic dysfunction-associated fatty liver disease (MAFLD) remains controversial. Additionally, little is known about the relationship between thyroid function parameters and MAFLD in the Chinese population.
Methods: We conducted a retrospective cross-sectional study involving 177,540 individuals with thyroid function tests and MAFLD diagnosis from 2010-2018. The association between thyroid function parameters and MAFLD was evaluated on a continuous scale with restricted cubic spline (RCS) models and by the prior-defined centile categories with multivariable-adjusted logistic regression models. Thyroid function parameters included free triiodothyronine (FT3), free tetra-iodothyronine (FT4), and thyroid stimulating hormone (TSH). Additionally, fully adjusted RCS models stratified by sex, age, and location were studied.
Results: In the RCS models, the risk of MAFLD increased with higher levels of FT3 when FT3 <5.58pmol/L, while the risk of MAFLD decreased with higher levels of FT3 when FT3 ≥5.58pmol/L (P nonlinearity <0.05). While RCS analysis suggested that the FT4 levels had a negative association with MAFLD (P nonlinearity <0.05), indicating an increase in FT4 levels was associated with a decreased risk of MAFLD. RCS analysis suggested an overall positive association between the concentration of TSH and MAFLD risk (P nonlinearity <0.05). The rising slope was sharper when the TSH concentration was less than 1.79uIU/mL, which indicated the association between TSH and MAFLD risk was tightly interrelated within this range. The multivariable logistic regression showed that populations in the 81st-95th centile had the highest risk of MAFLD among all centiles of FT3/TSH, with the 1st-5th centile as the reference category.
Conclusions: Our study suggested nonlinear relationships between thyroid function parameters and MAFLD. Thyroid function parameters could be additional modifiable risk factors apart from the proven risk factors to steer new avenues regarding MAFLD prevention and treatment.
1 Introduction
Metabolic dysfunction-associated fatty liver disease (MAFLD) is a more inclusive term than nonalcoholic fatty liver disease (NAFLD) for the patient with associated metabolic dysfunction of hepatic steatosis (1). Although there is a substantial overlap between the two populations defined by MAFLD and NAFLD, the considerable differences in the two populations should not be neglected. Moreover, those populations diagnosed with MAFLD would have more comorbidities and worse prognoses than those with NAFLD (2, 3). Due to its clinically occult symptoms in the early stages, MAFLD often leads to severe outcomes, such as steatohepatitis, liver fibrosis, and even cirrhosis and hepatic carcinoma (4). Therefore, improving the awareness and management of its related risk factors could promote early screening to achieve early interventions.
The increasing prevalence and associated burden of MAFLD cannot be fully explained by traditional risk factors, such as age, gender, smoking, body mass index (BMI), hypertension, hyperlipidemia, and diabetes mellitus. Accumulating evidence has suggested that thyroid function parameters may also be associated with MAFLD (5). Physiologically, thyroid hormone (TH) powerfully influences metabolic processes through multiple pathways for human beings, with profound effects on lipid metabolism and energy expenditure (6). Their imbalanced levels may also lead to various unfavorable effects and contribute to the development and progression of multiple diseases, including MAFLD (7). Their importance promotes researchers exploring the relationship between thyroid function parameters and MAFLD. The conclusions from studies regarding the relationship between thyroid function parameters and NAFLD/MAFLD are inconsistent, varying from a solid association to no association (8–12). There are limited studies aiming to assess the association of thyroid function parameters with MAFLD in the large-scale population in China. In addition, the relationship between thyroid function parameters and MAFLD risk may not be linear, and prior studies have been relatively underpowered to assess nonlinear relationships. Therefore, we conducted a large retrospective study to evaluate the potential connection between the level of each thyroid function parameter and MAFLD risk and to further explore these relationships in different sex, age, and location groups.
2 Methods
2.1 Study population
This study was designed as a multicenter retrospective study comprising 180,582 adults from 5 health check-up centers from 2010 to 2018. All individuals had access to serum FT3, FT4, and TSH concentrations, as well as MAFLD diagnosis. Moreover, there were 3 centers in the north of China and 2 in the south of China. Participants who 1) had previously been diagnosed with liver cancer, liver cirrhosis, or had a history of liver surgery (N=227); 2) had the administration of drugs influencing serum TH levels, such as methimazole, propylthiouracil, levothyroxine, and amiodarone (N=24); 3) had a severe medical illness, such as acute infection, acute heart failure, acute coronary syndrome, stroke, severe kidney diseases, and malignancy (N=2791) were excluded. Finally, 177540 adults were enrolled in our multicentered retrospective study. The flow chart of participant selection is shown in Figure 1A.
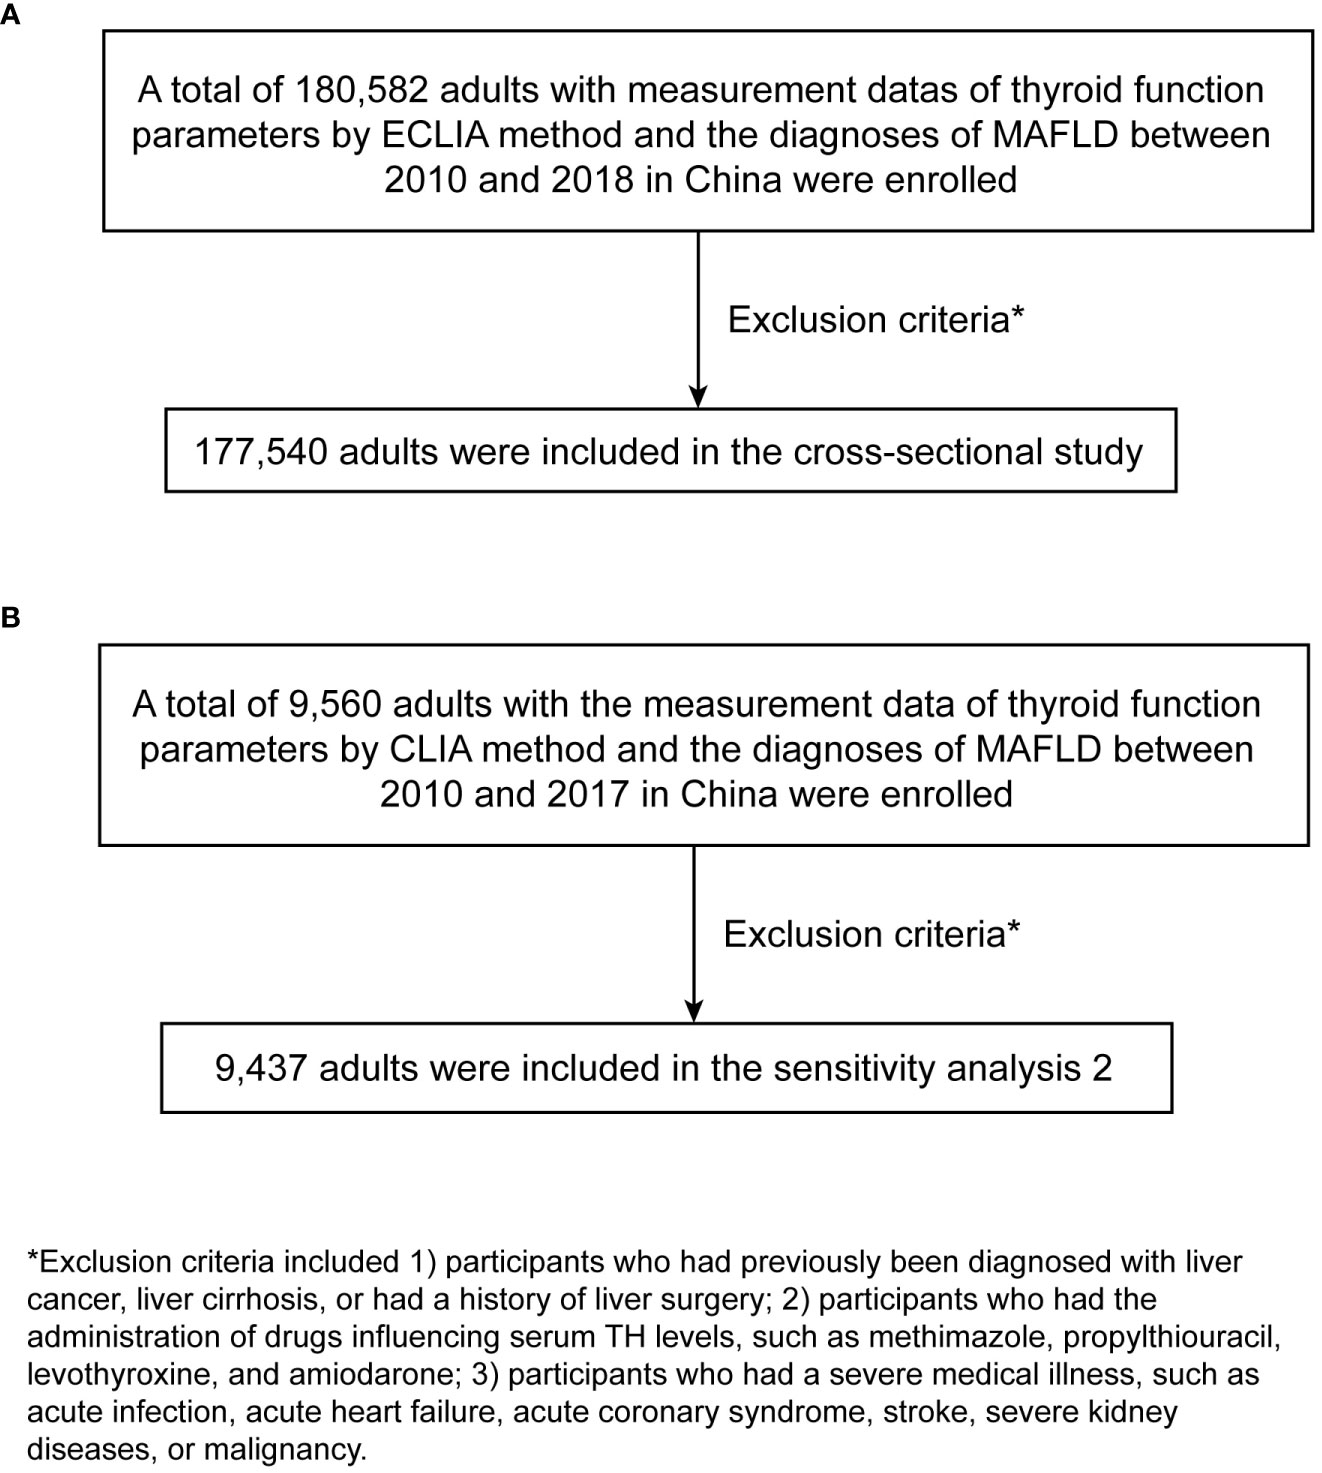
Figure 1 The flow chart of participant selection. (A) main study. (B) sensitivity analysis 2. ECLIA, electrochemiluminescence immunoassay; MAFLD, metabolic dysfunction-associated fatty liver disease; CLIA, chemiluminescence analysis.
This study was approved by the ethical review committee of Renmin Hospital of Wuhan University and followed by acceptance by the ethics center in each collaborating hospital. The ethics committees granted a waiver of the requirement for documentation of informed consent for just analyzing existing data after anonymization without individual identification.
2.2 Anthropometric and laboratory data
The medical histories were collected face-to-face and recorded by professional physicians, from which the demographic information of participants was extracted, including sex, age, smoking status, alcohol consumption, medications, medical history, and so on. All participants had undergone comprehensive anthropometric measurements and clinical examinations.
Anthropometric measurements, including height, weight, and waist circumference (WC), and physiological parameters, such as systolic and diastolic blood pressure (SBP and DBP), and heart rates, were performed by well-trained physicians according to standard protocols. BMI was calculated as weight divided by the square of height (kg/m2). After overnight fasting, the participants underwent clinical examinations, including routine blood examinations, biochemical tests, and liver ultrasounds. Biochemical tests included liver function tests, renal function tests, fasting blood glucose (FBG) levels, lipid contents examinations, and thyroid function tests. The estimated glomerular filtration rate (eGFR) was calculated by the Modification of Diet in Renal Disease equations (13).
All check-up centers included in our main study applied identical methodology, namely, the electrochemiluminescence immunoassay (ECLIA) method, to complete thyroid function tests. According to the ECLIA method, the overall ranges of thyroid function parameters were as follows: FT3 ranged from 0.39 to 76pmol/L (reference range, 3.43-6.5pmol/L), FT4 ranged from 0.3 to 294.2pmol/L (reference range, 12-22pmol/L), and TSH ranged from 0 to 230uIU/mL (reference range, 0.27-4.2uIU/mL). All imagological diagnoses were performed and evaluated by experienced imaging specialists at medical health check-up centers.
2.3 Diagnostic criteria
MAFLD was defined by evidence of hepatic steatosis on abdominal ultrasound, Computed Tomography, or Magnetic Resonance Imaging with the presence of one of the following three criteria: overweight or obesity (defined as BMI ≥23 kg/m2 in Asians); the presence of type 2 diabetes (T2DM); lean or normal weight (BMI <23 kg/m2) with the presence of or metabolic dysregulation. Metabolic dysregulation was defined by the presence of at least two of the following metabolic risk abnormalities: 1) WC ≥90 cm for men and 80 cm for women; 2) blood pressure ≥130/85 mmHg or on specific drug treatment; 3) plasma triglycerides ≥1.70 mmol/L or on specific drug treatment; 4) plasma high-density lipoprotein cholesterol (HDL-C) <1.0 mmol/L for men and <1.3 mmol/L for women or on specific drug treatment; 5) prediabetes (i.e., FBG was 5.6 to 6.9 mmol/L, or 2 hours postprandial glucose level was 7.8 to 11.0 mmol or glycosylated hemoglobin A1c level was 5.7% to 6.4%) (1). T2DM was diagnosed according to the clinical guidelines for the prevention and treatment of T2DM in the elderly in China (2022 edition) (14). Hypertension was defined as an SBP ≥140 mmHg and/or DBP ≥90 mmHg, a medical history of hypertension, or the use of antihypertensive agents according to the 2018 Chinese hypertension management guidelines (15). Metabolic syndrome (MetS) was defined based on the criteria within the CHPSNE (Control Hypertension and Other Risk Factors to Prevent Stroke with Nutrition Education in Urban Area of Northeast China) study (16).
2.4 Statistical analysis
The basic characteristics of participants were presented by descriptive statistics. The Kolmogorov–Smirnov test was used to evaluate the normality of the distribution of the continuous variables. Continuous variables were summarized as mean and standard deviation (SD) if normally distributed and median and interquartile range (IQR) if not normally distributed. Categorical variables were presented as frequencies and percentages. Student’s t-tests (normally distributed) and Wilcoxon rank-sum test (non-normally distributed) for continuous variables, and Fisher’s exact test or chi-square test for categorical variables were used to compare the intergroup differences.
Apart from dividing populations into with or without MAFLD groups, five equally distributed categories were defined by the 20th, 40th, 60th, and 80th centiles of the level of thyroid function parameters, and to evaluate the highest and lowest levels of thyroid function parameters, two additional categories were defined by the 5th and 95th centiles.
We used RCS models fitted for the logistic regression model to assess the potential nonlinear relationships between levels of thyroid function parameters on a continuous scale and MAFLD. To balance best fit and overfitting in the main splines for MAFLD, the number of knots, between three and five, was chosen as the lowest value for the Akaike information criterion, but if within two of each other for different knots, the lowest number of knots was determined. Then, analysis of variance was used to complete nonlinear tests. The concentration of thyroid function parameters associated with the highest risk of MAFLD was the concentration with the highest odds ratio (OR) on the spline curve. Analyses were adjusted for multiple variables. We considered the clinical significance, the baseline difference, and the results of previous studies to determine the adjusted variables (17–20), including age, sex, heart rates, leukocyte counts, red blood cells, platelet counts, hemoglobin, gamma-glutamyl transpeptidase, eGFR, uric acid, total cholesterol, smoking status and alcohol consumption, a history of DM and hypertension. Moreover, the multivariable stratification analysis was conducted according to gender, age, and location. The same number of knots from the main splines was also applied in splines for stratified analysis to allow a direct comparison of overall and stratified analyses. Furthermore, the associations between seven predefined TH categories and MAFLD were examined. Multivariable logistic regression models adjusting for covariates mentioned above were applied to estimate OR and 95% confidence intervals (CI) for MAFLD. The reference category for these analyses was the lowest level of thyroid function parameters.
The nonparametric missing value imputation based on the missForest procedure in R was used to fill in the missing data. The results of the subsequent analysis of the dataset before and after imputation were not significantly different.
R software (version 4.1.0) was used to perform all statistical analyses and create all graphs; a two‐sided P <0.05 was considered statistically significant.
2.5 Sensitivity analysis
We further conducted two sensitivity analyses. In our main analysis, BMI was not adjusted because it belongs to one of the diagnostic criteria of MAFLD. While in sensitivity analysis 1, we further adjusted BMI besides covariates in the main analysis, given the possibility that it could be a confounder. In sensitivity analysis 2, populations used the chemiluminescence analysis (CLIA) method to detect thyroid function parameters, which is an entirely different detection method from ECLIA. There is a large difference between the reference ranges of the two methods, and the ECLIA has the characteristics of higher sensitivity, specificity, and selectivity than CLIA. Finally, there were 9560 participants aged ≥18 years enrolled in sensitivity analysis 2 to explore the relationship between thyroid function parameters and MAFLD. They came from 3 health check-up centers covering 3 administrative regions between 2010 and 2017 in China. They all underwent the detection of thyroid function parameters and had the diagnosis of MAFLD. Then based on the exclusion criteria mentioned above, 123 participants were excluded. Finally, 9437 adults were for sensitivity analysis 2. The flow chart of participant selection is shown in Figure 1B. Sensitivity analysis 2 was performed using a statistical method similar to the main analysis.
3 Results
3.1 Clinical and laboratory characteristics
The main analysis consisted of 177,540 participants with a median age of 48 (IQR, 42, 54) and 60.19% males. The baseline characteristics of participants are summarized in Table 1. In the overall population, 51.14% of participants had MAFLD. Compared with the participants without MAFLD, those with MAFLD tended to be older, to be male; to have higher BMI, thicker WC, higher SBP and DBP, more leukocyte counts and red blood cells, higher hemoglobin, alanine aminotransferase, aspartate transaminase, gamma-glutamyl transpeptidase, serum creatinine, blood urea nitrogen, uric acid, FBG, total cholesterol, triglycerides, and low-density lipoprotein cholesterol; fewer platelet counts and lower HDL-C; more likely to be smokers and drinkers, and to be more likely have hypertension, diabetes, and dyslipidemia.
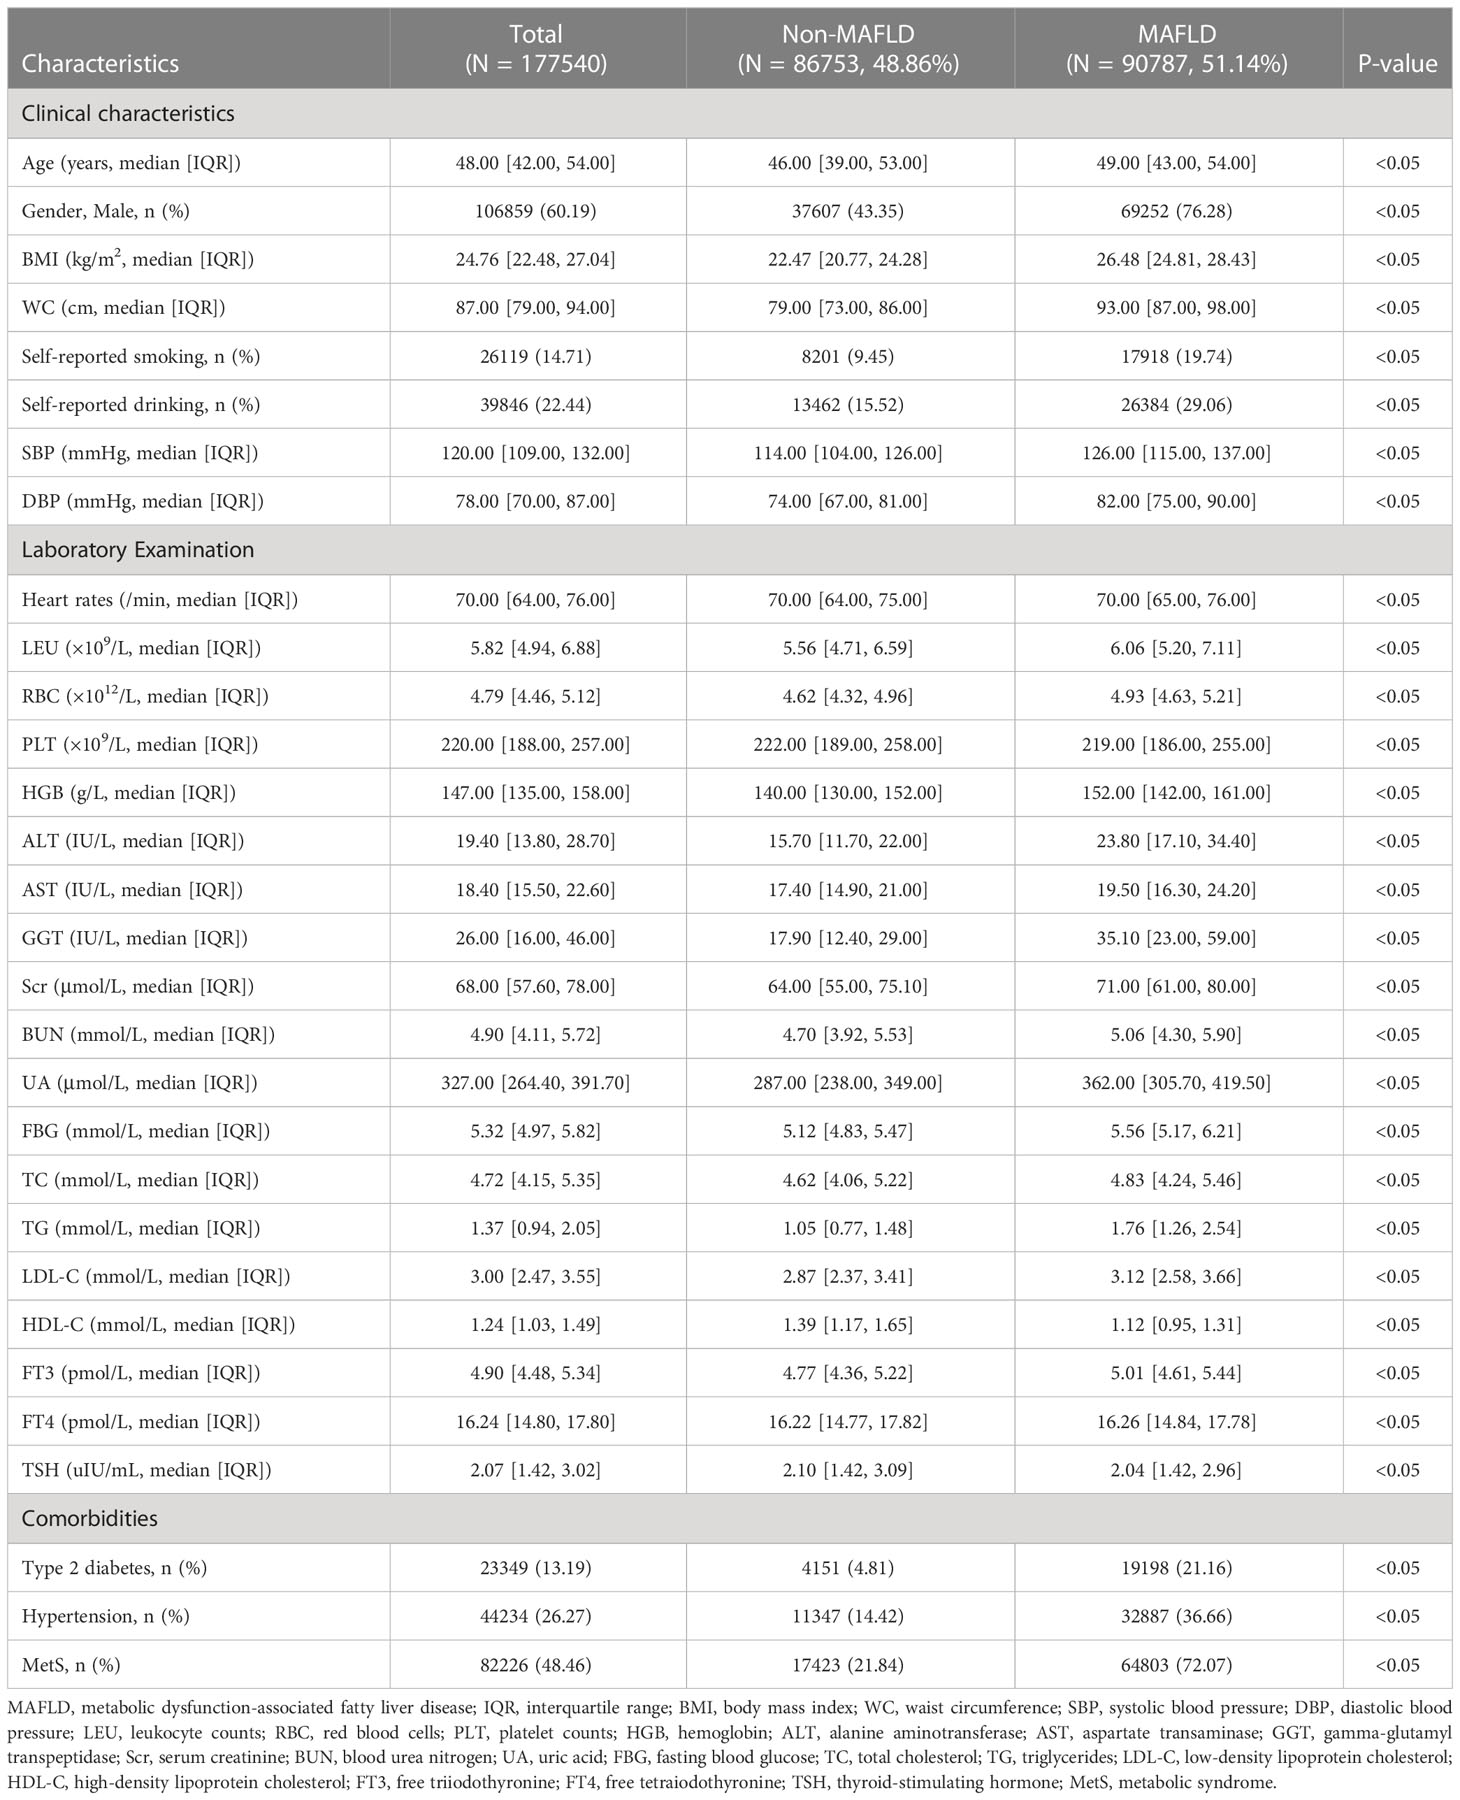
Table 1 Clinical and laboratory characteristics of participants with and without MAFLD from 2010 to 2018.
3.2 Association between FT3 levels on a continuous scale and MAFLD
Table S1 shows the baseline characteristics of participants according to prior-defined centile categories of FT3. To assess the nonlinear relationship, the association between FT3 and MAFLD was estimated on a continuous scale using RCS. In the RCS models, the risk of MAFLD increased with the levels of FT3 when FT3 concentration was less than 5.58pmol/L, while the risk of MAFLD decreased with the levels of FT3 when FT3 concentration was more than or equal to 5.58pmol/L (P nonlinearity < 0.05) (Figure 2A). The lowest and highest levels of FT3 were associated with a decreased risk of MAFLD.
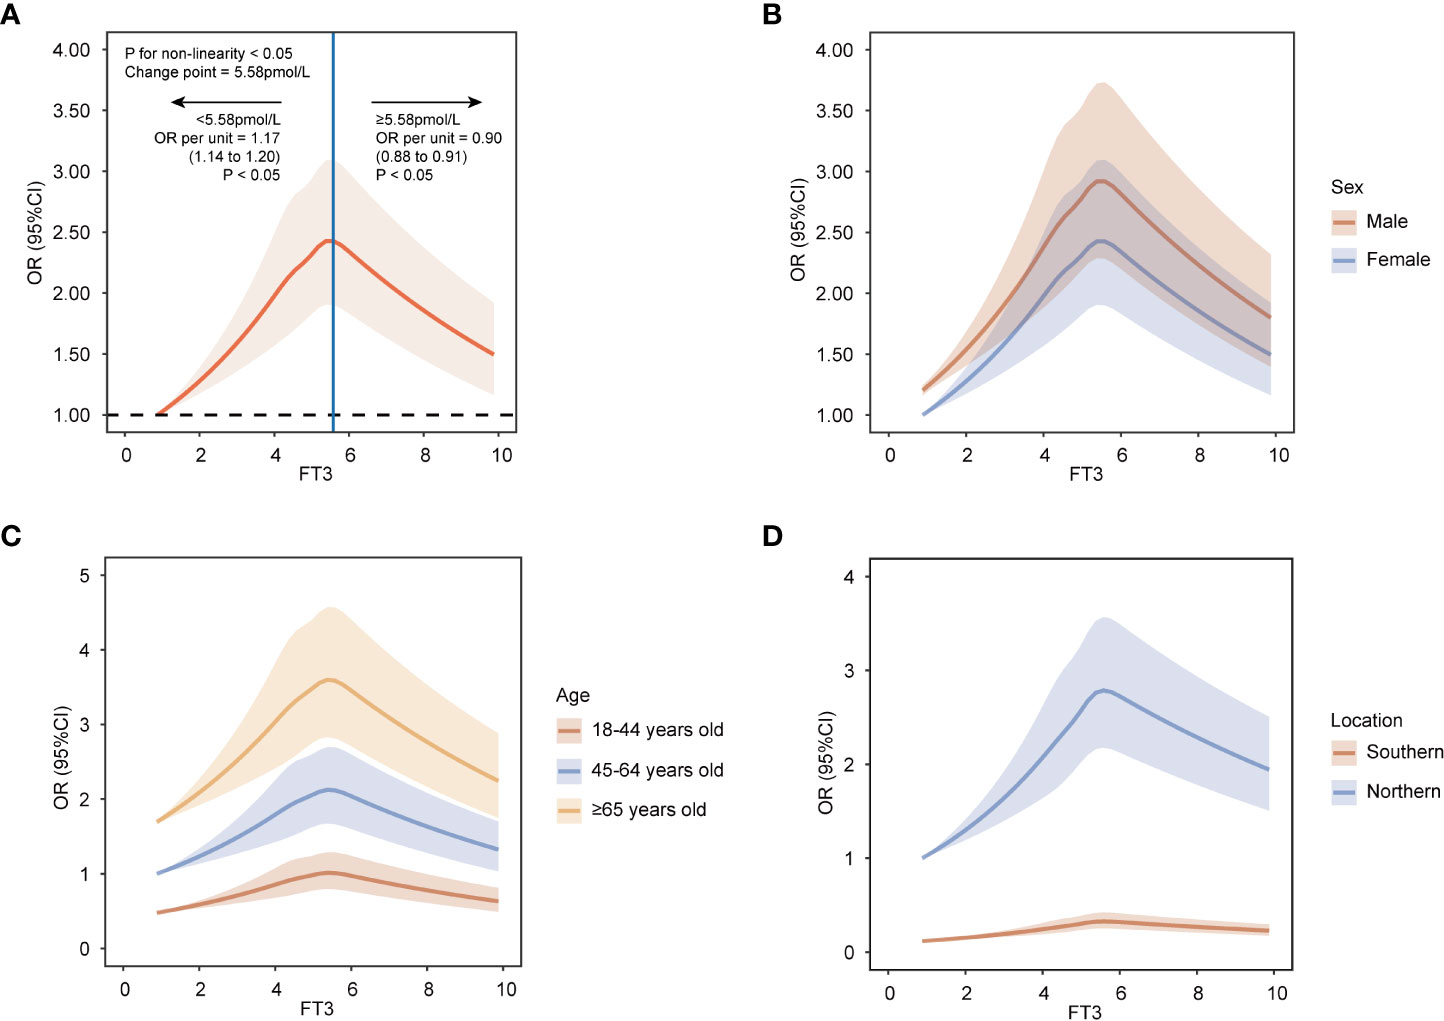
Figure 2 Restricted cubic spline analyses with five knots for nonlinear association between FT3 levels and MAFLD on a continuous scale. (A) all population. (B) by sex. (C) by age groups. (D) by location groups. ORs are indicated by solid lines and 95% CIs by shaded areas. Reference point is lowest value for FT3. Analyses were adjusted for age, sex, heart rates, leukocyte counts, red blood cells, platelets, hemoglobin, gamma-glutamyl transpeptidase, estimated glomerular filtration rate, uric acid, total cholesterol, smoking status, alcohol consumption, and a history of diabetes and hypertension. FT3, free triiodothyronine; MAFLD, metabolic dysfunction-associated fatty liver disease; OR, odd ratio; CI, confidence interval.
To estimate precise OR values, the multivariable logistic regression model was used. When FT3 concentration was less than 5.58pmol/L, the OR per unit higher FT3 was 1.17 (95% CI, 1.14, 1.20) (Figure 2A), which indicated each unit increase in FT3 concentration was associated with a 0.17-fold increased risk of MAFLD. While when FT3 concentration was more than or equal to 5.58pmol/L, the OR per unit higher FT3 was less than 1 with being 0.90 (95% CI, 0.88, 0.91) (Figure 2A), suggesting the risk of MAFLD decreased by 0.1-fold for every unit increase of FT3 concentration. Moreover, according to the prior-defined centile categories, we calculated the OR of each centile of FT3 with the 1st-5th centile as a reference group. The highest multivariable-adjusted OR for MAFLD was 1.39 (95% CI, 1.31, 1.48) for individuals with FT3 concentrations of 5.45-6.05pmol/L (81st-95th centile) among all centiles (Figure 3). The population with the FT3 concentrations of 5.45-6.05pmol/L (81st-95th centile) had the highest risk of MAFLD.
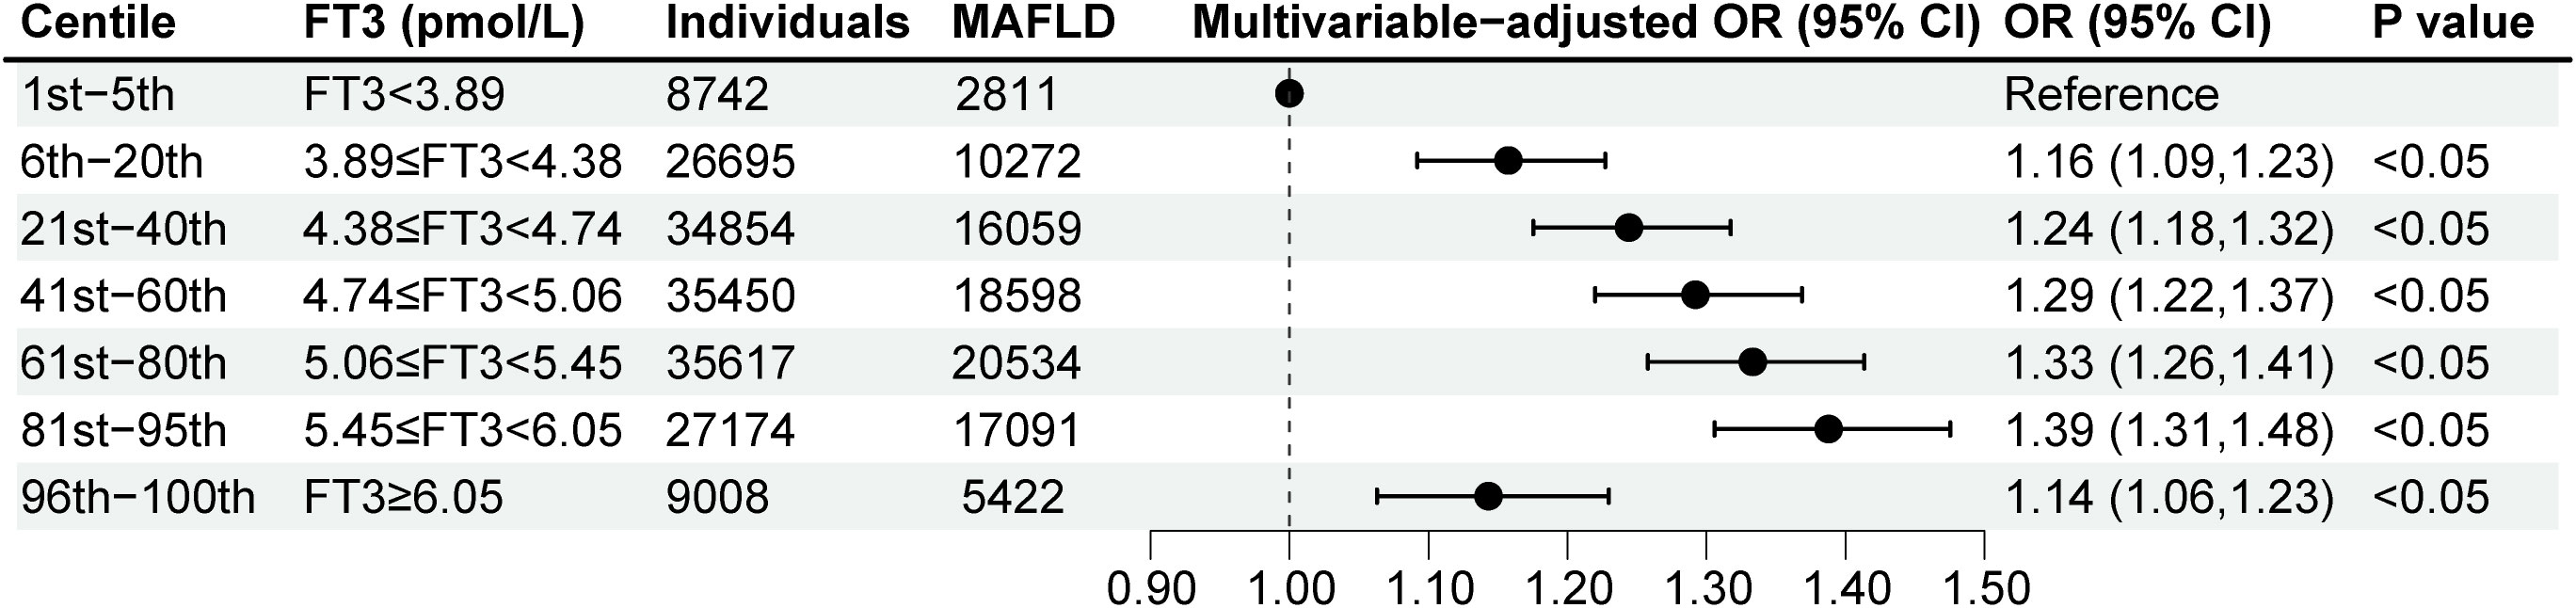
Figure 3 Multivariable-adjusted logistic regression analyses for MAFLD according to FT3 levels by the prior-defined centile categories. Analyses were adjusted for age, sex, heart rates, leukocyte counts, red blood cells, platelets, hemoglobin, gamma-glutamyl transpeptidase, estimated glomerular filtration rate, uric acid, total cholesterol, smoking status, alcohol consumption, and a history of diabetes and hypertension. FT3, free triiodothyronine; MAFLD, metabolic dysfunction-associated fatty liver disease; OR, odd ratio; CI, confidence interval.
We performed stratified analyses to assess possible effect modification according to sex, age, and location. The nonlinear relationship between FT3 and MAFLD was observed among various sex, age, and location groups (Figures 2B–D). Furthermore, the association was most pronounced in males, individuals over 65 years old, and in populations in Northern China among different subgroups (Figures 2B–D).
3.3 Association between FT4 levels on a continuous scale and MAFLD
We also explored the association between FT4 and MAFLD. Baseline characteristics of participants by prior-defined centile categories of FT4 are summarized in Table S2. RCS analysis suggested the FT4 levels on a continuous scale had a negative association with MAFLD (P nonlinearity <0.05) (Figure S1A), indicating an increase in FT4 levels was associated with a decreased risk of MAFLD.
After adjustment for identified covariates, the multivariable logistic regression model presented that OR per unit higher FT4 was 0.93 (95% CI, 0.93, 0.93) (Figure S1A), showing every unit increase of FT4 was associated with a 0.07-fold lower risk of MAFLD. In parallel, we found that individuals with concentrations of FT4 more than or equal to 20.43pmol/L (96th-100th centiles) had the lowest MAFLD risk among all centiles, with the 1st -5th centile being a reference group (OR, 0.45 [95% CI, 0.42, 0.48]) (Figure S2).
Results did not change substantially by further dividing people by sex, age, and location, and the declining relationship between FT4 levels and MAFLD persisted. Additionally, the most pronounced association was observed in males, individuals over 65 years old, and in populations in Northern China among different subgroups (Figure S1B–D).
3.4 Association between TSH levels on a continuous scale and MAFLD
We further explored the relationship between TSH and MAFLD. Table S3 shows the baseline characteristics of participants according to prior-defined centile categories of TSH. RCS analysis suggested an overall positive association between the concentration of TSH and MAFLD risk (P nonlinearity <0.05) (Figure S3A). The rising slope was sharper when the TSH concentration was less than 1.79uIU/mL, which indicated the association between TSH and MAFLD risk was tightly interrelated within this range.
For individuals whose TSH level was less than 1.79uIU/mL, the OR per unit higher TSH was 1.28 (95% CI, 1.22, 1.33) (Figure S3A), which indicated each unit increase in TSH concentration was associated with a 0.28-fold increased risk of MAFLD. For individuals whose TSH level was more than or equal to 1.79uIU/mL, the 95% confidence interval included the OR of 1.00 (OR, 1.00 [95% CI, 1.00, 1.00], P value =0.42) (Figure S3A), suggesting the risk of MAFLD slightly increased with each unit increase in TSH concentration, but this trend was not statistically significant. At the same time, with the 1st-5th centile as the reference category, the highest multivariable-adjusted OR for MAFLD was 1.40 (95% CI, 1.33, 1.48) for individuals with TSH concentrations of 3.33-5.60uIU/mL (81st-95th centile) (Figure S4). The individuals with the TSH concentrations of 3.33-5.60uIU/mL (81st-95th centile) had the highest risk of MAFLD.
The association between TSH concentrations and MAFLD was not significantly modified with respect to sex, age, and location. Moreover, TSH also showed a stronger association with rising shape within a certain range with MAFLD in males, individuals over 65 years old, and individuals in Northern China than in outer subgroups (Figure S3B–D).
3.5 Sensitivity analysis
To validate the robustness of our results, we conducted two sensitivity analyses. The results of sensitivity analyses did not change substantially. In sensitivity analysis 1, in addition to covariates in the main analysis, BMI was regarded as a confounder. The shape with a first rising and then decline trend between FT3 and MAFLD and the shape with a rising trend in a certain range between TSH and MAFLD persisted (P nonlinearity <0.05) (Figures S5A, S5C). In Figure S5B, for FT4, the overall declining trend was observed, although the curve has changed a bit (BMI was regarded as an important confounder) (Figure S5B). In sensitivity analysis 2, the data from various health check-up centers and different detection methods were used to explore the association between thyroid function parameters on a continuous scale and MAFLD. The baseline characteristics of participants in sensitivity analysis 2 are summarized in Table S4. The association between the concentrations of variations in thyroid function and MAFLD was not significantly modified by health check-up centers and detection methods (Figure S6A–C).
4 Discussion
This large population-based study among general individuals demonstrated nonlinear relationships between thyroid function parameters and MAFLD. The populations with FT3 in the 81st-95th centile level, FT4 in the 1st-5th centile level, and TSH in the 81st-95th centile level were most likely to develop MAFLD among all centiles. Different stratifications according to gender, age, and location influenced the strength of the nonlinear relationships between thyroid function parameters and MAFLD. Taken together, thyroid function parameters could be additional modifiable risk factors apart from the proven risk factors to steer new avenues regarding MAFLD prevention and treatment.
Because there was a substantial overlap between the MAFLD and NAFLD, our observations between thyroid function parameters and MAFLD could be comparable with the findings between thyroid function parameters and NAFLD. In our results, the population could be divided into two groups based on the relationship between FT3 and MAFLD risk: group one with FT3 less than 5.58pmol/L (within the reference range), where MAFLD risk increased with higher FT3; group two with FT3 more than or equal to 5.58pmol/L, where MAFLD risk decreased with higher FT3. Other studies on thyroid function and NAFLD have concentrated on three subtypes: individuals with hypothyroidism (12, 21), euthyroid subjects (8, 9, 11, 22–25), and individuals with hyperthyroidism (26). The diagnosis of hypothyroidism does not involve FT3 (27). Notably, most studies involving euthyroid subjects have concluded that higher FT3 is associated with an increased risk of NAFLD (8, 11, 22, 23). However, these studies divided the FT3 levels into multiple quartiles and did not investigate its association with MAFLD on a continuous range. However, others did not find a positive association (9, 24, 25). Comparison with results from various studies is different because of varying population selection and experimental design. In addition, our findings implied that population distribution before and after the change point significantly impacts the study results. In the study of hyperthyroid patients, elevated FT3 is associated with a reduced risk of MAFLD. Therefore, cohort studies are needed to prove the relationship between FT3 and MAFLD on a continuous scale.
FT3 is commonly acknowledged to be more biologically active as a modulator of metabolic processes than FT4 (28). As a result, from a pathophysiological perspective, the relationship of MAFLD with FT3 rather than with FT4 should be regarded as the most relevant. Our findings could be explained by the significant contribution of TH to hepatic lipid metabolism. Cell studies have shown that TH stimulates lipolysis to generate circulating free fatty acids (FFAs), which are the major source of lipids for the liver. Then, TH promotes FFAs uptake to regulate lipid metabolism (29). In addition to promoting the uptake of exogenous FFAs, TH can also promote de novel lipogenesis in the liver stimulated by excess glucose directly and indirectly (30). Moreover, FT3 promotes triacylglycerol stored as lipid droplets in the liver to be hydrolyzed back to FFAs via classic lipases and lipophagy. Afterward, FFAs are broken down, undergoing mitochondrial β-oxidation to produce energy, which also is promoted by FT3 (31). Taken together, TH maintains the balance between lipid metabolism by stimulation of lipid synthesis and lipid oxidation by direct and indirect actions (5, 32). Combining this mechanism with the results of our study, it appears that when FT3 is great than 5.58pmol/L (81st-95th centile), more enhanced lipid oxidation than lipid synthesis exists.
Retrospective studies could not explore a causal relationship between elevated FT3 and increased risk of MAFLD. The current studies suggest that hypothyroidism increases the risk of NAFLD (12, 33). We suggest that the positive relationship between FT3 concentrations and MAFLD risk in group one (FT3 less than 5.58pmol/L) is due to obesity. The relationship between obesity and thyroid hormone levels that obese individuals have higher circulating FT3 has been elaborated in numerous investigations (34–37). In addition, Mendelian randomization research documented that higher BMI/fat mass is a determinant of increasing FT3 levels (36). The mechanisms responsible for this action are not yet precisely known, and several assumptions exist. Firstly, this action may involve tissue-specific alterations in iodothyronine deiodinase (DIO) expression in relation to obesity (38). Previous studies have suggested DIO 1 and/or 2 activities in subjects with a relatively higher fat mass and/or a less favorable metabolic profile would change, leading to a higher conversion of FT4 to FT3 (39–41). Secondly, obesity may alter the hypothalamic-pituitary-thyroid axis (42, 43). Thirdly, observed changes in FT3 may relate partly to excess carbohydrates in the diet of obese individuals (44). Furthermore, the importance of obesity in the pathogenesis of MAFLD is well established (45). The cross-sectional design of the present study hampers to establish the causation between FT3 and MAFLD, and the possible interrelationship of obesity with FT3 and the development of MAFLD needs to be prospectively delineated in the future.
Given the key role of TH on hepatic lipid accumulation, much effort has been recently paid to developing a liver-targeted agonist of THRβ, which has been shown to diminish hepatic lipid accumulation in animal studies (46–48). In addition, animal studies have shown that triiodothyronine administration caused a rapid regression of fully established steatosis (49). However, due to the side effects (especially in the heart, muscle, and bone), none of these drugs has been introduced into clinical practice, which underscores the complexity of TH physiology.
For TSH, inconsistent associations of serum TSH with NAFLD were reported with positive or null results among various populations and research (8, 9, 11, 24, 50–52). We must take the negative feedback loop between TSH and TH into consideration, namely, the production of TSH and TH is regulated by the hypothalamic–pituitary–thyroid axis. Specifically, TSH stimulates the thyroid to synthesize and release TH and in turn, TH acts on the pituitary and hypothalamus to inhibit TSH production. In addition to the interaction with thyroxine, the TSH upregulates the expression of hepatic 3-hydroxy-3-methyl-glutaryl coenzyme A reductase to promote the synthesis of cholesterol to direct effect on lipids and BMI (53–56). In addition, TSH can robustly stimulate the secretion of leptin to affect BMI (57, 58). In a word, TSH is a complex regulation process, which could explain the variations of the results of TSH.
Several limitations should be noted in our study. Firstly, there are inherent limitations in inferring the causal relationship between TH and MAFLD in our retrospective study. We cannot infer direct causes and effects between TH and MAFLD. Secondly, since MAFLD is mainly diagnosed by ultrasonography, we could not determine the severity of MAFLD-associated hepatitis and might not detect mild steatosis. However, up to now, ultrasonography is still a safe and confirmed reliable noninvasive method, compared with the pathological diagnosis by liver biopsy with higher diagnostic accuracy limited by its invasive, impractical and costly. Thirdly, limited information on smoking and drinking consumption status, medications history, and past medical history may result in bias due to an insufficient adjustment of these confounders in the models.
5 Conclusions
Our study suggested nonlinear relationships between thyroid function parameters and MAFLD. The populations with FT3 in the 81st-95th centile level, FT4 in the 1st-5th centile level, and TSH in the 81st-95th centile level were most likely to develop MAFLD among all centiles. Further mechanism research and large prospective studies with long-term follow-up are warranted to provide more definitive evidence to clarify the causal relationship between thyroid function parameters and MAFLD.
Data availability statement
The datasets presented in this article are not readily available because privacy or ethical restrictions. The data that support the findings of this study are available on request from the corresponding author. Requests to access the datasets should be directed to Hongliang Li, lihl@whu.edu.cn.
Ethics statement
The studies involving human participants were reviewed and approved by the ethical review committee of Renmin Hospital of Wuhan University and followed by acceptance by the ethics center in each collaborating hospital. The ethics committees granted a waiver of the requirement for documentation of informed consent for just analyzing existing data after anonymization without individual identification. Written informed consent for participation was not required for this study in accordance with the national legislation and the institutional requirements.
Author contributions
YH and FZ designed the study, collected and analyzed data, and wrote the manuscript. FL, LL and XH collected and reviewed data and contributed to data analysis. TS, WL, XZ, and JC revised the manuscript and provided valuable suggestions for study design and data analysis. Z-GS and HL contributed equally, designed the project, edited the manuscript, and supervised the study. All authors have approved the final version of this paper.
Funding
This work was supported by grants from the Hubei Province Innovation Platform Construction Project (20204201117303072238), and the National Science Foundation of China (81770053, 81970364, 81870171, 82170436).
Conflict of interest
The authors declare that the research was conducted in the absence of any commercial or financial relationships that could be construed as a potential conflict of interest.
Publisher’s note
All claims expressed in this article are solely those of the authors and do not necessarily represent those of their affiliated organizations, or those of the publisher, the editors and the reviewers. Any product that may be evaluated in this article, or claim that may be made by its manufacturer, is not guaranteed or endorsed by the publisher.
Supplementary material
The Supplementary Material for this article can be found online at: https://www.frontiersin.org/articles/10.3389/fendo.2023.1115354/full#supplementary-material
Abbreviations
BMI, body mass index; CI, confidence intervals; CLIA, chemiluminescence analysis; DBP, diastolic blood pressure; DIO, iodothyronine deiodinase; ECLIA, electrochemiluminescence immunoassay; eGFR, estimated glomerular filtration rate; FBG, fasting blood glucose; FFAs, free fatty acids; HDL-C, high-density lipoprotein cholesterol; IQR, interquartile range; MAFLD, metabolic dysfunction-associated fatty liver disease; MetS, metabolic syndrome; NAFLD, nonalcoholic fatty liver disease; OR, odds ratio; RCS, restricted cubic spline; SBP, systolic blood pressure; SD, standard deviation; T2DM, type 2 diabetes; TH, thyroid hormone; TSH, thyroid stimulating hormone; WC, waist circumference.
References
1. Eslam M, Newsome PN, Sarin SK, Anstee QM, Targher G, Romero-Gomez M, et al. A new definition for metabolic dysfunction-associated fatty liver disease: An international expert consensus statement. J Hepatol (2020) 73(1):202–9. doi: 10.1016/j.jhep.2020.03.039
2. Nguyen VH, Le MH, Cheung RC, Nguyen MH. Differential clinical characteristics and mortality outcomes in persons with nafld and/or mafld. Clin Gastroenterol Hepatol (2021) 19(10):2172–81.e6. doi: 10.1016/j.cgh.2021.05.029
3. Yamamura S, Eslam M, Kawaguchi T, Tsutsumi T, Nakano D, Yoshinaga S, et al. Mafld identifies patients with significant hepatic fibrosis better than nafld. Liver Int (2020) 40(12):3018–30. doi: 10.1111/liv.14675
4. Arab JP, Arrese M, Trauner M. Recent insights into the pathogenesis of nonalcoholic fatty liver disease. Annu Rev Pathol (2018) 13:321–50. doi: 10.1146/annurev-pathol-020117-043617
5. Sinha RA, Singh BK, Yen PM. Direct effects of thyroid hormones on hepatic lipid metabolism. Nat Rev Endocrinol (2018) 14(5):259–69. doi: 10.1038/nrendo.2018.10
6. Yau WW, Singh BK, Lesmana R, Zhou J, Sinha RA, Wong KA, et al. Thyroid hormone (T(3)) stimulates brown adipose tissue activation Via mitochondrial biogenesis and mtor-mediated mitophagy. Autophagy (2019) 15(1):131–50. doi: 10.1080/15548627.2018.1511263
7. Sinha RA, Singh BK, Yen PM. Thyroid hormone regulation of hepatic lipid and carbohydrate metabolism. Trends Endocrinol Metab (2014) 25(10):538–45. doi: 10.1016/j.tem.2014.07.001
8. van den Berg EH, van Tienhoven-Wind LJ, Amini M, Schreuder TC, Faber KN, Blokzijl H, et al. Higher free triiodothyronine is associated with non-alcoholic fatty liver disease in euthyroid subjects: The lifelines cohort study. Metabolism (2017) 67:62–71. doi: 10.1016/j.metabol.2016.11.002
9. Xu C, Xu L, Yu C, Miao M, Li Y. Association between thyroid function and nonalcoholic fatty liver disease in euthyroid elderly Chinese. Clin Endocrinol (Oxf) (2011) 75(2):240–6. doi: 10.1111/j.1365-2265.2011.04016.x
10. Bano A, Chaker L, Plompen EP, Hofman A, Dehghan A, Franco OH, et al. Thyroid function and the risk of nonalcoholic fatty liver disease: The Rotterdam study. J Clin Endocrinol Metab (2016) 101(8):3204–11. doi: 10.1210/jc.2016-1300
11. Liu G, Zheng X, Guan L, Jiang Z, Lin H, Jiang Q, et al. Free triiodothyronine levels are positively associated with non-alcoholic fatty liver disease in euthyroid middle-aged subjects. Endocr Res (2015) 40(4):188–93. doi: 10.3109/07435800.2014.987399
12. Chung GE, Kim D, Kim W, Yim JY, Park MJ, Kim YJ, et al. Non-alcoholic fatty liver disease across the spectrum of hypothyroidism. J Hepatol (2012) 57(1):150–6. doi: 10.1016/j.jhep.2012.02.027
13. Zhang L, Wang F, Wang L, Wang W, Liu B, Liu J, et al. Prevalence of chronic kidney disease in China: A cross-sectional survey. Lancet (2012) 379(9818):815–22. doi: 10.1016/s0140-6736(12)60033-6
14. Chinese Elderly Type 2 Diabetes Prevention and Treatment of Clinical Guidelines Writing Group; Geriatric Endocrinology and Metabolism Branch of Chinese Geriatric Society; Geriatric Endocrinology and Metabolism Branch of Chinese Geriatric Health Care Society; Geriatric Professional Committee of Beijing Medical Award Foundation; National Clinical Medical Research Center for Geriatric Diseases (PLA General Hospital). Clinical guidelines for prevention and treatment of type 2 diabetes mellitus in the elderly in China (2022 Edition). Zhonghua Nei Ke Za Zhi (2022) 61(1):12–50. doi: 10.3760/cma.j.cn112138-20211027-00751
15. Bureau of Disease Prevention and Control, National Health Commission of People′s Republic of China National Center for Cardiovascular DiseasesChinese Academy of Medical Science & Peking Union Medical College, Fuwai HospitalChinese Center for Control and PreventionChinese Society of Cardiology Chinese Medical Doctor Association Hypertension Committee National guideline for hypertension management in China (2019). Zhonghua Xin Xue Guan Bing Za Zhi (2020) 48(1):10–46. doi: 10.3760/cma.j.issn.0253-3758.2020.01.004
16. Song QB, Zhao Y, Liu YQ, Zhang J, Xin SJ, Dong GH. Sex difference in the prevalence of metabolic syndrome and cardiovascular-related risk factors in urban adults from 33 communities of China: The chpsne study. Diabetes Vasc Dis Res (2015) 12(3):189–98. doi: 10.1177/1479164114562410
17. Davis TME. Diabetes and metabolic dysfunction-associated fatty liver disease. Metabolism (2021) 123:154868. doi: 10.1016/j.metabol.2021.154868
18. Wang TY, Wang RF, Bu ZY, Targher G, Byrne CD, Sun DQ, et al. Association of metabolic dysfunction-associated fatty liver disease with kidney disease. Nat Rev Nephrol (2022) 18(4):259–68. doi: 10.1038/s41581-021-00519-y
19. Lim S, Kim JW, Targher G. Links between metabolic syndrome and metabolic dysfunction-associated fatty liver disease. Trends Endocrinol Metab (2021) 32(7):500–14. doi: 10.1016/j.tem.2021.04.008
20. Yang C, He Q, Chen Z, Qin JJ, Lei F, Liu YM, et al. A bidirectional relationship between hyperuricemia and metabolic dysfunction-associated fatty liver disease. Front Endocrinol (Lausanne) (2022) 13:821689. doi: 10.3389/fendo.2022.821689
21. Lee KW, Bang KB, Rhee EJ, Kwon HJ, Lee MY, Cho YK. Impact of hypothyroidism on the development of non-alcoholic fatty liver disease: A 4-year retrospective cohort study. Clin Mol Hepatol (2015) 21(4):372–8. doi: 10.3350/cmh.2015.21.4.372
22. Chen P, Hou X, Wei L, Feng L, Zhong L, Jiao L, et al. Free triiodothyronine is associated with the occurrence and remission of nonalcoholic fatty liver disease in euthyroid women. Eur J Clin Invest (2019) 49(4):e13070. doi: 10.1111/eci.13070
23. Liu Y, Wang W, Yu X, Qi X. Thyroid function and risk of non-alcoholic fatty liver disease in euthyroid subjects. Ann Hepatol (2018) 17(5):779–88. doi: 10.5604/01.3001.0012.3136
24. Tao Y, Gu H, Wu J, Sui J. Thyroid function is associated with non-alcoholic fatty liver disease in euthyroid subjects. Endocr Res (2015) 40(2):74–8. doi: 10.3109/07435800.2014.952014
25. Zhang X, Zhang J, Dai Y, Qin J. Serum thyroid hormones levels are significantly associated with nonalcoholic fatty liver disease in euthyroid Chinese population. Clin Lab (2020) 66(10):2047–53. doi: 10.7754/Clin.Lab.2020.200219
26. Wang B, Wang B, Yang Y, Xu J, Hong M, Xia M, et al. Thyroid function and non-alcoholic fatty liver disease in hyperthyroidism patients. BMC Endocr Disord (2021) 21(1):27. doi: 10.1186/s12902-021-00694-w
27. Chaker L, Bianco AC, Jonklaas J, Peeters RP. Hypothyroidism. Lancet (2017) 390(10101):1550–62. doi: 10.1016/s0140-6736(17)30703-1
28. Cheng SY, Leonard JL, Davis PJ. Molecular aspects of thyroid hormone actions. Endocr Rev (2010) 31(2):139–70. doi: 10.1210/er.2009-0007
29. Grasselli E, Voci A, Canesi L, De Matteis R, Goglia F, Cioffi F, et al. Direct effects of iodothyronines on excess fat storage in rat hepatocytes. J Hepatol (2011) 54(6):1230–6. doi: 10.1016/j.jhep.2010.09.027
30. Mavromati M, Jornayvaz FR. Hypothyroidism-associated dyslipidemia: Potential molecular mechanisms leading to nafld. Int J Mol Sci (2021) 22(23):12797. doi: 10.3390/ijms222312797
31. Marschner RA, Arenhardt F, Ribeiro RT, Wajner SM. Influence of altered thyroid hormone mechanisms in the progression of metabolic dysfunction associated with fatty liver disease (Mafld): A systematic review. Metabolites (2022) 12(8):675. doi: 10.3390/metabo12080675
32. Ferrandino G, Kaspari RR, Spadaro O, Reyna-Neyra A, Perry RJ, Cardone R, et al. Pathogenesis of hypothyroidism-induced nafld is driven by intra- and extrahepatic mechanisms. Proc Natl Acad Sci U.S.A. (2017) 114(43):E9172–e80. doi: 10.1073/pnas.1707797114
33. Tanase DM, Gosav EM, Neculae E, Costea CF, Ciocoiu M, Hurjui LL, et al. Hypothyroidism-induced nonalcoholic fatty liver disease (Hin): Mechanisms and emerging therapeutic options. Int J Mol Sci (2020) 21(16):5927. doi: 10.3390/ijms21165927
34. De Pergola G, Ciampolillo A, Paolotti S, Trerotoli P, Giorgino R. Free triiodothyronine and thyroid stimulating hormone are directly associated with waist circumference, independently of insulin resistance, metabolic parameters and blood pressure in overweight and obese women. Clin Endocrinol (Oxf) (2007) 67(2):265–9. doi: 10.1111/j.1365-2265.2007.02874.x
35. Reinehr T, Isa A, de Sousa G, Dieffenbach R, Andler W. Thyroid hormones and their relation to weight status. Horm Res (2008) 70(1):51–7. doi: 10.1159/000129678
36. Taylor PN, Richmond R, Davies N, Sayers A, Stevenson K, Woltersdorf W, et al. Paradoxical relationship between body mass index and thyroid hormone levels: A study using mendelian randomization. J Clin Endocrinol Metab (2016) 101(2):730–8. doi: 10.1210/jc.2015-3505
37. Roef GL, Rietzschel ER, Van Daele CM, Taes YE, De Buyzere ML, Gillebert TC, et al. Triiodothyronine and free thyroxine levels are differentially associated with metabolic profile and adiposity-related cardiovascular risk markers in euthyroid middle-aged subjects. Thyroid (2014) 24(2):223–31. doi: 10.1089/thy.2013.0314
38. Ortega FJ, Jílková ZM, Moreno-Navarrete JM, Pavelka S, Rodriguez-Hermosa JI, Kopeck Ygrave J, et al. Type I iodothyronine 5'-deiodinase mrna and activity is increased in adipose tissue of obese subjects. Int J Obes (Lond) (2012) 36(2):320–4. doi: 10.1038/ijo.2011.101
39. Xia SF, Duan XM, Hao LY, Li LT, Cheng XR, Xie ZX, et al. Role of thyroid hormone homeostasis in obesity-prone and obesity-resistant mice fed a high-fat diet. Metabolism (2015) 64(5):566–79. doi: 10.1016/j.metabol.2014.12.010
40. Araujo RL, Andrade BM, Padrón AS, Gaidhu MP, Perry RL, Carvalho DP, et al. High-fat diet increases thyrotropin and oxygen consumption without altering circulating 3,5,3'-triiodothyronine (T3) and thyroxine in rats: The role of iodothyronine deiodinases, reverse T3 production, and whole-body fat oxidation. Endocrinology (2010) 151(7):3460–9. doi: 10.1210/en.2010-0026
41. Araujo RL, Carvalho DP. Bioenergetic impact of tissue-specific regulation of iodothyronine deiodinases during nutritional imbalance. J Bioenerg Biomembr (2011) 43(1):59–65. doi: 10.1007/s10863-011-9327-x
42. Walczak K, Sieminska L. Obesity and thyroid axis. Int J Environ Res Public Health (2021) 18(18):9434. doi: 10.3390/ijerph18189434
43. Santini F, Marzullo P, Rotondi M, Ceccarini G, Pagano L, Ippolito S, et al. Mechanisms in endocrinology: The crosstalk between thyroid gland and adipose tissue: Signal integration in health and disease. Eur J Endocrinol (2014) 171(4):R137–52. doi: 10.1530/eje-14-0067
44. Staníková D, Krajčovičová L, Demková L, Forišek-Paulová P, Slobodová L, Vitariušová E, et al. Food preferences and thyroid hormones in children and adolescents with obesity. Front Psychiatry (2022) 13:962949. doi: 10.3389/fpsyt.2022.962949
45. Gutiérrez-Cuevas J, Santos A, Armendariz-Borunda J. Pathophysiological molecular mechanisms of obesity: A link between mafld and Nash with cardiovascular diseases. Int J Mol Sci (2021) 22(21):11629. doi: 10.3390/ijms222111629
46. Harrison SA, Bashir MR, Guy CD, Zhou R, Moylan CA, Frias JP, et al. Resmetirom (Mgl-3196) for the treatment of non-alcoholic steatohepatitis: A multicentre, randomised, double-blind, placebo-controlled, phase 2 trial. Lancet (2019) 394(10213):2012–24. doi: 10.1016/s0140-6736(19)32517-6
47. Harrison SA, Bashir M, Moussa SE, McCarty K, Pablo Frias J, Taub R, et al. Effects of resmetirom on noninvasive endpoints in a 36-week phase 2 active treatment extension study in patients with Nash. Hepatol Commun (2021) 5(4):573–88. doi: 10.1002/hep4.1657
48. Younossi ZM, Stepanova M, Taub RA, Barbone JM, Harrison SA. Hepatic fat reduction due to resmetirom in patients with nonalcoholic steatohepatitis is associated with improvement of quality of life. Clin Gastroenterol Hepatol (2022) 20(6):1354–61.e7. doi: 10.1016/j.cgh.2021.07.039
49. Perra A, Simbula G, Simbula M, Pibiri M, Kowalik MA, Sulas P, et al. Thyroid hormone (T3) and trbeta agonist gc-1 Inhibit/Reverse nonalcoholic fatty liver in rats. FASEB J (2008) 22(8):2981–9. doi: 10.1096/fj.08-108464
50. Ding WJ, Wang MM, Wang GS, Shen F, Qin JJ, Fan JG. Thyroid function is associated with non-alcoholic fatty liver disease in chronic hepatitis b-infected subjects. J Gastroenterol Hepatol (2015) 30(12):1753–8. doi: 10.1111/jgh.12998
51. Zhang J, Sun H, Chen L, Zheng J, Hu X, Wang S, et al. Relationship between serum tsh level with obesity and nafld in euthyroid subjects. J Huazhong Univ Sci Technolog Med Sci (2012) 32(1):47–52. doi: 10.1007/s11596-012-0008-8
52. Carulli L, Ballestri S, Lonardo A, Lami F, Violi E, Losi L, et al. Is nonalcoholic steatohepatitis associated with a high-Though-Normal thyroid stimulating hormone level and lower cholesterol levels? Intern Emerg Med (2013) 8(4):297–305. doi: 10.1007/s11739-011-0609-4
53. Tian L, Song Y, Xing M, Zhang W, Ning G, Li X, et al. A novel role for thyroid-stimulating hormone: Up-regulation of hepatic 3-Hydroxy-3-Methyl-Glutaryl-Coenzyme a reductase expression through the cyclic adenosine Monophosphate/Protein kinase a/Cyclic adenosine monophosphate-responsive element binding protein pathway. Hepatology (2010) 52(4):1401–9. doi: 10.1002/hep.23800
54. Sorisky A, Bell A, Gagnon A. Tsh receptor in adipose cells. Horm Metab Res (2000) 32(11-12):468–74. doi: 10.1055/s-2007-978672
55. Valyasevi RW, Harteneck DA, Dutton CM, Bahn RS. Stimulation of adipogenesis, peroxisome proliferator-activated receptor-gamma (Ppargamma), and thyrotropin receptor by ppargamma agonist in human orbital preadipocyte fibroblasts. J Clin Endocrinol Metab (2002) 87(5):2352–8. doi: 10.1210/jcem.87.5.8472
56. Lu S, Guan Q, Liu Y, Wang H, Xu W, Li X, et al. Role of extrathyroidal tshr expression in adipocyte differentiation and its association with obesity. Lipids Health Dis (2012) 11:17. doi: 10.1186/1476-511x-11-17
57. Menendez C, Baldelli R, Camiña JP, Escudero B, Peino R, Dieguez C, et al. Tsh stimulates leptin secretion by a direct effect on adipocytes. J Endocrinol (2003) 176(1):7–12. doi: 10.1677/joe.0.1760007
Keywords: metabolic dysfunction-associated fatty liver disease, thyroid function parameters, nonlinear relationship, restricted cubic spline analysis, multivariable-adjusted logistic regression models
Citation: Hu Y, Zhou F, Lei F, Lin L, Huang X, Sun T, Liu W, Zhang X, Cai J, She Z-G and Li H (2023) The nonlinear relationship between thyroid function parameters and metabolic dysfunction-associated fatty liver disease. Front. Endocrinol. 14:1115354. doi: 10.3389/fendo.2023.1115354
Received: 03 December 2022; Accepted: 10 February 2023;
Published: 22 February 2023.
Edited by:
Pieter de Lange, University of Campania Luigi Vanvitelli, ItalyReviewed by:
Fabiano Cimmino, University of Naples Federico II, ItalyMing Zhang, Capital Medical University, China
Copyright © 2023 Hu, Zhou, Lei, Lin, Huang, Sun, Liu, Zhang, Cai, She and Li. This is an open-access article distributed under the terms of the Creative Commons Attribution License (CC BY). The use, distribution or reproduction in other forums is permitted, provided the original author(s) and the copyright owner(s) are credited and that the original publication in this journal is cited, in accordance with accepted academic practice. No use, distribution or reproduction is permitted which does not comply with these terms.
*Correspondence: Hongliang Li, bGlobEB3aHUuZWR1LmNu; Zhi-Gang She, emdzaGVAd2h1LmVkdS5jbg==
†These authors have contributed equally to this work