 Yinuo Hou
 Yan Gao1
 Shudi Guo
 Ruibing Chen
 Xiangyang Zhang
95% of researchers rate our articles as excellent or good
Learn more about the work of our research integrity team to safeguard the quality of each article we publish.
Find out more
REVIEW article
Front. Endocrinol. , 10 January 2023
Sec. Cancer Endocrinology
Volume 13 - 2022 | https://doi.org/10.3389/fendo.2022.993081
This article is part of the Research Topic Integrated Diagnostics and Biomarker Discovery in Endocrinology and Biomedical Sciences View all 17 articles
Endocrine tumors derive from endocrine cells with high heterogeneity in function, structure and embryology, and are characteristic of a marked diversity and tissue heterogeneity. There are still challenges in analyzing the molecular alternations within the heterogeneous microenvironment for endocrine tumors. Recently, several proteomic, lipidomic and metabolomic platforms have been applied to the analysis of endocrine tumors to explore the cellular and molecular mechanisms of tumor genesis, progression and metastasis. In this review, we provide a comprehensive overview of spatially resolved proteomics, lipidomics and metabolomics guided by mass spectrometry imaging and spatially resolved microproteomics directed by microextraction and tandem mass spectrometry. In this regard, we will discuss different mass spectrometry imaging techniques, including secondary ion mass spectrometry, matrix-assisted laser desorption/ionization and desorption electrospray ionization. Additionally, we will highlight microextraction approaches such as laser capture microdissection and liquid microjunction extraction. With these methods, proteins can be extracted precisely from specific regions of the endocrine tumor. Finally, we compare applications of proteomic, lipidomic and metabolomic platforms in the field of endocrine tumors and outline their potentials in elucidating cellular and molecular processes involved in endocrine tumors.
The endocrine system comprises thyroid gland, pituitary gland, parathyroid glands, adrenal glands, pancreas, gonads, pineal gland and thymus. The endocrine glands secrete hormones, which directly enter the bloodstream and come into effect until they reach their target organs. These hormones trigger complicated biological processes, including energy homeostasis, metabolism, reproduction, growth and motions (1).
Endocrine tumors derive from endocrine cells with high heterogeneity in function, structure and embryology, and are characteristic of a marked diversity and tissue heterogeneity (2). They occur in any of the major endocrine organs, including thyroid gland, pituitary gland, parathyroid glands, adrenal glands and the endocrine pancreas (3–6). According to the latest WHO classification, endocrine tumors include pituitary tumors, thyroid neoplasms, parathyroid tumors, paragangliomas and pheochromocytomas, neuroendocrine neoplasms, adrenal cortical tumors and familial endocrine tumor syndromes (7–13). Though most endocrine tumors are benign or low-grade cancers that grow and spread slowly, a few are malignant. For example, thyroid carcinoma is the most common endocrine malignancy (14–17). Based on the GLOBOCAN estimation on cancer incidence and mortality, provided by the International Agency for Research on Cancer, the global incidence of thyroid carcinoma ranked 7th in both sexes and 4th for women in 2020. The mortality of thyroid carcinoma is relatively lower compared to other cancers (0.5 per 100,000 in women and 0.3 per 100,000 in men) (18). The diagnosis of endocrine tumors can be performed by blood/urine tests, ultrasound, computed tomography, magnetic resonance imaging, biopsy and so on (19–22). Fine needle aspiration (FNA) biopsy is frequently recommended to diagnose thyroid neoplasms and parathyroid tumors, where a needle is inserted into the nodules or lumps of patients to collect cells. FNA is a simple diagnostic modality. But it is limited in discriminating ambiguous carcinoma subtypes and additional surgical procedures are required to obtain final diagnosis (23, 24).
The occurrence of endocrine tumors often brings about hyper- or hypo- hormone secretion and potentially causes a succession of disorders, such as hypercalcemia, hypertension and hyperthyroidism (25–28). The tumor tissues comprise of various cell types (such as neoplastic cells, endothelial cells, immune cells, etc.), subpopulations and substructures, which in turn lead to the formation of heterogeneous tissue microenvironment (29–31). Treatments should not only be directed at tumor cells but also should take molecular and cellular interactions within the tumor microenvironment into consideration. High heterogeneity of endocrine tumors is one challenge for the analyses at molecular level. To comprehensively clarify the molecule alternations, both chemical information and spatial distribution of molecules within the tumor microenvironment need to be taken into account. Spatial omics offers increasing insights into pathobiological processes of tumor microenvironment, which allows to understand the location of a cell within tissue, indicates where proteins, lipids or metabolites are expressed in a spatial context and facilitates the identification of unknown cellular regulation processes (32). Mass spectrometry (MS) has shown its advantages in analyzing biomolecules (proteins, peptides, lipids, metabolites, etc.) of complex biological samples at the spatially resolved level (33–35).
Mass spectrometry is an incredibly sensitive analytical technique (down to fmol) that measures the mass-to-charge ratio (m/z) of molecules and atoms to determine their molecular weight, enabling qualitative and quantitative analysis for the samples (36, 37). The ion source, mass analyzer and detector are essential components for a mass spectrometer. The sample is first ionized by the ion source to generate a mixture of ions. In the following, the mass analyzer takes the ions and separates them based on m/z value. Finally, the ions reach the detector and yield signals. Different ionization techniques include electron ionization, chemical ionization, secondary ion mass spectrometry (SIMS), desorption electrospray ionization (DESI), field ionization, fast atom bombardment, laser desorption/ionization (LDI), electrospray ionization (ESI), matrix-assisted laser desorption/ionization (MALDI) and so on (38). There are also multiple types of mass analyzers, such as time-of-flight (TOF), magnetic sector, linear quadrupole, linear quadrupole ion trap, quadrupole ion trap, Fourier transform-ion cyclotron resonance (FT-ICR) and Orbitrap (39). TOF mass analyzers separate ions according to their m/z values based on the length of time it takes them to travel through a flight tube. One advantage of TOF is that it can possess a wide range of m/z values. FT-ICR mass analyzers separate ions based on a magnetic field while Orbitrap mass analyzers use an electrostatic field. Both FT-ICR and Orbitrap mass analyzers have high mass resolution and mass accuracy (40, 41). Tandem mass spectrometer (MS/MS) is involved with more than one mass analyzer in a single instrument. In MS/MS, the precursor ions (generated by DESI, ESI, MALDI, etc.) with a specific m/z value are selected and fragmented in a collision cell or chamber to generate product ions for detection (42). Fragmentation techniques include collision induced dissociation, high-energy collision dissociation, electron-capture dissociation, electron transfer dissociation, ultraviolet photodissociation and so on (43–47). Mass spectrometry imaging (MSI) is an imaging technique for in situ analysis of tissues and cells by determining the relative abundance and distribution of biomolecules (e.g., peptides, proteins, lipids, and metabolites) based on MS (48). For MSI, the sample is ionized pixel by pixel and a mass spectrum is generated for each pixel. The mass spectra are collected at discrete x, y coordinates. For a given m/z value, a heat map image can be created by plotting its intensities in all pixels across the scanned area (49–51). MSI can detect and image thousands of biomolecules in a single run, serving as a promising technique in biological and clinical analysis (52–55). Liquid chromatography-mass spectrometry (LC-MS) and liquid chromatography with tandem mass spectrometry (LC-MS/MS) involve the chromatographic separation of analytes followed by the detection of their m/z value. With the help of high-performance liquid chromatography or ultra-performance liquid chromatography, the complexity of analytes extracted from the biological samples is effectively reduced and more analytes can be detected by MS (56). To provide a broad coverage of molecules with different chemical and physical properties, different chromatographic platforms are developed, including reversed-phase chromatography, hydrophobic-interaction chromatography and ion exchange chromatography (57–59). LC-MS and LC-MS/MS are widely used in the biological and clinical research, including the field of endocrine tumors (60–65). Spatially resolved LC-MS can be achieved by coupling with laser microdissection (LMD) or liquid microjunction (LMJ), which are two microextraction methods used to extract analytes within the target area of the heterogeneous tumors (66, 67). The combination of microextraction and LC-MS allows the measurement of m/z value and spatial location of analytes in the samples.
With the development of MS techniques, chromatographic separation methods and microextraction methods, great progress has been made in clarifying the cellular and molecular mechanisms of endocrine tumorigenesis, progression and metagenesis (68–70). Many biomolecules, such as proteins, lipids and metabolites that present significantly different expression between the tumor tissue and the normal tissue have the potential to act as diagnostic and prognostic biomarkers and therapeutic targets for endocrine tumors (71–73). For example, Coelho et al. reviewed the capability of MS in the diagnosis of thyroid carcinoma from metabolomics. Rossi et al. summarized the potential of steroid profiling by MS in the management of adrenocortical carcinoma (ACC), and Li et al. reviewed the use of MS in proteome-centered multi-omics of human pituitary adenomas (74–76). In this review, we will focus on the application of MS in the field of spatial multi-omics (proteomics, lipidomics and metabolomics) of endocrine tumors, highlighting MSI, LC-MS and microextraction methods. In Supplementary Table 1, spatially resolved proteomics, lipidomics, and metabolomics on endocrine tumors are summarized.
Mass spectrometry imaging is capable of mapping thousands of biomolecules in situ without labelling. Different ion sources and instrument configurations provide different MSI approaches. Secondary ion mass spectrometry-mass spectrometry imaging (SIMS-MSI), matrix-assisted laser desorption/ionization-mass spectrometry imaging (MALDI-MSI) and desorption electrospray ionization-mass spectrometry imaging (DESI-MSI) are the most widely used platforms. SIMS was the first technique employed for tissue imaging (77, 78). The spot size of primary ion beam can be focused to ~50 nm. SIMS is characteristic of high spatial resolution (79–81). In 1997, Caprioli et al. introduced MALDI-MS for tissue imaging (82). With the broad molecule detection coverage, MALDI-MSI is popularly used in the imaging of proteins, lipids and metabolites within biological tissues (83–85). DESI was presented in 2004 and the potential for spatial analysis of plant or animal tissues was demonstrated (86). In 2005, Wiseman et al. reported the first application of DESI-MSI in imaging mouse pancreas, rat brain and metastatic human liver adenocarcinoma tissues (87). These three MSI techniques give full play to their individual advantages in biological and clinical research involved with endocrine tumors (88–93). Their respective advantages and disadvantages are listed in Table 1.
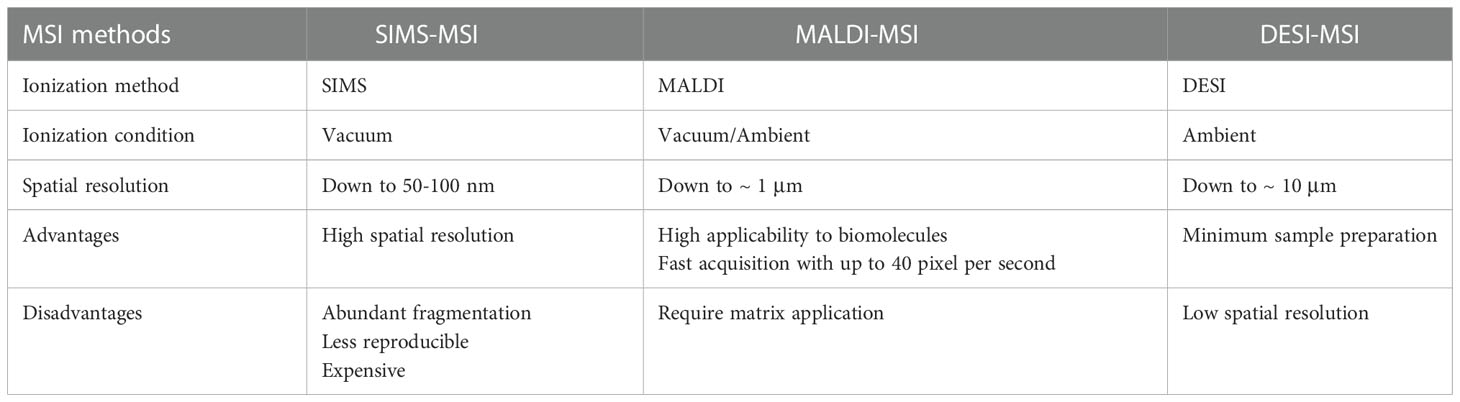
Table 1 Advantages and disadvantages of SIMS-MSI, MALDI-MSI and DESI-MSI.
SIMS-MSI can reach micron and submicron spatial resolution, capable of imaging single cells or subcellular organelles (94–96). The highest spatial resolution of SIMS-MSI, down to tens of nanometers, outperforms the other two MSI techniques (97–99). The principle of SIMS-MSI is shown in Figure 1A. In SIMS-MSI, a high-energy primary ion beam strikes the sample surface, causing the interaction of sputtering, ion reflection and recoil sputtering between the ions and the surface. The interaction processes result in the emission of secondary ions (100).
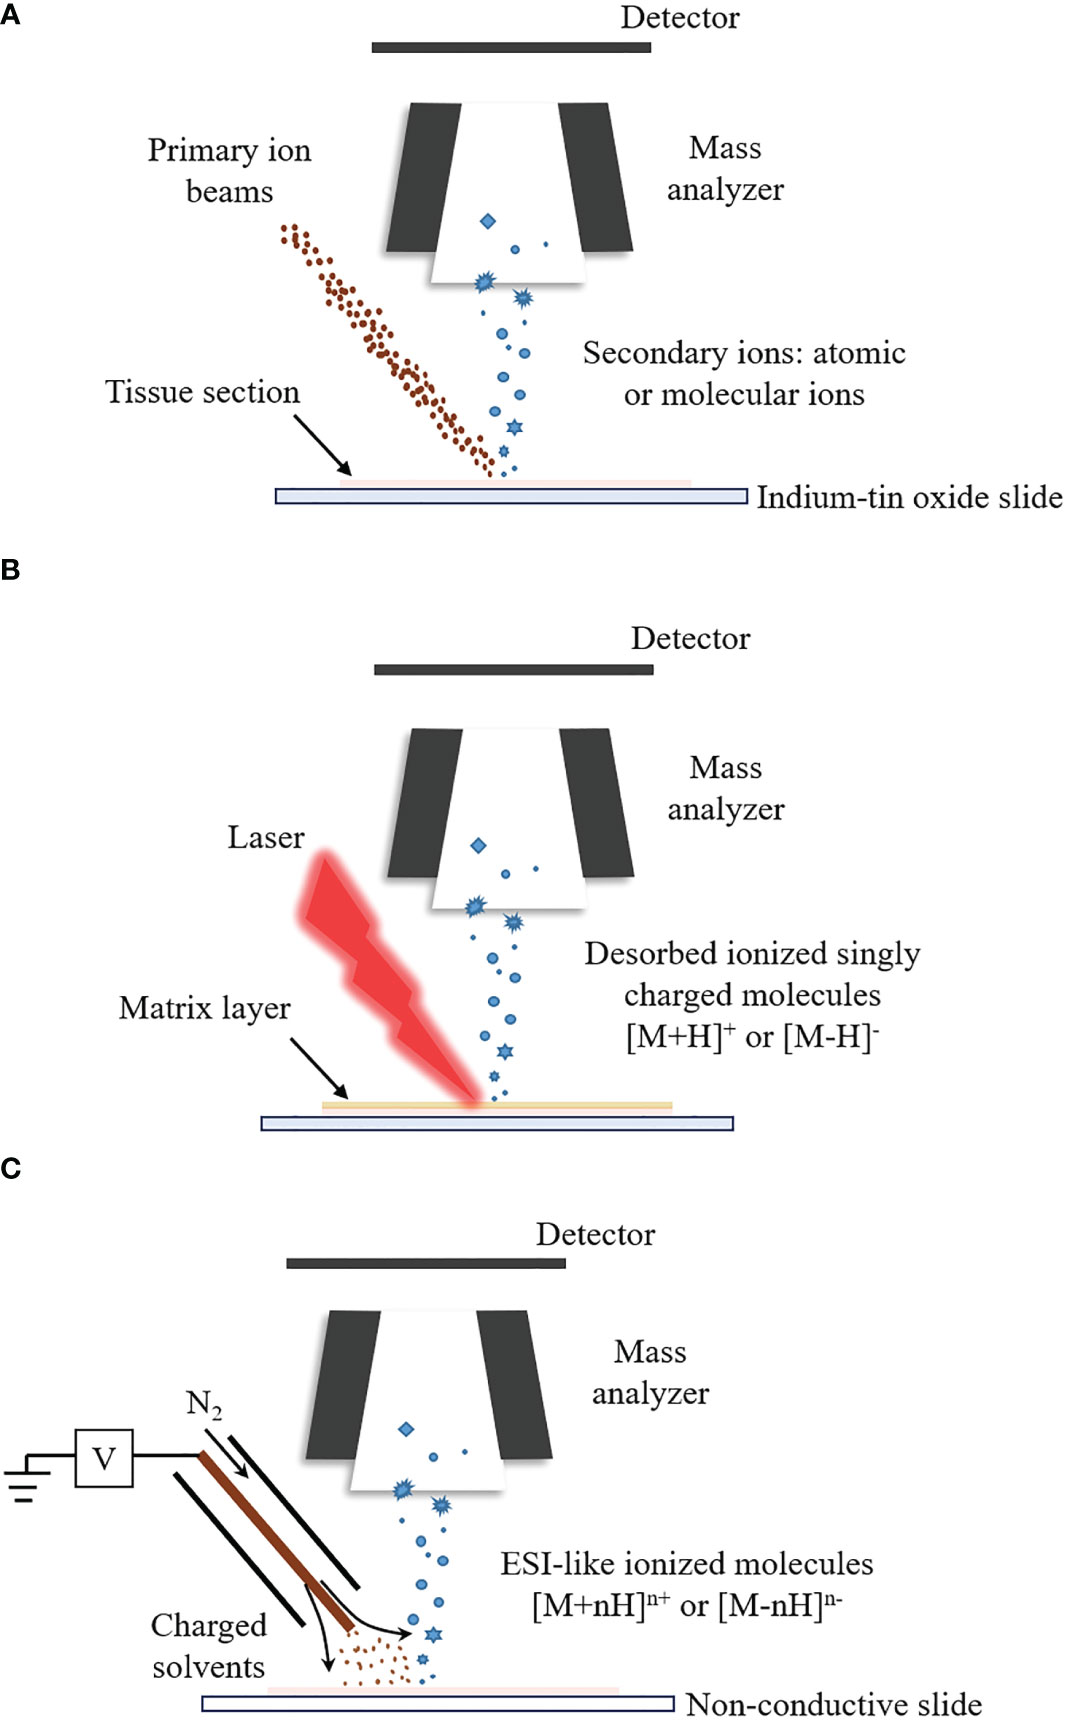
Figure 1 The ionization principles for SIMS-MSI, MALDI-MSI and DESI-MSI. A mass spectrometer is at least composed of ion source, mass analyzer and detector. Different ion sources determine different ionization process. (A) Ionization process of SIMS-MSI. A primary ion beam possessing energy strikes the sample surface, causing the interaction between the ions and the surface. The interaction processes bring about the emission of atoms and molecules from the sample surface. (B) Ionization process of MALDI-MSI. Before the analysis, the matrix is applied to the sample surface. The matrix forms co-crystals with the analytes. The co-crystals can absorb the laser’s energy upon laser irradiation. The energy uptake then causes evaporation and desorption/ionization of the analytes. (C) Ionization process of DESI-MSI. It is carried out by applying pneumatically-assisted electrospray, which produces charged solvent droplets directly at the sample surface. The charged droplets impact the surface and produce gaseous ions.
There are various types of commercially available primary ion beams, including monatomic (Au+, Cs+ and O-) and polyatomic ion beams (), liquid metal ion guns (LMIGs) ( and ) and gas cluster ion beams (GCIBs) (, (CO2 and (101–106). The sensitivity and spatial resolution of SIMS-MSI are influenced by the type, the energy and the focusing spot size of the primary ion beams. The monatomic ion beams limit SIMS-MSI to the detection of elements or very small (e.g., diatomic) fragments of molecules (107). LMIGs produce increased sensitivity while still being readily focused to tens to hundreds of nanometers. The use of polyatomic ion beams and GCIBs further improves the sensitivity to higher mass species (102). Lipids and metabolites have been spatially resolved in different cell types of breast cancer (105). A primary ion beam with high energy tends to have high secondary ion yields. However, highly energetic primary ion beams induce strong fragmentation of the analytes and generate very small ion fragments (97). The spatial resolution of SIMS-MSI can reach a few hundred nanometers when the spot size of primary ion beam is focused ≤ 50 nm (108). For GCIBs, the typical optimal spot size is around 1-5 μm and the increased sensitivity is obtained at a loss of spatial resolution (107). For SIMS-MSI, it is essential to select a primary ion beam with appropriate energy (typically between 25 and 70 keV kinetic energy) and focusing spot size to obtain ideal sensitivity and spatial resolution. The selection depends on the types of target tissues and target analytes (109).
MALDI-MSI can measure molecules with a wide mass coverage, ranging from 100 Da to beyond 100kDa; and it can measure molecules with different polarities, ranging polar lipids to ionic metabolites (110–112). The majority of MSI studies are performed by MALDI-MSI (113). In MALDI-MSI, the desorption/ionization of the analytes is performed with the assistance of matrices, as described in Figure 1B (114). The matrix is applied to the sample surface and form co-crystals with the analytes. The co-crystals can absorb energy upon laser irradiation. The energy uptake then causes evaporation and ionization of the analyte (82, 115).
The matrices do make a great difference to the ionization process and the selection mainly depends on chemical properties of the molecules of interest (116). The matrices are generally crystalline solids of low vapor pressure. Including 2,5-dihydroxybenzoic acid (2,5-DHB), alpha-cyano-4-hydroxycinnamic acid (CHCA), sinapinic acid (SA), 9-aminoacridine (9-AA) and 1,5-diaminonaphthalene, a diversity of common organic matrices that fit the ionization of different classes of molecular species are listed in Table 2 (129, 132–138). SA is frequently used to assist the ionization of intact proteins (139). 2,5-DHB can be used to image lipids, peptides, and amino acids in the positive ion mode (140–142). 9-AA is preferred to be performed under negative ion mode for the ionization of polar metabolites (143). The application of matrices is required to assist the ionization and subsequent detection of analytes. However, matrices sometimes bring about ion suppression effects and induce sensitivity loss for analytes (144). CHCA is commonly used as a MALDI matrix in the ionization of peptides. When the peptide sample is quite dilute and/or the sample contains salts, the CHCA matrix can form clusters with m/z value above 500 (145, 146). These intense CHCA clusters may interfere with peptide signals and complicate the spectra. To reduce the ion suppression effects of CHCA matrix, Ucal et al. used ammonium phosphate monobasic as the addictive of CHCA in the analysis of thyroid carcinoma tissue and found that the addition of ammonium phosphate monobasic could decrease CHCA cluster formation and improve the peptide signals (147). Schlosser et al. utilized different matrix components, additives and a cationizing agent to analyze the effects of matrix composition on signal suppression and found that the mixture of 2,5-DHB and CHCA yielded highly improved ion signals in peptide analysis, compared with using CHCA alone (148). Apart from the matrix clusters, matrices (such as CHCA and 2,5-DHB) could also form adducts with lipids, amines and amino acids. The metabolite-matrix adducts decrease the intensities of the metabolites and further complicate the MS spectra (149).
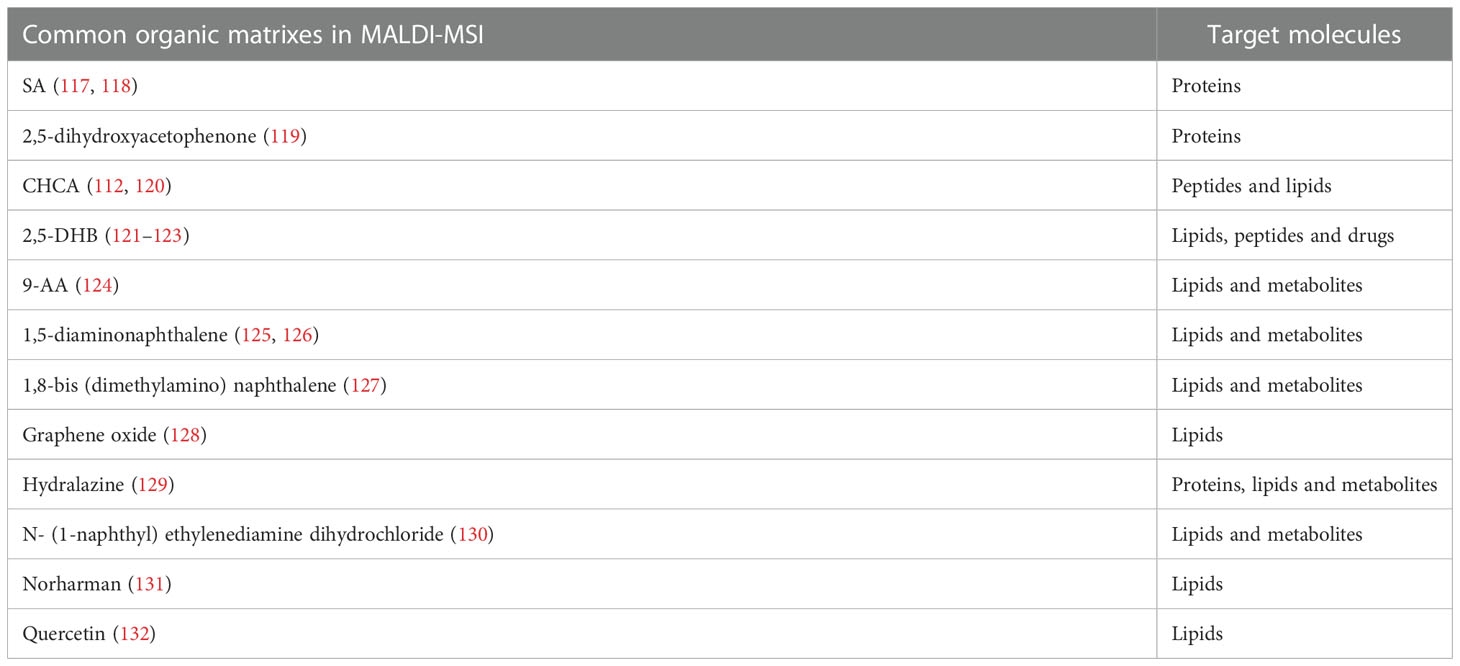
Table 2 Common organic matrixes applied in MALDI-MSI.
DESI-MSI is carried out by applying pneumatically-assisted electrospray to produce charged solvent droplets directly at the sample surface (150, 151). The charged droplets impact the surface and produce gaseous ions, which are mainly multiply charged as in the case with ESI (Figure 1C) (86, 152–154). DESI-MSI is performed under ambient conditions and requires no matrix application or other advanced sample preparation, allowing biological tissues to be analyzed in their native state (155, 156). DESI-MSI is one of the MSI methods that have the least destructive effect on the biological tissues. The same tissue section is able to be analyzed repeatedly (77, 157, 158). The spatial resolution of DESI-MSI is typically 150-200 μm and the maximum is better than 10 μm (159).
Before a DESI-MSI analysis, it is essential to optimize the following parameters, including the spray solvent composition, the velocity of the spray gas, the spray-to-surface and sampling orifice-to-surface distance, sprayer-to-surface angle and surface-to-desolvation capillary angle (160–165). Failure of optimization of DESI-MSI parameters will lead to poor sensitivity and/or low spatial resolution.
Sample preparation protocols are of great importance for the MSI analysis, mainly encompassing sample collection, processing and post-sectioning treatments (166, 167). Improper sample collection and storage may induce degradation of the analytes or introduce interferences, such as blood and chemical reagents (168–170). Non-standard operations may cause variations in sensitivity, spatial resolution and mass accuracy among technical replicates, leading to poor reproducibility (171). And the obtained MSI results cannot reflect the real nature of tissues under study (172). Therefore, it is essential to standardize each sample preparation protocol before MS data acquisition (173).
As distinguished from LC-MS, MSI maps biomolecules directly from the tissue surface in situ. Therefore, it is important to preserve the original nature and integrity of the tissue during the process of sample preparation and data acquisition (51, 116). Most samples of endocrine tumors used in MSI analysis are surgically resected suspicious nodules or lumps, e.g., fresh frozen tissues and formalin fixed paraffin embedded (FFPE) blocks of tissues. In some cases, cytological samples are obtained by FNA (117, 174, 175). For fresh frozen tissues or cytological samples, it is necessary to reduce the time spent in harvesting the sample and the acquired fresh sample needs to be snap-frozen in liquid nitrogen right away (176–178). At last, samples can be preserved below -80° until the analysis. Heat-stabilization and in situ focused microwave irradiation are two alternatives to snap freezing the freshly harvested tissues (179). Heat-stabilization inactivates the enzymes by quickly heating the tissues to 95°C while in situ focused microwave irradiation heats the tissues with focused microwaves to deactivate enzymes within 2 seconds (180, 181). The processed tissues can be preserved in the freezer extended periods.
For FFPE tissue blocks, the fixation can preserve the cellular architecture and the composition of cells in the tissue; however, it also results in cross-linking between nucleic acids, between proteins and between nucleic acids and proteins (182). The cross-linking between proteins inhibits the proteomic analysis by MS seriously (183). This challenge can be overcome by specific sample processing and post-sectioning treatments.
Figure 2A shows sample preparation protocols of fresh frozen tissues in MSI. The first step is to slice the tissue into thin sections by cryo-microtome (typically 3-20 μm) (184–186). The tissue sections are then mounted onto the glass slides, metal targets or indium-tin oxide (ITO) coated glass slides. Before sectioning fresh frozen tissues, various embedding media can be used to preserve the morphology of the tissues and assist with the tissue section, including optimal cutting temperature medium (OCT), carboxymethyl cellulose, gelatin, agarose or ice (121, 187–191). However, OCT could suppress analyte signals and is not recommended in MSI (189, 192). A universal embedding media composed of hydroxypropyl methylcellulose and polyvinylpyrrolidone has been demonstrated to be compatible with SIMS-MSI, MALDI-MSI and DESI-MSI (193). The section temperature significantly varies according to tissue types (172, 194). Tissues containing water are sectioned at higher temperature whereas tissue samples that contain more fat can be sectioned at a lower temperature (195). For FFPE tissue blocks, the tissue sections can be analyzed by MSI after a series of treatments including deparaffinization, rehydration and antigen retrieval, as presented in Figure 2A. In addition, the cytologic samples collected by FNA are smeared onto ITO slides or non-conductive slides for the following MSI analysis (Figure 2B) (118, 174).
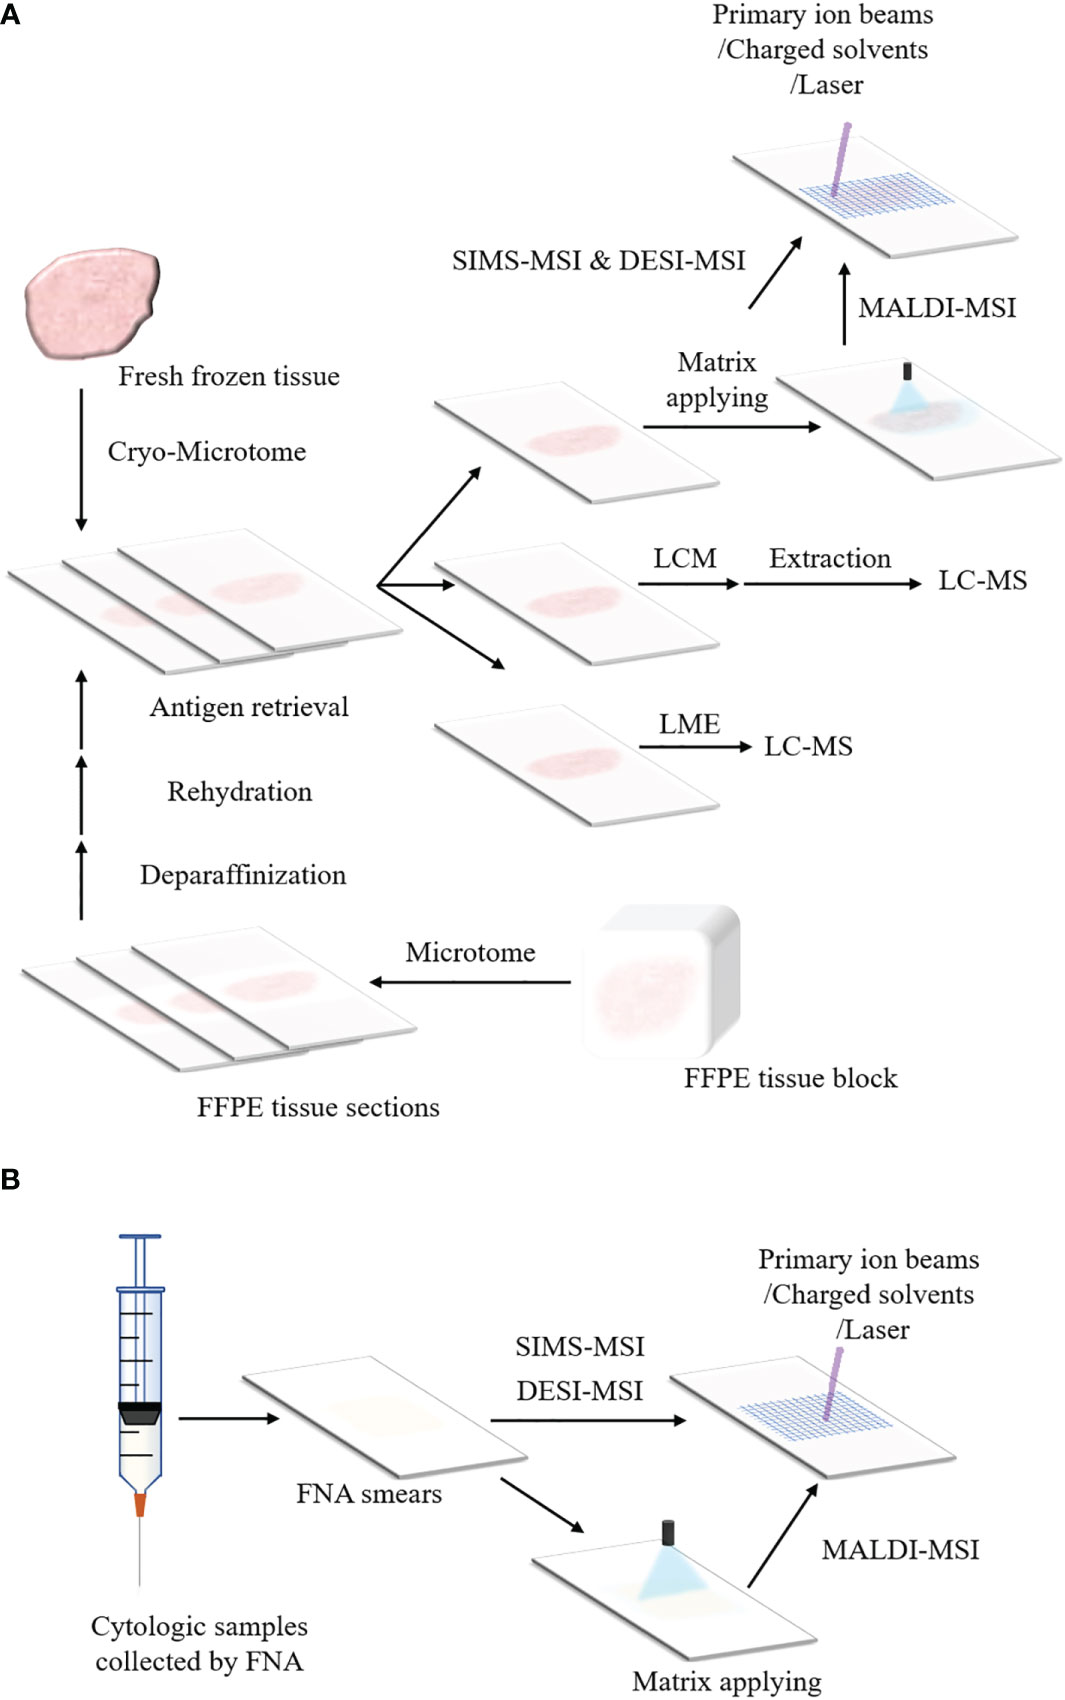
Figure 2 Schemes of sample preparation for MSI and microproteomics. (A) Preparation protocols of fresh frozen tissues and FFPE tissue blocks for MSI and LMD or LMJ guided microproteomics. The fresh frozen tissue is sliced into sections by cryo-microtome and the tissue sections are placed on ITO slides or non-conductive slides. Then the tissue sections can be processed with MSI (For MALDI-MSI, matrix applying before data acquisition is necessary). The tissue section can also be processed with LMD or LMJ. For LMD, the region of interest within the tissue section is cut off and extracted, followed by LC-MS. For LMJ, the extracts obtained from the target region within the tissue surface can be directly analyzed by LC-MS. After data acquisition, data analysis is performed. For the FFPE tissue block, it is sliced into tissue sections by microtome. These FFPE tissue sections can be analyzed by MSI or LC-MS until they are treated with deparaffinization, rehydration and antigen retrieval. (B) Preparation protocols of cytologic samples for MSI. The cytologic samples are collected by FNA. The cytologic samples are smeared onto the ITO slides or non-conductive slides for the analysis of MSI.
Histology staining is frequently cooperated with MSI to connect the histology features of the tissue with the molecular profiles (196). It has been demonstrated the distribution of biomolecules obtained by MSI correlates well with the histology structure of the tissue (197–199).
Post-sectioning treatments aim to enhance the sensitivity of analytes of interest. Biological tissues contain numerous molecular species, whose abundance varies widely. If the abundance of targeted analytes is relatively low, it is necessary to tailor post-sectioning treatments (200).
Washing is a common post-sectioning treatment, aiming to remove those interfering molecules and increase the signal intensity of target analytes within the samples (201). The washing strategy with ethanol solutions and water has been commonly applied in the proteomic analysis to remove interfering salts or lipids (202, 203). The washing solution with ammonium formate or ammonium acetate was proved to enhance detection sensitivity of lipid species (204).
For bottom-up proteomics, on-tissue digestion is performed, involving proteolytic digestion of proteins before analysis by MS (205–207). It is especially advantageous for FFPE samples. On-tissue digestion applies trypsin solution to the sample surface after antigen retrieval. The trypsin facilitates the digestion of cross-linking proteins (136, 208). Abdelmoula et al. studied FFPE tissue blocks of oncocytic follicular thyroid cancer by MALDI-MSI (209). Before the matrix application, the tissue section was proceeded with deparaffinization, dehydration, antigen retrieval and trypsin digestion. The MSI results showed that hundreds of proteolytic peptide ions were detected and that many of them exhibited specific distributions in association with the histological structure of the tissues. FFPE tissues treated with on-tissue digestion is proved to be compatible with the following proteomic analysis (210).
Chemical derivation is another post-sectioning strategy to increase the detection sensitivity of specific lipids and metabolites, such as steroids, catecholamine, and phospholipids (PLs) (211–215). Ibrahim et al. performed an on-tissue chemical derivation of dopamine, epinephrine and norepinephrine with 4- (N-methyl) pyridinium boronic acid in SIMS-MSI and LDI-MSI of porcine adrenal gland tissue (216). They demonstrated that the derivation significantly improved the detection sensitivity of catecholamines in tissue sections for both MSI techniques. Wang et al. achieved simultaneous imaging of free fatty acids (FFAs) and phospholipids with a high sensitivity in thyroid cancer tissue by chemical derivation of FFAs with N,N-dimethylpiperazine iodide (127).
The raw data of MSI is made of individual spectra with spatial and molecular information, so it is generally complex and high dimensional. The basic steps of MSI data processing consist of denoising, baseline subtraction, normalization, peak picking and peak alignment (217, 218). Due to variations in instruments, sample heterogeneity and sample preparation, noises and fluctuations in mass exist in the MSI raw data. Data processing helps reduce the technical and analytical variations, providing a more reliable elaboration of the MSI dataset (219). After data processing, the MSI dataset can be submitted to the statistical analysis. Huang et al. developed a data processing pipeline for spatially resolved metabolomics analysis (219). In the pipeline, 7 data pre-treatment methods (centering, normalization, automatic scaling, UV scaling, Pareto scaling, log transformation and square root transformation) were investigated before a partial least squares discriminant analysis. And the following score test and classification test revealed that log transformations can reveal more low-abundance biomarkers and produce better classification results.
The data analysis for MSI can be performed with MassImager, Biomap, Data Explorer, MALDI Imaging Team Imaging Computing System, FlexImaging, oMALDI Server 5.1 and SCiLS Lab (116, 220–225). Multivariate methods are applied, such as principal component analysis, clustering methods, factorization methods and classification methods (226). These statistical analyses may discriminate differential molecules between normal and tumor tissues and find potential biomarkers for the tumor. Different from the publicly available and commercial software tools, Cardinal is an open-source R package that implements data processing (normalization, baseline correction, peak detection and peak alignment), visualization of mass spectra, statistical segmentation (principal component analysis, Spatially-Aware and Spatially Aware Structurally Adaptive) and classification (partial least squares discriminant analysis and orthogonal projections) of ion images for MSI (227). Cardinal also introduced Spatial Shrunken Centroids, a novel method for model-based image segmentation and classification.
Gene alternations play a fundamental role in endocrine tumors (228, 229). For example, BRAF (v-Raf murine sarcoma viral oncogene homolog B1) mutations, RAS (rapidly accelerated fibrosarcoma) mutations and RET (Proto-oncogene tyrosine-protein kinase receptor Ret) rearrangements are common genetic alternations in papillary thyroid carcinoma (PTC) and follicular thyroid carcinoma (FTC); GNAS (guanine nucleotide binding protein, alpha stimulating) gene mutations happens in sporadic pituitary adenomas while MEN1 (menin 1) and AIP (aryl hydrocarbon receptor interacting protein) mutations in family isolated pituitary adenoma (230, 231). Though great achievements have been made in elucidating the mechanism and pathology of endocrine tumors through genomic analysis, the gene expression and protein expression lack apparent correlation (4, 232–234). Proteins are gene products, the executors of cellular processes and more closely related to the phenotypes (235). Proteomics is complementary to genomics in revealing the alternations in structure, function and interactions of proteins in tumorigenesis and tumor progress. With MSI as the analysis tool, proteomics in endocrine tumors has showed the potential to discover different protein signatures between the tumor tissues and adjacent normal tissues and to discriminate among different subtypes of thyroid cancers. The spatially resolved proteomics of endocrine tumors can contributed to a better understanding of the overall mechanism involved in the tumorigenesis, progression, and metastasis.
The application of MSI in proteomics is capable of discriminating between the normal tissue and the cancer tissue as well as distinguishing between different subtypes of thyroid tumors (236–238). Mainini et al. analyzed the cytological smears obtained by ex vivo FNA from 7 patients with hyperplastic nodules or PTC using MALDI-MSI (239). The MSI data was processed with hierarchical cluster analysis and principal component analysis to evaluate the different proteomic expressions. And hyperplastic nodules and PTC were successfully discriminated by hierarchical cluster analysis and principal component analysis. Pagni et al. used MALDI-MSI to compare the protein profiles of cytologic samples obtained from patients diagnosed as hyperplastic nodules, Hürthle cell follicular adenoma, medullary thyroid carcinoma (MTC) and PTC (176). They evaluated 6 proteins whose expression in PTC were different from that of benign lesions, but similar to that of MTC. Different protein profiles that could distinguish between PTC and MCT were also detected. Calligaris et al. presented the application of MALDI-MSI in detecting and discriminating nonpathological human pituitary glands, hormone secreting and non-secreting human pituitary adenomas (240). They validated the capability of MALDI-MSI to image prolactin (PRL), growth hormone (GH), adrenocorticotropic hormone (ACTH) and thyroid stimulating hormone (TSH) within normal glands and adenomas, but also submitted the MSI data to principal component analysis to evaluate the different protein signatures among nonpathological human pituitary glands, hormone secreting and non-secreting human pituitary adenomas. It was revealed that the sensitivity and specificity of MSI data distinguishing ACTH secreting adenomas from nonpathological pituitary were 100% and 93%, the sensitivity and specificity of MSI data distinguishing GH secreting adenomas from nonpathological pituitary were 82% and 100% and the sensitivity and specificity of MSI data distinguishing PRL secreting adenomas from nonpathological pituitary were 50% and 100%, respectively.
The application of MSI proteomics is also capable of finding potential protein biomarkers for the diagnosis of endocrine tumors (241). Nipp et al. performed MALDI-MSI and immunohistochemistry (IHC) on PTC tissues to find biomarkers for the metastasis of PTC (242). Using MALDI-MSI, they successfully found that thioredoxin, S100-A10 (p11, the ligand of Annexin-II) and S100-A6 (Calcyclin) could specially distinguish metastatic PTC from non-metastatic PTC. And IHC validated that these three overexpressed proteins were significantly associated with lymph node metastasis of PTC with p values < 0.005 (p value for thioredoxin: 0.00003; p value for S100A10: 0.00018; p value for S100-A6: 0.0013; Fisher’s exact test).
The application of MSI in proteomics is capable of bringing insight into the endocrine tumor progression. Tissue necrosis is common in advanced and aggressive solid tumors (243). Scott et al. studied the N-linked glycosylation of proteins in human thyroid cancer tissue by MALDI-MSI (244). They demonstrated that proteins with high mannose or branched glycans were specially distributed in the cancer and stromal regions, whereas the glycans of proteins in necrotic regions presented limited branching, contained sialic acid modification and lacked fucose modification. Gawin et al. used MALDI-MSI to compare protein profiles between the primary PTC located in the thyroid gland and the PTC with synchronous metastases in regional lymph nodes (245). Thirty-six proteins were found remarkably different in abundance between primary PTC and metastatic PTC, which were then annotated as proteins involved in the organization of the cytoskeleton and chromatin, as well as proteins involved in immunity-related functions.
Lipids are hydrophobic or amphipathic compounds with great differences in their chemical composition and structure (246). Lipids are divided into 8 categories: fatty acyls, glycerolipids, glycerophospholipids, sphingolipids, sterol lipids, prenol lipids, saccharolipids and polyketides (247). Lipids involve in many essential cellular processes, including chemical-energy storage, composition of cell membrane bilayer, cell-cell interactions and cellular signal transduction. Lipidomics has been defined as a tool of full characterization of lipid molecular species and of their biological roles with respect to expression of proteins involved in lipid metabolism and function, including gene regulation (248). Abnormal lipid metabolism has been considered as a key feature of cancers (249–252). Stearoyl-CoA desaturase (SCD1) has been proved to be highly expressed in PTC, FTC and anaplastic thyroid carcinoma (ATC) (253, 254). SCD1, a fatty acyl desaturase encoded by stearoyl-CoA desaturase 1 gene, plays an important role in de novo lipid biosynthesis (255). It is a rate-limiting enzyme in the reaction of producing monounsaturated fatty acids (such as oleic acid and palmitoleic acid) from saturated fatty acids (such as stearic and palimitic acid). Monounsaturated fatty acids are the substrates for the synthesis of triglycerides, sphingolipids, glycolipids, (PLs), and other lipoproteins (256, 257). The elevated SCD1 promotes the proliferation, migration and invasion of cancer cells in PTC, FTC and ATC. Several research groups have focused on the lipidomics of endocrine tumors by MSI to analyze multiple lipid species and detect lipid alternations during the tumorigenesis (177, 258).
MSI showed the competency for detecting specific phosphatidylcholine (PC), sphingomyelin (SM) and phosphatidic acid (PA) species that may associate with the pathological behaviors of PTC. Ishikawa et al. investigated the distribution of lipids within cancerous and normal tissues from PTC patients using MALDI-MSI and MS/MS identification (259). The MSI analysis was performed by MALDI-TOF/TOF with 2,5-DHB as the matrix. And it was found that three species with m/z value 798.5, 796.5 and 741.5 were remarkably increased in the cancerous tissue compared to the normal tissue. A hybrid quadrupole/TOF mass spectrometer equipped with an orthogonal MALDI source was used to identify these three ions as [PC (16:0/18:1)+K]+ and [PC (16:0/18:2)+K]+ and [SM (d18:0/16:1)+K]+, respectively. Wojakowska et al. employed MALDI-MSI to find lipids that could discriminate between PTC tissues and adjacent non-cancerous thyroid tissues (260). They found that intensities of PC (32:0), PC (32:1), PC (34:1), PC (36:3), SM (34:1), SM (36:1) and PA (36:2) and PA (36:3) of the cancerous tissue were significantly higher than that of the non-cancerous tissue.
MSI is also competent for imaging differential molecular signatures for oncocytic thyroid tumors, e.g., the abnormal expression of cardiolipins (CLs). CLs play an important role in the stability and integrity of mitochondrial structure and function. There is increasing evidence in the CL metabolism reprogramming of cancers. However, the exact mechanism by which CLs modulate cancer remains to be clarified (261). Zhang et al. conducted the DESI-MSI analysis to image and characterize the lipid composition for the oncocytic thyroid tumors (Hurthle cell adenoma and Hurthle cell carcinoma) (262). They found that CL species were distributed in the oncocytic thyroid tumor with an abnormally high abundance and diversity, as compared with the non-oncocytic thyroid tumors (PTC, FTC and follicular adenoma) and normal thyroid samples. Feider et al. applied the integrated DESI-field asymmetric ion mobility spectrometry-MSI approach to measure CLs in oncocytic thyroid tumors (163). They validated the existence of abundant CL species in the entire thyroid tissue section and managed to identify m/z values of 723.479, 737.494 and 747.473 as CL (72:6), CL (74:8) and CL (76:9). The ion images of MSI demonstrated that oncocytic thyroid tumor was present throughout the tissue section, MSI images were consistent with histologic images. The spatial distribution of CLs among the entire tissue has the potential to indicate specific locations of oncocytic thyroid tumor.
Moreover, MSI is competent for the detection of FFAs and PLs of the cancer tissue and the para-cancer tissue to elucidate the relatives between changes of FFAs and PLs and the cancer development (263–265). FFAs are an essential constituent of PLs. It has been revealed that FFAs greatly influence the energy storge in the cancer microenvironment and act as second cellular messengers (266). The metabolism of FFAs is an essential step in de novo lipogenesis, which is more active in the cancer tissue compared with the normal tissue (267, 268). Wang et al. simultaneously imaged FFAs and PLs in the thyroid cancer tissue and the para-cancer tissue by MALDI-MSI (127). They found that the intensities of 7 FFAs (arachidic acid (C20:0), oleic acid (C18:1), linolenic acid (C18:3), palmitoleic acid (C16:1), arachidonic acid (C20:4), docosahexaenoic acid (C22:6) and linoleic acid (C18:2)) were significantly higher in the cancer tissue than that of the para-cancer tissue. The correlation between FFAs and PLs was analyzed by submitting the intensity of each detected PL and FFA derivative in each spot for the cancer tissue and the para-cancer tissue to Spearman correlation analysis. The heatmaps of the correlation between FFAs and PLs in thyroid cancer samples were created to reveal that the saturated FFAs (C16:0 and C18:0) were positively correlated with PLs. This is because palmitic acid (C16:0) is the main product of de novo fatty acid synthesis and a precursor for the synthesis of other fatty acids. Combined with the upregulation of palmitic acid in cancer tissue, this phenomenon is due to the more active de novo synthesis of fatty acids in cancer tissue to provide abundant precursors for other lipid metabolism.
Metabolites are intermediate end products generated by chemical reactions within cells, tissues and organs (269). Metabolomics, focusing on the altered metabolites and metabolic pathways within the biological sample, is a promising technique in shedding light on the molecular mechanisms of endocrine tumors (270–272). MSI has made great progress in the metabolomic analysis of endocrine tumors, involving detection of altered metabolites, elucidation of tumor metabolism reprogramming and identification of possible biomarkers (273).
MSI has the ability to present the histology heterogeneity but also can reveal the metabolic heterogeneity within the tumor. Huang et al. studied the metabolism of PTC by ambient pressure DESI-MSI (274). They built a spatially resolved metabolomic data processing pipeline that revealed the tumor microregion heterogeneity. A clear discrimination among the tumor, the stromal and the normal tissue was shown. The para-cancer region was further segmented into different microregions based on the differential metabolic profiles. Additionally, this study showed that the abundances of phenylalanine, leucine and tyrosine were the highest in the tumor region, followed by the stromal region, lowest in the normal tissue. It has been revealed that amino acids are involved in glycolysis and tricarboxylic acid cycles, reshaping the cellular metabolism (275). Cancers demand abundant amino acids to promote cancer cell proliferation, invasion and metastasis. Amino acids were usually present to be increasingly expressed in PTC (276–279).
MSI has the ability to help elucidate the molecular mechanism of the pheochromocytoma. The adrenal medulla, in the central part of the adrenal gland, is composed of chromaffin cells that synthesize catecholamines. The hormones exert their effects by acting on alpha- and beta- adrenoreceptors in the central nervous system and the periphery (280). The “fight or flight response” is a key mechanism and causes a number of physiological changes, such as increased blood pressure, increased cardiac output and increased glycogenolysis in liver and muscle tissue (281). Pheochromocytoma is formed in the adrenal medulla. This type of tumor produces and releases a large amount of circulating catecholamines and leads to a constant activation of the “fight or flight response” (282). Takeo et al. visualized the distribution of adrenaline and noradrenaline in the normal tissue and the pheochromocytoma tissue (213). They demonstrated that both catecholamines were distributed in the adrenal medulla of the normal tissue, whereas pheochromocytoma tissue showed a moderate adrenaline level and an elevated level of noradrenaline with a homogeneous distribution among the whole tumor region.
MSI has the potential to provide additional support for the hypothesis that aldosterone-producing cell cluster (APCC) is the origin of aldosterone-producing adenoma (APA) (283). It is reported that aldosterone or 18-oxocortisol is a potential serum marker of APA. Sugiura et al. visualized the distribution of aldosterone or 18-oxocortisol in APCC, possible APCC-to-APA transitional lesions and APA by MALDI-MSI (284). The ion images revealed that aldosterone and 18-oxocortisol congregated within the tumor regions where aldosterone synthase was distributed. The imaging results of possible APCC-to-APA transitional lesions even suggested a path of cellular migration from APCC to form APA inside the adrenal glands. Sun et al. used MALDI-MSI to compare the metabolomic phenotypes between APCC and APA (285). They processed the MALDI spectra by component analysis. Depending on their respective metabolite distribution patterns, the APCC were divided into 2 subgroups. Metabolic profiles of APCC in subgroup 1 were distinct from APA, whereas subgroup 2 displayed metabolic profiles similar to the APA group. Compared to subgroup 1, subgroup 2 presented increased hexose monophosphate shunt, enhanced metabolism of tryptophan via the kynurenine pathway and the significant enhancement of N-acetylglucosamine, which may be related to cell proliferation and APCC to APA transition.
MALDI-MSI has the potential to discriminate endocrine tumors with different genotypes based on the metabolic profiles. By using MALDI-FT-ICR with 9-AA matrix, Murakami et al. analyzed the metabolism of APAs by MSI (286). The metabolic data was processed with ortho-PLSDA clustering between KCNJ5- (potassium voltage-gated channel subfamily J member 5) and CACNA1D- (calcium voltage-gated channel subunit alpha1 D) mutated APAs. One hundred and thirty-seven differential metabolites were screened out (adjusted p value < 0.05). In the following, the significantly altered metabolites were submitted to the pathway analysis and the activation of purine metabolism in KCNJ5-mutated APAs was demonstrated (pathway impact = 0.13, p < 0.001, and FDR < 0.001).
Conventional proteomics usually performs extraction by preparing the whole piece of tissue into homogenate. The final protein or peptide sample is injected into the LC-MS system in solution. The homogenization process leads to the loss of the histological structure of the tissue and the spatial localization of the analytes (287). Moreover, proteins with low abundance sometimes cannot be detected due to the interference of abundant proteins (288). These challenges can be overcome by spatially resolved microproteomics, which allows quantitative and comparative proteomic analysis within a relatively small surface area (μm) in the tumor microenvironment (61, 289–295). Spatially resolved microproteomics is achieved by the collaboration of LC-MS and microextraction approaches. Laser microdissection (LMD) and liquid microjunction (LMJ) are two general microextraction approaches that help extract proteins from a relatively limited area of the sample surface (296–298).
LMD can isolate and harvest subpopulations of tissue cells relying on either infrared (IR) laser or ultraviolet (UV) laser coupled with a microscope (34). The histology structure of the sample is present under the microscope and regions of interest are determined by direct microscopic visualization (299).
Figures 3A–C respectively introduce the principles of three LMD systems from different vendors. In the system of Arcturus laser capture microdissection, the tissue section is located on the glass slide. A thermolabile membrane on bottom face of the cap is placed on the tissue section. The IR laser activates the membrane and the melted membrane extends to the tissue. The adhesion force of the selected tissue area to the activated membrane exceeds that to the glass slide. The selected area is removed from the tissue (300). In Zeiss’s PALM microdissection, the tissue section is mounted on a polyethylene napthalate (PEN) membrane glass slide. After selecting the region of interest, the UV laser ablates the surrounding cells and cuts away the selected area (301). The cut-off areas are transported into a collective tube by a defined laser pulse against gravity. In the Leica LMD microdissection, the tissue section is mounted on the PEN membrane glass slide and placed upside down on the stage. The target tissue is dissected by the UV laser and directly falls into a vessel underneath the tissue section by gravity (302).
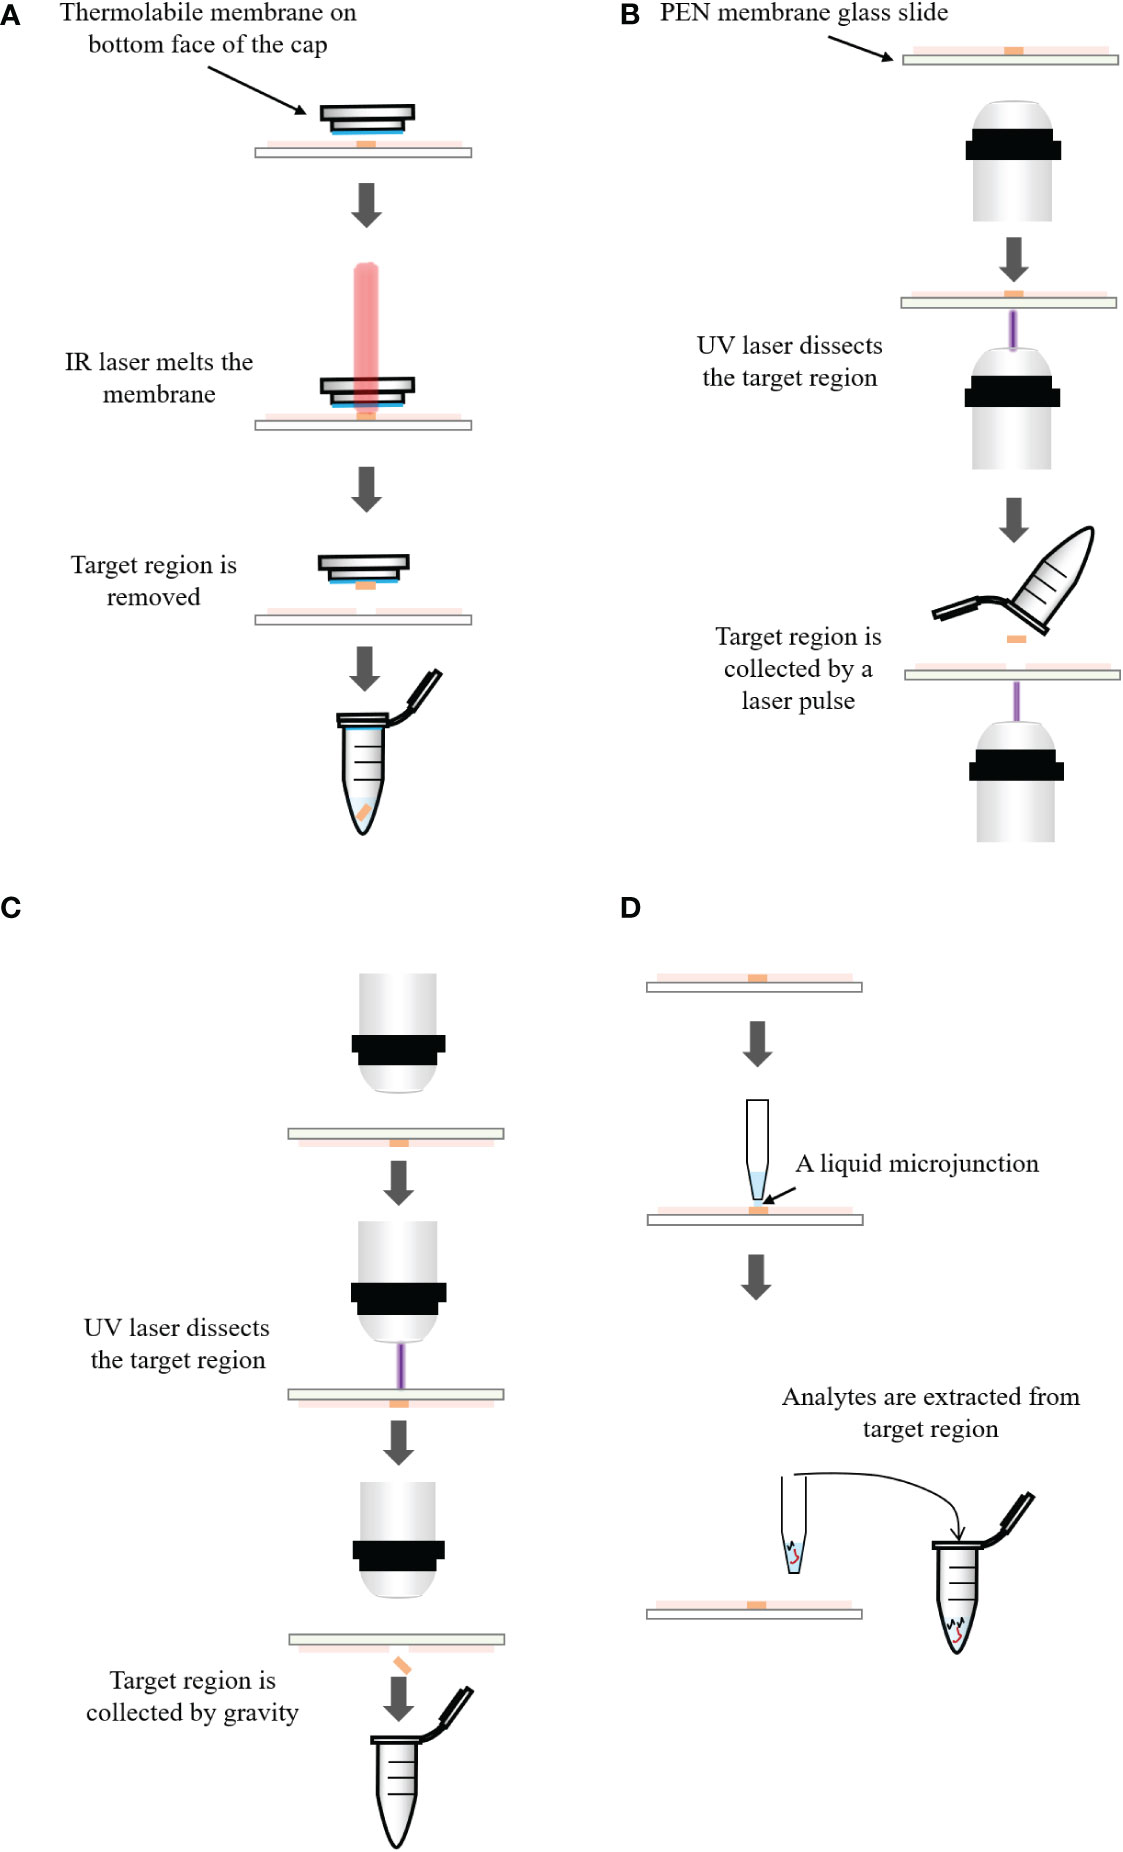
Figure 3 (A) Principle of the Arcturus laser capture microdissection. A thermolabile membrane on bottom face of the cap is placed on the tissue section. The infrared (IR) laser activates the membrane which extends to the tissue. The adhesion force of the tissue to the activated membrane exceeds that to the glass slide. The selected area is removed from the tissue. (B) Principle of the Zeiss’s PALM microdissection. The tissue section is mounted on a polyethylene napthalate (PEN) membrane coated glass slide. After selecting the region of interest, ultraviolet (UV) laser ablates the surrounding cells and cuts away the selected area, which is then transported into a collection tube by a defined laser pulse against gravity. (C) Principle of the Leica LMD microdissection. The tissue section is mounted on the PEN membrane glass slide and placed upside down on the stage. The target tissue is dissected by the laser and directly falls into a collection tube underneath the tissue section. (D) Principle of liquid microjunction extraction. The probe aspirates the extraction solvent and dispenses a portion onto the tissue surface to create a liquid microjunction between the probe and the tissue surface. After a predefined extraction time, analytes that are soluble in the solvent are extracted into the liquid microjunction. The extracted solution can be analyzed by LC-MS directly.
LMJ performs microextraction within a well-defined area of the tissue using the liquid microjunction interface (303–305). The principle of LMJ is present in Figure 3D. In brief, a probe aspirates a certain amount of extraction solvent and dispenses a portion onto the tissue surface to create a liquid microjunction between the probe and the tissue surface. Analytes that are soluble in the solvent will be extracted into the liquid microjunction. After a predefined extraction time, the probe is aspirated and the extraction solution can be directly dispensed to LC-MS system (163, 306). Alternatively, it is possible to perform several cycles of extraction and pool all the collected solution in the same vial to increase the quantity of samples for the further analysis (307).
For spatially resolved microproteomics, there are two LMJ strategies (308). Firstly, localized on-tissue digestion is performed and digested peptides are extracted by LMJ (293). Secondly, intact proteins are directly extracted from regions of interest within the tissue (309). In conclusion, LMJ has shown great capacities in extraction of proteins from specific cell subpopulation, contributing extensively to the proteomic analysis (310–312).
There are some similarities between LMD and LMJ. Before being used, both of them need the histology structure of the samples, which can be obtained from histology staining, immunochemistry and MSI molecular histology images. Both of them are appliable to fresh frozen tissues, FFPE tissues and cytologic smears. There are also a few differences between them. For LMD, it can dissect regions of any size and any shape from the sample surface. It can cut off an area of tissue with a few square milimeters. It can also allow to obtain a region with a few micrometers and even submicrometers in diameter. Therefore, LMD can isolate a large area of tissue, cell clusters, single cell and subcellular compartments. For LMJ, the droplet deposited on the sample surface is a circle 0.25 to 4 mm in diameter (313). LMJ is more appropriate to sample with the larger surface area (314). Besides, the dissected sample obtained by LMD needs to be extracted and it is always challenging to process the small volume of sample. LMJ can perform the extraction in situ from the target surface area of the sample and the extracts can be directly introduced into the LC-MS system. During the process, the sample consumption is largely reduced.
LMD or LMJ coupled with MS/MS makes full use of their advantages in the analysis of heterogenous endocrine tumor tissues, allowing for in-depth proteomic analysis and capable of depicting the underlying protein alternations in the endocrine tumor microenvironment (315, 316).
Prolactinoma is a subtype of pituitary adenoma and encompasses various types of cells including prolactin cells, endothelial cells, fibroblasts and other stomal cells (317). To better explain the prolactinoma tumorigenesis from the proteomics level, Liu et al. dissected pure prolactin cells from prolactinomas using immune-LMD and performed bottom-up proteomic analysis on the extracted proteins (318). By searching the human International Protein Index database with MS/MS spectra, they successfully set up a specific prolactinoma spectral library of 2,243 proteins.
Amyloids are abnormal proteins, which deposit in the organs and tissues, such as brain, heart, bladder, skin, thyroid, parathyroid, muscles and nerves (319–321). As the amyloid deposition increases, the normal function of organs and tissues is disturbed (322). Some types of amyloidosis are associated with the occurrence and development of the diseases (323–325). Parathyroid hormone (PTH), a polypeptide hormone, has been shown to form amyloid and amyloid-like beta-sheet aggregation in parathyroid adenomas (326). Colombat et al. used LMD-LC-MS/MS to analyze the protein profiling for parathyroid adenomas whose histological analysis presented nodular typical amyloid deposits. And the LMD-LC-MS/MS spectra successfully identified the amyloid fibril protein in parathyroid adenomas as PTH (327). They speculated that the formation of amyloid in a subset of parathyroid adenomas resulted from inappropriate PTH production. The physiological hormone aggregation might escape the control of functional amyloid processes, leading to disease-amyloid aggregation of PTH.
The pituitary gland can be divided into two distinct regions both in anatomy and function: the anterior pituitary (adenohypophysis, AH) and the posterior pituitary (neurohypophysis, NH). The anterior pituitary comprises of five different types of epithelial endocrine cells, responsible for secreting GH, PRL, TSH, ACTH, follicle stimulating hormone and luteinizing hormone (328). The posterior secrets two hormones: oxytocin and vasopressin. Kertesz et al. used an automated LMJ system for profiling of arginine vasopressin and ACTH in normal human pituitary gland and pituitary adenomas (329). This spatially resolved sampling approach allowed selective protein extraction from the anterior and the posterior regions of the human pituitary gland as well as selective protein extraction from the tumor region and the normal posterior region of the ACTH secreting adenoma tissue. The separation and identification of the extracted proteins were processed with LC-MS/MS system. Heatmaps were created to show that arginine vasopressin was mostly distributed in NH regions and ACTH in AH regions. ACTH levels in secreting adenomas and normal AH regions were significantly higher than in non-secreting adenomas and NH regions. The results showed that the signature of arginine vasopressin and ACTH in a series of ACTH secreting and non-secreting pituitary adenomas was consistent with the histopathological evaluation.
Multi-omics analysis for endocrine tumors is gaining much attention in recent years (330–332). Endocrine tumors are characterized by a marked diversity and high heterogeneity. Most endocrine tumors are benign, evolving locally and slowly. However, a fraction of endocrine tumors are malignant, as evidenced by metastasis and fatal evolution (2). Biomarkers associated with tumorigenesis, progression and metastasis are intensively investigated, facilitating the development of novel diagnostic tools and promising treatments. MSI techniques show the strength in detection and identification of proteins, lipids and metabolites that altered significantly between the tumor tissue and the normal tissue. Compared with non-metastatic PTC, thioredoxin, S100-A10 and S100-A6 were significantly elevated in metastatic PTC (p values < 0.005). And the three proteins were identified as protein biomarkers for PTC with lymph node metastasis. Besides, CL species with an abnormal abundance and diversity are identified as candidate biomarkers for oncocytic thyroid tumor, such as CL (72:6), CL (72:8) and CL (76:9). Moreover, MSI result showed aldosterone and 18-oxocortisol congregated within the tumor regions where aldosterone synthase was distributed, serving as a complementary for the view that aldosterone or 18-oxocortisol has the potential to act as a biomarker for APA. With the advances in LC-MS and microextraction approaches, spatially resolved microproteomics in endocrine tumors has exhibited excellent performances in revealing the regional protein profiles within the heterogeneous tumor tissues.
The samples for endocrine tumors mainly comprise of fresh-frozen tissues, FFPE tissues and cytologic samples. Proteomics, lipidomics and metabolomics guided by MSI and spatially resolved microproteomics can reflect the relative abundance and spatial distribution of analytes. The sample preparation protocols are crucial and need to be established based on the purpose of the study and the collected samples. It should be taken into account to protect the analytes from degradation and displacement within the tissue and preserve the integrity of the tissue during the preparation process.
MSI provides spatially resolved molecular analysis of biological samples without labelling. However, MSI is disadvantageous in molecule identification caused by local ion suppression and has limitations in the depth of molecule detection coverage compared with established proteomics, lipidomics and metabolomics based on LC-MS/MS analysis (333). The strategy that combines MSI, microextraction approaches and LC-MS has the potential to solve the above problem. In brief, the tissue is first analyzed with MSI to produce localization-registered mass spectra and ion images. The tissue is then segmented into different regions. And, the location information of the target region is passed to the LMD or LMJ. The microextraction is performed on the target regions. Lastly, the extracts are analyzed with LC-MS/MS. This strategy allows more comprehensive and deeper insights into the molecular heterogeneity uncovered by MSI and enables a better understanding of the molecular mechanism within the sample (289). It has shown the potential of improving the characterization and identification of proteins associated with endocrine tumors (329). One limitation for this strategy in lipidomcis and metabolomics is the small sample quantity obtained by microextraction, which poses challenges to the following LC-MS/MS analysis. Therefore, mass spectrometers and chromatographic methods with significantly enhanced sensitivity are required in this filed.
Advanced MSI techniques are remarkably promising in single cell metabolomics, where the analysis on metabolites is directly performed on single cells without any cell lysis, separation or label (334). The spatial resolution of SIMS-MSI with GCIBs as the primary ion beam can approach 1 μm, capable of imaging a single cell (335). A spatial resolution of around 1.4 μm has been achieved by the development of atmospheric pressure MALDI MSI platform (336). High spatial resolution MALDI-MSI (down to 0.5-5 μm) using both reflection and transmission geometries has been being developed by the Caprioli group (337, 338). MALDI-MSI is capable of mapping and visualizing lipids in a single cell of newly fertilized individual zebrafish embryos (339). MALDI-2 is a post post-ionization technique. After the initial MALDI ionization, a second laser that is parallel to the sample surface is applied to post-ionize neutral molecules. MALDI-2 reduces ion suppression effects and improves sensitivity by up to 3 orders of magnitude. And spatial resolution can reach 5 μm. By applying transmission-mode MALDI-2 ion source in MSI of the brain tissue, the subcellular resolution was achieved (340). MSI-based single cell metabolomics devotes to profiling metabolites spatially and/or temporally in a single cell level, providing insights into the intracellular and intercellular metabolic activities and revealing the intercellular heterogeneity.
With the development in mass spectrometry, chromatography, microextraction methods, sample preparation protocols and data analysis methods, analyses on the proteomics, lipidomics and metabolomics of endocrine tumors will provide new dimensional insights in molecular level, cellular even subcellular level and tissue level, aiding in overcoming the problems of pathophysiology, diagnosis, and treatment for endocrine tumors.
XZ and YH conceived of the concept and idea of this article. YH collected references, wrote and revised the manuscript, and was responsible for the corresponding work of the manuscript. SG collected partial references. YG, ZZ, RC and XZ participated in proofreading, editing and revision of the manuscript. All authors contributed to the article and approved the submitted version.
Thanks are given to ZZ for assistance with histopathologic information for endocrine tumors and to RC and XZ for valuable discussions.
The authors declare that the research was conducted in the absence of any commercial or financial relationships that could be construed as a potential conflict of interest.
All claims expressed in this article are solely those of the authors and do not necessarily represent those of their affiliated organizations, or those of the publisher, the editors and the reviewers. Any product that may be evaluated in this article, or claim that may be made by its manufacturer, is not guaranteed or endorsed by the publisher.
The Supplementary Material for this article can be found online at: https://www.frontiersin.org/articles/10.3389/fendo.2022.993081/full#supplementary-material

ACTH, adrenocorticotropic hormone; AH, adenohypophysis; APA, aldosterone-producing adenoma; APCC, aldosterone-producing cell cluster; ATC, anaplastic thyroid carcinoma; CHCA, alpha-cyano-4-hydroxycinnamic acid; CLs, cardiolipins; cv-PTC, conventional variant-papillary thyroid carcinoma; DESI, desorption electrospray ionization; DESI-MSI, desorption electrospray ionization-mass spectrometry imaging; 2,5-DHB, 2,5-dihydroxybenzoic acid; ESI, electrospray ionization; FFAs, free fatty acids; FFPE, formalin fixed paraffin embedded; FNA, fine needle aspiration; fv-PTC, follicular variant-papillary thyroid cancer; GCIBs, gas cluster ion beams; GH, growth hormone; IHC, immunohistochemistry; IR, infrared; ITO, indium-tin oxide; LMD, laser microdissection; LC-MS, liquid chromatography-mass spectrometry; LC-MS/MS, liquid chromatography with tandem mass spectrometry; LDI, laser desorption/ionization; LMJ, liquid microjunction; LMIGs, liquid metal ion guns; m/z, mass-to-charge ratio; MALDI, matrix-assisted laser desorption/ionization; MALDI-MSI, matrix-assisted laser desorption/ionization-mass spectrometry imaging; MS, mass spectrometry; MSI, mass spectrometry imaging; MTC, medullary thyroid carcinoma; NH, neurohypophysis; PA, phosphatidic acid; PC, phosphatidylcholine; PEN, polyethylene napthalate; PL, phospholipid; PTC, papillary thyroid carcinoma; PTH, parathyroid hormone; SA, sinapinic acid; SCD1, stearoyl-CoA desaturase; SIMS, secondary ion mass spectrometry; SIMS-MSI, secondary ion mass spectrometry-mass spectrometry imaging; SM, sphingomyelin; MS/MS, Tandem mass spectrometer; TOF, time-of-flight; TSH, thyroid stimulating hormone; UV, ultraviolet
1. Hiller-Sturmhofel S, Bartke A. The endocrine system: An overview. Alcohol Health Res World (1998) 22(3):153–64.
2. Scoazec JY. Endocrine tumors: biology and physiopathology. Ann Pathol (2005) 25(6):447–61. doi: 10.1016/S0242-6498(05)86160-7
3. Pang ALY, Chan W-Y. Molecular basis of diseases of the endocrine system. In: Coleman WB, editor. Molecular pathology, 2nd ed. (2018) London, United Kingdom: Academic Press. p. 477–505.
4. Xing M. Molecular pathogenesis and mechanisms of thyroid cancer. Nat Rev Cancer (2013) 13(3):184–99. doi: 10.1038/nrc3431
5. Lloyd RV, Osamura RY, Klöppel G, Rosai J eds. World health organization classification of endocrine tumours. In: World health organization classification of tumours, 4, vol. 10 . Lyon: IARC Press.
6. DeLellis RA, Lloyd RV, Heitz PU, Eng C eds. Pathology and genetics of tumours of endocrine organs. In: World health organization classification of tumours, vol. 8 . Lyon: IARC Press.
7. Mete O, Erickson LA, Juhlin CC, de Krijger RR, Sasano H, Volante M, et al. Overview of the 2022 WHO classification of adrenal cortical tumors. Endocr Pathol (2022) 33(1):155–96. doi: 10.1007/s12022-022-09710-8
8. Nose V, Gill A, Teijeiro JMC, Perren A, Erickson L. Overview of the 2022 WHO classification of familial endocrine tumor syndromes. Endocr Pathol (2022) 33(1):197–227. doi: 10.1007/s12022-022-09705-5
9. Rindi G, Mete O, Uccella S, Basturk O, La Rosa S, Brosens LAA, et al. Overview of the 2022 WHO classification of neuroendocrine neoplasms. Endocr Pathol (2022) 33(1):115–54. doi: 10.1007/s12022-022-09708-2
10. Mete O, Asa SL, Gill AJ, Kimura N, de Krijger RR, Tischler A. Overview of the 2022 WHO classification of paragangliomas and pheochromocytomas. Endocr Pathol (2022) 33(1):90–114. doi: 10.1007/s12022-022-09704-6
11. Erickson LA, Mete O, Juhlin CC, Perren A, Gill AJ. Overview of the 2022 WHO classification of parathyroid tumors. Endocr Pathol (2022) 33(1):64–89. doi: 10.1007/s12022-022-09709-1
12. Asa SL, Mete O, Perry A, Osamura RY. Overview of the 2022 WHO classification of pituitary tumors. Endocr Pathol (2022) 33(1):6–26. doi: 10.1007/s12022-022-09703-7
13. Baloch ZW, Asa SL, Barletta JA, Ghossein RA, Juhlin CC, Jung CK, et al. Overview of the 2022 WHO classification of thyroid neoplasms. Endocr Pathol (2022) 33(1):27–63. doi: 10.1007/s12022-022-09707-3
14. Luzon-Toro B, Fernandez RM, Villalba-Benito L, Torroglosa A, Antinolo G, Borrego S. Influencers on thyroid cancer onset: Molecular genetic basis. Genes (Basel) (2019) 10(11):913. doi: 10.3390/genes10110913
15. Olson E, Wintheiser G, Wolfe KM, Droessler J, Silberstein PT. Epidemiology of thyroid cancer: A review of the national cancer database, 2000-2013. Cureus (2019) 11(2):e4127. doi: 10.7759/cureus.4127
16. Wang J, Yu F, Shang Y, Ping Z, Liu L. Thyroid cancer: incidence and mortality trends in China, 2005-2015. Endocrine (2020) 68(1):163–73. doi: 10.1007/s12020-020-02207-6
17. Povoa AA, Teixeira E, Bella-Cueto MR, Batista R, Pestana A, Melo M, et al. Genetic determinants for prediction of outcome of patients with papillary thyroid carcinoma. Cancers (Basel) (2021) 13(9):2048. doi: 10.3390/cancers13092048
18. Sung H, Ferlay J, Siegel RL, Laversanne M, Soerjomataram I, Jemal A, et al. Global cancer statistics 2020: GLOBOCAN estimates of incidence and mortality worldwide for 36 cancers in 185 countries. CA Cancer J Clin (2021) 71(3):209–49. doi: 10.3322/caac.21660
19. Pemayun TG. Current diagnosis and management of thyroid nodules. Acta Med Indones (2016) 48(3):247–57.
20. Melmed S. Pituitary-tumor endocrinopathies. N Engl J Med (2020) 382(10):937–50. doi: 10.1056/NEJMra1810772
21. Farrugia FA, Charalampopoulos A. Pheochromocytoma. Endocr Regul (2019) 53(3):191–212. doi: 10.2478/enr-2019-0020
22. Bourdeau I, El Ghorayeb N, Gagnon N, Lacroix A. Management of endocrine disease: Differential diagnosis, investigation and therapy of bilateral adrenal incidentalomas. Eur J Endocrinol (2018) 179(2):R57–67. doi: 10.1530/EJE-18-0296
23. Alshaikh S, Harb Z, Aljufairi E, Almahari SA. Classification of thyroid fine-needle aspiration cytology into Bethesda categories: An institutional experience and review of the literature. Cytojournal (2018) 15:4. doi: 10.4103/cytojournal.cytojournal_32_17
24. Bongiovanni M, Spitale A, Faquin WC, Mazzucchelli L, Baloch ZW. The Bethesda system for reporting thyroid cytopathology: A meta-analysis. Acta Cytol (2012) 56(4):333–9. doi: 10.1159/000339959
25. Rodrigo JP, Hernandez-Prera JC, Randolph GW, Zafereo ME, Hartl DM, Silver CE, et al. Parathyroid cancer: An update. Cancer Treat Rev (2020) 86:102012. doi: 10.1016/j.ctrv.2020.102012
26. Roman-Gonzalez A, Jimenez C. Malignant pheochromocytoma-paraganglioma: pathogenesis, TNM staging, and current clinical trials. Curr Opin Endocrinol Diabetes Obes (2017) 24(3):174–83. doi: 10.1097/MED.0000000000000330
27. Gervasoni JE, Cady B. Endocrine tumors. In: Bertino JR, editor. Encyclopedia of cancer, 2nd ed., vol. p. Cambridge, Massachusetts: Academic Press (2002). p. 135–43.
28. Tevosian SG, Ghayee HK. Pheochromocytomas and paragangliomas. Endocrinol Metab Clin North Am (2019) 48(4):727–50. doi: 10.1016/j.ecl.2019.08.006
29. Fisher R, Pusztai L, Swanton C. Cancer heterogeneity: implications for targeted therapeutics. Br J Cancer (2013) 108(3):479–85. doi: 10.1038/bjc.2012.581
30. LeBleu VS. Imaging the tumor microenvironment. Cancer J (2015) 21(3):174–8. doi: 10.1097/PPO.0000000000000118
31. Elkhattouti A, Hassan M, Gomez CR. Stromal fibroblast in age-related cancer: Role in tumorigenesis and potential as novel therapeutic target. Front Oncol (2015) 5:158. doi: 10.3389/fonc.2015.00158
32. Wu Y, Cheng Y, Wang X, Fan J, Gao Q. Spatial omics: Navigating to the golden era of cancer research. Clin Transl Med (2022) 12(1):e696. doi: 10.1002/ctm2.696
33. Holzlechner M, Eugenin E, Prideaux B. Mass spectrometry imaging to detect lipid biomarkers and disease signatures in cancer. Cancer Rep (Hoboken) (2019) 2(6):e1229. doi: 10.1002/cnr2.1229
34. von Eggeling F, Hoffmann F. Microdissection-an essential prerequisite for spatial cancer omics. Proteomics (2020) 20(17-18):e2000077. doi: 10.1002/pmic.202000077
35. Cilento EM, Jin L, Stewart T, Shi M, Sheng L, Zhang J. Mass spectrometry: A platform for biomarker discovery and validation for alzheimer's and parkinson's diseases. J Neurochem (2019) 151(4):397–416. doi: 10.1111/jnc.14635
36. Chubatyi ND, McEwen CN. Improving the sensitivity of matrix-assisted ionization (MAI) mass spectrometry using ammonium salts. J Am Soc Mass Spectrom (2015) 26(10):1649–56. doi: 10.1007/s13361-015-1205-z
37. Li C, Chu S, Tan S, Yin X, Jiang Y, Dai X, et al. Towards higher sensitivity of mass spectrometry: A perspective from the mass analyzers. Front Chem (2021) 9:813359. doi: 10.3389/fchem.2021.813359
38. Medhe S. Ionization techniques in mass spectrometry: A review. Mass Spectrom Purif Tech (2018) 04(01):1000126. doi: 10.4172/2469-9861.1000126
39. Haag AM. Mass analyzers and mass spectrometers. Adv Exp Med Biol (2016) 919:157–69. doi: 10.1007/978-3-319-41448-5_7
40. Hofmann AE, Chimiak L, Dallas B, Griep-Raming J, Juchelka D, Makarov A, et al. Using orbitrap mass spectrometry to assess the isotopic compositions of individual compounds in mixtures. Int J Mass Spectrom (2020) 457:116410. doi: 10.1016/j.ijms.2020.116410
41. Nikolaev EN, Kostyukevich YI, Vladimirov G. Fundamentals and simulations in FT-ICR-MS. In: Fundamentals and applications of Fourier transform mass spectrometry (2019) Amsterdam, Netherlands: Elsevier. p. 89–111.
42. Piraud M, Pettazzoni M, Lavoie P, Ruet S, Pagan C, Cheillan D, et al. Contribution of tandem mass spectrometry to the diagnosis of lysosomal storage disorders. J Inherit Metab Dis (2018) 41(3):457–77. doi: 10.1007/s10545-017-0126-3
43. Illiano A, Pinto G, Melchiorre C, Carpentieri A, Faraco V, Amoresano A. Protein glycosylation investigated by mass spectrometry: An overview. Cells (2020) 9(9):1986. doi: 10.3390/cells9091986
44. Zheng X, Smith RD, Baker ES. Recent advances in lipid separations and structural elucidation using mass spectrometry combined with ion mobility spectrometry, ion-molecule reactions and fragmentation approaches. Curr Opin Chem Biol (2018) 42:111–8. doi: 10.1016/j.cbpa.2017.11.009
45. Paine MRL, Poad BLJ, Eijkel GB, Marshall DL, Blanksby SJ, Heeren RMA, et al. Mass spectrometry imaging with isomeric resolution enabled by ozone-induced dissociation. Angew Chem Int Ed Engl (2018) 57(33):10530–4. doi: 10.1002/anie.201802937
46. Brodbelt JS, Morrison LJ, Santos I. Ultraviolet photodissociation mass spectrometry for analysis of biological molecules. Chem Rev (2020) 120(7):3328–80. doi: 10.1021/acs.chemrev.9b00440
47. Zhang J, Guo C, Huo X, Ma X, Li X, Abliz Z, et al. Unsaturated lipid isomeric imaging based on the paterno-buchi reaction in the solid phase in ambient conditions. Talanta (2021) 235:122816. doi: 10.1016/j.talanta.2021.122816
48. Cologna SM. Mass spectrometry imaging of cholesterol. Adv Exp Med Biol (2019) 1115:155–66. doi: 10.1007/978-3-030-04278-3_7
49. Pang X, Gao S, Ga M, Zhang J, Luo Z, Chen Y, et al. Mapping metabolic networks in the brain by ambient mass spectrometry imaging and metabolomics. Anal Chem (2021) 93(17):6746–54. doi: 10.1021/acs.analchem.1c00467
50. Castellanos A, Ramirez CE, Michalkova V, Nouzova M, Noriega FG, Francisco FL. Three dimensional secondary ion mass spectrometry imaging (3D-SIMS) of aedes aegypti ovarian follicles. J Anal At Spectrom (2019) 34(5):874–83. doi: 10.1039/C8JA00425K
51. Buchberger AR, DeLaney K, Johnson J, Li L. Mass spectrometry imaging: A review of emerging advancements and future insights. Anal Chem (2018) 90(1):240–65. doi: 10.1021/acs.analchem.7b04733
52. Dilillo M, Heijs B, McDonnell LA. Mass spectrometry imaging: How will it affect clinical research in the future? Expert Rev Proteomics (2018) 15(9):709–16. doi: 10.1080/14789450.2018.1521278
53. Aichler M, Walch A. MALDI imaging mass spectrometry: current frontiers and perspectives in pathology research and practice. Lab Invest (2015) 95(4):422–31. doi: 10.1038/labinvest.2014.156
54. Bowman AP, Heeren RMA, Ellis SR. Advances in mass spectrometry imaging enabling observation of localised lipid biochemistry within tissues. Trac-Trend Anal Chem (2019) 120:115197. doi: 10.1016/j.trac.2018.07.012
55. Unsihuay D, Mesa Sanchez D, Laskin J. Quantitative mass spectrometry imaging of biological systems. Annu Rev Phys Chem (2021) 72:307–29. doi: 10.1146/annurev-physchem-061020-053416
56. John Lough W, Carlile M. Chromatography: Separation techniques in biology. In: Ramesh V, editor. Biomolecular and bioanalytical techniques (2019) Hoboken, New Jersey: Wiley. p. 123–52.
57. Tang H, Wang X, Xu L, Ran X, Li X, Chen L, et al. Establishment of local searching methods for orbitrap-based high throughput metabolomics analysis. Talanta (2016) 156-157:163–71. doi: 10.1016/j.talanta.2016.04.051
58. Triebl A, Trotzmuller M, Hartler J, Stojakovic T, Kofeler HC. Lipidomics by ultrahigh performance liquid chromatography-high resolution mass spectrometry and its application to complex biological samples. J Chromatogr B Analyt Technol BioMed Life Sci (2017) 1053:72–80. doi: 10.1016/j.jchromb.2017.03.027
59. Zullig T, Zandl-Lang M, Trotzmuller M, Hartler J, Plecko B, Kofeler HC. A metabolomics workflow for analyzing complex biological samples using a combined method of untargeted and target-list based approaches. Metabolites (2020) 10(9):342. doi: 10.3390/metabo10090342
60. Lee GB, Lee JC, Moon MH. Plasma lipid profile comparison of five different cancers by nanoflow ultrahigh performance liquid chromatography-tandem mass spectrometry. Anal Chim Acta (2019) 1063:117–26. doi: 10.1016/j.aca.2019.02.021
61. Zhu Y, Dou M, Piehowski PD, Liang Y, Wang F, Chu RK, et al. Spatially resolved proteome mapping of laser capture microdissected tissue with automated sample transfer to nanodroplets. Mol Cell Proteomics (2018) 17(9):1864–74. doi: 10.1074/mcp.TIR118.000686
62. Sun Q, Zhao H, Liu Z, Wang F, He Q, Xiu C, et al. Identifying potential metabolic tissue biomarkers for papillary thyroid cancer in different iodine nutrient regions. Endocrine (2021) 74(3):582–91. doi: 10.1007/s12020-021-02773-3
63. Burla B, Arita M, Arita M, Bendt AK, Cazenave-Gassiot A, Dennis EA, et al. MS-based lipidomics of human blood plasma: a community-initiated position paper to develop accepted guidelines. J Lipid Res (2018) 59(10):2001–17. doi: 10.1194/jlr.S087163
64. Geyer PE, Kulak NA, Pichler G, Holdt LM, Teupser D, Mann M. Plasma proteome profiling to assess human health and disease. Cell Syst (2016) 2(3):185–95. doi: 10.1016/j.cels.2016.02.015
65. Ehlhardt WJ, Woodland JM, Baughman TM, Vandenbranden M, Wrighton SA, Kroin JS, et al. Liquid chromatography/nuclear magnetic resonance spectroscopy and liquid chromatography/mass spectrometry identification of novel metabolites of the multidrug resistance modulator LY335979 in rat bile and human liver microsomal incubations. Drug Metab Dispos (1998) 26(1):42–51.
66. Kawata N, Kang D, Aiuchi T, Obama T, Yoshitake O, Shibata T, et al. Proteomics of human glomerulonephritis by laser microdissection and liquid chromatography-tandem mass spectrometry. Nephrol (Carlton) (2020) 25(4):351–9. doi: 10.1111/nep.13676
67. Kertesz V, Cahill JF. Spatially resolved absolute quantitation in thin tissue by mass spectrometry. Anal Bioanal Chem (2021) 413(10):2619–36. doi: 10.1007/s00216-020-02964-3
68. Mosele N, Smith A, Galli M, Pagni F, Magni F. MALDI-MSI analysis of cytological smears: The study of thyroid cancer. Methods Mol Biol (2017) 1618:37–47. doi: 10.1007/978-1-4939-7051-3_5
69. Zhan X, Huang Y, Long Y. Two-dimensional gel electrophoresis coupled with mass spectrometry methods for an analysis of human pituitary adenoma tissue proteome. Jove-J Vis Exp (2018) 134):56739. doi: 10.3791/56739
70. Murakami M, Sun N, Greunke C, Feuchtinger A, Kircher S, Deutschbein T, et al. Mass spectrometry imaging identifies metabolic patterns associated with malignant potential in pheochromocytoma and paraganglioma. Eur J Endocrinol (2021) 185(1):179–91. doi: 10.1530/EJE-20-1407
71. Li D, Wu J, Liu Z, Qiu L, Zhang Y. Novel circulating protein biomarkers for thyroid cancer determined through data-independent acquisition mass spectrometry. Peerj (2020) 8:e9507. doi: 10.7717/peerj.9507
72. Velikanova LI, Shafigullina ZR, Vorokhobina NV, Malevanaya EV. Gas chromatography-mass spectrometry analysis of urinary steroid metabolomics for detection of early signs of adrenal neoplasm malignancy in patients with cushing's syndrome. B Exp Biol Med+ (2019) 167(5):676–80. doi: 10.1007/s10517-019-04597-8
73. Ciregia F, Cetani F, Pardi E, Soggiu A, Piras C, Zallocco L, et al. Parathyroid carcinoma and adenoma Co-existing in one patient: Case report and comparative proteomic analysis. Cancer Genom Proteom (2021) 18(6):781–96. doi: 10.21873/cgp.20297
74. Coelho M, Raposo L, Goodfellow BJ, Atzori L, Jones J, Manadas B. The potential of metabolomics in the diagnosis of thyroid cancer. Int J Mol Sci (2020) 21(15):5272. doi: 10.3390/ijms21155272
75. Rossi C, Cicalini I, Verrocchio S, Di Dalmazi G, Federici L, Bucci I. The potential of steroid profiling by mass spectrometry in the management of adrenocortical carcinoma. Biomedicines (2020) 8(9):314. doi: 10.3390/biomedicines8090314
76. Li N, Desiderio DM, Zhan XQ. The use of mass spectrometry in a proteome-centered multiomics study of human pituitary adenomas. Mass Spectrom Rev (2021) 41(6):964–1013. doi: 10.1002/mas.21710
77. Soudah T, Zoabi A, Margulis K. Desorption electrospray ionization mass spectrometry imaging in discovery and development of novel therapies. Mass Spectrom Rev (2021), 1-28. doi: 10.1002/mas.21736
78. Barnes K. The pixelation of mass spectrometry. Nat Methods (2015) 12(S1):12. doi: 10.1038/nmeth.3532
79. He C, Fong LG, Young SG, Jiang H. NanoSIMS imaging: an approach for visualizing and quantifying lipids in cells and tissues. J Invest Med (2017) 65(3):669–72. doi: 10.1136/jim-2016-000239
80. Noun M, Akoumeh R, Abbas I. Cell and tissue imaging by TOF-SIMS and MALDI-TOF: An overview for biological and pharmaceutical analysis. Microsc Microanal (2022) 28(1):1–26. doi: 10.1017/S1431927621013593
81. Lin Y, Wu K, Jia F, Chen L, Wang Z, Zhang Y, et al. Single cell imaging reveals cisplatin regulating interactions between transcription (co)factors and DNA. Chem Sci (2021) 12(15):5419–29. doi: 10.1039/D0SC06760A
82. Caprioli RM, Farmer TB, Gile J. Molecular imaging of biological samples: localization of peptides and proteins using MALDI-TOF MS. Anal Chem (1997) 69(23):4751–60. doi: 10.1021/ac970888i
83. Neumann EK, Migas LG, Allen JL, Caprioli RM, Van de Plas R, Spraggins JM. Spatial metabolomics of the human kidney using MALDI trapped ion mobility imaging mass spectrometry. Anal Chem (2020) 92(19):13084–91. doi: 10.1021/acs.analchem.0c02051
84. Suckert T, Beyreuther E, Burger N, Muller J, Bodenstein E, Meinhardt M, et al. MALDI imaging detects lipid and peptide changes in a mouse model of radiation-induced brain injury. Radiother Oncol (2022) 170:S71–S2. doi: 10.1016/S0167-8140(22)02472-0
85. Erlmeier F, Sun N, Shen J, Feuchtinger A, Buck A, Prade VM, et al. MALDI mass spectrometry imaging-prognostic pathways and metabolites for renal cell carcinomas. Cancers (Basel) (2022) 14(7):1763. doi: 10.3390/cancers14071763
86. Takats Z, Wiseman JM, Gologan B, Cooks RG. Mass spectrometry sampling under ambient conditions with desorption electrospray ionization. Science (2004) 306(5695):471–3. doi: 10.1126/science.1104404
87. Wiseman JM, Puolitaival SM, Takats Z, Cooks RG, Caprioli RM. Mass spectrometric profiling of intact biological tissue by using desorption electrospray ionization. Angew Chem Int Ed Engl (2005) 44(43):7094–7. doi: 10.1002/anie.200502362
88. Kurczyk A, Gawin M, Chekan M, Wilk A, Lakomiec K, Mrukwa G, et al. Classification of thyroid tumors based on mass spectrometry imaging of tissue microarrays; a single-pixel approach. Int J Mol Sci (2020) 21(17):6289. doi: 10.3390/ijms21176289
89. Ucal Y, Tokat F, Duren M, Ince U, Ozpinar A. Investigating the peptide profile of noninvasive follicular thyroid neoplasm with papillary-like nuclear features (NIFTP): application of MALDI mass spectrometry imaging. FEBS Open Bio (2019) 9:402–3. doi: 10.1089/thy.2018.0392
90. Zhang M, He J, Li T, Hu H, Li X, Xing H, et al. Accurate classification of non-small cell lung cancer (NSCLC) pathology and mapping of EGFR mutation spatial distribution by ambient mass spectrometry imaging. Front Oncol (2019) 9:804. doi: 10.3389/fonc.2019.00804
91. Abbassi-Ghadi N, Antonowicz SS, McKenzie JS, Kumar S, Huang J, Jones EA, et al. De novo lipogenesis alters the phospholipidome of esophageal adenocarcinoma. Cancer Res (2020) 80(13):2764–74. doi: 10.1158/0008-5472.CAN-19-4035
92. Banerjee S, Manna SK. Assessment of metabolic signature for cancer diagnosis using desorption electrospray ionization mass spectrometric imaging. Methods Mol Biol (2019) 1928:275–97. doi: 10.1007/978-1-4939-9027-6_15
93. Desbenoit N, Walch A, Spengler B, Brunelle A, Rompp A. Correlative mass spectrometry imaging, applying time-of-flight secondary ion mass spectrometry and atmospheric pressure matrix-assisted laser desorption/ionization to a single tissue section. Rapid Commun Mass Sp (2018) 32(2):159–66. doi: 10.1002/rcm.8022
94. Passarelli MK, Pirkl A, Moellers R, Grinfeld D, Kollmer F, Havelund R, et al. The 3D OrbiSIMS-label-free metabolic imaging with subcellular lateral resolution and high mass-resolving power. Nat Methods (2017) 14(12):1175–83. doi: 10.1038/nmeth.4504
95. Pareek V, Tian H, Winograd N, Benkovic SJ. Metabolomics and mass spectrometry imaging reveal channeled de novo purine synthesis in cells. Science (2020) 368(6488):283–90. doi: 10.1126/science.aaz6465
96. Yuan ZY, Zhou QM, Cai LS, Pan L, Sun WL, Qumu SW, et al. SEAM is a spatial single nuclear metabolomics method for dissecting tissue microenvironment. Nat Methods (2021) 18(10):1223. doi: 10.1038/s41592-021-01276-3
97. Agüi-Gonzalez PJS, Phan NTN. SIMS imaging in neurobiology and cell biology. J Anal At Spectrom (2019) 34(7):1355–68. doi: 10.1039/C9JA00118B
98. Li B, Bhandari DR, Rompp A, Spengler B. High-resolution MALDI mass spectrometry imaging of gallotannins and monoterpene glucosides in the root of paeonia lactiflora. Sci Rep (2016) 6:36074. doi: 10.1038/srep36074
99. Dowsett D, Wirtz T. Co-Registered In situ secondary electron and mass spectral imaging on the helium ion microscope demonstrated using lithium titanate and magnesium oxide nanoparticles. Anal Chem (2017) 89(17):8957–65. doi: 10.1021/acs.analchem.7b01481
100. Benninghoven A. Developments in secondary ion mass spectroscopy and applications to surface studies. Surface Sci (1975) 53(1):596–625. doi: 10.1016/0039-6028(75)90158-2
101. Muramoto S, Graham D. Deep depth profiling using gas cluster secondary ion mass spectrometry: Micrometer topography development and effects on depth resolution. Surf Interface Anal (2021) 53(9):814–23. doi: 10.1002/sia.6983
102. Dimovska Nilsson K, Karagianni A, Kaya I, Henricsson M, Fletcher JS. (CO2)n(+), (H2O)n(+), and (H2O)n(+) (CO2) gas cluster ion beam secondary ion mass spectrometry: analysis of lipid extracts, cells, and alzheimer's model mouse brain tissue. Anal Bioanal Chem (2021) 413(16):4181–94. doi: 10.1007/s00216-021-03372-x
103. Mabrouk AB, Licitra C, Chateauminois A, Veillerot M. Effect of the molecular weight on the depth profiling of PMMA thin films using low-energy cs+ sputtering. Surf Interface Anal (2021) 53(10):884–92. doi: 10.1002/sia.6991
104. Jiang J, Hua L, Xie Y, Cao Y, Wen Y, Chen P, et al. High mass resolution multireflection time-of-Flight secondary ion mass spectrometer. J Am Soc Mass Spectrom (2021) 32(5):1196–204. doi: 10.1021/jasms.1c00016
105. Tian H, Sparvero LJ, Anthonymuthu TS, Sun WY, Amoscato AA, He RR, et al. Successive high-resolution (H2O)n-GCIB and C60-SIMS imaging integrates multi-omics in different cell types in breast cancer tissue. Anal Chem (2021) 93(23):8143–51. doi: 10.1021/acs.analchem.0c05311
106. Vanbellingen QP, Elie N, Eller MJ, Della-Negra S, Touboul D, Brunelle A. Time-of-flight secondary ion mass spectrometry imaging of biological samples with delayed extraction for high mass and high spatial resolutions. Rapid Commun Mass Sp (2015) 29(13):1187–95. doi: 10.1002/rcm.7210
107. Porta Siegel T, Hamm G, Bunch J, Cappell J, Fletcher JS, Schwamborn K. Mass spectrometry imaging and integration with other imaging modalities for greater molecular understanding of biological tissues. Mol Imaging Biol (2018) 20(6):888–901. doi: 10.1007/s11307-018-1267-y
108. Solon EG, Schweitzer A, Stoeckli M, Prideaux B. Autoradiography, MALDI-MS, and SIMS-MS imaging in pharmaceutical discovery and development. AAPS J (2010) 12(1):11–26. doi: 10.1208/s12248-009-9158-4
109. Popczun NJ, Breuer L, Wucher A, Winograd N. On the SIMS ionization probability of organic molecules. J Am Soc Mass Spectrom (2017) 28(6):1182–91. doi: 10.1007/s13361-017-1624-0
110. Berghmans E, Boonen K, Maes E, Mertens I, Pauwels P, Baggerman G. Implementation of MALDI mass spectrometry imaging in cancer proteomics research: Applications and challenges. J Pers Med (2020) 10(2):54. doi: 10.3390/jpm10020054
111. Sun C, Liu W, Mu Y, Wang X. 1,1'-binaphthyl-2,2'-diamine as a novel MALDI matrix to enhance the in situ imaging of metabolic heterogeneity in lung cancer. Talanta (2020) 209:120557. doi: 10.1016/j.talanta.2019.120557
112. Denti V, Piga I, Guarnerio S, Clerici F, Ivanova M, Chinello C, et al. Antigen retrieval and its effect on the MALDI-MSI of lipids in formalin-fixed paraffin-embedded tissue. J Am Soc Mass Spectrom (2020) 31(8):1619–24. doi: 10.1021/jasms.0c00208
113. Cobice DF, Goodwin RJ, Andren PE, Nilsson A, Mackay CL, Andrew R. Future technology insight: mass spectrometry imaging as a tool in drug research and development. Br J Pharmacol (2015) 172(13):3266–83. doi: 10.1111/bph.13135
114. Smolira A, Wessely-Szponder J. Importance of the matrix and the matrix/sample ratio in MALDI-TOF-MS analysis of cathelicidins obtained from porcine neutrophils. Appl Biochem Biotechnol (2015) 175(4):2050–65. doi: 10.1007/s12010-014-1405-1
115. Kailemia MJ, Ruhaak LR, Lebrilla CB, Amster IJ. Oligosaccharide analysis by mass spectrometry: A review of recent developments. Anal Chem (2014) 86(1):196–212. doi: 10.1021/ac403969n
116. Norris JL, Caprioli RM. Analysis of tissue specimens by matrix-assisted laser desorption/ionization imaging mass spectrometry in biological and clinical research. Chem Rev (2013) 113(4):2309–42. doi: 10.1021/cr3004295
117. Piga I, Capitoli G, Clerici F, Mahajneh A, Brambilla V, Smith A, et al. Ex vivo thyroid fine needle aspirations as an alternative for MALDI-MSI proteomic investigation: intra-patient comparison. Anal Bioanal Chem (2021) 413(5):1259–66. doi: 10.1007/s00216-020-03088-4
118. Piga I, Capitoli G, Denti V, Tettamanti S, Smith A, Stella M, et al. The management of haemoglobin interference for the MALDI-MSI proteomics analysis of thyroid fine needle aspiration biopsies. Anal Bioanal Chem (2019) 411(20):5007–12. doi: 10.1007/s00216-019-01908-w
119. Zhu X, Xu T, Peng C, Wu S. Advances in MALDI mass spectrometry imaging single cell and tissues. Front Chem (2021) 9:782432. doi: 10.3389/fchem.2021.782432
120. Mittal P, Condina MR, Klingler-Hoffmann M, Kaur G, Oehler MK, Sieber OM, et al. Cancer tissue classification using supervised machine learning applied to MALDI mass spectrometry imaging. Cancers (2021) 13(21):5388. doi: 10.3390/cancers13215388
121. Truong JXM, Spotbeen X, White J, Swinnen JV, Butler LM, Snel MF, et al. Removal of optimal cutting temperature (O.C.T.) compound from embedded tissue for MALDI imaging of lipids. Anal Bioanal Chem (2021) 413(10):2695–708. doi: 10.1007/s00216-020-03128-z
122. Bowman AP, Bogie JFJ, Hendriks JJA, Haidar M, Belov M, Heeren RMA, et al. Evaluation of lipid coverage and high spatial resolution MALDI-imaging capabilities of oversampling combined with laser post-ionisation. Anal Bioanal Chem (2020) 412(10):2277–89. doi: 10.1007/s00216-019-02290-3
123. Sezgin S, Hassan R, Zuhlke S, Kuepfer L, Hengstler JG, Spiteller M, et al. Spatio-temporal visualization of the distribution of acetaminophen as well as its metabolites and adducts in mouse livers by MALDI MSI. Arch Toxicol (2018) 92(9):2963–77. doi: 10.1007/s00204-018-2271-3
124. Wang J, Wang C, Han X. Enhanced coverage of lipid analysis and imaging by matrix-assisted laser desorption/ionization mass spectrometry via a strategy with an optimized mixture of matrices. Anal Chim Acta (2018) 1000:155–62. doi: 10.1016/j.aca.2017.09.046
125. Strnad S, Prazienkova V, Sykora D, Cvacka J, Maletinska L, Popelova A, et al. The use of 1,5-diaminonaphthalene for matrix-assisted laser desorption/ionization mass spectrometry imaging of brain in neurodegenerative disorders. Talanta (2019) 201:364–72. doi: 10.1016/j.talanta.2019.03.117
126. Liu H, Chen R, Wang J, Chen S, Xiong C, Wang J, et al. 1,5-diaminonaphthalene hydrochloride assisted laser desorption/ionization mass spectrometry imaging of small molecules in tissues following focal cerebral ischemia. Anal Chem (2014) 86(20):10114–21. doi: 10.1021/ac5034566
127. Wang SS, Wang YJ, Zhang J, Sun TQ, Guo YL. Derivatization strategy for simultaneous molecular imaging of phospholipids and low-abundance free fatty acids in thyroid cancer tissue sections. Anal Chem (2019) 91(6):4070–6. doi: 10.1021/acs.analchem.8b05680
128. Zhou D, Guo S, Zhang M, Liu Y, Chen T, Li Z. Mass spectrometry imaging of small molecules in biological tissues using graphene oxide as a matrix. Anal Chim Acta (2017) 962:52–9. doi: 10.1016/j.aca.2017.01.043
129. Tang W, Gordon A, Wang F, Chen Y, Li B. Hydralazine as a versatile and universal matrix for high-molecular coverage and dual-polarity matrix-assisted laser Desorption/Ionization mass spectrometry imaging. Anal Chem (2021) 93(26):9083–93. doi: 10.1021/acs.analchem.1c00498
130. Wang J, Qiu S, Chen S, Xiong C, Liu H, Wang J, et al. MALDI-TOF MS imaging of metabolites with a n-(1-naphthyl) ethylenediamine dihydrochloride matrix and its application to colorectal cancer liver metastasis. Anal Chem (2015) 87(1):422–30. doi: 10.1021/ac504294s
131. Groven RVM, Nauta SP, Gruisen J, Claes BSR, Greven J, van Griensven M, et al. Lipid analysis of fracture hematoma with MALDI-MSI: Specific lipids are associated to bone fracture healing over time. Front Chem (2021) 9:780626. doi: 10.3389/fchem.2021.780626
132. Wang XD, Han J, Pan JX, Borchers CH. Comprehensive imaging of porcine adrenal gland lipids by MALDI-FTMS using quercetin as a matrix. Anal Chem (2014) 86(1):638–46. doi: 10.1021/ac404044k
133. Guran R, Vanickova L, Horak V, Krizkova S, Michalek P, Heger Z, et al. MALDI MSI of MeLiM melanoma: Searching for differences in protein profiles. PloS One (2017) 12(12):e0189305. doi: 10.1371/journal.pone.0189305
134. Fernandez-Vega A, Chicano-Galvez E, Prentice BM, Anderson D, Priego-Capote F, Lopez-Bascon MA, et al. Optimization of a MALDI-imaging protocol for studying adipose tissue-associated disorders. Talanta (2020) 219:121184. doi: 10.1016/j.talanta.2020.121184
135. McMillen JC, Fincher JA, Klein DR, Spraggins JM, Caprioli RM. Effect of MALDI matrices on lipid analyses of biological tissues using MALDI-2 postionization mass spectrometry. J Mass Spectrom (2020) 55(12):e4663. doi: 10.1002/jms.4663
136. Ly A, Longuespee R, Casadonte R, Wandernoth P, Schwamborn K, Bollwein C, et al. Site-to-Site reproducibility and spatial resolution in MALDI-MSI of peptides from formalin-fixed paraffin-embedded samples. Proteom Clin Appl (2019) 13(1):e1800029. doi: 10.1002/prca.201800029
137. Calvano CD, Monopoli A, Cataldi TRI, Palmisano F. MALDI matrices for low molecular weight compounds: an endless story? Anal Bioanal Chem (2018) 410(17):4015–38. doi: 10.1007/s00216-018-1014-x
138. Vermillion-Salsbury RL, Hercules DM. 9-aminoacridine as a matrix for negative mode matrix-assisted laser desorption/ionization. Rapid Commun Mass Sp (2002) 16(16):1575–81. doi: 10.1002/rcm.750
139. Pallua JD, Schaefer G, Seifarth C, Becker M, Meding S, Rauser S, et al. MALDI-MS tissue imaging identification of biliverdin reductase b overexpression in prostate cancer. J Proteomics (2013) 91:500–14. doi: 10.1016/j.jprot.2013.08.003
140. Neumann EK, Comi TJ, Spegazzini N, Mitchell JW, Rubakhin SS, Gillette MU, et al. Multimodal chemical analysis of the brain by high mass resolution mass spectrometry and infrared spectroscopic imaging. Anal Chem (2018) 90(19):11572–80. doi: 10.1021/acs.analchem.8b02913
141. Dilillo M, Ait-Belkacem R, Esteve C, Pellegrini D, Nicolardi S, Costa M, et al. Ultra-high mass resolution MALDI imaging mass spectrometry of proteins and metabolites in a mouse model of glioblastoma. Sci Rep (2017) 7(1):603. doi: 10.1038/s41598-017-00703-w
142. Do T, Guran R, Jarosova R, Ondrackova P, Sladek Z, Faldyna M, et al. MALDI MSI reveals the spatial distribution of protein markers in tracheobronchial lymph nodes and lung of pigs after respiratory infection. Molecules (2020) 25(23):5723. doi: 10.3390/molecules25235723
143. Sommella E, Salviati E, Caponigro V, Grimaldi M, Musella S, Bertamino A, et al. MALDI mass spectrometry imaging highlights specific metabolome and lipidome profiles in salivary gland tumor tissues. Metabolites (2022) 12(6):530. doi: 10.3390/metabo12060530
144. He H, Qin L, Zhang Y, Han M, Li J, Liu Y, et al. 3,4-dimethoxycinnamic acid as a novel matrix for enhanced In situ detection and imaging of low-Molecular-Weight compounds in biological tissues by MALDI-MSI. Anal Chem (2019) 91(4):2634–43. doi: 10.1021/acs.analchem.8b03522
145. Keller BO, Li L. Discerning matrix-cluster peaks in matrix-assisted laser desorption/ionization time-of-flight mass spectra of dilute peptide mixtures. J Am Soc Mass Spectrom (2000) 11(1):88–93. doi: 10.1016/S1044-0305(99)00126-9
146. Smirnov IP, Zhu X, Taylor T, Huang Y, Ross P, Papayanopoulos IA, et al. Suppression of alpha-cyano-4-hydroxycinnamic acid matrix clusters and reduction of chemical noise in MALDI-TOF mass spectrometry. Anal Chem (2004) 76(10):2958–65. doi: 10.1021/ac035331j
147. Ucal Y, Ozpinar A. Improved spectra for MALDI MSI of peptides using ammonium phosphate monobasic in MALDI matrix. J Mass Spectrom (2018) 53(8):635–48. doi: 10.1002/jms.4198
148. Schlosser G, Pocsfalvi G, Huszar E, Malorni A, Hudecz F. MALDI-TOF mass spectrometry of a combinatorial peptide library: effect of matrix composition on signal suppression. J Mass Spectrom (2005) 40(12):1590–4. doi: 10.1002/jms.937
149. Janda M, Seah BKB, Jakob D, Beckmann J, Geier B, Liebeke M. Determination of abundant metabolite matrix adducts illuminates the dark metabolome of MALDI-mass spectrometry imaging datasets. Anal Chem (2021) 93(24):8399–407. doi: 10.1021/acs.analchem.0c04720
150. Takats Z, Wiseman JM, Cooks RG. Ambient mass spectrometry using desorption electrospray ionization (DESI): instrumentation, mechanisms and applications in forensics, chemistry, and biology. J Mass Spectrom (2005) 40(10):1261–75. doi: 10.1002/jms.922
151. Takáts Z, Wiseman JM, Gologan B, Cooks RG. Electrosonic spray ionization. a gentle technique for generating folded proteins and protein complexes in the gas phase and for studying ion-molecule reactions at atmospheric pressure. Anal Chem (2004) 76(14):4050–8. doi: 10.1021/ac049848m
152. Heck AJ, Van Den Heuvel RH. Investigation of intact protein complexes by mass spectrometry. Mass Spectrom Rev (2004) 23(5):368–89. doi: 10.1002/mas.10081
153. Felitsyn N, Peschke M, Kebarle P. Origin and number of charges observed on multiply-protonated native proteins produced by ESI. Int J Mass Spectrom (2002) 219(1):39–62. doi: 10.1016/S1387-3806(02)00588-2
154. Weston DJ. Ambient ionization mass spectrometry: current understanding of mechanistic theory; analytical performance and application areas. Analyst (2010) 135(4):661–8. doi: 10.1039/b925579f
155. Fernandes AM, Vendramini PH, Galaverna R, Schwab NV, Alberici LC, Augusti R, et al. Direct visualization of neurotransmitters in rat brain slices by desorption electrospray ionization mass spectrometry imaging (DESI - MS). J Am Soc Mass Spectrom (2016) 27(12):1944–51. doi: 10.1007/s13361-016-1475-0
156. Yang X, Song X, Zhang X, Shankar V, Wang S, Yang Y, et al. In situ DESI-MSI lipidomic profiles of mucosal margin of oral squamous cell carcinoma. EBioMedicine (2021) 70:103529. doi: 10.1016/j.ebiom.2021.103529
157. Bennet RV, Gamage CM, Fernandez FM. Imaging of biological tissues by desorption electrospray ionization mass spectrometry. J Vis Exp (2013) 77):e50575. doi: 10.3791/50575
158. Dexter A, Steven RT, Patel A, Dailey LA, Taylor AJ, Ball D, et al. Imaging drugs, metabolites and biomarkers in rodent lung: a DESI MS strategy for the evaluation of drug-induced lipidosis. Anal Bioanal Chem (2019) 411(30):8023–32. doi: 10.1007/s00216-019-02151-z
159. Yin R, Burnum-Johnson KE, Sun X, Dey SK, Laskin J. High spatial resolution imaging of biological tissues using nanospray desorption electrospray ionization mass spectrometry. Nat Protoc (2019) 14(12):3445–70. doi: 10.1038/s41596-019-0237-4
161. Claude E, Jones EA, Pringle SD. DESI mass spectrometry imaging (MSI). Methods Mol Biol (2017) 1618:65–75. doi: 10.1007/978-1-4939-7051-3_7
162. Towers MW, Karancsi T, Jones EA, Pringle SD, Claude E. Optimised desorption electrospray ionisation mass spectrometry imaging (DESI-MSI) for the analysis of Proteins/Peptides directly from tissue sections on a travelling wave ion mobility q-ToF. J Am Soc Mass Spectrom (2018) 29(12):2456–66. doi: 10.1007/s13361-018-2049-0
163. Feider CL, Elizondo N, Eberlin LS. Ambient ionization and FAIMS mass spectrometry for enhanced imaging of multiply charged molecular ions in biological tissues. Anal Chem (2016) 88(23):11533–41. doi: 10.1021/acs.analchem.6b02798
164. Guo R, Zhou L, Chen X. Desorption electrospray ionization (DESI) source coupling ion mobility mass spectrometry for imaging fluoropezil (DC20) distribution in rat brain. Anal Bioanal Chem (2021) 413(23):5835–47. doi: 10.1007/s00216-021-03563-6
165. Bodzon-Kulakowska A, Drabik A, Marszalek M, Kotlinska JH, Suder P. DESI analysis of mammalian cell cultures - sample preparation and method optimisation. J Mass Spectrom (2014) 49(7):613–21. doi: 10.1002/jms.3381
166. Goodwin RJA. Sample preparation for mass spectrometry imaging: small mistakes can lead to big consequences. J Proteomics (2012) 75(16):4893–911. doi: 10.1016/j.jprot.2012.04.012
167. Hermann J, Noels H, Theelen W, Lellig M, Orth-Alampour S, Boor P, et al. Sample preparation of formalin-fixed paraffin-embedded tissue sections for MALDI-mass spectrometry imaging. Anal Bioanal Chem (2020) 412(6):1263–75. doi: 10.1007/s00216-019-02296-x
168. Shah P, Zhang B, Choi C, Yang S, Zhou J, Harlan R, et al. Tissue proteomics using chemical immobilization and mass spectrometry. Anal Biochem (2015) 469:27–33. doi: 10.1016/j.ab.2014.09.017
169. Wangen R, Aasebo E, Trentani A, Doskeland SO, Bruserud O, Selheim F, et al. Preservation method and phosphate buffered saline washing affect the acute myeloid leukemia proteome. Int J Mol Sci (2018) 19(1):296. doi: 10.3390/ijms19010296
170. Hojat A, Wei B, Olson MG, Mao Q, Yong WH. Procurement and storage of surgical biospecimens. Methods Mol Biol (2019) 1897:65–76. doi: 10.1007/978-1-4939-8935-5_7
171. Diehl HC, Beine B, Elm J, Trede D, Ahrens M, Eisenacher M, et al. The challenge of on-tissue digestion for MALDI MSI- a comparison of different protocols to improve imaging experiments. Anal Bioanal Chem (2015) 407(8):2223–43. doi: 10.1007/s00216-014-8345-z
172. Yoon S, Lee TG. Biological tissue sample preparation for time-of-flight secondary ion mass spectrometry (ToF-SIMS) imaging. Nano Converg (2018) 5(1):24. doi: 10.1186/s40580-018-0157-y
173. Ucal Y, Coskun A, Ozpinar A. Quality will determine the future of mass spectrometry imaging in clinical laboratories: the need for standardization. Expert Rev Proteomics (2019) 16(6):521–32. doi: 10.1080/14789450.2019.1624165
174. Piga I, Capitoli G, Tettamanti S, Denti V, Smith A, Chinello C, et al. Feasibility study for the MALDI-MSI analysis of thyroid fine needle aspiration biopsies: Evaluating the morphological and proteomic stability over time. Proteom Clin Appl (2019) 13(1):e1700170. doi: 10.1002/prca.201700170
175. Pagni F, De Sio G, Garancini M, Scardilli M, Chinello C, Smith AJ, et al. Proteomics in thyroid cytopathology: Relevance of MALDI-imaging in distinguishing malignant from benign lesions. Proteomics (2016) 16(11-12):1775–84. doi: 10.1002/pmic.201500448
176. Pagni F, Mainini V, Garancini M, Bono F, Vanzati A, Giardini V, et al. Proteomics for the diagnosis of thyroid lesions: preliminary report. Cytopathology (2015) 26(5):318–24. doi: 10.1111/cyt.12166
177. Guo S, Wang Y, Zhou D, Li Z. Significantly increased monounsaturated lipids relative to polyunsaturated lipids in six types of cancer microenvironment are observed by mass spectrometry imaging. Sci Rep (2014) 4:5959. doi: 10.1038/srep05959
178. Guo S, Qiu L, Wang Y, Qin X, Liu H, He M, et al. Tissue imaging and serum lipidomic profiling for screening potential biomarkers of thyroid tumors by matrix-assisted laser desorption/ionization-Fourier transform ion cyclotron resonance mass spectrometry. Anal Bioanal Chem (2014) 406(18):4357–70. doi: 10.1007/s00216-014-7846-0
179. Mulder IA, Esteve C, Wermer MJ, Hoehn M, Tolner EA, van den Maagdenberg AM, et al. Funnel-freezing versus heat-stabilization for the visualization of metabolites by mass spectrometry imaging in a mouse stroke model. Proteomics (2016) 16(11-12):1652–9. doi: 10.1002/pmic.201500402
180. Cazares LH, Van Tongeren SA, Costantino J, Kenny T, Garza NL, Donnelly G, et al. Heat fixation inactivates viral and bacterial pathogens and is compatible with downstream MALDI mass spectrometry tissue imaging. BMC Microbiol (2015) 15:101. doi: 10.1186/s12866-015-0431-7
181. Sugiura Y, Honda K, Kajimura M, Suematsu M. Visualization and quantification of cerebral metabolic fluxes of glucose in awake mice. Proteomics (2014) 14(7-8):829–38. doi: 10.1002/pmic.201300047
182. Fox CH, Johnson FB, Whiting J, Roller PP. Formaldehyde fixation. J Histochem Cytochem (1985) 33(8):845–53. doi: 10.1177/33.8.3894502
183. Thavarajah R, Mudimbaimannar VK, Elizabeth J, Rao UK, Ranganathan K. Chemical and physical basics of routine formaldehyde fixation. J Oral Maxillofac Pathol (2012) 16(3):400–5. doi: 10.4103/0973-029X.102496
184. Shimma S, Sugiura Y. Effective sample preparations in imaging mass spectrometry. Mass Spectrom (Tokyo) (2014) 3(Spec Issue):S0029. doi: 10.5702/massspectrometry.S0029
185. Longuespee R, Kriegsmann K, Cremer M, Zgorzelski C, Casadonte R, Kazdal D, et al. In MALDI-mass spectrometry imaging on formalin-fixed paraffin-embedded tissue specimen section thickness significantly influences m/z peak intensity. Proteomics Clin Appl (2019) 13(1):e1800074. doi: 10.1002/prca.201800074
186. Dilmetz BA, Lee Y, Condina MR, Briggs M, Young C, Desire CT, et al. Novel technical developments in mass spectrometry imaging in 2020: A mini review. Anal Sci Adv (2021) 2(3-4):225–37. doi: 10.1002/ansa.202000176
187. Ma L, Xie Q, Du M, Huang Y, Chen Y, Chen D, et al. Sample preparation optimization of insects and zebrafish for whole-body mass spectrometry imaging. Anal Bioanal Chem (2022) 414(16):4777–90. doi: 10.1007/s00216-022-04102-7
188. Holm NB, Deryabina M, Knudsen CB, Janfelt C. Tissue distribution and metabolic profiling of cyclosporine (CsA) in mouse and rat investigated by DESI and MALDI mass spectrometry imaging (MSI) of whole-body and single organ cryo-sections. Anal Bioanal Chem (2022) 414(24):7167–77. doi: 10.1007/s00216-022-04269-z
189. Chen H, Li X, Chen F, Li L, Ye F, Bu H, et al. Performance comparison of two cryosection embedding agents used for desorption electrospray ionization mass spectrometry imaging. J Sichuan Univ Med Sci ed (2022) 53(2):303–9. doi: 10.12182/20220360106
190. Gill EL, Yost RA, Vedam-Mai V, Garrett TJ. Precast gelatin-based molds for tissue embedding compatible with mass spectrometry imaging. Anal Chem (2017) 89(1):576–80. doi: 10.1021/acs.analchem.6b04185
191. Neumann EK, Patterson NH, Allen JL, Migas LG, Yang H, Brewer M, et al. Protocol for multimodal analysis of human kidney tissue by imaging mass spectrometry and CODEX multiplexed immunofluorescence. STAR Protoc (2021) 2(3):100747. doi: 10.1016/j.xpro.2021.100747
192. Schwartz SA, Reyzer ML, Caprioli RM. Direct tissue analysis using matrix-assisted laser desorption/ionization mass spectrometry: practical aspects of sample preparation. J Mass Spectrom (2003) 38(7):699–708. doi: 10.1002/jms.505
193. Dannhorn A, Kazanc E, Ling S, Nikula C, Karali E, Serra MP, et al. Universal sample preparation unlocking multimodal molecular tissue imaging. Anal Chem (2020) 92(16):11080–8. doi: 10.1021/acs.analchem.0c00826
194. Zhang D, Huo G, Qu Z, Lv J, Yang Y, Li C, et al. Discussion on key points of freezing sectioning technology of experimental animals. Drug Eval Res (2019) 42(7):1359–61. doi: 10.7501/j.issn.1674-6376.2019.07.018
195. Dey P. Frozen section: Principle and procedure. In: Basic and advanced laboratory techniques in histopathology and cytology (2018) Singapore: Springer. p. 51–5.
196. Wang Z, Fu W, Huo M, He B, Liu Y, Tian L, et al. Spatial-resolved metabolomics reveals tissue-specific metabolic reprogramming in diabetic nephropathy by using mass spectrometry imaging. Acta Pharm Sin B (2021) 11(11):3665–77. doi: 10.1016/j.apsb.2021.05.013
197. Neumann EK, Djambazova KV, Caprioli RM, Spraggins JM. Multimodal imaging mass spectrometry: Next generation molecular mapping in biology and medicine. J Am Soc Mass Spectrom (2020) 31(12):2401–15. doi: 10.1021/jasms.0c00232
198. Kulbe H, Klein O, Wu Z, Taube ET, Kassuhn W, Horst D, et al. Discovery of prognostic markers for early-stage high-grade serous ovarian cancer by maldi-imaging. Cancers (Basel) (2020) 12(8):2000. doi: 10.1055/s-0040-1718157
199. Zang Q, Sun C, Chu X, Li L, Gan W, Zhao Z, et al. Spatially resolved metabolomics combined with multicellular tumor spheroids to discover cancer tissue relevant metabolic signatures. Anal Chim Acta (2021) 1155:338342. doi: 10.1016/j.aca.2021.338342
200. Sun C, Li Z, Ma C, Zang Q, Li J, Liu W, et al. Acetone immersion enhanced MALDI-MS imaging of small molecule metabolites in biological tissues. J Pharm BioMed Anal (2019) 176:112797. doi: 10.1016/j.jpba.2019.112797
201. Chen Y, Tang W, Gordon A, Li B. Development of an integrated tissue pretreatment protocol for enhanced MALDI MS imaging of drug distribution in the brain. J Am Soc Mass Spectrom (2020) 31(5):1066–73. doi: 10.1021/jasms.0c00003
202. Piga I, Heijs B, Nicolardi S, Giusti L, Marselli L, Marchetti P, et al. Ultra-high resolution MALDI-FTICR-MSI analysis of intact proteins in mouse and human pancreas tissue. Int J Mass Spectrom (2019) 437:10–6. doi: 10.1016/j.ijms.2017.11.001
203. Hoiem TS, Andersen MK, Martin-Lorenzo M, Longuespee R, Claes BSR, Nordborg A, et al. An optimized MALDI MSI protocol for spatial detection of tryptic peptides in fresh frozen prostate tissue. Proteomics (2022) 22(10):e2100223. doi: 10.1002/pmic.202100223
204. Angerer TB, Bour J, Biagi JL, Moskovets E, Frache G. Evaluation of 6 MALDI-matrices for 10 mum lipid imaging and on-tissue MSn with AP-MALDI-Orbitrap. J Am Soc Mass Spectrom (2022) 33(5):760–71. doi: 10.1021/jasms.1c00327
205. Phillips L, Gill AJ, Baxter RC. Novel prognostic markers in triple-negative breast cancer discovered by MALDI-mass spectrometry imaging. Front Oncol (2019) 9:379. doi: 10.3389/fonc.2019.00379
206. Gonzalez de San Roman E, Bidmon HJ, Malisic M, Susnea I, Kuppers A, Hubbers R, et al. Molecular composition of the human primary visual cortex profiled by multimodal mass spectrometry imaging. Brain Struct Funct (2018) 223(6):2767–83. doi: 10.1007/s00429-018-1660-y
207. Patel E. Fresh frozen versus formalin-fixed paraffin embedded for mass spectrometry imaging. Methods Mol Biol (2017) 1618:7–14. doi: 10.1007/978-1-4939-7051-3_2
208. De Sio G, Smith AJ, Galli M, Garancini M, Chinello C, Bono F, et al. A MALDI-mass spectrometry imaging method applicable to different formalin-fixed paraffin-embedded human tissues. Mol Biosyst (2015) 11(6):1507–14. doi: 10.1039/C4MB00716F
209. Abdelmoula WM, Skraskova K, Balluff B, Carreira RJ, Tolner EA, Lelieveldt BP, et al. Automatic generic registration of mass spectrometry imaging data to histology using nonlinear stochastic embedding. Anal Chem (2014) 86(18):9204–11. doi: 10.1021/ac502170f
210. Azimzadeh O, Atkinson MJ, Tapio S. Quantitative proteomic analysis using formalin-fixed, paraffin-embedded (FFPE) human cardiac tissue. Methods Mol Biol (2021) 2261:525–33. doi: 10.1007/978-1-0716-1186-9_33
211. Zhou Q, Fulop A, Hopf C. Recent developments of novel matrices and on-tissue chemical derivatization reagents for MALDI-MSI. Anal Bioanal Chem (2021) 413(10):2599–617. doi: 10.1007/s00216-020-03023-7
212. Manier ML, Spraggins JM, Reyzer ML, Norris JL, Caprioli RM. A derivatization and validation strategy for determining the spatial localization of endogenous amine metabolites in tissues using MALDI imaging mass spectrometry. J Mass Spectrom (2014) 49(8):665–73. doi: 10.1002/jms.3411
213. Takeo E, Sugiura Y, Uemura T, Nishimoto K, Yasuda M, Sugiyama E, et al. Tandem mass spectrometry imaging reveals distinct accumulation patterns of steroid structural isomers in human adrenal glands. Anal Chem (2019) 91(14):8918–25. doi: 10.1021/acs.analchem.9b00619
214. Cobice DF, Mackay CL, Goodwin RJ, McBride A, Langridge-Smith PR, Webster SP, et al. Mass spectrometry imaging for dissecting steroid intracrinology within target tissues. Anal Chem (2013) 85(23):11576–84. doi: 10.1021/ac402777k
215. Harkin C, Smith KW, Cruickshank FL, Logan Mackay C, Flinders B, Heeren RMA, et al. On-tissue chemical derivatization in mass spectrometry imaging. Mass Spectrom Rev (2022) 41(5):662–94. doi: 10.1002/mas.21680
216. Kaya I, Brulls SM, Dunevall J, Jennische E, Lange S, Martensson J, et al. On-tissue chemical derivatization of catecholamines using 4-( n-methyl)pyridinium boronic acid for ToF-SIMS and LDI-ToF mass spectrometry imaging. Anal Chem (2018) 90(22):13580–90. doi: 10.1021/acs.analchem.8b03746
217. Jones EA, Deininger SO, Hogendoorn PCW, Deelder AM, McDonnell LA. Imaging mass spectrometry statistical analysis. J Proteomics (2012) 75(16):4962–89. doi: 10.1016/j.jprot.2012.06.014
218. Rafols P, Vilalta D, Brezmes J, Canellas N, Del Castillo E, Yanes O, et al. Signal preprocessing, multivariate analysis and software tools for MA(LDI)-TOF mass spectrometry imaging for biological applications. Mass Spectrom Rev (2018) 37(3):281–306. doi: 10.1002/mas.21527
219. Galli M, Zoppis I, Smith A, Magni F, Mauri G. Machine learning approaches in MALDI-MSI: clinical applications. Expert Rev Proteomics (2016) 13(7):685–96. doi: 10.1080/14789450.2016.1200470
220. Flinders B, Beasley E, Verlaan RM, Cuypers E, Francese S, Bassindale T, et al. Optimization of sample preparation and instrumental parameters for the rapid analysis of drugs of abuse in hair samples by MALDI-MS/MS imaging. J Am Soc Mass Spectrom (2017) 28(11):2462–8. doi: 10.1007/s13361-017-1766-0
221. Holzlechner M, Bonta M, Lohninger H, Limbeck A, Marchetti-Deschmann M. Multisensor imaging-from sample preparation to integrated multimodal interpretation of LA-ICPMS and MALDI MS imaging data. Anal Chem (2018) 90(15):8831–7. doi: 10.1021/acs.analchem.8b00816
222. Jardin-Mathe O, Bonnel D, Franck J, Wisztorski M, Macagno E, Fournier I, et al. MITICS (MALDI imaging team imaging computing system): a new open source mass spectrometry imaging software. J Proteomics (2008) 71(3):332–45. doi: 10.1016/j.jprot.2008.07.004
223. Kriegsmann J, Kriegsmann M, Kriegsmann K, Longuespee R, Deininger SO, Casadonte R. MALDI imaging for proteomic painting of heterogeneous tissue structures. Proteom Clin Appl (2019) 13(1):e1800045. doi: 10.1002/prca.201800045
224. Bradshaw R, Wilson G, Denison N, Francese S. Application of MALDI MS imaging after sequential processing of latent fingermarks. Forensic Sci Int (2021) 319:110643. doi: 10.1016/j.forsciint.2020.110643
225. He JM, Huang LJ, Tian RT, Li TG, Sun CL, Song XW, et al. MassImager: A software for interactive and in-depth analysis of mass spectrometry imaging data. Anal Chim Acta (2018) 1015:50–7. doi: 10.1016/j.aca.2018.02.030
226. Liu J, Xiong X, Ouyang Z. Data processing and analysis for mass spectrometry imaging. Methods Mol Biol (2015) 1203:195–209. doi: 10.1007/978-1-4939-1357-2_19
227. Bemis KD, Harry A, Eberlin LS, Ferreira C, van de Ven SM, Mallick P, et al. Cardinal: an r package for statistical analysis of mass spectrometry-based imaging experiments. Bioinformatics (2015) 31(14):2418–20. doi: 10.1093/bioinformatics/btv146
228. Lopes MBS. World health ozganization 2017 classification of pituitary tumors. Endocrinol Metab Clin North Am (2020) 49(3):375–86. doi: 10.1016/j.ecl.2020.05.001
229. Nanba K, Omata K, Gomez-Sanchez CE, Stratakis CA, Demidowich AP, Suzuki M, et al. Genetic characteristics of aldosterone-producing adenomas in blacks. Hypertension (2019) 73(4):885–92. doi: 10.1161/HYPERTENSIONAHA.118.12070
230. Vuong HG, Kondo T, Oishi N, Nakazawa T, Mochizuki K, Inoue T, et al. Genetic alterations of differentiated thyroid carcinoma in iodine-rich and iodine-deficient countries. Cancer Med (2016) 5(8):1883–9. doi: 10.1002/cam4.781
231. Gadelha MR, Trivellin G, Hernandez Ramirez LC, Korbonits M. Genetics of pituitary adenomas. Front Horm Res (2013) 41:111–40. doi: 10.1159/000345673
232. Hasin Y, Seldin M, Lusis A. Multi-omics approaches to disease. Genome Biol (2017) 18(1):83. doi: 10.1186/s13059-017-1215-1
233. Fortelny N, Overall CM, Pavlidis P, Freue GVC. Can we predict protein from mRNA levels? Nature (2017) 547(7664):E19–20. doi: 10.1038/nature22293
234. Kosti I, Jain N, Aran D, Butte AJ, Sirota M. Cross-tissue analysis of gene and protein expression in normal and cancer tissues. Sci Rep (2016) 6:24799. doi: 10.1038/srep24799
235. Pandey A, Mann M. Proteomics to study genes and genomes. Nature (2000) 405(6788):837–46. doi: 10.1038/35015709
236. Galli M, Zoppis I, De Sio G, Chinello C, Pagni F, Magni F, et al. A support vector machine classification of thyroid bioptic specimens using MALDI-MSI data. Adv Bioinf (2016) 2016:3791214. doi: 10.1155/2016/3791214
237. Galli M, Pagni F, De Sio G, Smith A, Chinello C, Stella M, et al. Proteomic profiles of thyroid tumors by mass spectrometry-imaging on tissue microarrays. Biochim Biophys Acta Proteins Proteom (2017) 1865(7):817–27. doi: 10.1016/j.bbapap.2016.11.020
238. Pietrowska M, Diehl HC, Mrukwa G, Kalinowska-Herok M, Gawin M, Chekan M, et al. Molecular profiles of thyroid cancer subtypes: Classification based on features of tissue revealed by mass spectrometry imaging. Biochim Biophys Acta Proteins Proteom (2017) 1865(7):837–45. doi: 10.1016/j.bbapap.2016.10.006
239. Mainini V, Pagni F, Garancini M, Giardini V, De Sio G, Cusi C, et al. An alternative approach in endocrine pathology research: MALDI-IMS in papillary thyroid carcinoma. Endocr Pathol (2013) 24(4):250–3. doi: 10.1007/s12022-013-9273-8
240. Calligaris D, Feldman DR, Norton I, Olubiyi O, Changelian AN, Machaidze R, et al. MALDI mass spectrometry imaging analysis of pituitary adenomas for near-real-time tumor delineation. Proc Natl Acad Sci U S A. (2015) 112(32):9978–83. doi: 10.1073/pnas.1423101112
241. Smith A, Galli M, Piga I, Denti V, Stella M, Chinello C, et al. Molecular signatures of medullary thyroid carcinoma by matrix-assisted laser desorption/ionisation mass spectrometry imaging. J Proteomics (2019) 191:114–23. doi: 10.1016/j.jprot.2018.03.021
242. Nipp M, Elsner M, Balluff B, Meding S, Sarioglu H, Ueffing M, et al. S100-A10, thioredoxin, and S100-A6 as biomarkers of papillary thyroid carcinoma with lymph node metastasis identified by MALDI imaging. J Mol Med (Berl) (2012) 90(2):163–74. doi: 10.1007/s00109-011-0815-6
243. Karsch-Bluman A, Feiglin A, Arbib E, Stern T, Shoval H, Schwob O, et al. Tissue necrosis and its role in cancer progression. Oncogene (2019) 38(11):1920–35. doi: 10.1038/s41388-018-0555-y
244. Scott DA, Norris-Caneda K, Spruill L, Bruner E, Kono Y, Angel PM, et al. Specific n-linked glycosylation patterns in areas of necrosis in tumor tissues. Int J Mass Spectrom (2019) 437:69–76. doi: 10.1016/j.ijms.2018.01.002
245. Gawin M, Kurczyk A, Stobiecka E, Fratczak K, Polanska J, Pietrowska M, et al. Molecular heterogeneity of papillary thyroid cancer: Comparison of primary tumors and synchronous metastases in regional lymph nodes by mass spectrometry imaging. Endocr Pathol (2019) 30(4):250–61. doi: 10.1007/s12022-019-09593-2
246. Zhao YY, Miao H, Cheng XL, Wei F. Lipidomics: Novel insight into the biochemical mechanism of lipid metabolism and dysregulation-associated disease. Chem Biol Interact (2015) 240:220–38. doi: 10.1016/j.cbi.2015.09.005
247. Fahy E, Subramaniam S, Murphy RC, Nishijima M, Raetz CR, Shimizu T, et al. Update of the LIPID MAPS comprehensive classification system for lipids. J Lipid Res (2009) 50 Suppl:S9–14. doi: 10.1194/jlr.R800095-JLR200
248. Spener F, Lagarde M, Géloên A, Record M. What is lipidoics? Eur J Lipid Sci Tech (2003) 105(9):481–2. doi: 10.1002/ejlt.200390101
249. Butler LM, Perone Y, Dehairs J, Lupien LE, de Laat V, Talebi A, et al. Lipids and cancer: Emerging roles in pathogenesis, diagnosis and therapeutic intervention. Adv Drug Deliv Rev (2020) 159:245–93. doi: 10.1016/j.addr.2020.07.013
250. Perrotti F, Rosa C, Cicalini I, Sacchetta P, Del Boccio P, Genovesi D, et al. Advances in lipidomics for cancer biomarkers discovery. Int J Mol Sci (2016) 17(12):1992. doi: 10.3390/ijms17121992
251. Zheng M, Wang W, Liu J, Zhang X, Zhang R. Lipid metabolism in cancer cells. Adv Exp Med Biol (2021) 1316:49–69. doi: 10.1007/978-981-33-6785-2_4
252. Pakiet A, Kobiela J, Stepnowski P, Sledzinski T, Mika A. Changes in lipids composition and metabolism in colorectal cancer: a review. Lipids Health Dis (2019) 18(1):29. doi: 10.1186/s12944-019-0977-8
253. von Roemeling CA, Marlow LA, Pinkerton AB, Crist A, Miller J, Tun HW, et al. Aberrant lipid metabolism in anaplastic thyroid carcinoma reveals stearoyl CoA desaturase 1 as a novel therapeutic target. J Clin Endocrinol Metab (2015) 100(5):E697–709. doi: 10.1210/jc.2014-2764
254. von Roemeling CA, Copland JA. Targeting lipid metabolism for the treatment of anaplastic thyroid carcinoma. Expert Opin Ther Targets (2016) 20(2):159–66. doi: 10.1517/14728222.2016.1086341
255. Ascenzi F, De Vitis C, Maugeri-Sacca M, Napoli C, Ciliberto G, Mancini R. SCD1, autophagy and cancer: implications for therapy. J Exp Clin Cancer Res (2021) 40(1):265. doi: 10.1186/s13046-021-02067-6
256. Guillou H, Zadravec D, Martin PG, Jacobsson A. The key roles of elongases and desaturases in mammalian fatty acid metabolism: Insights from transgenic mice. Prog Lipid Res (2010) 49(2):186–99. doi: 10.1016/j.plipres.2009.12.002
257. Miyazaki M, Ntambi JM. Role of stearoyl-coenzyme a desaturase in lipid metabolism. Prostaglandins Leukot Essent Fatty Acids (2003) 68(2):113–21. doi: 10.1016/S0952-3278(02)00261-2
258. DeHoog RJ, Zhang J, Alore E, Lin JQ, Yu W, Woody S, et al. Preoperative metabolic classification of thyroid nodules using mass spectrometry imaging of fine-needle aspiration biopsies. Proc Natl Acad Sci U S A. (2019) 116(43):21401–8. doi: 10.1073/pnas.1911333116
259. Ishikawa S, Tateya I, Hayasaka T, Masaki N, Takizawa Y, Ohno S, et al. Increased expression of phosphatidylcholine (16:0/18:1) and (16:0/18:2) in thyroid papillary cancer. PloS One (2012) 7(11):e48873. doi: 10.1371/journal.pone.0048873
260. Wojakowska A, Cole LM, Chekan M, Bednarczyk K, Maksymiak M, Oczko-Wojciechowska M, et al. Discrimination of papillary thyroid cancer from non-cancerous thyroid tissue based on lipid profiling by mass spectrometry imaging. Endokrynol Pol (2018) 69(1):2–8. doi: 10.5603/EP.a2018.0003
261. Ahmadpour ST, Maheo K, Servais S, Brisson L, Dumas JF. Cardiolipin, the mitochondrial signature lipid: Implication in cancer. Int J Mol Sci (2020) 21(21):8031. doi: 10.3390/ijms21218031
262. Zhang J, Yu W, Ryu SW, Lin J, Buentello G, Tibshirani R, et al. Cardiolipins are biomarkers of mitochondria-rich thyroid oncocytic tumors. Cancer Res (2016) 76(22):6588–97. doi: 10.1158/0008-5472.CAN-16-1545
263. Zhang J, Feider CL, Nagi C, Yu W, Carter SA, Suliburk J, et al. Detection of metastatic breast and thyroid cancer in lymph nodes by desorption electrospray ionization mass spectrometry imaging. J Am Soc Mass Spectrom (2017) 28(6):1166–74. doi: 10.1007/s13361-016-1570-2
264. Guo L, Lai Z, Wang Y, Li Z. In situ probing changes in fatty-acyl chain length and desaturation of lipids in cancerous areas using mass spectrometry imaging. J Mass Spectrom (2020) 56(4):e4621. doi: 10.1002/jms.4621
265. Mirnezami R, Veselkov K, Strittmatter N, Goldin RD, Kinross JM, Stebbing J, et al. Spatially resolved profiling of colorectal cancer lipid biochemistry via DESI imaging mass spectrometry to reveal morphology-dependent alterations in fatty acid metabolism. J Clin Oncol (2016) 34(15):e15104–e. doi: 10.1200/JCO.2016.34.15_suppl.e15104
266. Pavlova NN, Thompson CB. The emerging hallmarks of cancer metabolism. Cell Metab (2016) 23(1):27–47. doi: 10.1016/j.cmet.2015.12.006
267. Rohrig F, Schulze A. The multifaceted roles of fatty acid synthesis in cancer. Nat Rev Cancer (2016) 16(11):732–49. doi: 10.1038/nrc.2016.89
268. Yu XH, Ren XH, Liang XH, Tang YL. Roles of fatty acid metabolism in tumourigenesis: Beyond providing nutrition (Review). Mol Med Rep (2018) 18(6):5307–16. doi: 10.3892/mmr.2018.9577
269. Rinschen MM, Ivanisevic J, Giera M, Siuzdak G. Identification of bioactive metabolites using activity metabolomics. Nat Rev Mol Cell Biol (2019) 20(6):353–67. doi: 10.1038/s41580-019-0108-4
270. Pinzariu O, Georgescu B, Georgescu CE. Metabolomics-a promising approach to pituitary adenomas. Front Endocrinol (Lausanne) (2018) 9:814. doi: 10.3389/fendo.2018.00814
271. Pei Z, Wang S. Recent advance in metabolomics of pituitary adenoma. Chin J Neuromed (2021) 20(5):536–9. doi: 10.3760/cma.j.cn115354-20200604-00445
272. Wishart DS. Metabolomics for investigating physiological and pathophysiological processes. Physiol Rev (2019) 99(4):1819–75. doi: 10.1152/physrev.00035.2018
273. Sun N, Kunzke T, Sbiera S, Kircher S, Feuchtinger A, Aichler M, et al. Prognostic relevance of steroid sulfation in adrenocortical carcinoma revealed by molecular phenotyping using high-resolution mass spectrometry imaging. Clin Chem (2019) 65(10):1276–86. doi: 10.1373/clinchem.2019.306043
274. Huang L, Mao X, Sun C, Luo Z, Song X, Li X, et al. A graphical data processing pipeline for mass spectrometry imaging-based spatially resolved metabolomics on tumor heterogeneity. Anal Chim Acta (2019) 1077:183–90. doi: 10.1016/j.aca.2019.05.068
275. Kelly B, Pearce EL. Amino assets: How amino acids support immunity. Cell Metab (2020) 32(2):154–75. doi: 10.1016/j.cmet.2020.06.010
276. Xu Y, Zheng X, Qiu Y, Jia W, Wang J, Yin S. Distinct metabolomic profiles of papillary thyroid carcinoma and benign thyroid adenoma. J Proteome Res (2015) 14(8):3315–21. doi: 10.1021/acs.jproteome.5b00351
277. Miccoli P, Torregrossa L, Shintu L, Magalhaes A, Chandran J, Tintaru A, et al. Metabolomics approach to thyroid nodules: a high-resolution magic-angle spinning nuclear magnetic resonance-based study. Surgery (2012) 152(6):1118–24. doi: 10.1016/j.surg.2012.08.037
278. Vettore L, Westbrook RL, Tennant DA. New aspects of amino acid metabolism in cancer. Br J Cancer (2020) 122(2):150–6. doi: 10.1038/s41416-019-0620-5
279. Enomoto K, Hotomi M. Amino acid transporters as potential therapeutic targets in thyroid cancer. Endocrinol Metab (Seoul) (2020) 35(2):227–36. doi: 10.3803/EnM.2020.35.2.227
280. McCarty R. Learning about stress: neural, endocrine and behavioral adaptations. Stress (2016) 19(5):449–75. doi: 10.1080/10253890.2016.1192120
281. Tank AW, Lee Wong D. Peripheral and central effects of circulating catecholamines. Compr Physiol (2015) 5(1):1–15. doi: 10.1002/cphy.c140007
282. Berends AMA, Eisenhofer G, Fishbein L, Horst-Schrivers A, Kema IP, Links TP, et al. Intricacies of the molecular machinery of catecholamine biosynthesis and secretion by chromaffin cells of the normal adrenal medulla and in pheochromocytoma and paraganglioma. Cancers (Basel) (2019) 11(8):1121. doi: 10.3390/cancers11081121
283. Nishimoto K, Tomlins SA, Kuick R, Cani AK, Giordano TJ, Hovelson DH, et al. Aldosterone-stimulating somatic gene mutations are common in normal adrenal glands. Proc Natl Acad Sci U S A. (2015) 112(33):E4591–9. doi: 10.1073/pnas.1505529112
284. Sugiura Y, Takeo E, Shimma S, Yokota M, Higashi T, Seki T, et al. Aldosterone and 18-oxocortisol coaccumulation in aldosterone-producing lesions. Hypertension (2018) 72(6):1345–54. doi: 10.1161/HYPERTENSIONAHA.118.11243
285. Sun N, Meyer LS, Feuchtinger A, Kunzke T, Knosel T, Reincke M, et al. Mass spectrometry imaging establishes 2 distinct metabolic phenotypes of aldosterone-producing cell clusters in primary aldosteronism. Hypertension (2020) 75(3):634–44. doi: 10.1161/HYPERTENSIONAHA.119.14041
286. Murakami M, Rhayem Y, Kunzke T, Sun N, Feuchtinger A, Ludwig P, et al. In situ metabolomics of aldosterone-producing adenomas. JCI Insight (2019) 4(17):e130356. doi: 10.1172/jci.insight.130356
287. Tang Y, Xie T, Wu S, Yang Q, Liu T, Li C, et al. Quantitative proteomics revealed the molecular characteristics of distinct types of granulated somatotroph adenomas. Endocrine (2021) 74(2):375–86. doi: 10.1007/s12020-021-02767-1
288. Ramadan N, Ghazale H, El-Sayyad M, El-Haress M, Kobeissy FH. Neuroproteomics studies: Challenges and updates. Methods Mol Biol (2017) 1598:3–19. doi: 10.1007/978-1-4939-6952-4_1
289. Dilillo M, Pellegrini D, Ait-Belkacem R, de Graaf EL, Caleo M, McDonnell LA. Mass spectrometry imaging, laser capture microdissection, and LC-MS/MS of the same tissue section. J Proteome Res (2017) 16(8):2993–3001. doi: 10.1021/acs.jproteome.7b00284
290. Mezger STP, Mingels AMA, Bekers O, Heeren RMA, Cillero-Pastor B. Mass spectrometry spatial-omics on a single conductive slide. Anal Chem (2021) 93(4):2527–33. doi: 10.1021/acs.analchem.0c04572
291. Dewez F, Martin-Lorenzo M, Herfs M, Baiwir D, Mazzucchelli G, De Pauw E, et al. Precise co-registration of mass spectrometry imaging, histology, and laser microdissection-based omics. Anal Bioanal Chem (2019) 411(22):5647–53. doi: 10.1007/s00216-019-01983-z
292. Basu SS, Stopka SA, Abdelmoula WM, Randall EC, Gimenez-Cassina Lopez B, Regan MS, et al. Interim clinical trial analysis of intraoperative mass spectrometry for breast cancer surgery. NPJ Breast Cancer (2021) 7(1):116. doi: 10.1038/s41523-021-00318-5
293. Quanico J, Franck J, Cardon T, Leblanc E, Wisztorski M, Salzet M, et al. NanoLC-MS coupling of liquid microjunction microextraction for on-tissue proteomic analysis. Biochim Biophys Acta Proteins Proteom (2017) 1865(7):891–900. doi: 10.1016/j.bbapap.2016.11.002
294. Mallah K, Zibara K, Kerbaj C, Eid A, Khoshman N, Ousseily Z, et al. Neurotrauma investigation through spatial omics guided by mass spectrometry imaging: Target identification and clinical applications. Mass Spectrom Rev (2021) 42(1):189–205. doi: 10.1002/mas.21719
295. Huang P, Kong Q, Gao W, Chu B, Li H, Mao Y, et al. Spatial proteome profiling by immunohistochemistry-based laser capture microdissection and data-independent acquisition proteomics. Anal Chim Acta (2020) 1127:140–8. doi: 10.1016/j.aca.2020.06.049
296. Ezzoukhry Z, Henriet E, Cordelieres FP, Dupuy JW, Maitre M, Gay N, et al. Combining laser capture microdissection and proteomics reveals an active translation machinery controlling invadosome formation. Nat Commun (2018) 9(1):2031. doi: 10.1038/s41467-018-04461-9
297. Tikka S, Monogioudi E, Gotsopoulos A, Soliymani R, Pezzini F, Scifo E, et al. Proteomic profiling in the brain of CLN1 disease model reveals affected functional modules. Neuromol Med (2016) 18(1):109–33. doi: 10.1007/s12017-015-8382-6
298. Cole LM, Clench MR, Francese S. Sample treatment for tissue proteomics in cancer, toxicology, and forensics. Adv Exp Med Biol (2019) 1073:77–123. doi: 10.1007/978-3-030-12298-0_4
299. Himmel LE, Hackett TA, Moore JL, Adams WR, Thomas G, Novitskaya T, et al. Beyond the H&E: Advanced technologies for in situ tissue biomarker imaging. ILAR J (2018) 59(1):51–65. doi: 10.1093/ilar/ily004
300. Espina V, Wulfkuhle JD, Calvert VS, VanMeter A, Zhou W, Coukos G, et al. Laser-capture microdissection. Nat Protoc (2006) 1(2):586–603. doi: 10.1038/nprot.2006.85
301. Gallagher RI, Blakely SR, Liotta LA, Espina V. Laser capture microdissection: Arcturus(XT) infrared capture and UV cutting methods. Methods Mol Biol (2012) 823:157–78. doi: 10.1007/978-1-60327-216-2_11
302. Chokechanachaisakul U, Kaneko T, Okiji T, Kaneko R, Suda H, Nor JE. Laser capture microdissection in dentistry. Int J Dent (2010) 2010:592694. doi: 10.1155/2010/592694
303. Quanico J, Franck J, Dauly C, Strupat K, Dupuy J, Day R, et al. Development of liquid microjunction extraction strategy for improving protein identification from tissue sections. J Proteomics (2013) 79:200–18. doi: 10.1016/j.jprot.2012.11.025
304. Comi TJ, Makurath MA, Philip MC, Rubakhin SS, Sweedler JV. MALDI MS guided liquid microjunction extraction for capillary electrophoresis-electrospray ionization MS analysis of single pancreatic islet cells. Anal Chem (2017) 89(14):7765–72. doi: 10.1021/acs.analchem.7b01782
305. Griffiths RL, Randall EC, Race AM, Bunch J, Cooper HJ. Raster-mode continuous-flow liquid microjunction mass spectrometry imaging of proteins in thin tissue sections. Anal Chem (2017) 89(11):5683–7. doi: 10.1021/acs.analchem.7b00977
306. Domenick TM, Vedam-Mai V, Yost RA. Design and implementation of a dual-probe microsampling apparatus for the direct analysis of adherent mammalian cells by ion mobility-mass spectrometry. Anal Chem (2020) 92(17):12055–61. doi: 10.1021/acs.analchem.0c02714
307. Kertesz V, Van Berkel GJ. Sampling reliability, spatial resolution, spatial precision, and extraction efficiency in droplet-based liquid microjunction surface sampling. Rapid Commun Mass Spectrom (2014) 28(13):1553–60. doi: 10.1002/rcm.6931
308. Wisztorski M, Quanico J, Franck J, Fatou B, Salzet M, Fournier I. Droplet-based liquid extraction for spatially-resolved microproteomics analysis of tissue sections. Methods Mol Biol (2017) 1618:49–63. doi: 10.1007/978-1-4939-7051-3_6
309. Griffiths RL, Kocurek KI, Cooper HJ. Liquid extraction surface analysis (LESA) high-field asymmetric waveform ion mobility spectrometry (FAIMS) mass spectrometry for In situ analysis of intact proteins. Methods Mol Biol (2020) 2084:191–201. doi: 10.1007/978-1-0716-0030-6_12
310. Wisztorski M, Desmons A, Quanico J, Fatou B, Gimeno JP, Franck J, et al. Spatially-resolved protein surface microsampling from tissue sections using liquid extraction surface analysis. Proteomics (2016) 16(11-12):1622–32. doi: 10.1002/pmic.201500508
311. Ryan DJ, Nei D, Prentice BM, Rose KL, Caprioli RM, Spraggins JM. Protein identification in imaging mass spectrometry through spatially targeted liquid micro-extractions. Rapid Commun Mass Sp (2018) 32(5):442–50. doi: 10.1002/rcm.8042
312. Kertesz V, Vavrek M, Freddo C, Van Berkel GJ. Spatial profiling of stapled alpha-helical peptide ATSP-7041 in mouse whole-body thin tissue sections using droplet-based liquid microjunction surface sampling-HPLC-ESI-MS/MS. Int J Mass Spectrom (2019) 437:17–22. doi: 10.1016/j.ijms.2018.01.005
313. Kertesz V, Van Berkel GJ. Liquid microjunction surface sampling coupled with high-pressure liquid chromatography-electrospray ionization-mass spectrometry for analysis of drugs and metabolites in whole-body thin tissue sections. Anal Chem (2010) 82(14):5917–21. doi: 10.1021/ac100954p
314. Simon D, Oleschuk R. The liquid micro junction-surface sampling probe (LMJ-SSP); a versatile ambient mass spectrometry interface. Analyst (2021) 146(21):6365–78. doi: 10.1039/D1AN00725D
315. Liu Y, Wu J, Liu S, Zhuang D, Wang Y, Shou X, et al. Immuno-laser capture microdissection of frozen prolactioma sections to prepare proteomic samples. Colloids Surf B Biointerfaces (2009) 71(2):187–93. doi: 10.1016/j.colsurfb.2009.02.005
316. Liu YC, Zhuang DX, Hou RP, Li JA, Xu GM, Song T, et al. Shotgun proteomic analysis of microdissected postmortem human pituitary using complementary two-dimensional liquid chromatography coupled with tandem mass spectrometer. Anal Chim Acta (2011) 688(2):183–90. doi: 10.1016/j.aca.2010.12.032
317. Zhan X, Wang X, Cheng T. Human pituitary adenoma proteomics: New progresses and perspectives. Front Endocrinol (Lausanne) (2016) 7:54. doi: 10.3389/fendo.2016.00054
318. Liu Y, Wu J, Yan G, Hou R, Zhuang D, Chen L, et al. Proteomic analysis of prolactinoma cells by immuno-laser capture microdissection combined with online two-dimensional nano-scale liquid chromatography/mass spectrometry. Proteome Sci (2010) 8:2. doi: 10.1186/1477-5956-8-2
319. Leonardi L AC, Beaudonnet G, Beauvais D, Cauquil C, Not A, Morassi O, et al. Skin amyloid deposits and nerve fiber loss as markers of neuropathy onset and progression in hereditary transthyretin amyloidosis. Eur J Neurol (2022) 29(5):1477–87. doi: 10.1111/ene.15268
320. Siddiqi OK, Ruberg FL. Cardiac amyloidosis: An update on pathophysiology, diagnosis, and treatment. Trends Cardiovasc Med (2018) 28(1):10–21. doi: 10.1016/j.tcm.2017.07.004
321. Sirohi D, Gandhi J, Amin MB, Luthringer DJ. Amyloidosis of the bladder and association with urothelial carcinoma: report of 29 cases. Hum Pathol (2019) 93:48–53. doi: 10.1016/j.humpath.2019.08.011
322. Thomas VE, Smith J, Benson MD, Dasgupta NR. Amyloidosis: diagnosis and new therapies for a misunderstood and misdiagnosed disease. Neurodegener Dis Man (2019) 9(6):289–99. doi: 10.2217/nmt-2019-0020
323. Benson MD, Buxbaum JN, Eisenberg DS, Merlini G, Saraiva MJM, Sekijima Y, et al. Amyloid nomenclature 2020: update and recommendations by the international society of amyloidosis (ISA) nomenclature committee. Amyloid (2020) 27(4):217–22. doi: 10.1080/13506129.2020.1835263
324. Martinez-Naharro A, Hawkins PN, Fontana M. Cardiac amyloidosis. Clin Med (2018) 18(Suppl 2):s30–s5. doi: 10.7861/clinmedicine.18-2-s30
325. Blank M, Hopf C. Spatially resolved mass spectrometry analysis of amyloid plaque-associated lipids. J Neurochem (2021) 159(2):330–42. doi: 10.1111/jnc.15216
326. Anderson TJ, Ewen SW. Amyloid in normal and pathological parathyroid glands. J Clin Pathol (1974) 27(8):656–63. doi: 10.1136/jcp.27.8.656
327. Colombat M, Barres B, Renaud C, Ribes D, Pericard S, Camus M, et al. Mass spectrometry-based proteomic analysis of parathyroid adenomas reveals PTH as a new human hormone-derived amyloid fibril protein. Amyloid (2021) 28(3):153–7. doi: 10.1080/13506129.2021.1885023
328. El Sayed SA, Fahmy MW, Schwartz J. Physiology, pituitary gland. StatPearls (2022) Treasure Island, Florida: StatPearls Publishing.
329. Kertesz V, Calligaris D, Feldman DR, Changelian A, Laws ER, Santagata S, et al. Profiling of adrenocorticotropic hormone and arginine vasopressin in human pituitary gland and tumor thin tissue sections using droplet-based liquid-microjunction surface-sampling-HPLC-ESI-MS-MS. Anal Bioanal Chem (2015) 407(20):5989–98. doi: 10.1007/s00216-015-8803-2
330. Cui Y, Li C, Jiang Z, Zhang S, Li Q, Liu X, et al. Single-cell transcriptome and genome analyses of pituitary neuroendocrine tumors. Neuro Oncol (2021) 23(11):1859–71. doi: 10.1093/neuonc/noab102
331. Boufraqech M, Nilubol N. Multi-omics signatures and translational potential to improve thyroid cancer patient outcome. Cancers (Basel) (2019) 11(12):1988. doi: 10.3390/cancers11121988
332. Zhan X, Long Y. Exploration of molecular network variations in different subtypes of human non-functional pituitary adenomas. Front Endocrinol (Lausanne) (2016) 7:13. doi: 10.3389/fendo.2016.00013
333. Taylor AJ, Dexter A, Bunch J. Exploring ion suppression in mass spectrometry imaging of a heterogeneous tissue. Anal Chem (2018) 90(9):5637–45. doi: 10.1021/acs.analchem.7b05005
334. Minakshi P, Ghosh M, Kumar R, Patki HS, Saini HM, Ranjan K, et al. Single-cell metabolomics: Technology and applications. Single-Cell Omics (2019) London, United Kingdom: Academic Press, 319–53. doi: 10.1016/B978-0-12-814919-5.00015-4
335. Seydel C. Single-cell metabolomics hits its stride. Nat Methods (2021) 18(12):1452–6. doi: 10.1038/s41592-021-01333-x
336. Kompauer M, Heiles S, Spengler B. Atmospheric pressure MALDI mass spectrometry imaging of tissues and cells at 1.4-mum lateral resolution. Nat Methods (2017) 14(1):90–6. doi: 10.1038/nmeth.4071
337. Zavalin A, Yang J, Haase A, Holle A, Caprioli R. Implementation of a Gaussian beam laser and aspheric optics for high spatial resolution MALDI imaging MS. J Am Soc Mass Spectrom (2014) 25(6):1079–82. doi: 10.1007/s13361-014-0872-5
338. Zavalin A, Yang J, Caprioli R. Laser beam filtration for high spatial resolution MALDI imaging mass spectrometry. J Am Soc Mass Spectrom (2013) 24(7):1153–6. doi: 10.1007/s13361-013-0638-5
339. Duenas ME, Essner JJ, Lee YJ. 3D MALDI mass spectrometry imaging of a single cell: Spatial mapping of lipids in the embryonic development of zebrafish. Sci Rep (2017) 7(1):14946. doi: 10.1038/s41598-017-14949-x
Keywords: endocrine tumors, liquid chromatography-mass spectrometry, mass spectrometry imaging, microextraction, multi-omics, spatially resolved microproteomics
Citation: Hou Y, Gao Y, Guo S, Zhang Z, Chen R and Zhang X (2023) Applications of spatially resolved omics in the field of endocrine tumors. Front. Endocrinol. 13:993081. doi: 10.3389/fendo.2022.993081
Received: 13 July 2022; Accepted: 15 December 2022;
Published: 10 January 2023.
Edited by:
Lisa M. Butler, University of Adelaide, AustraliaReviewed by:
Elizabeth Neumann, University of California, Davis, United StatesCopyright © 2023 Hou, Gao, Guo, Zhang, Chen and Zhang. This is an open-access article distributed under the terms of the Creative Commons Attribution License (CC BY). The use, distribution or reproduction in other forums is permitted, provided the original author(s) and the copyright owner(s) are credited and that the original publication in this journal is cited, in accordance with accepted academic practice. No use, distribution or reproduction is permitted which does not comply with these terms.
*Correspondence: Zhibin Zhang, WmhpYmluLXpoYW5nQG5hbmthaS5lZHUuY24=; Ruibing Chen, cmJjaGVuQHRqdS5lZHUuY24=; Xiangyang Zhang, eGlhbmd5YW5nLnpoYW5nQHRqdS5lZHUuY24=
Disclaimer: All claims expressed in this article are solely those of the authors and do not necessarily represent those of their affiliated organizations, or those of the publisher, the editors and the reviewers. Any product that may be evaluated in this article or claim that may be made by its manufacturer is not guaranteed or endorsed by the publisher.
Research integrity at Frontiers
Learn more about the work of our research integrity team to safeguard the quality of each article we publish.