
94% of researchers rate our articles as excellent or good
Learn more about the work of our research integrity team to safeguard the quality of each article we publish.
Find out more
ORIGINAL RESEARCH article
Front. Endocrinol., 25 August 2022
Sec. Diabetes: Molecular Mechanisms
Volume 13 - 2022 | https://doi.org/10.3389/fendo.2022.986616
This article is part of the Research TopicProgression to Diabetes: Molecular and Cellular MechanismsView all 10 articles
 Lynette J. Oost1Steef Kurstjens1,2Chao Ma1,3
 Joost G. J. Hoenderop1Cees J. Tack4
 Jeroen H. F. de Baaij1*†
Background: Type 2 diabetes (T2D) is characterized by a decreased insulin sensitivity. Magnesium (Mg2+) deficiency is common in people with T2D. However, the molecular consequences of low Mg2+ levels on insulin sensitivity and glucose handling have not been determined in adipocytes. The aim of this study is to determine the role of Mg2+ in the insulin-dependent glucose uptake.
Methods: First, the association of low plasma Mg2+ with markers of insulin resistance was assessed in a cohort of 395 people with T2D. Secondly, the molecular role of Mg2+ in insulin-dependent glucose uptake was studied by incubating 3T3-L1 adipocytes with 0 or 1 mmol/L Mg2+ for 24 hours followed by insulin stimulation. Radioactive-glucose labelling, enzymatic assays, immunocytochemistry and live microscopy imaging were used to analyze the insulin receptor phosphoinositide 3-kinases/Akt pathway. Energy metabolism was assessed by the Seahorse Extracellular Flux Analyzer.
Results: In people with T2D, plasma Mg2+ concentration was inversely associated with markers of insulin resistance; i.e., the lower Mg2+, the more insulin resistant. In Mg2+-deficient adipocytes, insulin-dependent glucose uptake was decreased by approximately 50% compared to control Mg2+condition. Insulin receptor phosphorylation Tyr1150/1151 and PIP3 mass were not decreased in Mg2+-deficient adipocytes. Live imaging microscopy of adipocytes transduced with an Akt sensor (FoxO1-Clover) demonstrated that FoxO1 translocation from the nucleus to the cytosol was reduced, indicting less Akt activation in Mg2+-deficient adipocytes. Immunocytochemistry using a Lectin membrane marker and at the membrane located Myc epitope-tagged glucose transporter 4 (GLUT4) demonstrated that GLUT4 translocation was diminished in insulin-stimulated Mg2+-deficient adipocytes compared to control conditions. Energy metabolism in Mg2+ deficient adipocytes was characterized by decreased glycolysis, upon insulin stimulation.
Conclusions: Mg2+ increases insulin-dependent glucose uptake in adipocytes and suggests that Mg2+ deficiency may contribute to insulin resistance in people with T2D.
T2D is a chronic condition that is characterized by insulin resistance and relative insulin deficiency (1), leading to microvascular and macrovascular complications (2–4). Insulin resistance enhances the hepatic glucose production and diminishes glucose uptake in insulin-sensitive cells, including adipose tissue, skeletal muscle and liver tissue (5). Reduced insulin action can be compensated by increased insulin secretion, but when insulin production capacity is jeopardized, chronic hyperglycemia will develop (6).
In healthy people, high glucose levels induce the secretion of insulin. Upon insulin binding autophosphorylation of the insulin receptor (IR) occurs and the phosphoinositide 3-kinases/Akt (PI3K/Akt) pathway is activated resulting in GLUT4-mediated glucose uptake in adipocytes and skeletal muscle cells (7–9). The insulin receptor substrates (IRS) active the PI3K enzyme, which converts phosphatidylinositol-2,4,5-triphosphate (PIP2) to phosphatidylinositol-3,4,5-triphosphate (PIP3) (10). Subsequently, PIP3 interacts with Akt to phosphorylate Akt substrate of 160 kDa (AS160) resulting in translocation of GLUT4 to the cell membrane (11). Insulin resistance decreases glucose uptake that may be attributed, at least partially, to defects in PI3K/Akt signaling and GLUT4 translocation (9, 12, 13).
The prevalence of hypomagnesemia (plasma/serum Mg2+< 0.7 mmol/L) in T2D is between 9.1–47.7%, which is tenfold higher compared to the healthy population (14–21). Hypomagnesemia may contribute to insulin resistance, as Mg2+ supplementation enhances insulin sensitivity and glucose profiles both in people with and without diabetes (22–25). Supplementation of Mg2+ increases IR and GLUT4 levels in rat skeletal muscle (26, 27). However, the mechanism of Mg2+ in the insulin-dependent glucose uptake has not been studied in adipocytes.
In this study we aimed to unravel the role of Mg2+ deficiency in insulin-dependent glucose uptake. We first studied the association of plasma Mg2+ with insulin resistance markers in people with T2D. Next, we assessed the molecular mechanism of Mg2+ on IR phosphorylation, PIP3 mass generation, Akt activation, GLUT4 translocation and energy homeostasis in mature 3T3-L1 adipocytes.
Details about the Diabetes Pearl Cohort have previously been reported (18). In short, 395 people with T2D were included and plasma samples were taken after an overnight fasting period and immediately analyzed for laboratory parameters (glycated hemoglobin (HbA1c), plasma glucose, creatinine, total cholesterol, triglycerides (Ty), high-density lipoprotein (HDL), low-density lipoprotein (LDL) and magnesium. Body mass index (BMI) was calculated as kilograms per body mass. Waist circumference was measured after normal exhalation in duplicate and repeated if the difference was >1.0 cm. For this study we used the Triglyceride Glucose-Body Mass Index (TyG-BMI), Triglyceride Glucose-Waist Circumference (TyG-WC) and Triglyceride HDL (Ty/HDL) ratio as surrogate markers for insulin resistance by using the following calculations: TyG-BMI=Ln [Ty (mg/dL) * plasma glucose (mg/dL)/2] * BMI, TyG-WC= Ln [Ty (mg/dL) * plasma glucose (mg/dL)/2] × WC (cm) and Ty/HDL ratio= Ty (mg/dL)/HDL (mg/dL) (28).
The 3T3-L1 fibroblasts (ATCC, CL-173) were cultured in Dulbecco’s modified Eagle’s medium (DMEM) (Lonza Westburg, Leusden, the Netherlands) supplemented with 4 mmol/L L-glutamine (GE healthcare Life Sciences, Logan, UT, USA), MEM Non-Essential Amino Acids (Lonza Westburg) and 10% (v/v) fetal bovine serum (FBS) (Greiner Bio One, Alphen aan den Rijn, the Netherlands), at 37°C in a humidified atmosphere of 5% (v/v) CO2 in air. Cells were induced two days post-confluence by adding 1 µg/ml bovine insulin (Sigma-Aldrich, St. Louis, MO, USA), 0.5 mmol/L 3-isobutyl-1-methylxanthine (IBMX) (Sigma-Aldrich), and 1 µM dexamethasone (Sigma-Aldrich) for 3 days. Cells were incubated for 4 days with cultured medium supplemented with 1 µg/ml bovine insulin only (refreshed after 2 days) to obtain fully differentiated adipocytes. Adipocytes were maintained another 48 hours in culture medium followed by a 24 hour incubation with either 1 or 0 mmol/L Mg2+ (Sigma-Aldrich) DMEM medium (containing 25 mmol/L D-glucose, 0.04 mmol/L Phenol Red, 1 mmol/L sodium pyruvate, 1.8 mmol/L CaCl2, 0.00025 mmol/L Fe(NO3)3, 17.9 mmol/L NaHCO3, 5.3 mmol/L KCl, 110.3 mmol/L NaCl, 0.9 mmol/L NaH2PO4, 0.4 mmol/L glycine, 0.4 mmol/L L-Arginine hydrochloride, 0.2 mmol/L L-Cystine 2HCl, 4 mmol/L L-Glutamine, 0.2 mmol/L L-Histidine hydrochloride, 0.8 mmol/L L-Isoleucine, 0.8 mmol/L L-Leucine, 0.8 mmol/L L-Lysine hydrochloride, 0.2 mmol/L L-Methionine, 0.4 mmol/L L-Phenylalanine, 0.4 mmol/L L-Serine, 0.8 mmol/L L-Threonine, 0.08 mmol/L L-Tryptophan, 0.4 mmol/L L-Tyrosine disodium salt dihydrate, 0.8 mmol/L L-Valine, MEM Vitamin Solution (Thermo Fisher Scientific, Waltham, MA USA) and 10% (v/v) FBS). Cells were cultured without FBS after 18 hours of incubation, 6 hours prior to the experiment.
To transduce 3T3-L1 adipocytes with FoxO1-Clover and Myc-GLUT4-mCherry DNA, lentiviruses were generated using HEK293-FT cells. HEK293-FT cells (kind gift from Translational Metabolic Laboratory, Radboud University Medical Center, bought at Thermo Fisher Scientific, R70007) were grown in DMEM (Lonza Westburg) supplemented with 6 mmol/L L-glutamine (GE healthcare Life Sciences), MEM Amino Acids (Lonza Westburg), 10% (v/v) FBS (Greiner Bio One), 1 mmol/L sodium pyruvate and 1% (v/v) penicillin/streptomycin (10,000 units/10 mg). Cells were maintained at 37°C in a humidified atmosphere of 5% (v/v) CO2 in air.
The 3T3-L1 fibroblasts were seeded on coated Poly-L-lysine (PLL) (Sigma-Aldrich) dishes and differentiated. Mature 3T3-L1 adipocytes were washed twice with warm Krebs–Ringer–phosphate–HEPES (KRPH) buffer (20 mmol/L HEPES, 5 mmol/L KH2PO4, 1 mmol/L CaCl2, 136 mmol/L NaCl, and 4.7 mmol/L KCl set at pH 7.4 with NaOH) containing either 1 or 0 mmol/L Mg2+. Cells were incubated without or with 10 nmol/L human insulin (Sigma-Aldrich) and 0 or 1 mmol/L Mg2+ for 0, 10, 20 or 30 minutes at 37°C in radioactive buffer containing 5 mmol/L 2-deoxyglucose (2DG) (Sigma-Aldrich) and 1 μCi 3H-2DG (PerkinElmer, Hoogvliet Rotterdam, the Netherlands). The incubation was stopped by washing with cold KRPH buffer and cells were lysed with 0.05% (w/v) SDS (MP Biomedicals) in dH2O. Cell lysates were added to Opti-Fluor O scintillation liquid (PerkinElmer) and counted using the Hidex 600 SL. Radioactive counts were corrected for the background count in each of the incubation buffers. The assay was repeated without the addition of 3H-2DG to correct for protein concentrations using the bicinchoninic acid (BCA) assay (Thermo Fisher Scientific) according to the manufacturer’s protocol.
3T3-L1 fibroblasts were seeded and differentiated in PLL coated 10 cm dishes or T-175 flasks. Mature adipocytes were stimulated with or without 10 nmol/L human insulin (Sigma-Aldrich) 30 minutes at 37°C. One confluent 10 cm dish per experimental condition was used for the Phospho-Insulin Receptor b (Tyr1150/1151) Sandwich ELISA (Cell Signaling Technology, Leiden, the Netherlands) and one confluent T-175 flask per experimental condition was used for the PIP3 Mass Elisa (Echelon Biosciences, Salt Lake City, UT, USA) were used according to the manufacturer’s protocol.
The pLenti-FoxO1-Clover (Addgene, Cambridge, MA, USA) and pLenti-Myc-GLUT4-mCherry (Addgene, Cambridge, MA, USA) plasmids were used as template. The packaging plasmids pLP1, pLP2 and pLP/VSVG were a kind gift from the Translational Metabolic Laboratory, Radboud University Medical Center. HEK293-FT cells were seeded at 70% confluence in Petri dishes coated with 20 μg/ml collagen (Thermo Fisher Scientific) per cm2. After cell attachment medium was switched to advanced DMEM (Thermo Fisher Scientific) supplemented with 6 mmol/L L-glutamine (GE healthcare Life Sciences), 2% (v/v) FBS (Greiner Bio One) and 10 μmol/L water-soluble cholesterol (Sigma-Aldrich). After 24 hours of incubation with cholesterol containing medium, HEK293-FT cells were transduced by incubating overnight in Opti-MEM I (Thermo Fisher Scientific) containing 3 μg lentiviral vector and packaging plasmids combined with a 1:3 DNA-reagent ratio Lipofectamine 2000 (Thermo Fisher Scientific) per 100 mm plate. The following morning medium was switched to cholesterol containing medium and incubated 48 hours at 37°C in a humidified atmosphere of 5% (v/v) CO2 in air. Lentivirus was harvested by collecting the medium supernatant, followed by centrifugation 5 minutes, 2000 xg at 4°C. The supernatant was filtered using sterile low protein binding 0.45 μm filters (Sigma-Aldrich) and concentrated using Lenti-X Concentrator (Takara Bio, Saint-Germain-en-Laye, France), according to the manufacturer’s protocol. Viral titer was determined using Lenti-X GoStix Plus (Takara Bio), according to the manufacturer’s protocol.
Viral supernatants containing FoxO1-Clover or Myc-GLUT4-mCherry were added to fresh medium supplemented with 8 μg/ml Polybrene (Sigma-Aldrich). Mature 3T3-L1 adipocytes were incubated with approximately 40 ng p24 particles per 96 well or 120 ng p24 particles per 24 well and incubated overnight. The next day, the medium was replaced with fresh medium. Microscopy experiments were performed 4 to 6 days post transduction.
3T3-L1 fibroblasts were differentiated on fibronectin (Roche Applied Science, Almere, the Netherlands) coated 96 well plates and differentiated. Mature adipocytes were transduced with Lentivirus particles containing FoxO1-Clover. FoxO1 is a direct and specific target of Akt; FoxO1 rapidly translocate from the nucleus to the cytoplasm in response to Akt activation (29). The transduction was followed by a 24 hour incubation with 0 or 1 mmol/L Mg2+ of which the last 6 hours adipocytes where incubated without FBS. Medium was replaced 30 minutes prior to starting live imaging; containing 0 or 1 mmol/L Mg2+, FBS free, phenol-free, supplemented with 1 μg/ml Hoechst 33342 (Sigma-Aldrich). Live imaging was performed using a ZEISS Axio Observer light microscope. Adipocytes were imaged for 30 minutes with a photo interval per 30 seconds. The cells were stimulated using a final concentration of 10 nM human insulin (Sigma-Aldrich) which was added between 30-60 seconds after the start of visualization. The relative intensity of fluorescent units in the cytosol/nucleus was analyzed by the following formula:
All values are normalized by dividing by the first measurement (t=0). Data was fitted using the four-parameter sigmoid dose-response curve. The maximum top value of this function was used as the fluorescent unit’s cytosol/nucleus ratio.
3T3-L1 fibroblasts were seeded on fibronectin (Sigma-Aldrich) coated glass coverslips in 6 well plates. After 24 hours of 0 or 1 mmol/L Mg2+ incubation, adipocytes were stimulated with or without 10 nM human insulin (Sigma-Aldrich) 30 minutes at 37°C and subsequently cooled on ice. Subsequently, adipocytes were rinsed in PBS and incubated 10 minutes with 5 ug/ml Lectin Alexa 680 (Thermo Fisher Scientific) in DMEM supplemented with 30 mmol/L HEPES (Sigma-Aldrich), rinsed with PBS and fixated with 4% (w/v) PFA methanol-free formaldehyde solution (Thermo Fisher Scientific). The fixation solution was removed by rinsing with PBS. Adipocytes were permeabilized in 0.3% (v/v) Triton X-100 (Sigma-Aldrich) with 0.1% (w/v) BSA (Sigma-Aldrich) in PBS for 10 minutes. Quenching was done by 50 mmol/L NH4Cl in PBS for 10 minutes and followed by washing with PBS. Adipocytes were incubated in 16% (v/v) goat serum (Vector Laboratories, Amsterdam, the Netherlands) with 0.3% (v/v) Triton X-100 (Sigma-Aldrich) for 30 minutes and, subsequently, incubated with primary 1:200 GLUT4 (Santa Cruz Biotechnology, Heidelberg Germany) overnight at 4°C. The following day, cells were rinsed with PBS and incubated with 1:300 secondary Goat anti-Mouse IgG Alexa 488 (Thermo Fisher Scientific) in 16% (v/v) goat serum with 0.3% (v/v) Triton X-100 for 1 hour at room temperature, followed by PBS washing. Nuclei were stained using 0.1 ug/ml DAPI (Thermo Fisher Scientific) for 10 minutes at room temperature, followed by PBS washing and mounting using Fluoromount-G (SouthernBiotech, Birmingham, AL, USA). Fluorescence confocal microscopy was performed with a Zeiss LSM880 and images were taken with the Zeiss Zen software. Co-localization of GLUT4 and Lectin was quantified using ImageJ (JACop) software with the Mander's coefficient.
Differentiated 3T3-L1 were seeded on fibronectin (Roche Applied Science) coated glass coverslips in 24 well plates. Adipocytes were transduced with Lentivirus particles containing Myc-GLUT4-mCherry. After 24 hours of 0 or 1 mmol/L Mg2+ incubation, adipocytes were stimulated with or without 10 nmol/L human insulin (Sigma-Aldrich) 30 minutes at 37°C and subsequently cooled on ice. The adipocytes were fixated with 4% (w/v) PFA methanol-free formaldehyde solution (Thermo Fisher Scientific). Quenching was done by 50 mmol/L NH4Cl in PBS for 10 minutes, followed by washing with PBS. Adipocytes were incubated in 16% (v/v) goat serum (Vector Laboratories) with 0.3% (v/v) Triton X-100 (Sigma-Aldrich) for 30 minutes and, subsequently incubated with 1:200 c-Myc Antibody (Santa Cruz Biotechnology). The following day adipocytes were incubated with 1:500 secondary antibody Goat anti-Mouse IgG Alexa 488 (Thermo Fisher Scientific) in 16% (v/v) goat serum with 0.3% (v/v) Triton X-100 for 1 hour at room temperature. Nuclei were stained using 0.1 ug/ml DAPI (Thermo Fisher Scientific) for 10 minutes at room temperature, followed by PBS washing and mounting using Flouromount-G (SouthernBiotech). Fluorescence confocal microscopy was performed with a Zeiss LSM880 and images were taken with the Zeiss Zen software. Co-localization of Myc and GLUT4-mCherry was quantified using ImageJ (JACop) software with the Mander's coefficient.
3T3-L1 fibroblasts were differentiated in fibronectin coated XF96 Cell Culture Seahorse plates (Agilent Technologies, Amstelveen, the Netherlands). The sensor cartridge was hydrated 24 hours in XF Calibrant at 37°C in a non-CO2 incubator overnight. The culture medium was replaced 1 hour before the Seahorse run with 0 or 1 mmol/L Mg2+ DMEM (recipe described in section Cell Culture), containing no glucose or pyruvate sources and 5 mmol/L HEPES. The XF96 cell plate was incubated at 37°C in a non-CO2 environment for 1 hour before starting the glycolytic stress test. During the run, cells were sequentially treated with or without 10 nmol/L human insulin (Sigma-Aldrich), 10 mmol/L D-glucose, 1 μM oligomycin (Sigma-Aldrich) and 50 mmol/L 2DG (Sigma-Aldrich). Protein concentration was measured using the U/CSF protein kit (Thermo Fischer Scientific). Adhered cells were stored at -80°C until measurement in 0.33% (v/v) Triton X-100 dissolved in 10 mmol/L Tris-HCl (pH 7.6). On the day of measurement, U/CSF protein quantification solution was added to the well. After 10 minutes of incubation at 37°C, absorbance was measured at 600 nm. Protein concentrations in wells containing samples were obtained using the concentration calculated from the sCal (Thermo Fischer Scientific) calibration curve included in each plate. All data was normalized for the amount of protein in each well. The non-glycolytic acidification rate was calculated by: the average of the last rate measurement prior to insulin injection. Glycolysis was calculated by: (maximum rate measurement before oligomycin injection) – (last rate measurement before glucose injection). The glycolytic capacity was calculated by: (maximum rate measurement after oligomycin injection) – (last rate measurement before glucose injection).
All in vitro data are presented as mean ± SEM. Statistical significance was evaluated using Two‐Way Analysis of Variance (ANOVA) or by a Student’s T-Test when comparing only two groups. Pearson correlations were performed using SPSS for Windows (V25.0.0.1 IBM) to determine the association between plasma Mg2+ concentration and fasting glucose and the insulin resistance markers: TyG-BMI, TyG-WC and Ty/HDL. Normal distribution of data was verified by calculating the quotient of the skewness divided by its standard error. Variables that were not normally distributed were log transformed. Statistical significance set at *P<0.05; **P<0.01; and ***P<0.001.
Previously, we demonstrated that plasma triglycerides and fasting glucose levels are major determinants of the plasma Mg2+ concentration (18). The negative association of plasma Mg2+ concentration with fasting glucose levels is visualized in Figure 1A. Figures 1B–D shows the negative association of plasma Mg2+ and markers of insulin resistance, confirming the association between low Mg2+ levels and insulin resistance in people with T2D.
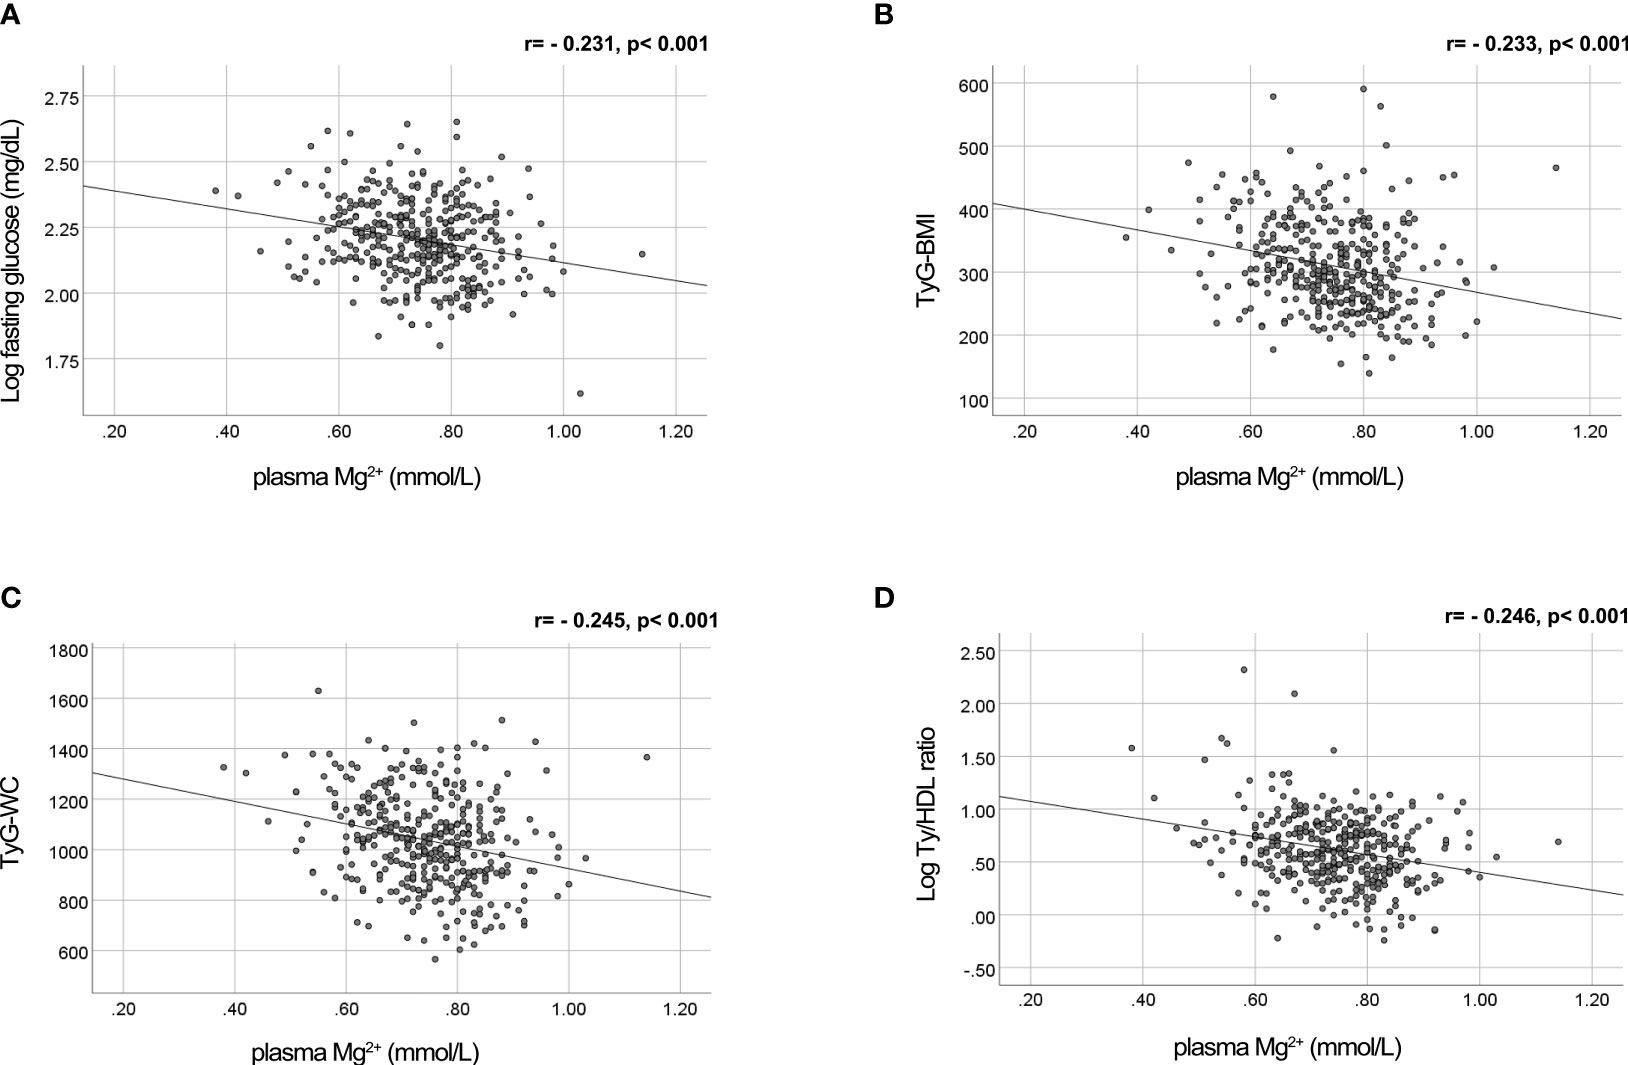
Figure 1 Mg2+ is negatively correlated with fasting glucose levels and insulin resistance markers TyG-WC, TyG-BMI and Ty/HDL ratio in people with T2D. Plasma Mg2+ concentration scatter plotted versus (A) Log fasting glucose (n=382); (B) TyG-BMI (n=379); (C) TyG-WC (n=376); and (D) Log Ty/HDL ratio (n=384) in people with T2D. Statistically analyzed using Pearson correlation. Mg2+, magnesium; T2D, type 2 diabetes; TyG-BMI, Triglyceride Glucose-Body Mass Index; TyG-WC, Triglyceride Glucose-Waist Circumference; Ty/HDL, Triglyceride High Density Lipoprotein.
To determine the potential causative relationship between Mg2+ and insulin resistance, the effects of Mg2+ on insulin sensitivity and glucose handling were further examined in vitro. Radioactive 3H-2DG uptake was measured in mature 3T3-L1 adipocytes that were Mg2+-deficient (0 mmol/L Mg2+) or incubated with its physiological concentration (1 mmol/L Mg2+). In Mg2+-deficient adipocytes, insulin-stimulated glucose uptake was decreased by 50% at 20 and 30 minutes compared to adipocytes with a physiological Mg2+ concentration (P< 0.001) (Figure 2).
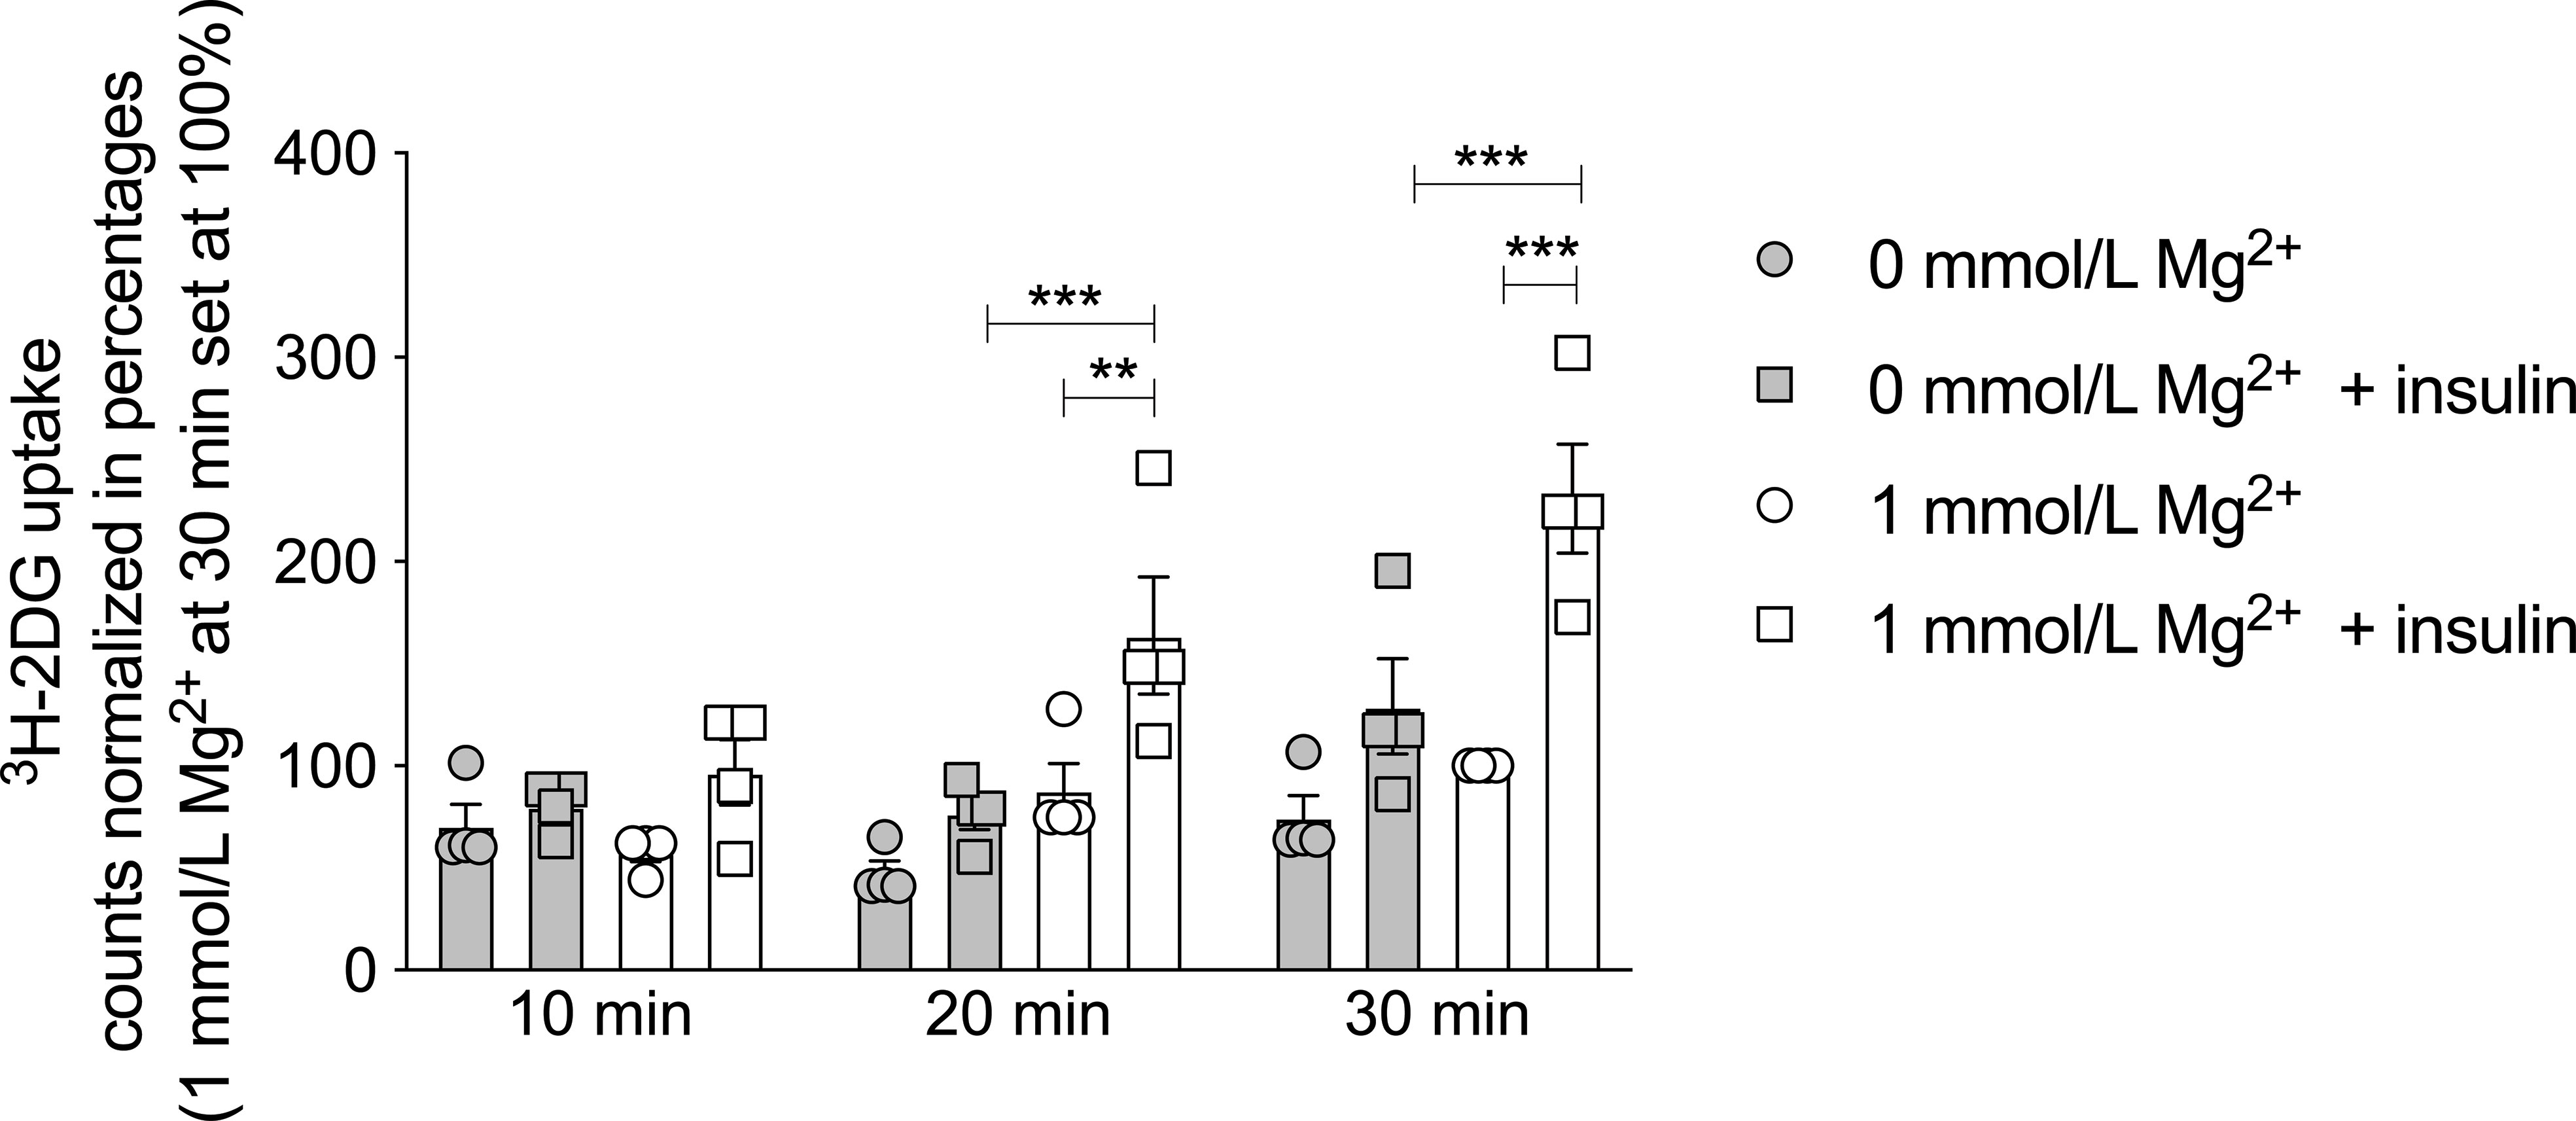
Figure 2 Effect of Mg2+ on insulin-dependent glucose uptake in 3T3-L1 adipocytes. 3H-2DG uptake for 10, 20 or 30 minutes in 3T3-L1 adipocytes that were incubated with 0 or 1 mmol/L Mg2+ for 24 hours (n=4). Legend: circle is without insulin, square is with insulin, grey color is 0 mmol/L Mg2+ and white color is 1 mmol/L Mg2+. Data are shown as mean ± S.E.M. Statistically analyzed with Two-Way ANOVA. Significance **p<0.01; ***p< 0.001. 2DG = 2-deoxyglucose, Mg2+, magnesium; min, minutes.
Insulin-dependent glucose uptake is mainly mediated by GLUT4 in adipocytes (9, 30). GLUT4 expression at the plasma membrane was increased in insulin-stimulated adipocytes with physiological Mg2+ compared to insulin-stimulated Mg2+-deficient adipocytes (Figures 3A, B). The GLUT4 co-localization with membrane marker Lectin was increased twofold in insulin-stimulated adipocytes incubated with physiological Mg2+ compared to Mg2+-deficient adipocytes (P< 0.05). The effect of insulin on the translocation of endogenous GLUT4 was almost completely abolished in Mg2+-deficient adipocytes (Figure 3C). In adipocytes that overexpressed Myc-GLUT4-mCherry and were stimulated with insulin, there was less GLUT4 translocation to the plasma membrane in Mg2+-deficient adipocytes compared to controls (P< 0.001), but was not completely abolished (Figure 3D). The GLUT4 translocation to the plasma membrane was increased by threefold in insulin-stimulated Mg2+-deficient adipocytes and increased by fourfold in insulin-stimulated controls, compared to non-insulin stimulated adipocytes (Figure 3D).

Figure 3 Effect of Mg2+ on insulin-dependent localization of the GLUT4 transporter to the cell membrane in 3T3-L1 adipocytes. (A) Immunocytochemistry staining of DAPI, GLUT4 and the cell membrane marker Lectin in insulin-stimulated 3T3-L1 adipocytes that are incubated with 0 or 1 mmol/L Mg2+ (n=4). GLUT4 signal was assessed at the plasma membrane, since GLUT4 antibody did result in non-specific nuclear staining. (B) Immunocytochemistry staining of DAPI, anti-myc and GLUT4-mCherry in insulin-stimulated 3T3-L1 adipocytes that were transduced with pLenti-Myc-GLUT4-mCherry, incubated 0 or 1 mmol/L Mg2+ (n=3). (C) Quantification of the immunocytochemistry staining by co-localization GLUT4 and Lectin at the plasma membrane compared to total cytosol expression (n=4). (D) Quantification of the ratio of cell surface Myc signal to total mCherry signal in 3T3-L1 adipocytes transduced with pLenti-myc-GLUT4-mCherry (n=3). Legend: circle is without insulin, square is with insulin, grey color is 0 mmol/L Mg2+ and white color is 1 mmol/L Mg2+. Data are shown as mean ± S.E.M. Statistically analyzed with Two-Way ANOVA. Significance *p<0.05; ***p< 0.001. GLUT4, glucose transporter 4; Mg2+, magnesium.
Phosphorylation of IR tyrosine residues is the first essential requirement for insulin signaling, with phosphorylation of Tyr1150/Tyr1151 predominant for activation in vivo (31, 32). Insulin increased Tyr1150/1151 autophosphorylation in adipocytes (P< 0.001), though this increase was similar in adipocytes with a physiological Mg2+ concentration compared to Mg2+-deficient adipocytes (Figure 4A). Mg2+ per se had no effect on Tyr1150/1151 autophosphorylation, with and without insulin stimulation. The positive control, DMAQ-B1, a selective stimulator of IR tyrosine kinase phosphorylation, resulted in specific response by increasing Tyr1150/1151 phosphorylation almost threefold compared to the physiological condition (1 mmol/L Mg2+ without insulin stimulation) (P< 0.01) (33).
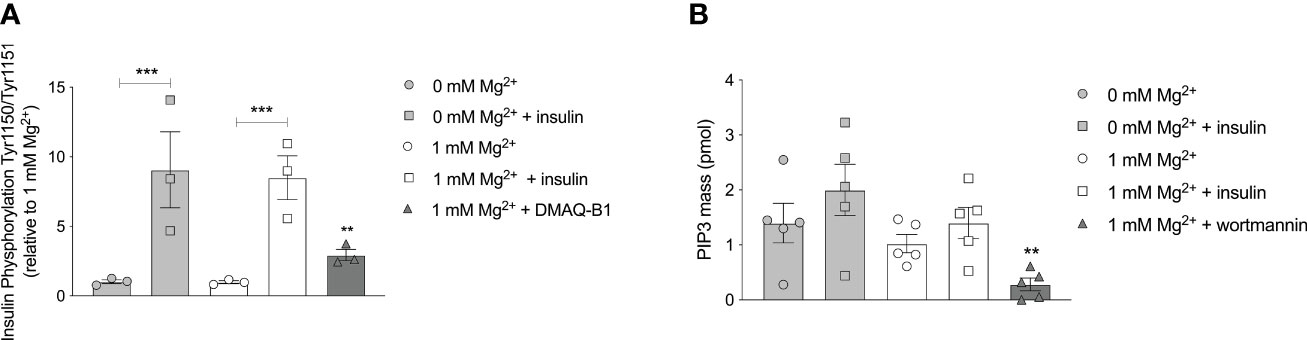
Figure 4 Effect of Mg2+ on the auto phosphorylation of the IR at residue Tyr1150/1151 and PI3K kinase regulatory subunits that phosphorylate PIP2 to PIP3. (A) The phosphorylation of Tyr 1150/115 in 3T3-L1 adipocytes incubated with 0 or 1 mmol/L Mg2+. DMAQ-B1 is used as positive control to mimic IR phosphorylation (n=3). (B) PIP3 mass in 3T3-L1 adipocytes incubated with 1 or 0 mmol/L Mg2+. Wortmannin is used as positive control to inhibit PI3K enzyme activity (n=5). Legend: circle is without insulin, square is with insulin, grey color is 0 mmol/L Mg2+, white color is 1 mmol/L Mg2+ and rectangles are positive controls. Data are shown as mean ± S.E.M. Statistically analyzed with Two-Way ANOVA. Positive controls are analyzed with Student t-test, compared to 1 mmol/L Mg2+ condition. **p<0.01; ***p< 0.001. Mg2+, magnesium; PIP3, phosphatidylinositol-3,4,5-trisphosphate; DMAQ-B1, demethylasterriquinone B1.
Cell lipid extractions for enzymatic assays were performed to measure PIP3 mass of 3T3-L1 adipocytes incubated with a physiological Mg2+ concentration versus Mg2+-deficient. Mg2+ did not increase PIP3 mass generation. PIP3 mass was not increased in insulin-stimulated adipocyte conditions, with and without Mg2+. The positive control, the PI3K enzyme inhibitor wortmannin, decreased PIP3 mass by approximately 80% compared to the physiological condition (1 mmol/L Mg2+ without insulin stimulation) (P< 0.05) (Figure 4B).
Adipocytes were overexpressed with the Akt sensor (FoxO1-Clover) and stimulated with insulin. The translocation of FoxO1 from the nucleus to the cytosol was diminished in the Mg2+-deficient adipocytes compared to adipocytes incubated with a physiological Mg2+ concentration (P< 0.01) (Figure 5).
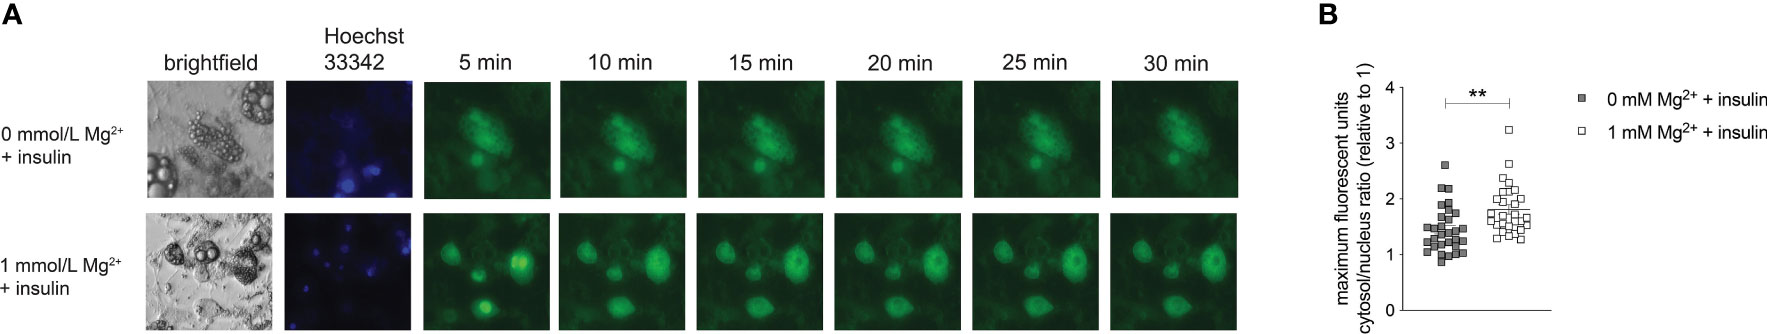
Figure 5 Effect of Mg2+ on insulin-dependent Akt activation. Live imaging of insulin-stimulated 3T3-L1 adipocytes transduced with pLenti-FoxO1-Clover and incubated with 0 or 1 mmol/L Mg2+. (A) Live images showing Brightfield, Hoechst 33342 and Clover signal in 3T3T-L1 adipocytes stimulated with insulin. (B) Quantified maximal mean intensity ratio of the cytosol in 3T3-L1 adipocytes stimulated with insulin (n=5, 3–10 cells analyzed per biological replicate). Statistically analyzed with Student’s T-Test. grey color is 0 mmol/L Mg2+ and white color is 1 mmol/L Mg2+. Mg2+, magnesium; min, minutes. **p<0.01.
The effect of Mg2+ on the intracellular energy metabolism was assessed using the Seahorse XF Glycolytic Stress Test. The glycolytic stress test curve demonstrated that the glycolysis is increased in insulin-stimulated adipocytes with a physiological level of Mg2+ compared to Mg2+-deficient adipocytes (Figure 6A). Oxygen consumption rate (OCR) was measured simultaneously and Mg2+ nor insulin-stimulation did not alter OCR rate (data not shown). The basal non-glycolytic acidification was higher in Mg2+-deficient adipocytes compared to adipocytes incubated with physiological Mg2+ concentration (P< 0.05) (Figure 6B), which suggests that increased glycolysis may have compensated for basal energy homeostasis. The glycolysis was enhanced in insulin-stimulated adipocytes compared to insulin-stimulated Mg2+-deficient adipocytes (P< 0.05) (Figure 6C). The glycolytic capacity (Figure 6D) remained the same in adipocytes incubated with and without Mg2+, with and without insulin stimulation.
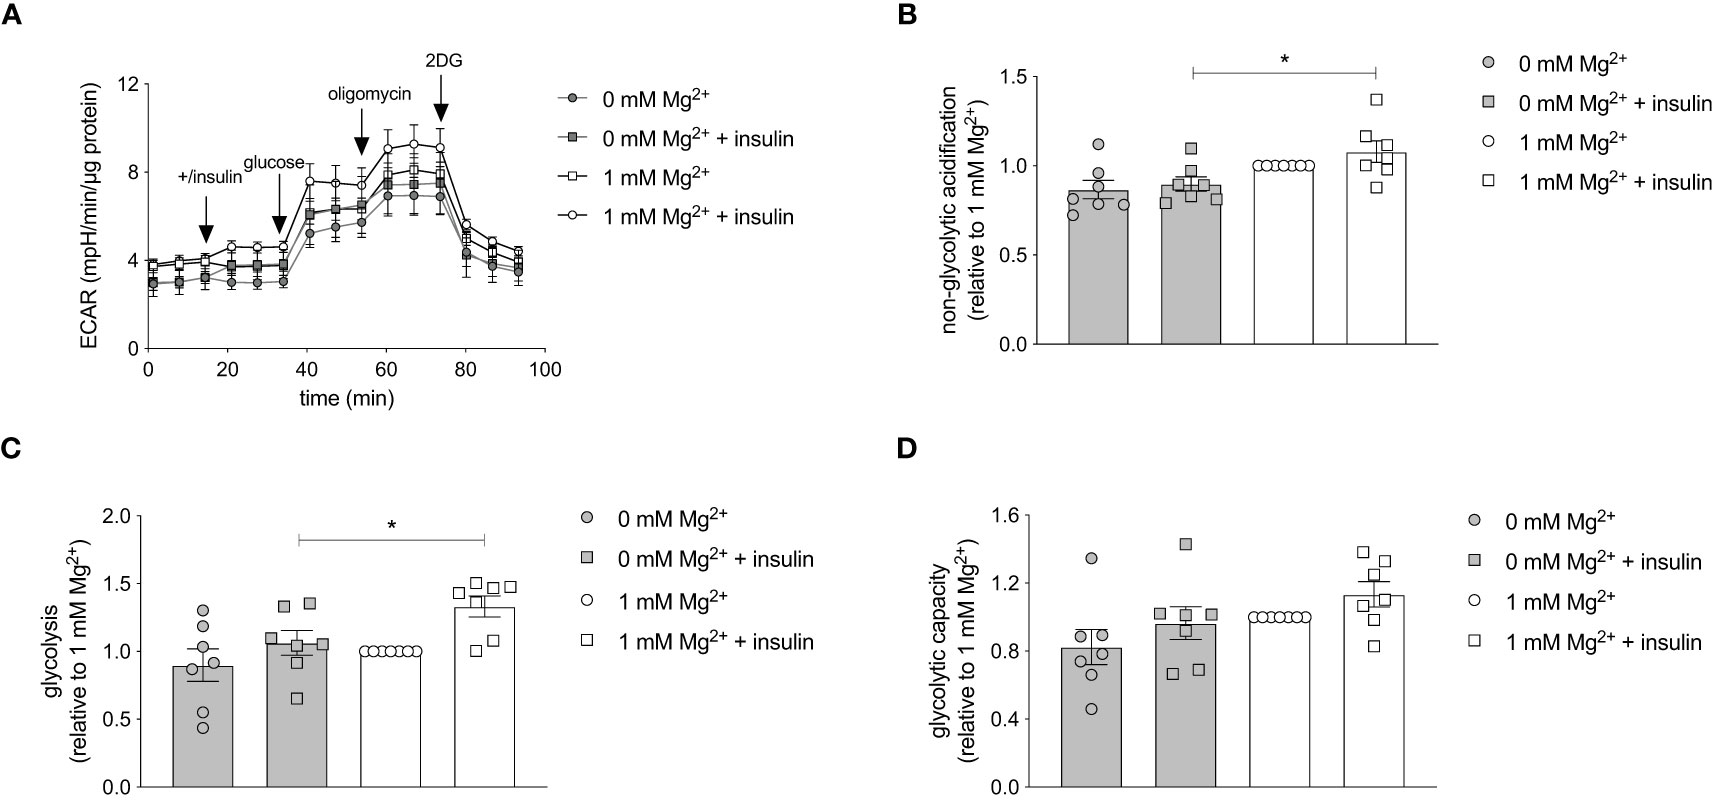
Figure 6 Effect of Mg2+ on insulin-stimulated glycolytic respiration rate in 3T3-L1 adipocytes. Glycolytic Stress Test in insulin-stimulated 3T3-L1 adipocytes incubated with 0 or 1 mmol/L Mg2+. (A) Representative raw Glycolytic Stress Test curve in 3T3-L1 adipocytes. Quantification of the (B) non-glycolytic acidification, (C) glycolysis and (D) glycolytic capacity in 3T3-L1 adipocytes (n=7). All data adjusted for protein. Legend: circle is without insulin, square is with insulin, grey color is 0 mmol/L Mg2+ and white color is 1 mmol/L Mg2+. Data are shown as mean ± S.E.M. Statistically analyzed with Two-Way ANOVA. *p<0.05. 2DG, 2-deoxyglucose; ECAR, extracellular acidification rate; Mg2+, magnesium; min, minutes.
The study demonstrated that Mg2+ plays an important role in insulin-dependent glucose uptake by increasing Akt activation and GLUT4 translocation to the plasma membrane. This may provide a mechanism by which a low Mg2+ may result in insulin resistance and explain the inverse association between, plasma Mg2+ concentration and insulin resistance in people with T2D.
Our results demonstrate that Mg2+ acts downstream of the IR and PI3K by activating Akt and/or GLUT4. Previous studies that investigated the effect of HIV1-protease inhibitors on insulin resistance are in agreement with our findings and demonstrated only signaling effects that are downstream of PI3K, in 3T3-L1 adipocytes and skeletal muscle (34–36). In non-insulin-stimulated macrophages and osteoblasts, Mg2+ activated Akt for anti-inflammatory properties and growth signaling (37, 38). All together, these findings suggest that insulin-dependent glucose uptake can be improved without affecting IR phosphorylation but can be driven by Akt activation and GLUT4 translocation. The functionality of Akt and GLUT4 have shown to be essential for preventing insulin resistance (39–41).
Animal studies that assessed the role of Mg2+ on PI3K/Akt signaling are limited and show inconsistent results. For instance, rats that are fed with a low Mg2+ diet showed diminished IR phosphorylation in skeletal muscle after only 4 days (42). While Reis et al. showed no differences on IR phosphorylation in skeletal muscle after a longer period of 11 weeks (43). Supplementation of Mg2+ in T2D rats did increase IR and GLUT4 expression levels in skeletal muscle (26, 27). However, these studies did not examine the intermediate PI3K/Akt signal transduction thoroughly in the skeletal muscle, thereby failed to show on which key proteins Mg2+ exerts in the skeletal muscle. We suggest that Mg2+ has a selective regulation of Akt-dependent processes that is cell-specific and differ in adipocytes compared to skeletal muscle (5).
The exact metabolic exertion of Mg2+ remains to be elucidated, but it is suggested that Mg2+ and ATP act together in the IR-PI3K-Akt pathway as a kinase substrate (44). Mg-ATP serves as substrate in the phosphoryl transfer reaction in the phosphorylation of proteins (45, 46). Additionally, Mg2+ may induce an electrostatic interaction, which enhances the binding affinity and stability of ATP to protein kinases (47). It has been established that Rab GTPases also have Mg2+-binding motifs (48), which may stimulate AS160 phosphorylation and GLUT4 translation.
The impaired glucose uptake caused by low intracellular Mg2+ affects the metabolism of the adipocyte. It has been well established that Mg-ATP acts as a co-factor for many key enzymes involved in glycolysis (49–51). In our study, glycolysis was decreased in Mg2+-deficient adipocytes compared to adipocytes incubated with a physiological Mg2+ concentration. In adipocytes, insulin stimulates the insulin-dependent glucose uptake and hexokinase and 6-phosphofructokinase activity, which both enhance glycolysis (52). The enhanced glycolysis could be related to increased activity of glycolytic enzymes (49), or can be a consequence of the increased insulin-dependent glucose uptake. We therefore suggest that the increased glycolysis, which may be a consequence of insulin-dependent glucose uptake, requires Mg2+ as a co-factor.
To date, Mg2+ studies have focused primarily on studying the insulin-dependent glucose uptake in skeletal muscles (26, 27, 42, 43). In contrast, we used mature 3T3-L1 adipocytes. The severity of insulin resistance in adipose tissue may even proceed skeletal muscle (53, 54), emphasizing the importance of identifying insulin sensitive mechanisms in adipose tissue. To our knowledge, there is one previous study demonstrating that Mg2+ deficiency reduced insulin-dependent glucose metabolism in isolated rat adipocytes, but this study did not assess the IR-PI3K-Akt pathway (55).
Our results suggest that Mg2+ deficiency in adipocytes exaggerates insulin resistance in people with T2D. Screening for hypomagnesemia and providing Mg2+ supplementation may improve insulin sensitivity, which prevents the development of T2D (23, 56).
A strength of our study is that we examined a large part of the IR-PI3K-Akt pathway. On the other hand, a limitation of our approach is that only two concentrations of Mg2+ was used in our study, namely a cell physiological concentration (1 mmol/L Mg2+) and Mg2+-deficient (0 mmol/L Mg2+). Additionally, the intracellular Mg2+ concentration and other electrolytes were not measured, limiting conclusions on the direct metabolic effect of Mg2+. It should be noted that a short-term (24 hours) incubation with 0 mmol/L Mg2+ was selected to cause a significant reduction of the intracellular Mg2+ concentration. Experiments in HEK293 cells have demonstrated that intracellular Mg2+ levels are generally decreased within a few hours (57). Furthermore, a reduction of intracellular Mg2+ is observed when incubating myocytes (58), Madin-Darby Canine Kidney (MDKC) (59), mouse distal convoluted tubule (60), or breast cancer MDA-MB-231 cells (57) for 16-24 hours with 0 mmol/L Mg2+ (61). As such, our approach could be representative for the chronic low cytosolic free intracellular Mg2+ levels in people with T2D and hypomagnesemia.
In summary, Mg2+ acts on Akt and GLUT4 to improve insulin signaling and glucose uptake in adipocytes; thereby controlling extracellular glucose levels. The increased availability of glucose is translated into an increased glycolysis in adipocytes. The defects in Akt and GLUT4 signaling by Mg2+ deficiency could be the fundamental reason for the negative association of hypomagnesemia and insulin resistance in people with T2D.
The original contributions presented in the study are included in the article/supplementary material. Further inquiries can be directed to the corresponding author.
The studies involving human participants were reviewed and approved by the Ethics committee of the Radboud University Medical Center. The patients/participants provided their written informed consent to participate in this study.
LO and SK performed together the radioactive glucose uptake experiments. LO performed all the other experiments described in the manuscript. SK and CM did preliminary analysis that were essential for the set-up of this study. LO and JB wrote the manuscript. JH, CT, and JB supervised the study. All authors reviewed and approved the final version of the manuscript. JB is the guarantor of this work and had full access to all the data in the study and takes responsibility for the integrity of the data.
This research was funded by the Dutch Diabetes Research Foundation (2017–81–014).
The authors declare that the research was conducted in the absence of any commercial or financial relationships that could be construed as a potential conflict of interest.
All claims expressed in this article are solely those of the authors and do not necessarily represent those of their affiliated organizations, or those of the publisher, the editors and the reviewers. Any product that may be evaluated in this article, or claim that may be made by its manufacturer, is not guaranteed or endorsed by the publisher.
1. Smushkin G, Vella A. What is type 2 diabetes? Med (Baltimore) (2010) 38:597–601. doi: 10.1016/j.mpmed.2010.08.008
2. Ormazabal V, Nair S, Elfeky O, Aguayo C, Salomon C, Zuñiga FA. Association between insulin resistance and the development of cardiovascular disease. Cardiovasc Diabetol (2018) 17:1–14. doi: 10.1186/s12933-018-0762-4
3. Meigs JB, Rutter MK, Sullivan LM, Fox CS, D’Agostino RB, Wilson PWF. Impact of insulin resistance on risk of type 2 diabetes and cardiovascular. Diabetes Care (2007) 30:1219–25. doi: 10.2337/dc06-2484
4. Duckworth WC. Hyperglycemia and cardiovascular disease. Curr Atheroscler Rep (2001) 3:383–91. doi: 10.1007/s11883-001-0076-x
5. Fazakerley DJ, Krycer JR, Kearney AL, Hocking SL, James DE. Muscle and adipose tissue insulin resistance: malady without mechanism? J Lipid Res (2019) 60:1720–32. doi: 10.1194/jlr.R087510
6. American Diabetes Association. Diagnosis and classification of diabetes mellitus. Diabetes Care (2008) 31:S62–7. doi: 10.2337/dc14-S081
7. Minokoshi Y, Kahn CR, Kahn BB. Tissue-specific ablation of the GLUT4 glucose transporter or the insulin receptor challenges assumptions about insulin action and glucose homeostasis. J Biol Chem (2003) 278:33609–12. doi: 10.1074/jbc.R300019200
8. Huang S, Czech MP. The GLUT4 glucose transporter. Cell Metab (2007) 5:237–52. doi: 10.1016/j.cmet.2007.03.006
9. Govers R. Molecular mechanisms of GLUT4 regulation in adipocytes. Diabetes Metab (2014) 40:400–10. doi: 10.1016/j.diabet.2014.01.005
10. Okada T, Kawano Y, Sakakibara T, Hazeki O, Ui M. Essential role of phosphatidylinositol 3-kinase in insulin-induced glucose transport and antilipolysis in rat adipocytes. Stud Selective Inhibitor Wortmannin J Biol Chem (1994) 269:3568–73. doi: 10.1016/S0021-9258(17)41901-6
11. Tan S-X, Ng Y, Burchfield JG, Ramm G, Lambright DG, Stöckli J, et al. The rab GTPase-activating protein TBC1D4/AS160 contains an atypical phosphotyrosine-binding domain that interacts with plasma membrane phospholipids to facilitate GLUT4 trafficking in adipocytes. Mol Cell Biol (2012) 32:4946–59. doi: 10.1128/MCB.00761-12
12. Deshmukh AS. Insulin-stimulated glucose uptake in healthy and insulin-resistant skeletal muscle. Horm Mol Biol Clin Investig (2016) 26:13–24. doi: 10.1515/hmbci-2015-0041
13. Hotamisligil G k. S, Peraldi P, Budavari A, Ellis R, White MF, Spiegelman BM. IRS-1-Mediated inhibition of insulin receptor tyrosine kinase activity in TNF-alpha- and obesity-induced insulin resistance. Sci (80 ) (1996) 271:665–70. doi: 10.1126/science.271.5249.665
14. Haque WMM, Khan A, Nazimuddin K, Musa A, Ahmed AS, Sarker RSC. Frequency of hypomagnesemia in hospitalized diabetic hypokalemic patients. J Bangladesh Coll Physicians Surg (1970) 26:10–3. doi: 10.3329/jbcps.v26i1.4227
15. Simmons D, Joshi S, Shaw J. Hypomagnesaemia is associated with diabetes: Not pre-diabetes, obesity or the metabolic syndrome. Diabetes Res Clin Pract (2010) 87:261–6. doi: 10.1016/J.DIABRES.2009.11.003
16. Oost LJ, van der Heijden AAWA, Vermeulen EA, Bos C, Elders PJM, Slieker RC, et al. Serum magnesium is inversely associated with heart failure, atrial fibrillation, and microvascular complications in type 2 diabetes. Diabetes Care (2021) 44:1757–65. doi: 10.2337/dc21-0236
17. Waanders F, Dullaart RPF, Vos MJ, Hendriks SH, van Goor H, Bilo HJG, et al. Hypomagnesaemia and its determinants in a contemporary primary care cohort of persons with type 2 diabetes. Endocrine (2020) 67:80–6. doi: 10.1007/s12020-019-02116-3
18. Kurstjens S, de Baaij JHF, Bouras H, Bindels RJM, Tack CJJ, Hoenderop JGJ. Determinants of hypomagnesemia in patients with type 2 diabetes mellitus. Eur J Endocrinol (2017) 176:11–9. doi: 10.1530/EJE-16-0517
19. De Lima ML, Cruz T, Pousada JC, Rodrigues LE, Barbosa K, Canguçu V. The effect of magnesium supplementation in increasing doses on the control of type 2 diabetes. Diabetes Care (1998) 21:682–6. doi: 10.2337/diacare.21.5.682
20. Tosiello L. Hypomagnesemia and diabetes mellitus: A review of clinical implications. Arch Intern Med (1996) 156:1143–8. doi: 10.1001/archinte.156.11.1143
21. Ahmed F, Mohammed A. Magnesium: The forgotten electrolyte–a review on hypomagnesemia. Med Sci (2019) 7:56. doi: 10.3390/medsci7040056
22. Song Y, He K, Levitan EB, Manson JE, Liu S. Effects of oral magnesium supplementation on glycaemic control in type 2 diabetes: A meta-analysis of randomized double-blind controlled trials. Diabetes Med (2006) 23:1050–6. doi: 10.1111/j.1464-5491.2006.01852.x
23. Guerrero-Romero F, Tamez-Perez H, González-González G, Salinas-Martínez A, Montes-Villarreal J, Treviño-Ortiz J, et al. Oral magnesium supplementation improves insulin sensitivity in non-diabetic subjects with insulin resistance. A Double-blind Placebo-controlled Randomized Trial Diabetes Metab (2004) 30:253–8. doi: 10.1016/S1262-3636(07)70116-7
24. Mooren FC, Krüger K, Völker K, Golf SW, Wadepuhl M, Kraus A. Oral magnesium supplementation reduces insulin resistance in non-diabetic subjects - a double-blind, placebo-controlled, randomized trial. Diabetes Obes Metab (2011) 13:281–4. doi: 10.1111/j.1463-1326.2010.01332.x
25. Guerrero-Romero F, Simental-Mendía LE, Hernández-Ronquillo G, Rodriguez-Morán M. Oral magnesium supplementation improves glycaemic status in subjects with prediabetes and hypomagnesaemia: A double-blind placebo-controlled randomized trial. Diabetes Metab (2015) 41:202–7. doi: 10.1016/j.diabet.2015.03.010
26. Morakinyo AO, Samuel TA, Adekunbi DA. Magnesium upregulates insulin receptor and glucose transporter-4 in streptozotocin-nicotinamide-induced type-2 diabetic rats. Endocr Regul (2018) 52:6–16. doi: 10.2478/enr-2018-0002
27. Sohrabipour S, Sharifi MR, Sharifi M, Talebi A, Soltani N. Effect of magnesium sulfate administration to improve insulin resistance in type 2 diabetes animal model: using the hyperinsulinemic-euglycemic clamp technique. Fundam Clin Pharmacol (2018) 32:603–16. doi: 10.1111/fcp.12387
28. Zheng S, Shi S, Ren X, Han T, Li Y, Chen Y, et al. Triglyceride glucose-waist circumference, a novel and effective predictor of diabetes in first-degree relatives of type 2 diabetes patients: Cross-sectional and prospective cohort study. J Transl Med (2016) 14:1–10. doi: 10.1186/s12967-016-1020-8
29. Gross SM, Rotwein P. Akt signaling dynamics in individual cells. J Cell Sci (2015) 128:2509–19. doi: 10.1242/jcs.168773
30. Rudich A, Konrad D, Török D, Ben-Romano R, Huang C, Niu W, et al. Indinavir uncovers different contributions of GLUT4 and GLUT1 towards glucose uptake in muscle and fat cells and tissues. Diabetologia (2003) 46:649–58. doi: 10.1007/s00125-003-1080-1
31. White MF, Shoelson SE, Keutmann H. Kahn CR. A Cascade Tyrosine Autophosphorylation β-Subunit Activates Phosphotransferase Insulin Receptor J Biol Chem (1988) 263:2969–80. doi: 10.1016/S0021-9258(18)69163-X
32. Wilden PA, Backer JM, Kahn CR, Cahill DA, Schroeder GJ, White MF. The insulin receptor with phenylalanine replacing tyrosine-1146 provides evidence for separate signals regulating cellular metabolism and growth. Proc Natl Acad Sci U.S.A. (1990) 87:3358–62. doi: 10.1073/pnas.87.9.3358
33. Webster NJG, Park K, Pirrung MC. Signaling effects of demethylasterriquinone B1, a selective insulin receptor modulator. ChemBioChem (2003) 4:379–85. doi: 10.1002/cbic.200200468
34. Haugaard SB, Andersen O, Madsbad S, Frøsig C, Iversen J, Nielsen JO, et al. Skeletal muscle insulin signaling defects downstream of phosphatidylinositol 3-kinase at the level of akt are in HIV lipodystrophy. Diabetes (2005) 54:3474–83. doi: 10.2337/diabetes.54.12.3474
35. Rudich A, Vanounou S, Riesenberg K, Porat M, Tirosh A, Harman-Boehm I, et al. The HIV protease inhibitor nelfinavir induces insulin resistance and increases basal lipolysis in 3T3-L1 adipocytes. Diabetes (2001) 50:1425–31. doi: 10.2337/diabetes.50.6.1425
36. Ben-Romano R, Rudich A, Tirosh A, Potashnik R, Sasaoka T, Riesenberg K, et al. Nelfinavir-induced insulin resistance is associated with impaired plasma membrane recruitment of the PI 3-kinase effectors Akt/PKB and PKC-ζ. Diabetologia (2004) 47:1107–17. doi: 10.1007/s00125-004-1408-5
37. Su NY, Peng TC, Tsai PS, Huang CJ. Phosphoinositide 3-kinase/Akt pathway is involved in mediating the anti-inflammation effects of magnesium sulfate. J Surg Res (2013) 185:726–32. doi: 10.1016/j.jss.2013.06.030
38. Wang J, Ma XY, Feng YF, Ma ZS, Ma TC, Zhang Y, et al. Magnesium ions promote the biological behaviour of rat calvarial osteoblasts by activating the PI3K/Akt signalling pathway. Biol Trace Elem Res (2017) 179:284–93. doi: 10.1007/s12011-017-0948-8
39. George S, Rochford JJ, Wolfrum C, Gray SL, Schinner S, Wilson JC, et al. A family with severe insulin resistance and diabetes due to a mutation in AKT2. Sci (80 ) (2004) 304:1325–8. doi: 10.1126/science.1096706
40. Cho H, Mu J, Kim JK, Thorvaldsen JL, Chu Q, Crenshaw EB, et al. Insulin resistance and a diabetes mellitus-like syndrome in mice lacking the protein kinase Akt2 (PKBβ). Sci (80 ) (2001) 292:1728–31. doi: 10.1126/science.292.5522.1728
41. Miura T, Suzuki W, Ishihara E, Arai I, Ishida H, Seino Y, et al. Impairment of insulin-stimulated GLUT4 translocation in skeletal muscle and adipose tissue in the tsumura Suzuki obese diabetic mouse: A new genetic animal model of type 2 diabetes. Eur J Endocrinol (2001) 145:785–90. doi: 10.1530/eje.0.1450785
42. Suárez A, Pulido N, Casla A, Casanova B, Arrieta FJ, Rovira A. Impaired tyrosine-kinase activity of muscle insulin receptors from hypomagnesaemic rats. Diabetologia (1995) 38:1262–70. doi: 10.1007/BF00401757
43. Reis MAB, Reyes FGR, Saad MJA, Velloso LA. Magnesium deficiency modulates the insulin signaling pathway in liver but not muscle of rats. J Nutr (2000) 130:133–8. doi: 10.1093/jn/130.2.133
44. Kostov K. Effects of magnesium deficiency on mechanisms of insulin resistance in type 2 diabetes: Focusing on the processes of insulin secretion and signaling. Int J Mol Sci (2019) 20:2–15. doi: 10.3390/ijms20061351
45. Henkelman G, LaBute MX, Tung CS, Fenimore PW, McMahon BH. Conformational dependence of a protein kinase phosphate transfer reaction. Proc Natl Acad Sci U.S.A. (2005) 102:15347–51. doi: 10.1073/pnas.0506425102
46. Zhao Y, Liu Y, Gao X, Xu P. Phosphorus chemistry. Berlin/Munich/Boston: Walter de Gruyter GmbH (2019). pp. 67–80. doi: 10.1515/9783110562552-005.
47. Yu L, Xu L, Xu M, Wan B, Long Y, Huang Q. Role of Mg2+ ions in protein kinase phosphorylation: insights from molecular dynamics simulations of ATP-kinase complexes. Mol Simul (2011) 37:1143–50. doi: 10.1080/08927022.2011.561430
48. Pylypenko O, Hammich H, Yu IM, Houdusse A. Rab GTPases and their interacting protein partners: Structural insights into rab functional diversity. Small GTPases (2018) 9:22–48. doi: 10.1080/21541248.2017.1336191
49. Laughlin MR, Thompson D. The regulatory role for magnesium in glycolytic flux of the human erythrocyte. J Biol Chem (1996) 271:28977–83. doi: 10.1074/jbc.271.46.28977
50. Pasternak K, Joanna K, Anna H. Biochemistry of magnesium. J Elem (2020) 15:601–16. doi: 10.1111/j.1749-6632.1969.tb13003.x
51. Cronin CN, Tipton KF. The roles of magnesium ions in the reaction catalysed by phosphofructokinase from trypanosoma brucei. Biochem J (1987) 247:41–6. doi: 10.1042/bj2470041
52. Dimitriadis G, Mitrou P, Lambadiari V, Maratou E, Raptis SA. Insulin effects in muscle and adipose tissue. Diabetes Res Clin Pract (2011) 93 Suppl 1:S52–9. doi: 10.1016/S0168-8227(11)70014-6
53. Turner N, Kowalski GM, Leslie SJ, Risis S, Yang C, Lee-Young RS, et al. Distinct patterns of tissue-specific lipid accumulation during the induction of insulin resistance in mice by high-fat feeding. Diabetologia (2013) 56:1638–48. doi: 10.1007/s00125-013-2913-1
54. Burchfield JG, Kebede MA, Meoli CC, Stöckli J, Whitworth PT, Wright AL, et al. High dietary fat and sucrose results in an extensive and time-dependent deterioration in health of multiple physiological systems in mice. J Biol Chem (2018) 293:5731–45. doi: 10.1074/jbc.RA117.000808
55. Kandeel FR, Balon E, Scott S, Nadler JL. Magnesium deficiency and glucose metabolism in rat adipocytes. Metabolism (1996) 45:838–43. doi: 10.1016/S0026-0495(96)90156-0
56. Rodríguez-Morán M, Guerrero-Romero F. Oral magnesium supplementation improves insulin sensitivity and metabolic control in type 2 diabetic subjects a randomized double-blind controlled trial. Diabetes Care (2003) 26:1147–52. doi: 10.2337/diacare.26.4.1147
57. Hardy S, Kostantin E, Wang SJ, Hristova T, Galicia-Vázquez G, Baranov PV, et al. Magnesium-sensitive upstream ORF controls PRL phosphatase expression to mediate energy metabolism. Proc Natl Acad Sci U.S.A. (2019) 116:2925–34. doi: 10.1073/pnas.1815361116
58. Quamme GA, Rabkin SW. Cytosolic free magnesium in cardiac myocytes: Identification of a Mg2+ influx pathway. Biochem Biophys Res Commun (1990) 167:1406–12. doi: 10.1016/0006-291X(90)90679-H
59. Quamme GA, Dai LJ. Presence of a novel influx pathway for Mg2+ in MDCK cells. Am J Physiol Cell Physiol (1990) 259:C521–5. doi: 10.1152/ajpcell.1990.259.3.c521
60. Dai LJ, Friedman PA, Quamme GA. Phosphate depletion diminishes Mg2+ uptake in mouse distal convoluted tubule cells. Kidney Int (1997) 51:1710–8. doi: 10.1038/ki.1997.236
Keywords: Magnesium, type 2 diabetes, insulin resistance, glycemic control, glucose transporter 4
Citation: Oost LJ, Kurstjens S, Ma C, Hoenderop JGJ, Tack CJ and de Baaij JHF (2022) Magnesium increases insulin-dependent glucose uptake in adipocytes. Front. Endocrinol. 13:986616. doi: 10.3389/fendo.2022.986616
Received: 05 July 2022; Accepted: 03 August 2022;
Published: 25 August 2022.
Edited by:
Carlos Guillén, Department of Biochemistry and Molecular Biology, Complutense University, SpainReviewed by:
Rudy M. Ortiz, University of California, Merced, United StatesCopyright © 2022 Oost, Kurstjens, Ma, Hoenderop, Tack and de Baaij. This is an open-access article distributed under the terms of the Creative Commons Attribution License (CC BY). The use, distribution or reproduction in other forums is permitted, provided the original author(s) and the copyright owner(s) are credited and that the original publication in this journal is cited, in accordance with accepted academic practice. No use, distribution or reproduction is permitted which does not comply with these terms.
*Correspondence: Jeroen H. F. de Baaij, amVyb2VuLmRlYmFhaWpAcmFkYm91ZHVtYy5ubA==
†ORCID: Jeroen H. F. de Baaij, orcid.org/0000-0003-2372-8486
Disclaimer: All claims expressed in this article are solely those of the authors and do not necessarily represent those of their affiliated organizations, or those of the publisher, the editors and the reviewers. Any product that may be evaluated in this article or claim that may be made by its manufacturer is not guaranteed or endorsed by the publisher.
Research integrity at Frontiers
Learn more about the work of our research integrity team to safeguard the quality of each article we publish.