 Bastian Gaus
 Dennis Brüning1
 Michael Müller
 Ingo Rustenbeck
94% of researchers rate our articles as excellent or good
Learn more about the work of our research integrity team to safeguard the quality of each article we publish.
Find out more
REVIEW article
Front. Endocrinol., 02 September 2022
Sec. Diabetes: Molecular Mechanisms
Volume 13 - 2022 | https://doi.org/10.3389/fendo.2022.983152
This article is part of the Research TopicImaging Beta Cell FunctionView all 5 articles
Before the advent of TIRF microscopy the fate of the insulin granule prior to secretion was deduced from biochemical investigations, electron microscopy and electrophysiological measurements. Since Calcium-triggered granule fusion is indisputably necessary to release insulin into the extracellular space, much effort was directed to the measure this event at the single granule level. This has also been the major application of the TIRF microscopy of the pancreatic beta cell when it became available about 20 years ago. To better understand the metabolic modulation of secretion, we were interested to characterize the entirety of the insulin granules which are localized in the vicinity of the plasma membrane to identify the characteristics which predispose to fusion. In this review we concentrate on how the description of granule mobility in the submembrane space has evolved as a result of progress in methodology. The granules are in a state of constant turnover with widely different periods of residence in this space. While granule fusion is associated +with prolonged residence and decreased lateral mobility, these characteristics may not only result from binding to the plasma membrane but also from binding to the cortical actin web, which is present in the immediate submembrane space. While granule age as such affects granule mobility and fusion probability, the preceding functional states of the beta cell leave their mark on these parameters, too. In summary, the submembrane granules form a highly dynamic heterogeneous population and contribute to the metabolic memory of the beta cells.
The views on the fate of the insulin granule were and are largely determined by the measuring techniques available. For decades the dominant technique was the electron microscopy and the observations made by it have led to the terminology still in use today. A “docked” granules is a granule the membrane of which is so close to the plasma membrane that no empty space is visible in between (1). This close vicinity was and still is widely regarded as a precondition for the fusion reaction. The gain of functional competence to undergo the fusion reaction was separated from the topological aspect by naming it “priming” (2).
The conventional view is that priming occurs after docking and that a “docked and primed” granule awaits the fusion signal in the form of a rising Ca2+ concentration in its immediate vicinity (3). Although electron microscopy can in principle document fusions at the single granule level, it does not permit time resolution since only end point measurements are possible. Also, the documentation of fusion reactions was hampered by the duration of the fixation step and remained rare until the use of the freeze-etching method (4–6).
The EM data were used to complement the kinetics of insulin secretion obtained from experiment with the perfused pancreas or perifused isolated islets. Of note, many concepts, which current investigations seek to prove or disprove have emerged from the interpretation of secretion data. This is particularly true for the concept that different compartments underlie the phasic nature of insulin secretion (7). While the concept of different pools of vesicles contributing to the release pattern of neurons or neuroendocrine cells implies their different localization (8, 9), the hypothesis of compartmentalization of insulin secretion does not necessarily describe the spatial organization of the granules, but was equally valid for purely functional differences or different metabolic activity acting on the granules. (10).
Among the early observations there is one which continues to generate considerable interest for the current imaging methodology: it is the preferential release of newly synthesized insulin and in consequence newly synthesized granules. It has been shown by radioactive labelling prior to stimulation that the ratio of labelled per total insulin was higher in the released insulin than in the remaining islet content of insulin (11–13). Furthermore, it was shown that the conditions during which the radioactive labelling took place, was of relevance for the preferential release (14). But the question how the prefusion behavior of the young granules differs from the one of the pre-existent granules could only be addressed by the new techniques of quantitative live-cell imaging.
A more dynamic view on the exocytosis of insulin granules emerged with the high resolution measurements of membrane capacitance enabled by patch-clamping with a lock-in amplifier (15). The increase in cellular membrane capacitance is caused by the addition of the granule membrane surface to the total surface of the beta cell plasma membrane when the fusion pore is generated. This permits measurements of granule fusion at a single granule level. However, this technique reports only the opening of the fusion pore, what happens before and what happens afterwards has to be indirectly deduced from the variation of the experimental conditions and leaves room for interpretation. This in turn is influenced by the pre-existing range of hypotheses. E.g. the hypothesis that one fusion equals one complete release of content may be generally valid for neuronal exocytosis (16), but may be of limited validity for the release of hormones.
While a clear advantage of the capacitance measurements is that it is label-free, it is relevant to note that the fusion reaction is not only generated by physiological or pharmacological stimuli, but is elicited by a train of depolarizations imposed on the cell. The choice of amplitude and duration of the depolarization is of decisive influence on the evoked reactions (17). This may be the reason why extremely high rates, like 500 fusions per second were initially reported (18). Another drawback of this technique is that upon prolonged stimulation endocytosis sets in and counteracts the increase in membrane capacity. The rate of endocytosis was found to be much slower, about 9 granules per second, still high, but closer to the range of secretion as assessed by measuring the amount of released insulin. Thus, it was hypothesized that the rate of endocytosis might be a limiting factor for granule fusion upon prolonged stimulation (18). From a conceptual viewpoint these observations are interesting in that they suggest that the ability of the beta cell to perform fusion reactions may not be rate-limiting for the achievable secretion rate, at least not within the physiological range. The limiting function could rather be exerted at preceding steps which may gate the access to the fusion sites (see below, chapter on cortical actin).
Taken together, these examples illustrate the point that with each new technique it is worthwhile to reconsider the hypothetical framework inherited from the limited perspectives of the preceding techniques.
The fundamental question of research on stimulus-secretion coupling in the pancreatic beta cell is still the same as it was in the preceding decades: which mechanisms form the biphasic kinetics of glucose-induced (or, in a broader sense, nutrient-induced) insulin secretion?
The endocrine pancreas responds to an increase in ambient glucose with a biphasic pattern of insulin release, represented by a short first phase, followed by a transient nadir and a slowly increasing second phase release (19). While these features are generally known, it is less widely known that after prolonged periods of constant stimulation the secretory response decreases from a maximal to a moderately elevated level. During this “third phase” the stimulus-secretion coupling has become desensitized (20, 21).
The biphasic response pattern is best shown in response to a ‘square wave’ glucose stimulus, either in vivo or in vitro (22, 23). It is obvious that such a stimulation pattern is non-physiological, the glucose resorption in the gut yields a comparatively slowly ascending glucose concentration, which is much less effective to produce a first phase (24). Nevertheless, the biphasic response pattern is the hallmark of the healthy endocrine pancreas. A diminished insulin response, often described to be more prominent during the first phase, but also recognizable during the second phase is associated with the manifestation of type 2 diabetes or models of this disease (25–27). Consequently, many of the recent reports on insulin granule behavior include these pathophysiological aspects (for reviews see 28–30).
The importance of the questions to be answered by live cell imaging of granules differs according to the conceptual framework. Under the assumption that the functional subdivision into a readily releasable and a reserve pool corresponds to the subdivision into docked and more or less distal non-docked granules as in neuronal exocytosis (31, 32), the following questions appear relevant: Have all granules which fuse with the plasma membrane been in a docked state prior to fusion? Is the readily releasable pool identical with the pool or a subpool of the docked granules? Is the readily releasable pool the correlate of the first phase of insulin secretion? Does the refilling of the readily releasable pool involve the translocation of granules or is it purely functional? Is the requirement for docking uniform for all phases of insulin secretion?
If the compartmental hypothesis is considered in a wider context, such that it reflects the sequence of signals acting on the granules (10), a number of additional questions come up. How is the formation of granules related to the release? Is the transport route from the site of generation to the plasma membrane essentially the same for all granules or are the short cuts and detours? Once arrived at the plasma membrane, do the granules stay there until being released (or degraded) or is there a steady turnover? How are these processes modulated by beta cell nutrients? Why is there such a large surplus of insulin granules if only a small minority is released during a physiologically relevant time span? And, as a consequence of the latter, what distinguishes aged granules from newly formed granules?
Of course, answering these questions does not only require topological information, but also information on biochemical mechanisms. The task to integrate biochemical reactions into spatial and temporal coherence is currently made easier by the ever expanding range of genetically encoded fluorescent indicators.
Different live cell imaging techniques have been employed to visualize insulin granules and to characterize their behavior. Arguably, the most influential technique thus far has been TIRF (total internal reflectance fluorescence) microscopy, followed by CLS (confocal laser scanning) microscopy, usually as the point scanning version, occasionally as the spinning disk version. Multiphoton microscopy has only rarely been used and super-resolution techniques like STED microscopy have yet to make their mark on insulin granule research.
All of the above require fluorescent labeling of the granules which may give additional information beyond the spatial dimension but which may also lead to artefactual observations and misinterpretations. While early investigations used small molecule labels of low specificity such as quinacrine (33), targeting fluorescent proteins to the granules by fusing them to granule-specific proteins has become standard practice. Problems of this approach are that the cargo-directed labels like EGFP linked to insulin (34, 35) or to C-peptide (36) may alter the intragranular processing and the release after fusion. Even small differences in the linker region between the label and the cargo protein were shown to influence the post-fusion characteristics of cargo release (37). Likewise, attaching the label to the transmembrane granule protein phogrin has been shown to disturb the attachment of the granule to and fusion with the plasma membrane (38, 39).
These considerations are also valid for the newer labelling techniques like SNAP-tag or Halotag (40), since the proteins to which the small fluorescent molecules irreversibly bind are of similar size (182 or 297 amino acids, respectively) as the EGFP (238 amino acids). The interpretation is particularly difficult when observations have to be compared which were obtained with different labels like EGFP and dsRedE5 (41). Finally, all fluorescent labels are prone to photobleaching, thus excitation energy and exposure time have to be carefully chosen to avoid misinterpretations (42).
The pH-dependence of the EGFP fluorescence (43), often considered as problematic, has been used as a surrogate marker for exocytosis, since the formation of the fusion pore increases the pH value of the acidic granule interior (44, 45), thereby de-quenching the EGFP fluorescence. The sudden increase of the fluorescent spot is easy to recognize, but is insufficient to conclude that the granule content has been released or in other words that complete exocytosis has taken place. Finally, it has to be taken into account that granule labeling by heterologous expression of fluorescent proteins may leave the older, pre-existing granules unmarked (46), thus creating a bias in the quantitative evaluation.
Light microscopy has a lower axial (z-dimension) than lateral (x/y dimension) resolution, this remains true even for the super-resolution techniques like STED microscopy. TIRF microscopy is the exception to this rule, however, this advantage comes at the price that only a layer of around 150 nm below the plasma membrane can be rendered visible. Depending on the angle of incidence of the laser beam, the calculated decay constant (reduction of the initial excitation intensity at the glass-membrane interface to 1/e = 37%) can be varied until the change into the epifluorescence mode occurs (47, 48). Two features of TIRFM have to be pointed out here. First, because of the exponential decay of excitation within the TIRF layer, small axial movements will result in marked changes of fluorescence. Second, a reduction to 37% is not necessarily equal to the complete loss of fluorescence detection, even when considering the inner filter effect of fluorescence emission. This is rather to be assumed at a reduction to 10% or about twice the decay constant.
To illustrate this point: the diameter of a granule is ca. 250 nm (49), so an axial movement towards the cell interior by about half a diameter is likely, by one diameter is certainly sufficient to let the granule fluorescence disappear. In consequence, examination of events beyond this distance, like granule transport from the trans-Golgi region to the plasma membrane, has to be performed by confocal or by multiphoton microscopy. Under ideal conditions, a lateral resolution of 150 nm can be achieved by confocal microscopy, but 200 nm is what can be considered as a typical value. The axial resolution, however, is only about 500 nm (50). The latter is about the double of a granule diameter, which seriously limits the reconstruction of 3D-trajectories.
Another factor to consider is that the time resolution of confocal microscopy is limited by the point scanning principle, which may require sampling rates of only 1 s-1 for well-resolved images (51). This limitation is much less severe with the spinning disk illumination, but until recently this technique suffered from low light intensity and pin-hole crosstalk (52). Simulations of granule movements, based on real TIRF data sets, showed that an acquisition frequency of 6 to 8 images per second was sufficient to for low error probabilities in tracking at the typical density of granules. A 99% correct assignment could be achieved at a nearest neighbor distance of 8 pixels, well below the average distance at this acquisition frequency, which was in the range of 10 -13 pixels (53). Currently, there is no technique that permits 3D measurements of the entire granule population of a primary beta cell at sufficient temporal and spatial resolution. However, this may change with the further development of light sheet microscopy.
It is no question that TIRF microscopy is the technique of choice to study the molecular interactions between the insulin granule and its attachment site at the plasma membrane (e.g. 54, 55) or to study the release of granule content after fusion pore opening (e.g. 56, 57). If the aim of the study is to characterize granule mobility, the major advantage of TIRF, the shallow depth of field may also be a limiting factor. In the first investigations utilizing TIRF microscopy the fusing granules (as identified by EGFP fluorescence increase) were subdivided into those which were present from the beginning of the registration and those which appeared only during the course of the registration. The former were considered to be in the docked state, the latter were named newcomers (34). It was concluded that the fusions during the first phase of glucose stimulation and during KCl stimulation were mostly by docked granules, whereas the fusions during the second phase of glucose stimulation were predominantly by newcomers. In this study the role of the newcomers was postulated to consist in the refilling of the readily releasable pool by physical translocation (34). In contrast to KCl, sulfonylureas drugs were found to induce the fusion of newcomer granules (58), an observation for which a mechanistic rationale is still lacking.
In a later study which aimed at describing the mechanism underlying the enhancement of insulin secretion by cAMP-signaling the newcomer granules were subdivided (59). cAMP increased the fusion rates throughout the entire exposure to stimulatory glucose, thus an effect on both phases of secretion could be assumed. Intriguingly, the increase by cAMP was nearly completely due to newcomer granules which fused immediately after arrival in the TIRF layer. These were named restless newcomers, whereas granules which remained visible for a while before fusing (and were presumably docked during this phase) were name resting newcomers (59). The resting newcomers made up a small minority under all conditions, such as stimulation by glucose alone. Fusions by pre-docked granules (“old faces”, defined as being those which were present at the beginning of the registrations) prevailed during stimulation by very high extracellular potassium concentration (60 mM), but not during the initial phase of glucose stimulation with or without treatment to elevate cAMP (59, 60).
The view that the docking of the granules is an indispensable step prior to the fusion was further questioned by the observation that the knock-out of granuphilin, an effector of the small GTPase Rab27a, virtually abolished docking as shown by both, TIRFM and by EM, but did not diminish fusion and secretion, rather, both were enhanced (61). Consequently, it was hypothesized that docking is not a precondition for fusion, but rather a waiting state, perhaps even exerting a constraint on the probability of fusion (62). The subdivision of the granules into pre-existent granules, newly arrived granules which fuse after having stayed at the membrane for a while, and granules which fuse immediately after appearance corresponds largely to the one proposed by Seino´s group, even though a different terminology was used in these reports.
The heterodox view that fusion can occur without previous docking, at least in insulin secreting cells, was supported by two-photon imaging to simultaneously measure FRET signals of SNARE assembly and insulin exocytosis. These data suggest that SNARE proteins exist in multiple stable configurations, and Ca2+ influx triggers exocytosis by distinct mechanisms and distinct kinetics (63). Further investigations by these authors showed that, unlike in neurons, SNAREs are not yet assembled in resting beta cells and assemble only shortly before exocytosis, a fact reflecting the much lower rates of fusion in beta cells than in neurons (64).
The studies mentioned so far have in common that they focus on the fusion reaction and then reconstruct the preceding steps of those granule which have fused. Since the number of granules exceeds by far the number of granules which are released even during prolonged stimulation, it appeared relevant to characterize the number and behavior of the entirety of granules in the submembrane membrane space to look for characteristics which predispose for fusion or for continued residence or for return into the cell interior.
Such an encompassing description requires a larger number of parameters. In addition to the number of granules per time the cumulative number during the measuring interval as well as the rates of arrival and of departure (back into the cell interior) are needed to assess the turnover. Since the residence in the submembrane space is of variable duration, three categories were defined; short-term, medium term and long-term resident granules (53). Arrivals and departures essentially reflect the granule mobility in the z-dimension. To describe the mobility in the x/y-dimension in a time-resolved manner, the caging diameter was chosen (53, 65). In contrast to the much more widely used mean square displacement, the caging diameter does not require the assumption of a steady-state mobility.
Of all the granules which appeared in the submembrane space under steady state conditions, 82% were present for less than 1 s, 16% had a residence time between 1 s and 25 s and only 2% were present for a longer time. While the rate of arrivals and departures and, in consequence, the cumulative granule number and the number of short term residents increased in response to KCl- or glucose-stimulation, the mean caging diameter was not significantly affected (42). When only the fusing granules were evaluated, the caging diameter revealed differences between those granule which had newly arrived and those which were pre-existent. The first measurable caging diameter of newly arrived granules was significantly larger than the one of the pre-existent granules. The last caging diameter immediately before fusion showed that the lateral mobility of the newly arrived granules had decreased and become more uniform, but it was still significantly larger than the corresponding one of the pre-existent granules (42). This supports the above view that different combinations of fusion-regulating factors are possible during the pre-exocytotic state (64). Under the given conditions however, fusions by newly arrived granules made up only a minority (< 15%) of the total number of fusions (42).
Returns of granules back in to the cell interior have been noted early (34), but were apparently not considered relevant enough for a quantitative treatment. This was made possible by an observer-independent evaluation programme (53). Here, track endings that were not linked to any other track were termed “departures”, when the granule had left the evanescent field without fulfilling the criteria for exocytosis. The rate of departures closely mirrored the rate of arrivals both in MIN6 cells and in mouse beta cells (42, 66), even though the turnover rate was about 50% higher in MIN6 cells than in beta cells (see Table 1). So, granule mobility is not a unidirectional movement towards the plasma membrane, as often depicted in schematic drawings, but comprises a continuous exchange of the granules in the submembrane space (Figure 1).
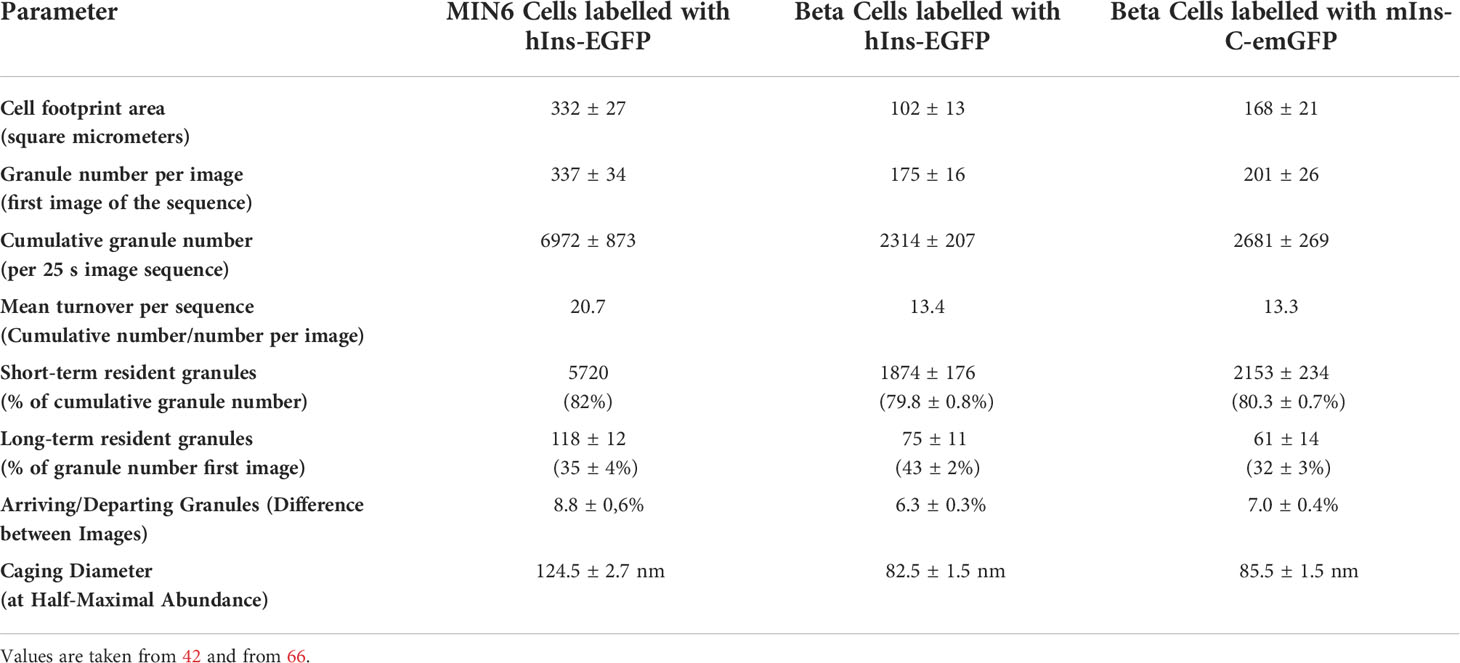
Table 1 Typical values of the parameters to describe granule mobility in the submembrane space of MIN6 cells and primary mouse beta cells.
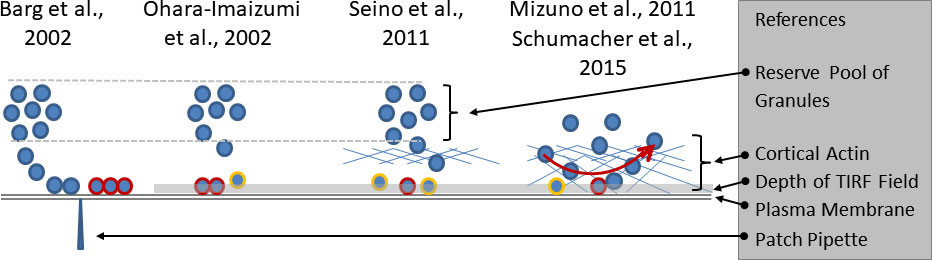
Figure 1 Growing complexity of the relation between granule mobility and fusion competence. The electrophysiological investigations (left part of the sketch) led to the definition of a readily releasable pool of docked and primed granules (highlighted by red rims), the emptying of which caused the nadir between the first and the second phase of insulin secretion. The slow refilling from a distant reserve pool was considered as the cause of the slower pace of secretion during the second phase. The initial TIRF studies (second from left) considered the predocked granules as the correlate of the readily releasable pool and noted an increasingly relevant contribution of newcomer granules (highlighted by yellow rims) with time. Later (second from right), a predominant contribution of restless newcomer granules to the first phase was described. The lower fusion rates during prolonged stimulation were ascribed to the passage through the cortical actin layer. The rightmost part of the sketch combines two sets of observations. The cortical actin layer, which extends to the immediate vicinity of the plasma membrane is not just an obstacle, but a near-membrane storage site of granules. There is a constant exchange of granules which arrive at the submembrane space and leave again after different periods of residence, mostly within one second. Fusion is possible after varying periods of residence.
The decisive role of depolarization-induced Ca2+ influx for triggered exocytosis is beyond dispute. This is not only true for synaptic vesicles, but also for secretory granules, such as insulin granules in the beta cell (67). It is less clear as to whether the resulting increase in the cytosolic Ca2+ concentration is also a signal for granule transport to the cell periphery and for granule mobility in the submembrane space.
Early investigation have concluded that not Ca2+ influx, but rather Ca2+ release from internals stores is the mechanism by which glucose activates transport to the cell periphery (68, 69). While a role of Ca2+ release from the ER could be confirmed by CLSM, automated tracking identified a subgroup of fast moving granules which responded to Ca2+ influx by KCl (30 mM) depolarization (51). The authors concluded that the fast moving granules represent those which are destined to refill the readily releasable pool. Of note, KCl was more effective than glucose to elicit changes in granule mobility in both subgroups (51). Selective photoactivation of single granules, which permitted tracking by CLMS with a high spatial and temporal resolution, gave a somewhat different picture, in that glucose stimulation transformed granules of restricted mobility into fast moving granules with a directed movement. However, the mechanisms by which glucose brought about this transition were not further analyzed (70).
The most immediate mechanism to elicit a Ca2+ influx via VDCC is the KCl depolarization. As an experimental tool to stimulate the secretion of perifused islets KCl concentrations of 30 mM to 40 mM are used (71, 72), and 60 mM to 75 mM KCl are used to elicit exocytosis during live cell imaging. (62, 73). It is often stated that the secretory response to KCl depolarization is the equivalent of the first phase insulin secretion (see e.g. 72). Mechanistically, such an equivalence seems obvious for the depolarizing effect of pharmacological KATP channel closure (74), but the relation is more complicated for KCl depolarization.
The depolarization strength of 15 mM KCl is close to the one of KATP channel closure, but has only a modest transient effect on insulin secretion (74, 75). Higher KCl concentrations elicit progressively higher secretory responses without saturation and induce a desensitization to subsequent nutrient stimulation (75, 76). Correspondingly, the maximal fusion rates established by 60 mM KCl were higher than those produced by glucose stimulation (ca. 10 v. 1 per min and 200 μm2), but were less enduring (59, 60, 62). When measured by 2-photon microscopy in intact islets the fusion rate was 13 per cell and per minute during the first phase of glucose-induced insulin secretion (77). The above caveats notwithstanding, depolarization by high KCl concentration continues to be the preferred experimental technique to elicit insulin granule exocytosis.
The effect of Ca2+ influx on submembrane granule number and mobility in MIN6 cells was tested using depolarizations with 15 mM and 40 mM KCl. This led to the reduction of submembrane granules which were not so much due to the number of exocytoses, but to an increased turnover, as was visible by the increased numbers of arriving granules, short-term residents, and departures (35). Since the effect could be antagonized by nifedipine, Ca 2+ influx via L-type channels does not only trigger granule fusion but diminishes the granule number by accelerating the turnover.
In this context the observation is interesting that a difference apparently exists between the consequences of glucose stimulation and those of KCl stimulation: The total number of granules, the short term resident granules, and the arriving granules, which are all parameters of granule turnover, were significantly smaller for glucose than for 40 mM KCl (66). This may be part of the phenomenon that insulin secretion by KCl stimulation recedes the faster the higher the initially achieved secretion rates were (75, 76).
The slower and less extensive increase of the Ca2+ concentration in the submembrane space by 15 mM KCl as compared with 40 mM KCl was also used to test the hypothesis that granule pools of different Ca2+ sensitivity exist (78). In this hypothesis, the docked granules are of low Ca2+ sensitivity and require large increases of Ca2+ in their vicinity to fuse, whereas the newcomer granules, considered to be relevant for the second phase, are highly Ca2+ -sensitive and thus require a comparatively smaller increase (79, 80).
While the Ca2+ increase by 15 mM KCl is in fact lower than that of 40 mM KCl the resultant modest and transient increase in secretion bears little resemblance to a fully developed second phase. Also, the role of Ca2+ for the mobilization of the newcomer granules remained unclear. In a wider perspective, this hypothesis concurs with those by Kasai etal. (62) and Takahashi etal. (63) in that different combinations of preconditions can ultimately lead to exocytosis as opposed to a uniform sequence of events.
From a methodological stand point, the measurement of a conventional small molecule Ca2+ indicator by TIRFM, such as performed in the above investigation (78), may give a more precise image than measurements by epifluorescence, but it cannot reveal the fusion-relevant Ca2+ concentrations, postulated to exist in microdomains around Ca2+ channels (for an overview see (81). In these microdomains of just a few nanometers in diameter, a steep gradient exists generated by the influx of Ca2+ through the open channel and the buffering capacity and velocity of the cytosol. The concept resulted from research on neurotransmitter release (9, 82) and was quickly adapted to research on insulin granule exocytosis (33).
If only the high Ca2+ concentration within the microdomain (about 100 μM, to give a rough estimate) is sufficient to elicit the granule fusion, a clustering of pre-exocytotic vesicles or granules around the Ca2+ channels and the microdomains appears as a necessary consequence. This in turn entails that pre-exocytotic granules are particularly immobile and as such correspond to (a subgroup of) docked granules. In fact, clustering and immobility have been repeatedly emphasized as central features of pre-exocytotic granules (31, 33, 55). Consequently, disturbed clustering for a variety of reasons has been described as a mechanism underlying the impaired kinetics of insulin secretion in type 2 diabetes or its disease models (83–85).
The extent of glucose-stimulated insulin is not only regulated by the depolarization-induced Ca2+ influx, but also by a sequence of still incompletely understood events, which are summarized under the name “amplifying pathway” (86, for a recent review see 87). By using the genetically encoded Ca2+ indicator LynD3-cpv, which was targeted to plasma membrane, it could be demonstrated that no further Ca2+ increase occurs in the submembrane space under the conditions leading to the metabolic amplification by glucose (88). How exactly glucose stimulation amplifies the Ca2+-induced fusion reaction, remains an unsolved issue thus far.
To evaluate the relevance of docking, clustering and immobilization as preconditions for granule exocytosis, and to gain further insight into the mechanisms of the metabolic amplification, an experimental approach to directly measure the fusion-relevant Ca2+ concentrations in the vicinity of Ca2+ channels and insulin granules is needed. While earlier experiments brought inconclusive results in this regard (89), the current availability of GECIs with a broad spectrum of properties may enable further advances in this area (90).
In schematic drawings cortical actin and the plasma membrane are separated by a space wider than a granule diameter (see e.g. 3, 79, 91). It is often assumed that the readily releasable pool and the reserve pool are separated by the cortical actin web which the granules of the reserve pool have to cross to replenish the readily releasable pool and to ultimately reach the fusion site. The modified model as suggested by Seino´s group (91) placed a pool of non-docked granules in the obstacle-free vicinity of the membrane-attached granule pool, theoretically enabling the restless newcomers to quickly reach the fusion sites and thus form part of the readily releasable pool. However, the relation between the non-docked granules and cortical actin remained undefined.
Support for a role of the cortical actin web not just as barrier, but as a near-membrane storage site came from experiments where instead of granuphilin another effector protein of Rab27a, exophilin8, was knocked out. Apparently, exophilin8 traps the granules into the actin network, from where they are released during stimulation (92, 93). Upon glucose stimulation, probably mediated by the Ca2+ rise, melanophilin dissociates granules from myosin-Va and actin in the actin cortex and by associates them with a fusion-competent, open form of syntaxin-4 on the plasma membrane. This way, a continuous supply of granules can be made available to fuse with the plasma membrane without a preceding docking period (94).
An obvious contradiction to the concept of granules being immobilized around L-type channels consists in the observation that insulin granules increase mobility, in particular lateral displacement, during the last few seconds before fusion, together with increased FRET signal of Rab 27a and its effector Slp4a (95). Similarly, pre-exocytotic granules were found to have a significantly smaller caging diameters than the non-fusing neighbours, but the caging diameter of the pre-exocytotic granules increased significantly directly before fusion (53). A plausible explanation of this late increase in mobility is that the exocytotic granule changes its position from one attachment site, possibly at the cortical actin, to another, where the actual fusion takes place.
Most of the work on granule mobility discussed thus far has visualized the granules, but rarely together with the labeling of F-actin. Co-labelling of insulin granules with hIns-EGFP and of F-actin with mTagRFP-T-Lifeact-7, shows that both are contained within the TIRF zone when the calculated decay constant is about 80 nm, which is a typical value (Figure 2). The 3D image of such a dual labelled beta cell generated by spinning disk CLSM, gives even the impression that the cortical actin forms the outermost layer of the beta cell, beyond most of the granules (Figure 3). So, schematic drawings appear more appropriate where the cortical actin layer extends to the plasma membrane and actin cages contribute to the immobilization of granules in the immediate vicinity of the plasma membrane (see e.g. 96).
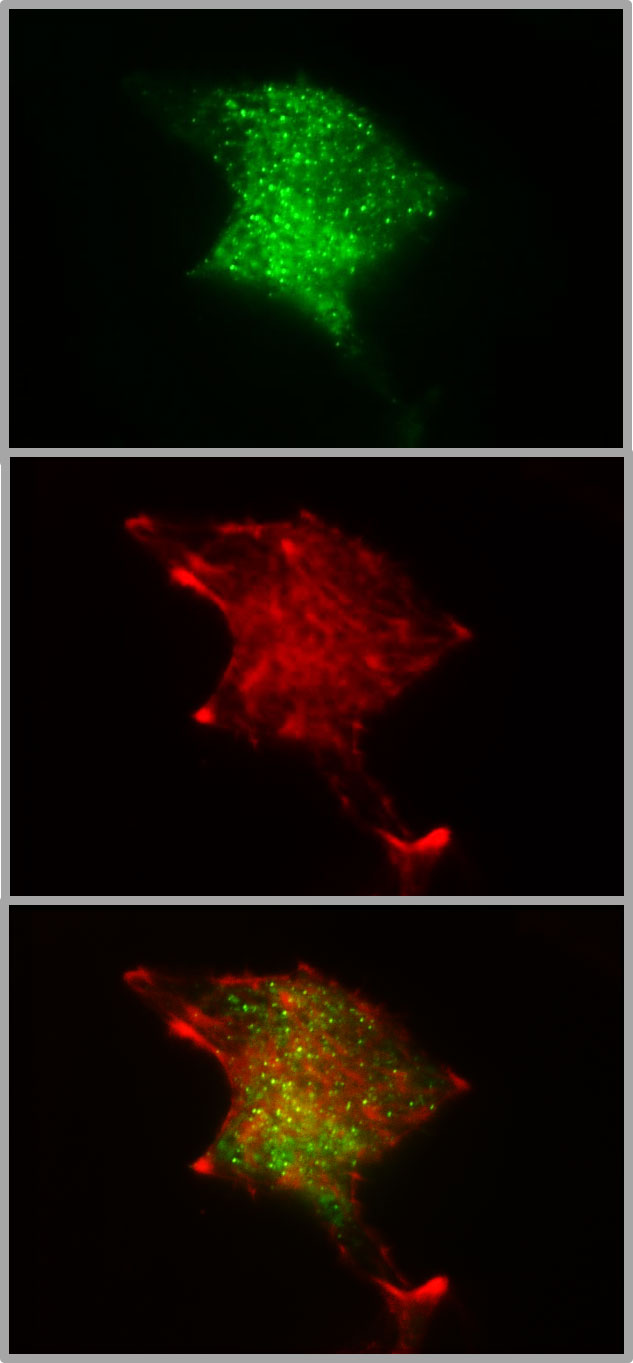
Figure 2 Colocalization of insulin granules and actin in the submembrane space of MIN6 cells. The insulin granules of MIN6-cells (p20 - p30) were labeled by transient transfection with hIns-EGFP and mTagRFP-T-Lifeact-7. The fluorescence emission < 560 nm (upper image) gives the conventional TIRFM image of green fluorescent granules in the submembrane space (calculated decay constant 85 nm). The fluorescence emission > 560 nm shows the presence of red-labelled actin (middle image) together with insulin granules (overlay, lower image) in the same space. The coexistence suggests that the granule mobility may reflect, at least in part, interactions with the cortical actin.
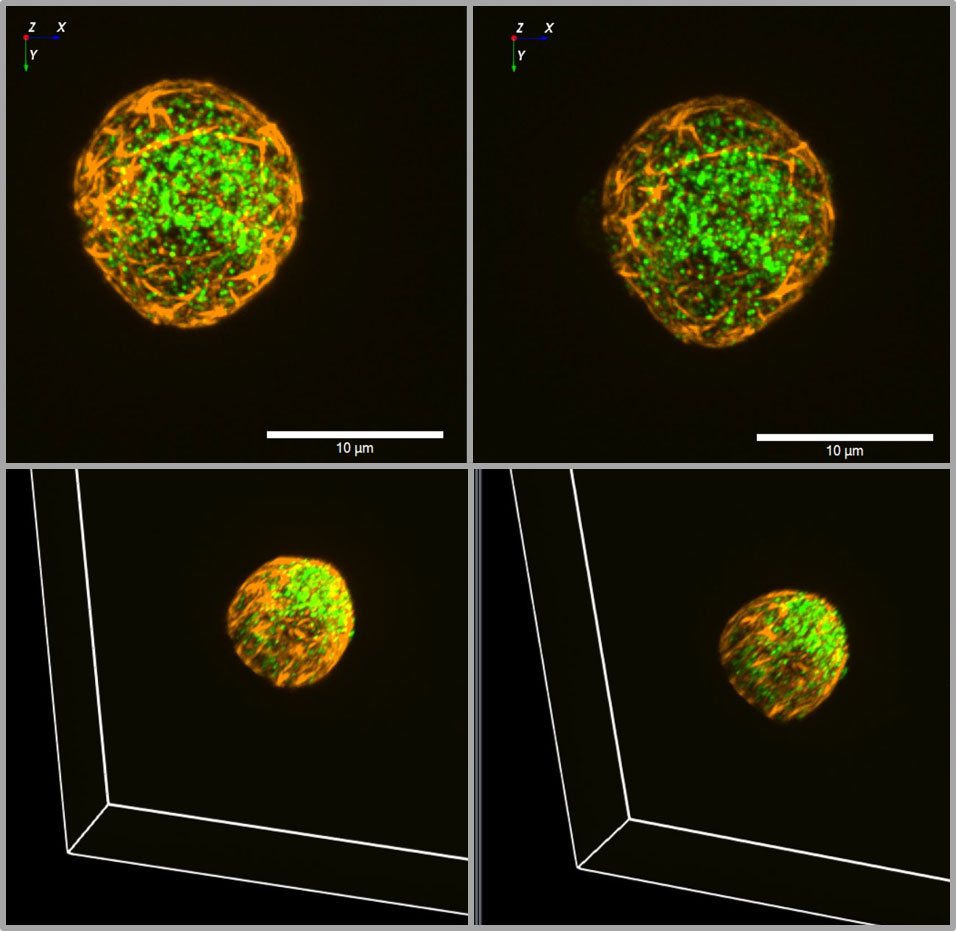
Figure 3 3D view of insulin granules and actin in primary beta cells. The insulin granules of primary beta cells were labeled by adenoviral transfection with hIns-EGFP (green) and mTagRFP-T-Lifeact-7 (orange). The fluorescence was excited by spinning disk CLSM (50 µm disk, 2.8fold magnification by SORA attachment, objective Nikon SR HP Apo TIRF 100x, N.A. 1.49). The z-stack was generated from 61 levels at 200 nm steps. The lower images show the same beta cell as above, but viewed from an oblique angle. The right images show the same cell as the left images after 10 min incubation in the presence of latrunculin. Note the decrease of actin by latrunculin all around the beta cell.
In such a model the recruiting of granules from the actin-associated reserve pool is unlikely to cause a delay in the re-filling of the readily releasable pool, which was suggested to be reason for the biphasic secretion pattern (32). Conversely, a fast reverse passage through the cortical actin web must be possible, given that 80% of the granules which are visible in the submembrane space (TIRF layer) stay there for only 1 s or less (Table 1). Likewise, the cumulative number of granules identified within 1 min exceeds the entire number of granules within the beta cell, a feature which can only be explained by recirculation of the granules (42).
Simulation of the interaction between insulin granules and the actin network by a cellular automaton model showed that specific features of the resulting biphasic secretion pattern could be modified by altering the cord length, the network density and the velocity of Ca2+ increase (Figure 4). While some authors have observed generalized changes in the actin pattern as a result of glucose stimulation (97, 98), others observed only spatially discrete and transient F-actin changes around each fusing granule, but no global changes (99). While the physiologically relevant changes are certainly much more discrete than the changes produced by the secretion-enhancing action of the actin-depolymerizing agent latrunculin (100, 101), there is currently no evaluation tool to quantitatively describe the structural characteristics of the cortical actin in beta cells.
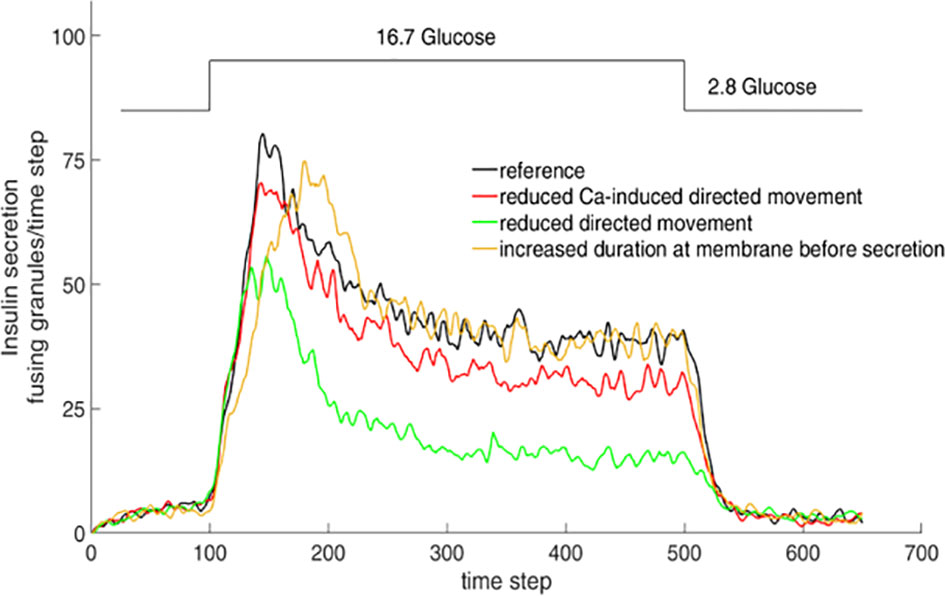
Figure 4 Simulation of insulin secretion as function of granule mobility. Consequences of varying the simulation parameters. The consequences were tested by halving the parameter values one by one while fixing all other parameters. When this results in the general increase of diffuse granule movement over directional movement, e.g. by lower chord lengths in the actin network, secretion is markedly reduced, even in the stationary phase (green line). Halving the parameter value describing the transition from diffuse movement into directional movement, such as generated by the increase of the cytosolic Ca2+ concentration, results in a similar but less pronounced decrease (red line). When the effect of halving results in the prolonged presence of the granules at the membrane prior to release, the peak value of secretion is retarded, but the stationary phase remains unchanged (yellow line). Adapted from 100.
An interesting new aspect of the role of cortical actin concerns the relation between endocytosis and exocytosis of insulin granules, mentioned earlier (chapter 1). Knock-out of all three dynamin genes did not only impair endocytosis but also blunted both phases of glucose-induced insulin secretion concurrent with reduced granule docking and reorganization of the cortical actin layer (102, 103). Taken together, the recent observations support a model in which submembrane cytoskeletal structures, not only the cortical actin, but also the microtubular activity (104) gate the access of the insulin granules to the plasma membrane and the exocytotic sites, thus co-regulating the secretion kinetics (105).
It is generally accepted that the signals for granule generation only partially overlap with those for granule release. Granule generation is stimulated by nutrient secretagogues, but not by purely depolarizing stimuli, such as sulfonylureas or KCl-depolarization, and the glucose concentration required to stimulate insulin synthesis (and by inference, granule synthesis) is left-shifted (106). While this relation ensures that beta cell insulin stores do not become depleted, it also means that a surplus of granules is produced, which ages and has to be degraded. However, not only aged granules (those which have exceeded the half-life of 3-5 days) but also younger granules are degraded, depending on the metabolic situation of the beta cell (107, 108). So, at no time point does a signal for stimulated secretion impinge on a homogeneous granule pool.
The observation, which has mainly stimulated interest in the role of granule aging, was made decades ago by the pulse chase technique. 3H leucine was used to label newly synthesized insulin and it was observed by a number of groups that after a lag time, roughly corresponding to the transit time from the trans-Golgi network to the plasma membrane, the released insulin had a higher specific activity than the insulin content still present in the islets (11–13). Or, in other words, newly synthesized insulin was preferentially released.
There are two different questions associated with granule aging: First, how do the newly formed granules gain preferential access to the fusion sites? Second: is there a general mechanism of granule aging which gradually diminishes their ability to fuse and become degraded instead? An indication that the first question is related to glucose-dependent stimulus secretion coupling is the observation that the preferential release is not simply related to young age, but that the glucose concentration during the time of granule synthesis leaves a mark for preferential release (14)
Interest in this topic was revived by an observation which was made possible by the use of the timer protein (DsRedE5), which changes its fluorescence emission from green to red with a half-time of about 18 h (109). Labelling LDCVs (large dense-core vesicles) in chromaffin cells with ANF-timer fusion proteins showed that green vesicles were immobile (apparently docked) at the plasma membrane, whereas older vesicles were mobile and had a higher density in the cell interior. Moreover, nicotine stimulation released a large part of the green vesicles, but none of the red vesicles (110). Since chromaffin cells are widely considered as a model for granular exocytosis, the authors concluded that the spatial and functional segregation could be a general feature of protein-releasing LDCVs. (111).
Examining the age-dependent granule mobility in insulin-secreting cells by use of SNAP tag-labeling, led to a somewhat different result, in that young granules displayed a wide variety of mobility, whereas old (28 - 30 h) granules displayed only restricted mobility or were even immobile (112). Young immobile, but not old immobile granules could be recruited by glucose stimulation or by depolymerization of F-actin to be transported by microtubules, which may correspond to the preferential transport and release of newly synthesized insulin (112). Here, actin is considered to have mainly a retentive function for young granules and is relevant for transport parallel to the membrane, whereas axial long range transport is mediated by microtubules (49).
Another reason to consider the role of aging for granule mobility and release was the exploration of the mechanisms of desensitization by prolonged exposure to a sulfonylurea and beta cell rest by prolonged exposure to the alpha2 adrenoceptor agonist, clonidine (41). Labeling with hIns-timer showed that desensitization did not affect the proportion of aged (> 18 h), whereas rest increased it. Aged granules showed a high turnover and were under-represented in the group of long-term residents, which made up the larger part of pre-exocytotic granules. Likewise, examination of the granule content after massive stimulation of secretion showed an initial drop in the green-to-red ratio of timer-labelled granules, suggestive of a predominant release of the young, green granules (113).
On the balance it seems that the initial observation, obtained with neuro-endocrine chromaffin cells, that granule aging increases the mobility but at the same time decreases the ability to fuse is also valid for insulin secreting cells. It remains to be explored as to whether both features are caused by the same underlying mechanism. Further exploration of granule aging appears promising to clarify the phenomenon of metabolic memory by which the acute secretory response is influenced by preceding phases of nutrient availability or starvation (114). The energy requirement of granule mobility and local interactions with submembrane mitochondria (Figure 5) are factors which may be involved and need to be investigated more intensively.
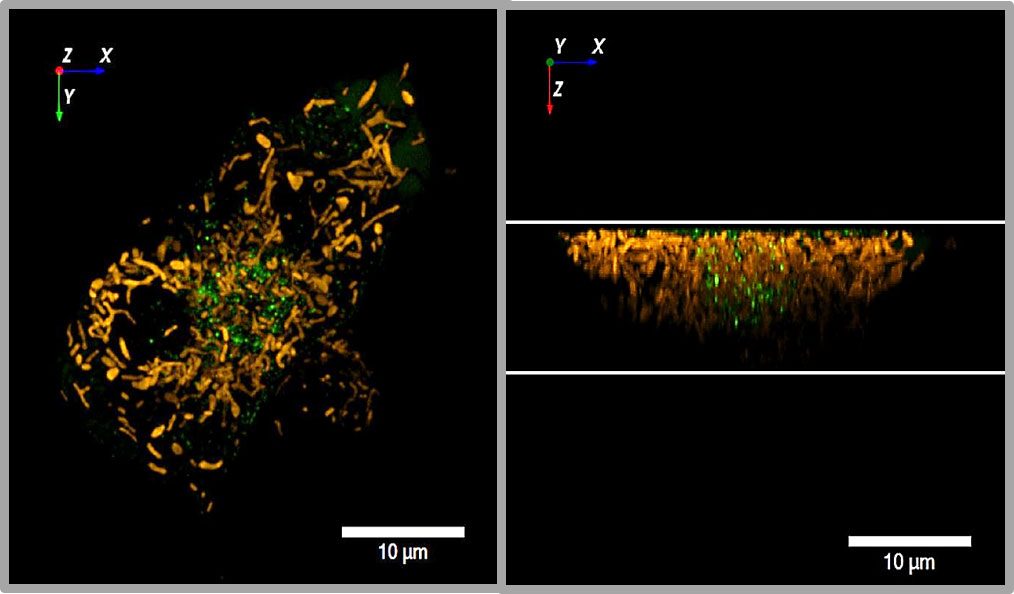
Figure 5 Presence of insulin granules and mitochondria in the submembrane space of MIN6 cells. The insulin granules of MIN6 cells were transiently labelled with hIns-EGFP (green) and mitochondria by loading with TMRE. The image acquisition of the z-stack was performed as in Figure 3. The left image shows the cell from the bottom - attachment to the cover slip, the right image shows the lateral view to demonstrate the high concentration of mitochondria in the immediate vicinity of the submembrane space.
This review is focused on the increasingly complex landscape of insulin granule mobility and its contribution to the regulation of secretion. Of course, there are a number of further factors in the life time of a granule which may be of relevance for the secretory output. In many of the reports cited here a heterogeneous pattern of granule content release is observed. It has been hypothesized that a very protracted release may be the mechanism of basal insulin release (115). Likewise, the long-standing questions about the relevance of kiss-and run (or “cavicapture”) exocytoses or multigranular, compound exocytoses in beta cells (see e.g. 116, 117) are still awaiting clarification. Either mechanism would loosen the linear relation between fusion frequency and insulin output, which was indirectly supported by the demonstration of quantal ATP release during exocytosis of insulin granules (118).
Early investigations, which suggested that beta cells are polarized and insulin secretion occurs in the “advascular” part of the beta cell (119), were contradicted by 2-photon microscopy of the fluid phase tracer sulforhodamine B, which suggested that insulin granules fuse to the “abvascular” part of the beta cells in intact islets (77). Either observation raises the possibility of a localized release of insulin persisting in single isolated beta cells. Since the cell footprint makes up only about 30% of the cell surface (65) this may explain the considerable cell-to-cell heterogeneity not only with respect to the number of fusion reactions, but also with respect to the mobility pattern.
A localized release occurring not only in primary beta cells but also in MIN6 cells was rendered likely by the observation that the active zone protein, ELKS, is expressed in these cells. ELKS was organized in clusters which colocalized with syntaxin 1 clusters and (presumed) docking sites of insulin granules. The analysis of single granule mobility by TIRFM suggested that the fusions mostly occurred on the ELKS clusters. Since ELKS was found to be localized close to the plasma membrane-facing blood vessels an “advascular” release of insulin is supported (120). These data are indirectly contradicted by an investigation utilizing spinning disc CLSM to obtain a near complete 3D image of the cell within less than a second. In single MIN6 cells no clustering of fusions and no compound exocytosis could be detected by this technique (121).
Recent investigations on beta cell exocytosis within islets, however, tip the balance of evidence towards the “advascular” release hypothesis (122) and local integrin activation was suggested to target insulin secretion to the islet capillaries (123). Furthermore, it was observed that neighboring beta-cells work in synchrony and granule fusion occurred in discrete bursts during stimulation (124). The latter observation conforms with the earlier reports that the coordinated interaction of the beta-cells as occurs within the islet markedly enhances the insulinotropic efficacy of stimuli as compared with single dissociated beta-cells (125, 126). This holds also true for the comparison of single MIN6 cells vs. MIN6 cells organized in “pseudo-islets” (127, 128).
In keeping with the characteristics of TIRF microscopy, nearly all work on granule mobility was made with single cells or single cell clusters. The frequency of fusions during continuous measurements usually gave a monophasic pattern, and the assignment to first- or second phase was simply based on the temporal sequence. Given the above intra-islet interactions it may well be that a biphasic pattern in its original meaning may not be directly observable at the level of the single beta cell.
The position of beta cells within the islet may also affect granule mobility, since the focal adhesion proteins influence the organization of cortical actin (129, 130). Since the actin structure receives also input from glucose metabolism (for an overview see 131) it is a plausible hypothesis that the interaction between granules and cortical actin may result in a gating function for the admission to the sites of exocytosis. To clarify how granule age, preceding metabolic conditions (“metabolic memory”), and the signals of metabolic amplification combine to generate the appropriate secretory responses will require further advances in the quantitative 4D live cell imaging of beta cells (132).
Conceptualization: RI, MM, BD. Experimentation: GB, BD, GS. Methodology: GB, BD, GS. Visualization: GB, BD, MM. Writing-original draft: RI. Writing-review and editing: GB, BD, GS, MM, RI. All authors contributed to the article and approved the submitted version.
The authors´ research cited in this review was supported by grants from the Deutsche Forschungsgemeinschaft to RI. (Ru 368/5-2 and 5-4). Further support was obtained by grants from the Deutsche Diabetes Gesellschaft to BD and GB.
The authors would like to thank Sabine Warmbold, Claudia Bütefisch and Verena Lier-Glaubitz for expert assistance with their work mentioned in this review.
The authors declare that the research was conducted in the absence of any commercial or financial relationships that could be construed as a potential conflict of interest.
All claims expressed in this article are solely those of the authors and do not necessarily represent those of their affiliated organizations, or those of the publisher, the editors and the reviewers. Any product that may be evaluated in this article, or claim that may be made by its manufacturer, is not guaranteed or endorsed by the publisher.
1. de Wit H. Morphological docking of secretory vesicles. Histochem Cell Biol (2010) 134:103–13. doi: 10.1007/s00418-010-0719-
2. Klenchin VA, Martin TF. Priming in exocytosis: Attaining fusion-competence after vesicle docking. Biochimie (2000) 82:399–407. doi: 10.1016/s0300-9084(00)00208-x
3. Easom RA. Beta-granule transport and exocytosis. Semin Cell Dev Biol (2000) 11:253–66. doi: 10.1006/scdb.2000.0174
4. Lacy PE. Beta cell secretion–from the standpoint of a pathobiologist. Diabetes (1970) 19:895–905. doi: 10.2337/diab.19.12.895
5. Lee JC, Grodsky GM, Bennett LL, Smith-Kyle DF, Craw L. Ultrastructure of beta-cells during the dynamic response to glucose and tolbutamide in vitro. Diabetologia (1970) 6:542–3. doi: 10.1007/BF00418219
6. Orci L, Perrelet A, Friend DS. Freeze-fracture of membrane fusions during exocytosis in pancreatic b-cells. J Cell Biol (1977) 75:23–30. doi: 10.1083/jcb.75.1.23
7. Grodsky GM. A threshold distribution hypothesis for packet storage of insulin and its mathematical modeling. J Clin Invest (1972) 51:2047–59. doi: 10.1172/JCI107011
8. Heinemann C, von Rüden L, Chow RH, Neher E. A two-step model of secretion control in neuroendocrine cells. Pflugers Arch (1993) 424:105–12. doi: 10.1007/BF00374600
9. Neher E. Vesicle pools and Ca2+ microdomains: New tools for understanding their roles in neurotransmitter release. Neuron (1998) 20:389–99. doi: 10.1016/s0896-6273(00)80983-6
10. O’Connor MD, Landahl HD, Grodsky GM. Comparison of storage- and signal-limited models of pancreatic insulin secretion. Am J Physiol (1980) 238:R378–89. doi: 10.1152/ajpregu.1980.238.5.R378
11. Howell SL, Taylor KW. The secretion of newly synthesized insulin in vitro. Biochem J (1967) 102:922–7. doi: 10.1042/bj1020922
12. Sando H, Borg J, Steiner DF. Studies on the secretion of newly synthesized proinsulin and insulin from isolated rat islets of langerhans. J Clin Invest (1972) 51:1476–85. doi: 10.1172/JCI106944
13. Rhodes CJ, Halban PA. Newly synthesized proinsulin/insulin and stored insulin are released from pancreatic b cells predominantly via a regulated, rather than a constitutive, pathway. J Cell Biol (1987) 105:145–53. doi: 10.1083/jcb.105.1.145
14. Gold G, Gishizky ML, Grodsky GM. Evidence that glucose “marks” beta cells resulting in preferential release of newly synthesized insulin. Science (1982) 218(4567):56–8. doi: 10.1126/science.6181562
15. Lindau M, Neher E. Patch-clamp techniques for time-resolved capacitance measurements in single cells. Pflugers Arch (1988) 411:137–46. doi: 10.1007/BF00582306
16. Katz B. Quantal mechanism of neural transmitter release. Science (1971) 173(3992):123–6. doi: 10.1126/science.173.3992.123
17. Göpel S, Zhang Q, Eliasson L, Ma XS, Galvanovskis J, Kanno T, et al. Capacitance measurements of exocytosis in mouse pancreatic alpha-, beta- and delta-cells within intact islets of langerhans. J Physiol (2004) 556:711–26. doi: 10.1113/jphysiol.2003.059675
18. Ammälä C, Eliasson L, Bokvist K, Larsson O, Ashcroft FM, Rorsman P. Exocytosis elicited by action potentials and voltage-clamp calcium currents in individual mouse pancreatic b-cells. J Physiol (1993) 472:665–88. doi: 10.1113/jphysiol.1993.sp019966
19. Asano T, Sasaki H, Okumura M. Characterisation of the effect of intravenous infusion of glucose and tolbutamide on the insulin delivery rate in man. Diabetologia (1978) 15:159–64. doi: 10.1007/BF00421232
20. Grodsky GM. A new phase of insulin secretion. How will it contribute to our understanding of beta-cell function? Diabetes (1989) 38:673–8. doi: 10.2337/diab.38.6.673
21. Rustenbeck I. Desensitization of insulin secretion. Biochem Pharmacol (2002) 63:1921–35. doi: 10.1016/s0006-2952(02)00996-6
22. Nesher R, Cerasi E. Biphasic Insulin release as the expression of combined inhibitory and potentiating effects of glucose. Endocrinology (1987) 121:1017–24. doi: 10.1210/endo-121-3-1017
23. Nesher R, Cerasi E. Modeling phasic insulin release: immediate and time-dependent effects of glucose. Diabetes (2002) 51 Suppl 1:S53–9. doi: 10.2337/diabetes.51.2007.S53
24. O’Connor MD, Landahl HD, Grodsky GM. Role of rate of change of glucose concentration as a signal for insulin release. Endocrinology (1977) 101:85–8. doi: 10.1210/endo-101-1-85
25. Cerasi E, Luft R, Efendic S. Decreased sensitivity of the pancreatic beta cells to glucose in prediabetic and diabetic subjects. A Glucose Dose-response Study Diabetes (1972) 21:224–34. doi: 10.2337/diab.21.4.224
26. Gerich JE. Is reduced first-phase insulin release the earliest detectable abnormality in individuals destined to develop type 2 diabetes? Diabetes (2002) 51 Suppl 1:S117–21. doi: 10.2337/diabetes.51.2007.S117
27. Del Prato S. Loss of early insulin secretion leads to postprandial hyperglycaemia. Diabetologia (2003) 46 Suppl 1:M2–8. doi: 10.1007/s00125-002-0930-6
28. Omar-Hmeadi M, Idevall-Hagren O. Insulin granule biogenesis and exocytosis. Cell Mol Life Sci (2021) 78:1957–70. doi: 10.1007/s00018-020-03688-4
29. Yau B, Hocking S, Andrikopoulos S, Kebede MA. Targeting the insulin granule for modulation of insulin exocytosis. Biochem Pharmacol (2021) 194:114821. doi: 10.1016/j.bcp.2021.114821
30. Ferri G, Pesce L, Tesi M, Marchetti P, Cardarelli F. β-cell pathophysiology: A review of advanced optical microscopy applications. Int J Mol Sci (2021) 22:12820. doi: 10.3390/ijms222312820
31. Barg S, Eliasson L, Renström E, Rorsman P. A subset of 50 secretory granules in close contact with l-type Ca2+ channels accounts for first-phase insulin secretion in mouse beta-cells. Diabetes (2002) 51 Suppl 1:S74–82. doi: 10.2337/diabetes.51.2007.s74
32. Rorsman P, Renström E. Insulin granule dynamics in pancreatic beta cells. Diabetologia (2003) 46:1029–45. doi: 10.1007/s00125-003-1153-1
33. Bokvist K, Eliasson L, Ammälä C, Renström E, Rorsman P. Co-Localization of l-type Ca2+ channels and insulin-containing secretory granules and its significance for the initiation of exocytosis in mouse pancreatic b-cells. EMBO J (1995) 14:50–7. doi: 10.1002/j.1460-2075.1995.tb06974.x
34. Ohara-Imaizumi M, Nakamichi Y, Tanaka T, Ishida H, Nagamatsu S. Imaging exocytosis of single insulin secretory granules with evanescent wave microscopy: Distinct behavior of granule motion in biphasic insulin release. J Biol Chem (2002) 277:3805–8. doi: 10.1074/jbc.C100712200
35. Hatlapatka K, Matz M, Schumacher K, Baumann K, Rustenbeck I. Bidirectional insulin granule turnover in the submembrane space during k(+) depolarization-induced secretion. Traffic (2011) 12:1166–78. doi: 10.1111/j.1600-0854.2011.01231.x
36. Watkins S, Geng X, Li L, Papworth G, Robbins PD, Drain P. Imaging secretory vesicles by fluorescent protein insertion in propeptide rather than mature secreted peptide. Traffic (2002) 3:461–71. doi: 10.1034/j.1600-0854.2002.30703.x
37. Michael DJ, Geng X, Cawley NX, Loh YP, Rhodes CJ, Drain P, et al. Fluorescent cargo proteins in pancreatic beta-cells: Design determines secretion kinetics at exocytosis. Biophys J (2004) 87:L03–5. doi: 10.1529/biophysj.104.052175
38. Pouli AE, Emmanouilidou E, Zhao C, Wasmeier C, Hutton JC, Rutter GA. Secretory-granule dynamics visualized in vivo with a phogrin-green fluorescent protein chimaera. Biochem J (1998) 333:193–9. doi: 10.1042/bj3330193
39. Ferri G, Digiacomo L, Lavagnino Z, Occhipinti M, Bugliani M, Cappello V, et al. Insulin secretory granules labelled with phogrin-fluorescent proteins show alterations in size, mobility and responsiveness to glucose stimulation in living β-cells. Sci Rep (2019) 9:2890. doi: 10.1038/s41598-019-39329-5
40. Ivanova A, Kalaidzidis Y, Dirkx R, Sarov M, Gerlach M, Schroth-Diez B, et al. Age-dependent labeling and imaging of insulin secretory granules. Diabetes (2013) 62:3687–96. doi: 10.2337/db12-1819
41. Gaus B, Brüning D, Hatlapatka K, Rustenbeck I. Changes in granule mobility and age contribute to changes in insulin secretion after desensitization or rest. BMJ Open Diabetes Res Care (2021) 9:e002394. doi: 10.1136/bmjdrc-2021-002394
42. Schumacher K, Matz M, Brüning D, Baumann K, Rustenbeck I. Granule mobility, fusion frequency and insulin secretion are differentially affected by insulinotropic stimuli. Traffic (2015) 16:493–509. doi: 10.1111/tra.12261
43. Patterson GH, Knobel SM, Sharif WD, Kain SR, Piston DW. Use of the green fluorescent protein and its mutants in quantitative fluorescence microscopy. Biophys J (1997) 73:2782–90. doi: 10.1016/S0006-3495(97)78307-3
44. Hutton JC. The internal pH and membrane potential of the insulin-secretory granule. Biochem J (1982) 204:171–8. doi: 10.1042/bj2040171
45. Stiernet P, Guiot Y, Gilon P, Henquin JC. Glucose acutely decreases pH of secretory granules in mouse pancreatic islets. Mechanisms and influence on insulin secretion. J Biol Chem (2006) 281:22142–51. doi: 10.1074/jbc.M513224200
46. Michael DJ, Xiong W, Geng X, Drain P, Chow RH. Human insulin vesicle dynamics during pulsatile secretion. Diabetes (2007) 56:1277–88. doi: 10.2337/db06-0367
47. Axelrod D, Thompson NL, Burghardt TP. Total internal inflection fluorescent microscopy. J Microsc (1983) 129:19–28. doi: 10.1111/j.1365-2818.1983.tb04158.x
48. Oheim M, Salomon A, Weissman A, Brunstein M, Becherer U. Calibrating evanescent-wave penetration depths for biological TIRF microscopy. Biophys J (2019) 117:795–809. doi: 10.1016/j.bpj.2019.07.048
49. Dehghany J, Hoboth P, Ivanova A, Mziaut H, Müller A, Kalaidzidis Y, et al. A spatial model of insulin-granule dynamics in pancreatic β-cells. Traffic (2015) 16:797–813. doi: 10.1111/tra.12286
50. Sheppard C. Axial resolution of confocal fluorescence microscopy. J Microsc (1989) 154:237–41. doi: 10.1111/j.1365-2818.1989.tb00586.x
51. Hao M, Li X, Rizzo MA, Rocheleau JV, Dawant BM, Piston DW. Regulation of two insulin granule populations within the reserve pool by distinct calcium sources. J Cell Sci (2005) 118:5873–84. doi: 10.1242/jcs.02684
52. Shimozawa T, Yamagata K, Kondo T, Hayashi S, Shitamukai A, Konno D, et al. Improving spinning disk confocal microscopy by preventing pinhole cross-talk for intravital imaging. Proc Natl Acad Sci USA (2013) 110:3399–404. doi: 10.1073/pnas.1216696110
53. Matz M, Schumacher K, Hatlapatka K, Lorenz D, Baumann K, Rustenbeck I. Observer-independent quantification of insulin granule exocytosis and pre-exocytotic mobility by TIRF microscopy. Microsc Microanal (2014) 20:206–18. doi: 10.1017/S1431927613013767
54. Ohara-Imaizumi M, Nishiwaki C, Nakamichi Y, Kikuta T, Nagai S, Nagamatsu S. Correlation of syntaxin-1 and SNAP-25 clusters with docking and fusion of insulin granules analysed by total internal reflection fluorescence microscopy. Diabetologia (2004) 47:2200–7. doi: 10.1007/s00125-004-1579-0
55. Gandasi NR, Barg S. Contact-induced clustering of syntaxin and munc18 docks secretory granules at the exocytosis site. Nat Commun (2014) 5:3914. doi: 10.1038/ncomms4914
56. Ma L, Bindokas VP, Kuznetsov A, Rhodes C, Hays L, Edwardson JM, et al. Direct imaging shows that insulin granule exocytosis occurs by complete vesicle fusion. Proc Natl Acad Sci USA (2004) 101:9266–71. doi: 10.1073/pnas.0403201101
57. Michael DJ, Cai H, Xiong W, Ouyang J, Chow RH. Mechanisms of peptide hormone secretion. Trends Endocrinol Metab (2006) 17:408–15. doi: 10.1016/j.tem.2006.10.011
58. Nagamatsu S, Ohara-Imaizumi M, Nakamichi Y, Kikuta T, Nishiwaki C. Imaging docking and fusion of insulin granules induced by antidiabetes agents: Sulfonylurea and glinide drugs preferentially mediate the fusion of newcomer, but not previously docked, insulin granules. Diabetes (2006) 55:2819–25. doi: 10.2337/db06-0105
59. Shibasaki T, Takahashi H, Miki T, Sunaga Y, Matsumura K, Yamanaka M, et al. Essential role of Epac2/Rap1 signaling in regulation of insulin granule dynamics by cAMP. Proc Natl Acad Sci USA (2007) 104:19333–8. doi: 10.1073/pnas.0707054104
60. Seino S, Takahashi H, Fujimoto W, Shibasaki T. Roles of cAMP signalling in insulin granule exocytosis. Diabetes Obes Metab (2009) 11 Suppl 4:180–8. doi: 10.1111/j.1463-1326.2009.01108.x
61. Gomi H, Mizutani S, Kasai K, Itohara S, Izumi T. Granuphilin molecularly docks insulin granules to the fusion machinery. J Cell Biol (2005) 171:99–109. doi: 10.1083/jcb.200505179
62. Kasai K, Fujita T, Gomi H, Izumi T. Docking is not a prerequisite but a temporal constraint for fusion of secretory granules. Traffic (2008) 9:1191–203. doi: 10.1111/j.1600-0854.2008.00744.x
63. Takahashi N, Hatakeyama H, Okado H, Noguchi J, Ohno M, Kasai H. SNARE conformational changes that prepare vesicles for exocytosis. Cell Metab (2010) 12:19–29. doi: 10.1016/j.cmet.2010.05.013
64. Takahashi N, Sawada W, Noguchi J, Watanabe S, Ucar H, Hayashi-Takagi A, et al. Two-photon fluorescence lifetime imaging of primed SNARE complexes in presynaptic terminals and β cells. Nat Commun (2015) 6:8531. doi: 10.1038/ncomms9531
65. Nofal S, Becherer U, Hof D, Matti U, Rettig J. Primed vesicles can be distinguished from docked vesicles by analyzing their mobility. J Neurosci (2007) 27:1386–95. doi: 10.1523/JNEUROSCI.4714-06.2007
66. Brüning D, Reckers K, Drain P, Rustenbeck I. Glucose but not KCl diminishes submembrane granule turnover in mouse beta-cells. J Mol Endocrinol (2017) 59:311–24. doi: 10.1530/JME-17-0063
67. Gerber SH, Südhof TC. Molecular determinants of regulated exocytosis. Diabetes (2002) 51 Suppl 1:S3–S11. doi: 10.2337/diabetes.51.2007.s3
68. Hisatomi M, Hidaka H, Niki I. Ca2+/calmodulin and cyclic 3,5’ adenosine monophosphate control movement of secretory granules through protein phosphorylation/dephosphorylation in the pancreatic beta-cell. Endocrinology (1996) 137:4644–9. doi: 10.1210/endo.137.11.8895328
69. Niki I, Niwa T, Yu W, Budzko D, Miki T, Senda T. Ca2+ influx does not trigger glucose-induced traffic of the insulin granules and alteration of their distribution. Exp Biol Med (Maywood) (2003) 228:1218–26. doi: 10.1177/153537020322801019
70. Baltrusch S, Lenzen S. Monitoring of glucose-regulated single insulin secretory granule movement by selective photoactivation. Diabetologia (2008) 51:989–96. doi: 10.1007/s00125-008-0979-y
71. Gembal M, Gilon P, Henquin JC. Evidence that glucose can control insulin release independently from its action on ATP-sensitive k+ channels in mouse b cells. J Clin Invest (1992) 89:1288–95. doi: 10.1172/JCI115714
72. Straub SG, Sharp GW. Hypothesis: one rate-limiting step controls the magnitude of both phases of glucose-stimulated insulin secretion. Am J Physiol Cell Physiol (2004) 287:C565–71. doi: 10.1152/ajpcell.00079.2004
73. Guček A, Gandasi NR, Omar-Hmeadi M, Bakke M, Døskeland SO, Tengholm A, et al. Fusion pore regulation by cAMP/Epac2 controls cargo release during insulin exocytosis. Elife (2019) 8:e41711. doi: 10.7554/eLife.41711
74. Hatlapatka K, Willenborg M, Rustenbeck I. Plasma membrane depolarization as a determinant of the first phase of insulin secretion. Am J Physiol Endocrinol Metab (2009) 297:E315–22. doi: 10.1152/ajpendo.90981.2008
75. Willenborg M, Belz M, Schumacher K, Paufler A, Hatlapatka K, Rustenbeck I. Ca(2+)-dependent desensitization of insulin secretion by strong potassium depolarization. Am J Physiol Endocrinol Metab (2012) 303:E223–33. doi: 10.1152/ajpendo.00010.2012
76. Belz M, Willenborg M, Görgler N, Hamada A, Schumacher K, Rustenbeck I. Insulinotropic effect of high potassium concentration beyond plasma membrane depolarization. Am J Physiol Endocrinol Metab (2014) 306:E697–706. doi: 10.1152/ajpendo
77. Takahashi N, Kishimoto T, Nemoto T, Kadowaki T, Kasai H. Fusion pore dynamics and insulin granule exocytosis in the pancreatic islet. Science (2002) 297(5585):1349–52. doi: 10.1126/science.1073806
78. Ohara-Imaizumi M, Aoyagi K, Nakamichi Y, Nishiwaki C, Sakurai T, Nagamatsu S. Pattern of rise in subplasma membrane Ca2+ concentration determines type of fusing insulin granules in pancreatic beta cells. Biochem Biophys Res Commun (2009) 385:291–5. doi: 10.1016/j.bbrc.2009.04.155
79. Pedersen MG, Sherman A. Newcomer insulin secretory granules as a highly calcium-sensitive pool. Proc Natl Acad Sci USA (2009) 106:7432–6. doi: 10.1073/pnas.0901202106
80. Ohara-Imaizumi M, Fujiwara T, Nakamichi Y, Okamura T, Akimoto Y, Kawai J, et al. Imaging analysis reveals mechanistic differences between first- and second-phase insulin exocytosis. J Cell Biol (2007) 177:695–705. doi: 10.1083/jcb.200608132
81. Parekh AB. Ca2+ microdomains near plasma membrane Ca2+ channels: Impact on cell function. J Physiol (2008) 586:3043–54. doi: 10.1113/jphysiol.2008.153460
82. Llinás R, Sugimori M, Silver RB. Microdomains of high calcium concentration in a presynaptic terminal. Science (1992) 256(5057):677–9. doi: 10.1126/science.1350109
83. Hoppa MB, Collins S, Ramracheya R, Hodson L, Amisten S, Zhang Q, et al. Chronic palmitate exposure inhibits insulin secretion by dissociation of Ca(2+) channels from secretory granules. Cell Metab (2009) 10:455–65. doi: 10.1016/j.cmet.2009.09.011
84. Gandasi NR, Yin P, Riz M, Chibalina MV, Cortese G, Lund PE, et al. Ca2+ channel clustering with insulin-containing granules is disturbed in type 2 diabetes. J Clin Invest (2017) 127:2353–64. doi: 10.1172/JCI88491
85. Fu J, Githaka JM, Dai X, Plummer G, Suzuki K, Spigelman AF, et al. A glucose-dependent spatial patterning of exocytosis in human β-cells is disrupted in type 2 diabetes. JCI Insight (2019) 5:e127896. doi: 10.1172/jci.insight.127896
86. Henquin JC. Triggering and amplifying pathways of regulation of insulin secretion by glucose. Diabetes (2000) 49:1751–60. doi: 10.2337/diabetes.49.11.1751
87. Rustenbeck I, Schulze T, Morsi M, Alshafei M, Panten U. What is the metabolic amplification of insulin secretion and is it (Still) relevant? Metabolites (2021) 11:355. doi: 10.3390/metabo11060355
88. Ravier MA, Cheng-Xue R, Palmer AE, Henquin JC, Gilon P. Subplasmalemmal Ca(2+) measurements in mouse pancreatic beta cells support the existence of an amplifying effect of glucose on insulin secretion. Diabetologia (2010) 53:1947–57. doi: 10.1007/s00125-010-1775-z
89. Emmanouilidou E, Teschemacher AG, Pouli AE, Nicholls LI, Seward EP, Rutter GA. Imaging Ca2+ concentration changes at the secretory vesicle surface with a recombinant targeted cameleon. Curr Biol (1999) 9:915–8. doi: 10.1016/s0960-9822(99)80398-4
90. Ohara-Imaizumi M, Aoyagi K, Yamauchi H, Yoshida M, Mori MX, Hida Y, et al. ELKS/Voltage-dependent Ca 2+ channel-β subunit module regulates polarized Ca 2+ influx in pancreatic β cells. Cell Rep (2019) 26:1213–1226.e7. doi: 10.1016/j.celrep.2018.12.106
91. Seino S, Shibasaki T, Minami K. Dynamics of insulin secretion and the clinical implications for obesity and diabetes. J Clin Invest (2011) 121:2118–25. doi: 10.1172/JCI45680
92. Mizuno K, Ramalho JS, Izumi T. Exophilin8 transiently clusters insulin granules at the actin-rich cell cortex prior to exocytosis. Mol Biol Cell (2011) 22:1716–26. doi: 10.1091/mbc.E10-05-0404
93. Fan F, Matsunaga K, Wang H, Ishizaki R, Kobayashi E, Kiyonari H, et al. Exophilin-8 assembles secretory granules for exocytosis in the actin cortex via interaction with RIM-BP2 and myosin-VIIa. Elife (2017) 6:e26174. doi: 10.7554/eLife.26174
94. Wang H, Mizuno K, Takahashi N, Kobayashi E, Shirakawa J, Terauchi Y, et al. Melanophilin accelerates insulin granule fusion without predocking to the plasma membrane. Diabetes (2020) 69:2655–66. doi: 10.2337/db20-0069
95. Lam AD, Ismail S, Wu R, Yizhar O, Passmore DR, Ernst SA, et al. Mapping dynamic protein interactions to insulin secretory granule behavior with TIRF-FRET. Biophys J (2010) 99:1311–20. doi: 10.1016/j.bpj.2010.06.014
96. Mziaut H, Mulligan B, Hoboth P, Otto O, Ivanova A, Herbig M, et al. The f-actin modifier villin regulates insulin granule dynamics and exocytosis downstream of islet cell autoantigen 512. Mol Metab (2016) 5:656–68. doi: 10.1016/j.molmet.2016.05.015
97. Quinault A, Gausseres B, Bailbe D, Chebbah N, Portha B, Movassat J, et al. Disrupted dynamics of f-actin and insulin granule fusion in INS-1 832/13 beta-cells exposed to glucotoxicity: partial restoration by glucagon-like peptide 1. Biochim Biophys Acta (2016) 1862:1401–11. doi: 10.1016/j.bbadis.2016.04.007
98. Wang B, Lin H, Li X, Lu W, Kim JB, Xu A, et al. The adaptor protein APPL2 controls glucose-stimulated insulin secretion via f-actin remodeling in pancreatic β-cells. Proc Natl Acad Sci USA (2020) 117:28307–15. doi: 10.1073/pnas.2016997117
99. Ma W, Chang J, Tong J, Ho U, Yau B, Kebede MA, et al. Arp2/3 nucleates f-actin coating of fusing insulin granules in pancreatic β cells to control insulin secretion. J Cell Sci (2020) 133:jcs236794. doi: 10.1242/jcs.236794
100. Müller M, Glombek M, Powitz J, Brüning D, Rustenbeck I. A cellular automaton model as a first model-based assessment of interacting mechanisms for insulin granule transport in beta cells. Cells (2020) 9:1487. doi: 10.3390/cells9061487
101. Mourad NI, Nenquin M, Henquin JC. Metabolic amplifying pathway increases both phases of insulin secretion independently of beta-cell actin microfilaments. Am J Physiol Cell Physiol (2010) 299:C389–98. doi: 10.1152/ajpcell.00138.2010
102. Fan F, Ji C, Wu Y, Ferguson SM, Tamarina N, Philipson LH, et al. Dynamin 2 regulates biphasic insulin secretion and plasma glucose homeostasis. J Clin Invest (2015) 125:4026–41. doi: 10.1172/JCI80652
103. Fan F, Wu Y, Hara M, Rizk A, Ji C, Nerad D, et al. Dynamin deficiency causes insulin secretion failure and hyperglycemia. Proc Natl Acad Sci USA (2021) 118:e2021764118. doi: 10.1073/pnas.2021764118
104. Bracey KM, Ho KH, Yampolsky D, Gu G, Kaverina I, Holmes WR. Microtubules regulate localization and availability of insulin granules in pancreatic beta cells. Biophys J (2020) 118:193–206. doi: 10.1016/j.bpj.2019.10.031
105. Gaisano HY. Recent new insights into the role of SNARE and associated proteins in insulin granule exocytosis. Diabetes Obes Metab (2017) 19 Suppl 1:115–23. doi: 10.1111/dom.13001
106. Uchizono Y, Alarcón C, Wicksteed BL, Marsh BJ, Rhodes CJ. The balance between proinsulin biosynthesis and insulin secretion: Where can imbalance lead? Diabetes Obes Metab (2007) 9 Suppl 2:56–66. doi: 10.1111/j.1463-1326.2007.00774.x
107. Goginashvili A, Zhang Z, Erbs E, Spiegelhalter C, Kessler P, Mihlan M, et al. Insulin granules. insulin secretory granules control autophagy in pancreatic β cells. Science (2015) 347(6224):878–82. doi: 10.1126/science.aaa2628
108. Riahi Y, Wikstrom JD, Bachar-Wikstrom E, Polin N, Zucker H, Lee MS, et al. Autophagy is a major regulator of beta cell insulin homeostasis. Diabetologia (2016) 59:1480–91. doi: 10.1007/s00125-016-3868-9
109. Terskikh A, Fradkov A, Ermakova G, Zaraisky A, Tan P, Kajava AV, et al. “Fluorescent timer”: Protein that changes color with time. Science (2000) 290(5496):1585–8. doi: 10.1126/science.290.5496.1585
110. Duncan RR, Greaves J, Wiegand UK, Matskevich I, Bodammer G, Apps DK, et al. Functional and spatial segregation of secretory vesicle pools according to vesicle age. Nature (2003) 422(6928):176–80. doi: 10.1038/nature01389
111. Wiegand UK, Duncan RR, Greaves J, Chow RH, Shipston MJ, Apps DK. Red, yellow, green go!–A novel tool for microscopic segregation of secretory vesicle pools according to their age. Biochem Soc Trans (2003) 31:851–6. doi: 10.1042/bst0310851
112. Hoboth P, Müller A, Ivanova A, Mziaut H, Dehghany J, Sönmez A, et al. Aged insulin granules display reduced microtubule-dependent mobility and are disposed within actin-positive multigranular bodies. Proc Natl Acad Sci USA (2015) 112:E667–76. doi: 10.1073/pnas.1409542112
113. Yau B, Hays L, Liang C, Laybutt DR, Thomas HE, Gunton JE, et al. A fluorescent timer reporter enables sorting of insulin secretory granules by age. J Biol Chem (2020) 295:8901–11. doi: 10.1074/jbc.RA120.012432
114. Nesher R, Eylon L, Segal N, Cerasi E. Beta-cell memory to insulin secretagogues: Characterization of the time-dependent inhibitory control system in the isolated rat pancreas. Endocrinology (1989) 124:142–8. doi: 10.1210/endo-124-1-142
115. Michael DJ, Ritzel RA, Haataja L, Chow RH. Pancreatic beta-cells secrete insulin in fast- and slow-release forms. Diabetes (2006) 55:600–7. doi: 10.2337/diabetes.55.03.06.db05-1054
116. Tsuboi T, McMahon HT, Rutter GA. Mechanisms of dense core vesicle recapture following “kiss and run” (“cavicapture”) exocytosis in insulin-secreting cells. J Biol Chem (2004) 279:47115–24. doi: 10.1074/jbc.M408179200
117. Takahashi N. Imaging analysis of insulin secretion with two-photon microscopy. Biol Pharm Bull (2015) 38:656–62. doi: 10.1248/bpb.b14-00880
118. Karanauskaite J, Hoppa MB, Braun M, Galvanovskis J, Rorsman P. Quantal ATP release in rat beta-cells by exocytosis of insulin-containing LDCVs. Pflugers Arch (2009) 458:389–401. doi: 10.1007/s00424-008-0610-6
119. Lombardi T, Montesano R, Wohlwend A, Amherdt M, Vassalli JD, Orci L. Evidence for polarization of plasma membrane domains in pancreatic endocrine cells. Nature (1985) 313(6004):694–6. doi: 10.1038/313694a0
120. Ohara-Imaizumi M, Ohtsuka T, Matsushima S, Akimoto Y, Nishiwaki C, Nakamichi Y, et al. ELKS, a protein structurally related to the active zone-associated protein CAST, is expressed in pancreatic beta cells and functions in insulin exocytosis: Interaction of ELKS with exocytotic machinery analyzed by total internal reflection fluorescence microscopy. Mol Biol Cell (2005) 16:3289–300. doi: 10.1091/mbc.e04-09-0816
121. Rutter GA, Loder MK, Ravier MA. Rapid three-dimensional imaging of individual insulin release events by nipkow disc confocal microscopy. Biochem Soc Trans (2006) 34:675–8. doi: 10.1042/BST0340675
122. Low JT, Zavortink M, Mitchell JM, Gan WJ, Do OH, Schwiening CJ, et al. Insulin secretion from beta cells in intact mouse islets is targeted towards the vasculature. Diabetologia (2014) 57:1655–63. doi: 10.1007/s00125-014-3252-6
123. Gan WJ, Do OH, Cottle L, Ma W, Kosobrodova E, Cooper-White J, et al. Local integrin activation in pancreatic β cells targets insulin secretion to the vasculature. Cell Rep (2018) 24:2819–2826.e3. doi: 10.1016/j.celrep.2018.08.035
124. Almaça J, Liang T, Gaisano HY, Nam HG, Berggren PO, Caicedo A. Spatial and temporal coordination of insulin granule exocytosis in intact human pancreatic islets. Diabetologia (2015) 58:2810–8. doi: 10.1007/s00125-015-3747-9
125. Bosco D, Orci L, Meda P. Homologous but not heterologous contact increases the insulin secretion of individual pancreatic b-cells. Exp Cell Res (1989) 184:72–80. doi: 10.1016/0014-4827(89)90365-0
126. Bavamian S, Klee P, Britan A, Populaire C, Caille D, Cancela J, et al. Islet-cell-to-cell communication as basis for normal insulin secretion. Diabetes Obes Metab (2007) 9 Suppl 2:118–32. doi: 10.1111/j.1463-1326.2007.00780.x
127. Luther MJ, Hauge-Evans A, Souza KL, Jörns A, Lenzen S, Persaud SJ, et al. MIN6 beta-cell-beta-cell interactions influence insulin secretory responses to nutrients and non-nutrients. Biochem Biophys Res Commun (2006) 343:99–104. doi: 10.1016/j.bbrc.2006.02.003
128. Chowdhury A, Dyachok O, Tengholm A, Sandler S, Bergsten P. Functional differences between aggregated and dispersed insulin-producing cells. Diabetologia (2013) 56:1557–68. doi: 10.1007/s00125-013-2903-3
129. Rondas D, Tomas A, Soto-Ribeiro M, Wehrle-Haller B, Halban PA. Novel mechanistic link between focal adhesion remodeling and glucose-stimulated insulin secretion. J Biol Chem (2012) 287:2423–36. doi: 10.1074/jbc.M111.279885
130. Noordstra I, van den Berg CM, Boot FWJ, Katrukha EA, Yu KL, Tas RP, et al. Organization and dynamics of the cortical complexes controlling insulin secretion in β-cells. J Cell Sci (2022) 135:jcs259430. doi: 10.1242/jcs.259430
131. Kalwat MA, Thurmond DC. Signaling mechanisms of glucose-induced f-actin remodeling in pancreatic islet β cells. Exp Mol Med (2013) 45:e37. doi: 10.1038/emm.2013.73
Keywords: actin, calcium, insulin granules, insulin secretion, pancreatic islet, TIRF microscopy
Citation: Gaus B, Brüning D, Groß S, Müller M and Rustenbeck I (2022) The changing view of insulin granule mobility: From conveyor belt to signaling hub. Front. Endocrinol. 13:983152. doi: 10.3389/fendo.2022.983152
Received: 30 June 2022; Accepted: 11 August 2022;
Published: 02 September 2022.
Edited by:
Manami Hara, The University of Chicago, United StatesReviewed by:
Xuelin Lou, Medical College of Wisconsin, United StatesCopyright © 2022 Gaus, Brüning, Groß, Müller and Rustenbeck. This is an open-access article distributed under the terms of the Creative Commons Attribution License (CC BY). The use, distribution or reproduction in other forums is permitted, provided the original author(s) and the copyright owner(s) are credited and that the original publication in this journal is cited, in accordance with accepted academic practice. No use, distribution or reproduction is permitted which does not comply with these terms.
*Correspondence: Ingo Rustenbeck, aS5ydXN0ZW5iZWNrQHR1LWJzLmRl
Disclaimer: All claims expressed in this article are solely those of the authors and do not necessarily represent those of their affiliated organizations, or those of the publisher, the editors and the reviewers. Any product that may be evaluated in this article or claim that may be made by its manufacturer is not guaranteed or endorsed by the publisher.
Research integrity at Frontiers
Learn more about the work of our research integrity team to safeguard the quality of each article we publish.