 Jie Ming
 Si Ri Gu Leng Sana2*
- 1Department of Urology, The First Affiliated Hospital of Harbin Medical University, Harbin, China
- 2Department of Anaesthesiology, The First Affiliated Hospital of Harbin Medical University, Harbin, China
- 3Department of Anaesthesiology, The Second Affiliated Hospital of Harbin Medical University, Harbin, China
Background: Diabetic nephropathy (DN) is a chronic microvascular complication in patients with diabetes mellitus, which is the leading cause of end-stage renal disease. However, the role of copper-related genes (CRGs) in DN development remains unclear.
Materials and methods: CRGs were acquired from the GeneCards and NCBI databases. Based on the GSE96804 and GSE111154 datasets from the GEO repository, we identified hub CRGs for DN progression by taking the intersection of differentially expressed CRGs (DECRGs) and genes in the key module from Weighted Gene Co-expression Network Analysis. The Maximal Clique Centrality algorithm was used to identify the key CRGs from hub CRGs. Transcriptional factors (TFs) and microRNAs (miRNAs) targeting hub CRGs were acquired from publicly available databases. The CIBERSORT algorithm was used to perform comparative immune cell infiltration analysis between normal and DN samples.
Results: Eighty-two DECRGs were identified between normal and DN samples, as were 10 hub CRGs, namely PTGS2, DUSP1, JUN, FOS, S100A8, S100A12, NAIP, CLEC4E, CXCR1, and CXCR2. Thirty-nine TFs and 165 miRNAs potentially targeted these 10 hub CRGs. PTGS2 was identified as the key CRG and FOS as the most significant gene among all of DECRGs. RELA was identified as the hub TF interacting with PTGS2 by taking the intersection of potential TFs from the ChEA and JASPAR public databases. let-7b-5p was identified as the hub miRNA targeting PTGS2 by taking the intersection of miRNAs from the miRwalk, RNA22, RNAInter, TargetMiner, miRTarBase, and ENCORI databases. Similarly, CREB1, E2F1, and RELA were revealed as hub TFs for FOS, and miR-338-3p as the hub miRNA. Finally, compared with those in healthy samples, there are more infiltrating memory B cells, M1 macrophages, M2 macrophages, and resting mast cells and fewer infiltrating activated mast cells and neutrophils in DN samples (all p< 0.05).
Conclusion: The 10 identified hub copper-related genes provide insight into the mechanisms of DN development. It is beneficial to examine and understand the interaction between hub CRGs and potential regulatory molecules in DN. This knowledge may provide a novel theoretical foundation for the development of diagnostic biomarkers and copper-related therapy targets in DN.
Introduction
Diabetes mellitus (DM) currently affects more than 350 million individuals worldwide. The number of affected is expected to exceed 600 million by 2045 (1, 2). Diabetic nephropathy (DN) is a chronic microvascular complication that develops in approximately 30% of all patients with DM. DN is characterized by a persistent increase of albuminuria, defined as >300 mg in a 24-h period or an albumin-to-creatinine ratio >300 mg/g, decreased glomerular filtration rate (GFR), increased blood pressure, and excessive risk of cardiovascular complications and concomitant diabetic retinopathy (3). Despite multifactorial treatments that include glycemic, lipid, and blood pressure control (4), renin-angiotensin system inhibitors including angiotensin-converting enzyme inhibitors (5) and angiotensin receptor blockers (6), peroxisome proliferator-activated receptor agonists (7), PKC antagonist (8), the angiotensin-converting enzyme inhibitor pyridoxamine (9), and endothelin receptor inhibitors like atrasentan (10), DN is the main cause of end-stage renal disease (ESRD) with a high disability and mortality in western countries. Therefore, it makes sense to consider new therapeutic approaches for DN based on novel potential mechanisms.
Copper (Cu) is a crucial trace element that is a structural component of enzymes. Cu regulates signaling pathways with many key roles in various biological processes, such as antioxidant activity, mitochondrial respiration, metabolic reprograming, enhanced proliferation (cuproplasia), and angiogenesis (11). Normally, Cu concentrations in cells are kept at an extremely low level by active homeostatic mechanisms that function across concentration gradients (12, 13). The elevated intracellular concentration of Cu exceeding a threshold can be cytotoxic and result in cell death. However, the specific and complete mechanisms of Cu-induced cell death remain unclear and contradictory despite decades of research. Some research indicates that the massive accumulation of reactive oxidative species (ROS) caused by increased level of Cu ions in cells results in apoptosis or autophagy (14–19). However, other studies indicate that Cu-induced toxicity is dependent on the inhibition of the ubiquitin-proteasome system (20–23). A recent study by Tsvetkov et al. provided the novel proposal that Cu targets lipoylated tricarboxylic acid cycle proteins to induce cell death (cuproptosis) independent of the currently known forms of cell death, including ferroptosis, apoptosis, necroptosis, and oxidative stress (24). Seven key genes are involved in cuproptosis. These include Ferredoxin 1 encoded by FDX1. FDX1 is a reductase responsible for the reduction of Cu2+ to Cu1+ and is an upstream regulator of protein lipoylation. The remaining six genes include three genes that encode proteins of the lipoic acid pathway [i.e., lipoyl synthase (LIAS), lipolytransferase 1 (LIPT1), and dihydrolipoamide dehydrogenase (DLD)] and three genes that synthesize protein targets of lipoylation [pyruvate dehydrogenase E1 subunit alpha 1 (PDHA1), pyruvate dehydrogenase E1 subunit beta (PDHB), and dihydrolipoamide S-acetyltransferase (DLAT)]. It is believed that excessive cellular Cu results in aggregation of lipoylated proteins and degradation of Fe-S cluster proteins, leading to proteotoxic stress and subsequently cuproptosis (24).
Some Cu agents have shown promising potential in the treatment of various diseases. For example, Skrott et al. tested the cytotoxicity of the ditiocarb-copper complex (CuET) on a panel of Velcade/Carfilzomib-adapted human cell lines. CuET was implicated as a promising therapeutic agent for patients with recurrent, Velcade-resistant multiple myeloma (20). A statistically significant doubling of progression-free survival time was observed with elesclomol plus paclitaxel compared to that of paclitaxel alone in a phase III clinical trial for melanoma (25). Allensworth et al. found that disulfiram produced oxidative stress-mediated apoptosis involving the inhibition of NF-κB signaling and the reduction of levels of aldehyde dehydrogenase and antioxidant in a multi-inflammatory breast cancer cellular model (26). However, few studies have focused on the role of Cu agents in DN (27).
In the present study, we aimed to identify hub Cu-related genes (CRGs) and predict the potential molecular regulation network. The findings may provide a novel theoretical foundation for the development of diagnostic biomarkers and therapy targets in DN.
Materials and methods
Datasets and pre-processing
Two DN-related microarray datasets (GSE96804 and GSE111154) were downloaded from the Gene Expression Omnibus (GEO) repository (https://www.ncbi.nlm.nih.gov/geo/). Both datasets were acquired from the GPL17586 platform.
R software (version 4.1.2) was used to perform data processing. The probes were mapped to the gene via Strawberry Perl (version 5.32.1.1) while no-load probes were removed. The mean value was calculated if more than one probes matched to the same gene. Normalization is a data analysis method that adjusts global properties of measurements for individual samples. This method helps to reduce the global differences of the data distribution (28). In our study, gene expression values were first converted to log2-transformed quantile-normalized signal intensity. Then the log2-transformed matrix was normalized via the normalizeBetweenArrays function of limma package to achieve consistency between arrays (29). Batch effects are subgroups of measures that exhibit qualitatively different behavior under different conditions. Batch effects can pose serious concerns about the validity of biological findings despite being unrelated to biological variables in medical research (28). Therefore, the ComBat function of SVA package was used to eliminate the batch effect after the normalization of gene expression values (30). Using the code “data=data[apply(data,1,sd)>0.5]”, we deleted less variable genes between normal and DN samples (standard deviation > 0.5). Ultimately, 3044 genes were subjected to Weighted Gene Co-expression Network Analysis (WGCNA).
Use of WGCNA to identify gene modules most related to the development of DN
WGCNA is a systematic approach that can investigate the association between gene networks and a quantitative measure (referred to as sample trait). The analysis identifies co-expressed gene modules with pronounced biological significance (31). In our study, the binary indicator variable (DN status) was taken as the sample trait, which helped to find the co-expressed gene modules with DN. The WGCNA package was used to perform co-expression network analysis. We normalized the samples and removed the outlined samples to ensure the reliability of the network construction. Subsequently, the adjacent matrix that described the correlation strength between genes was obtained through the formula listed as follows:
where i and j are two individual genes and Sij represents the Pearson’s correlation coefficient between genes i and j. Power is a function where Sij is the base and β is the power that is identified by pickSoftThreshold function. Subsequently, the adjacent matrix was transformed into a topological overlap matrix (TOM). We set the deepSplit value and minimum number of genes in the module as 2 and 50, respectively. Average linkage hierarchical clustering was performed to identify modules of closely interacting genes. A height cutoff of 0.25 was selected as the criterion to merge modules with similar gene profiles using the DynamicTreeCut algorithm.
To identify the biologically significant gene module, several metrics were included as the assessment criteria. These included module eigengenes (MEs), gene significance (GS), and module significance (MS) (31). MEs are defined as the first principal component of each gene module, which is regarded as a representative of all genes in a given module. The significant gene module is determined by the correlation coefficient between MEs and the corresponding disease status. GS is defined as the correlation between gene expression profiles and an external clinical trait including disease status (GS = -lg p). This metric helps to incorporate external clinical information into the co-expression network. The biological significance of the gene increases with the absolute value of GS. MS is defined as the average absolute GS measure for all genes within a given module. MS is used to screen and incorporate the significant gene module.
Identification of hub CRGs
By searching the key word “copper” in GeneCards (https://www.genecards.org/) and National Center for Biotechnology Information (NCBI, https://www.ncbi.nlm.nih.gov/) database (only for genes of homo sapiens), we obtained 2142 CRGs summarized in Supplementary Table 1.
We first acquired differentially expressed CRGs (DECRGs) between normal and DN samples using the LIMMA package with the criteria of |log2 fold change| ≥ 1.0 and adjusted p< 0.05. The intersection of DECRGs and genes in the most biologically significant module identified by WGCNA were regarded as the hub CRGs. Venn diagram was plotted through the VennDiagram package.
Prediction of transcription factors and microRNAs associated with hub CRGs
To explore the potential changes and molecular regulatory mechanisms happening at the transcriptional level for hub CRGs, we tried to decode the regulatory TFs and miRNAs using a network-based approach. Topologically credible TFs were identified from the JASPAR and ChEA repositories on the NetworkAnalyst platform (https://www.networkanalyst.ca/). The intersection of TFs from both repositories was used to obtain the hub TFs. Similarly, miRNAs targeting hub CRGs from six repositories, namely ENCORI (https://starbase.sysu.edu.cn/), miRWalk (http://mirwalk.umm.uni-heidelberg.de/), RNA22 (https://cm.jefferson.edu/rna22/), RNAInter (http://www.rnainter.org/), TargetMiner (https://www.isical.ac.in/~bioinfo_miu/targetminer20.htm), and miRTarBase (https://www.networkanalyst.ca/), were identified. The intersecting miRNAs were also identified and retained. Among these repositories, miRTarBase is the major experimentally validated database for miRNA-target RNA interactions (32).
Functional enrichment analysis and protein–protein interaction network construction
The functional enrichment analysis was performed to identify the corresponding biological pathways involved in the hub CRGs. Gene ontology (GO) enrichment analysis interpreted the biological significance of genes from three perspectives: biological process (BP), cellular component (CC), and molecular function (MF). Kyoto Encyclopedia of Genes and Genomes (KEGG) pathway analysis was used to systematically assess gene function. The “Clusterprofiler” package was employed to automate the enrichment analysis of gene clusters. The “org.Hs.eg.db” package was used for conversion between gene IDs (33).
Proteins execute their respective important biological functions through mutual affinity within the cell to form the PPI network. The STRING database permits wide coverage and completeness of evidence sources by integrating all known and predicted physical and functional associations between proteins. Accordingly, this database has been chosen as one of the European Core Data Resources by the ELIXIR consortium (34) and is currently used by approximately 5000 users each day. The database collects and scores evidence of PPI from four sources: automated text mining of the literature, databases of annotated complexes or pathways and interaction experiments, predictions of computational interactions based on co-expression and conserved genomic context, and transfer of interaction evidence between organisms in a systematic manner (35). Data integration across various evidence sources improves the overall network quality (36–39). STRING was reported to have the greatest ability to recover a diverse collection of disease-associated gene sets among 21 human gene–gene interaction network databases (40). Accordingly, we created the PPI network to acquire the insights into cellular machinery operations through the STRING database (https://cn.string-db.org/). We set the minimum required interaction scores as the highest confidence (0.900) and hid the disconnected nodes to generate the PPI network. Cytoscape (version 3.9.0) software was used to further present and integrate biomolecular interaction networks. Subsequently, we used cytohubba (http://apps.cytoscape.org/apps/cytohubba) to rank and screen the central or targeted elements of the network. Cytohubba is a Cytoscape plugin comprising 11 methods for investigating networks from different viewpoints. The methods include Maximal Clique Centrality (MCC), Maximum Neighborhood Component, Density of Maximum Neighborhood Component, Closeness (Clo), EcCentricity (EC), Radiality (Rad), BottleNeck (BN), Stress (Str), Betweenness (BC), Edge Percolated Component, and Degree. Among these methods, we chose MCC, since it has been identified as the best method to screen hub CRGs (41).
CIBERSORT immune cell infiltration analysis
Cell-type Identification By Estimating Relative Subsets Of RNA Transcripts (CIBERSORT) is a gene expression profile-based method for determining the cell composition of complex tissues. The method includes expression data of 22 immune cells (LM22) and performs better than other methods considering noise, unknown mixture components, and cell types (42). We used the CIBERSORT algorithm to analyze the normalized RNA sequence (RNA seq) data and acquire the immune infiltration status for each sample.
Pearson correlation coefficient was calculated to measure the correlation between the expression of hub gene and immune cell infiltration levels.
Results
The flow chart of this study is shown in Figure 1.
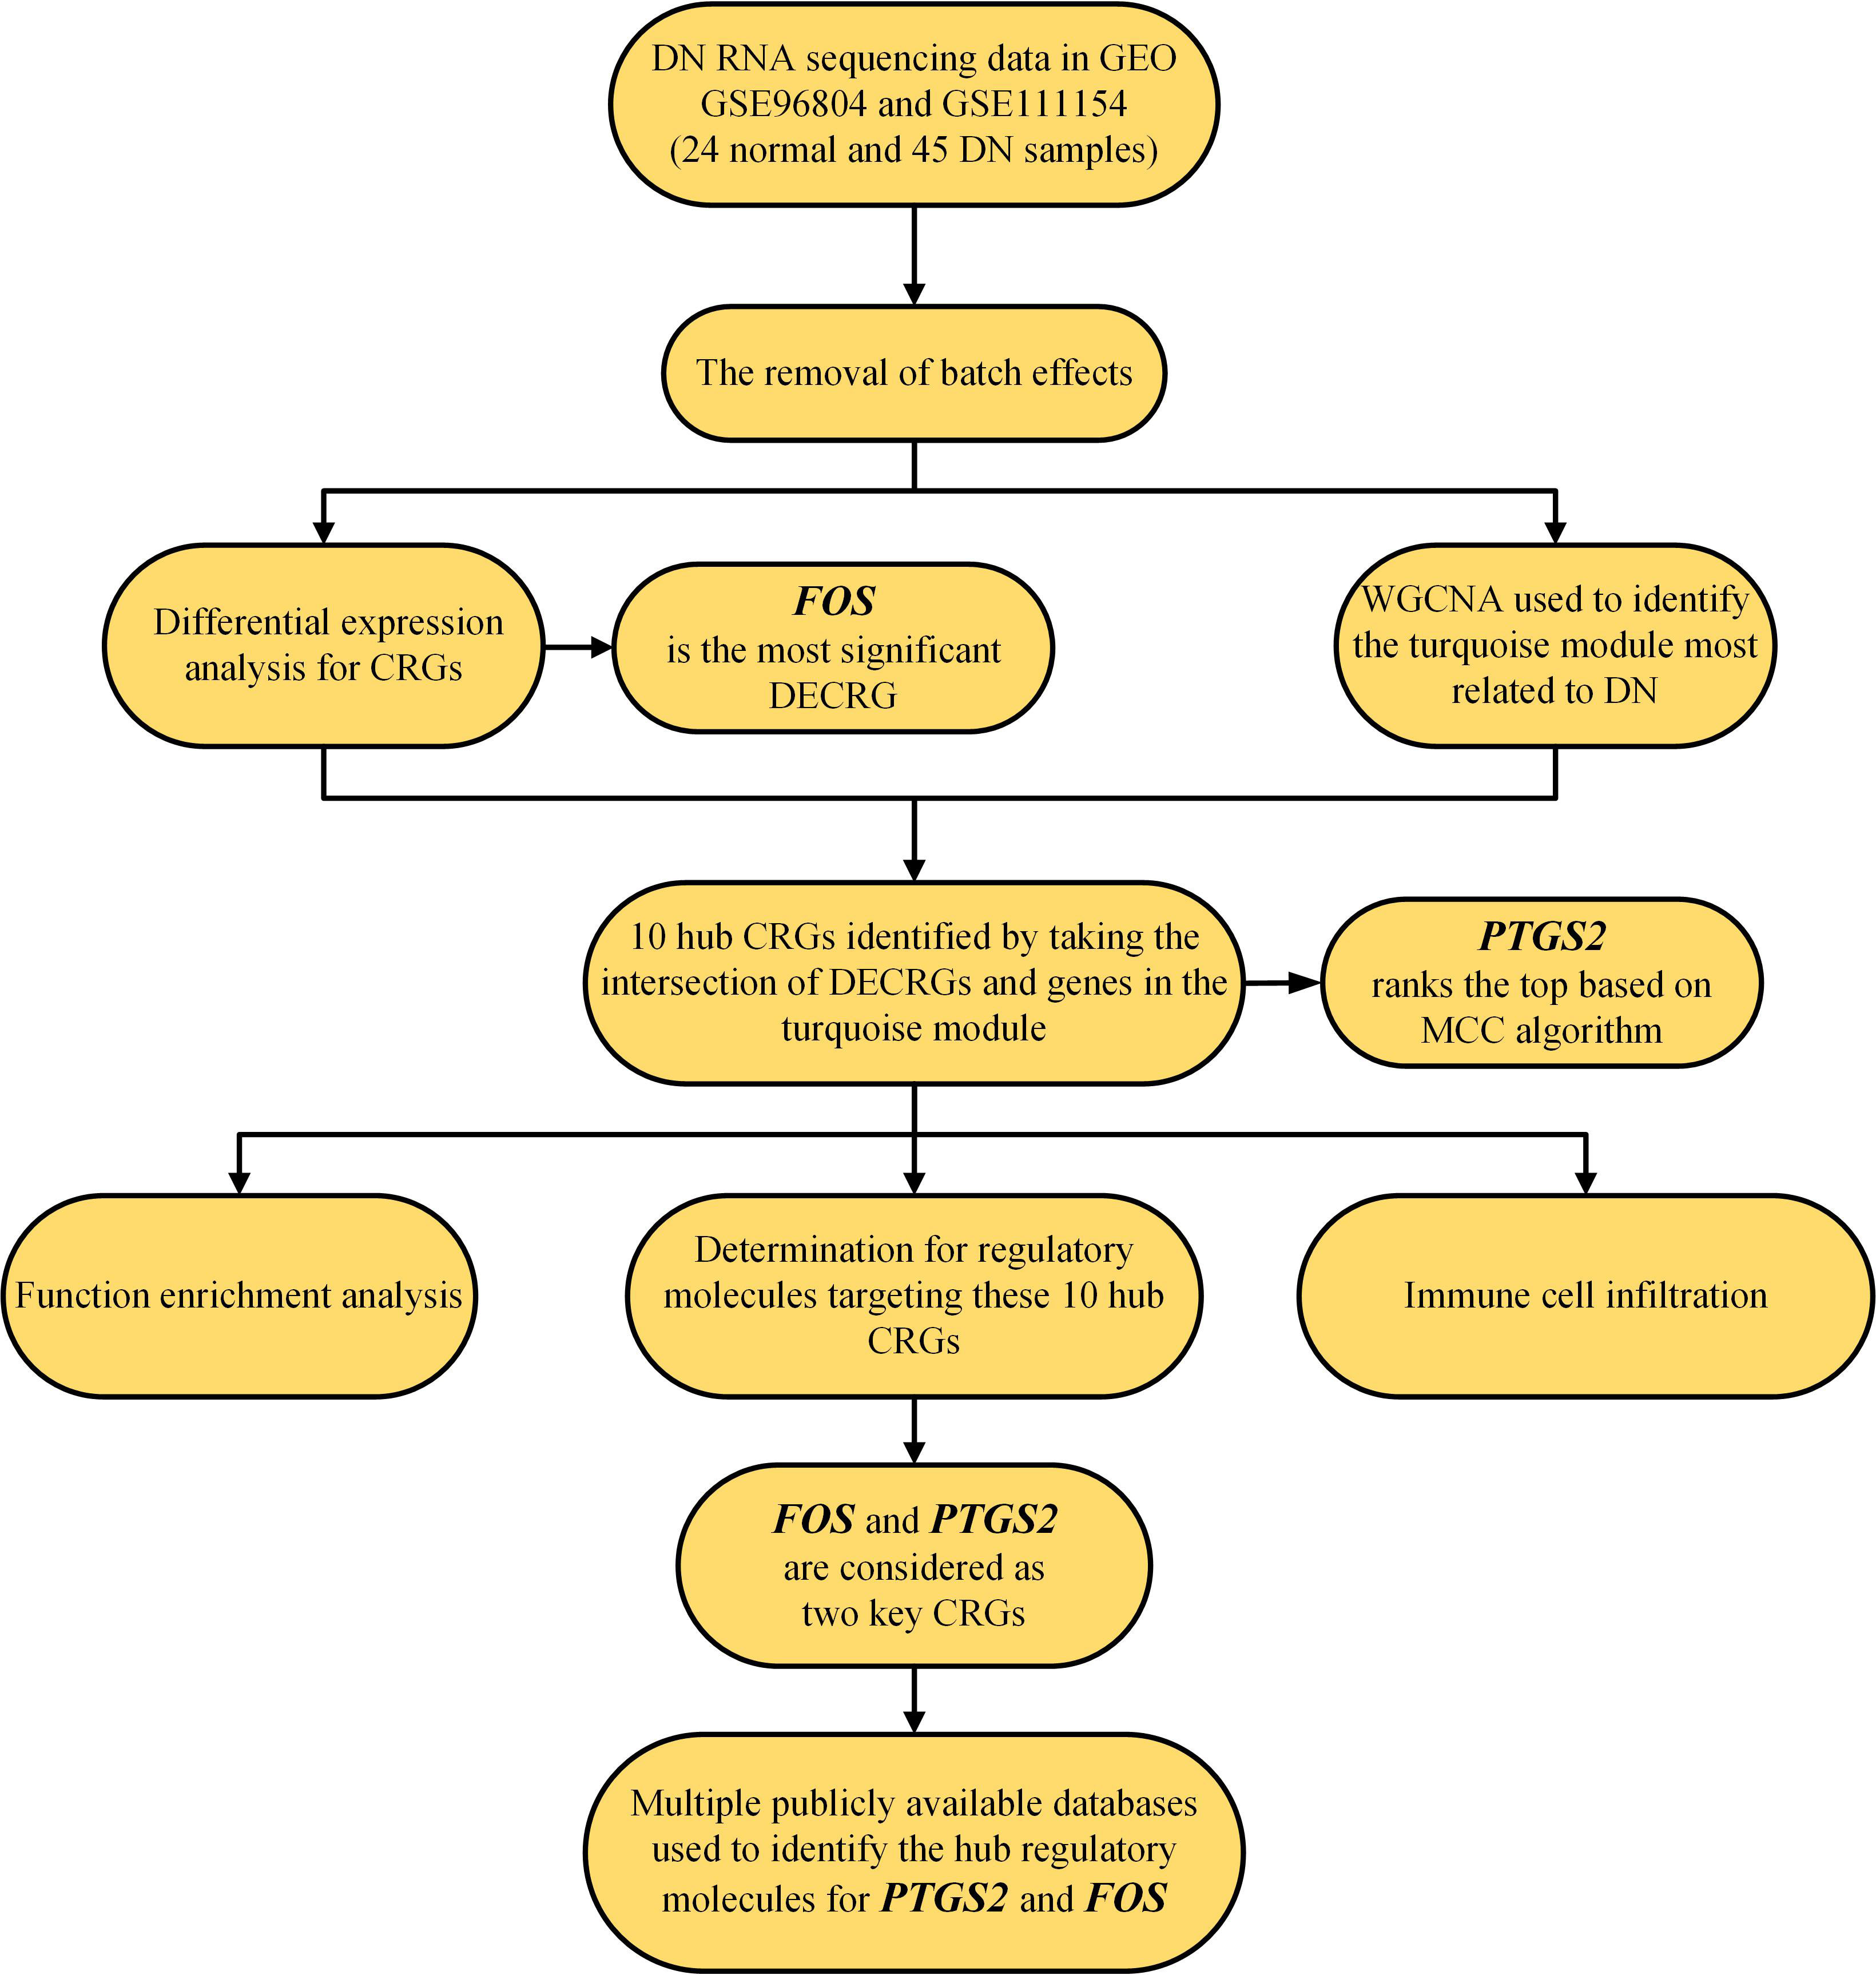
Figure 1 Flow chart of this study. CRG, copper-related gene; DECRGs, differentially expressed copper-related genes; and DN, diabetic nephropathy.
Removal of batch effects
Despite the use of two datasets (GSE968034 and GSE111154) acquired from the same GPL17586 platform, there were still batch effects for the measurements affected by laboratory conditions, reagent lots, processing date, personnel differences, and other causes (28). Therefore, the ComBat function of the SVA package was used to eliminate the potentially unwanted sources of variation. Before the removal of batch effects, samples were clustered by batches based on principal component analysis (PCA) of unnormalized gene expression values (Figure 2A). By contrast, samples were all mixed together after removing batch effects based on the first two principal components (Figure 2B). The results confirmed the success of the removal of batch effects.
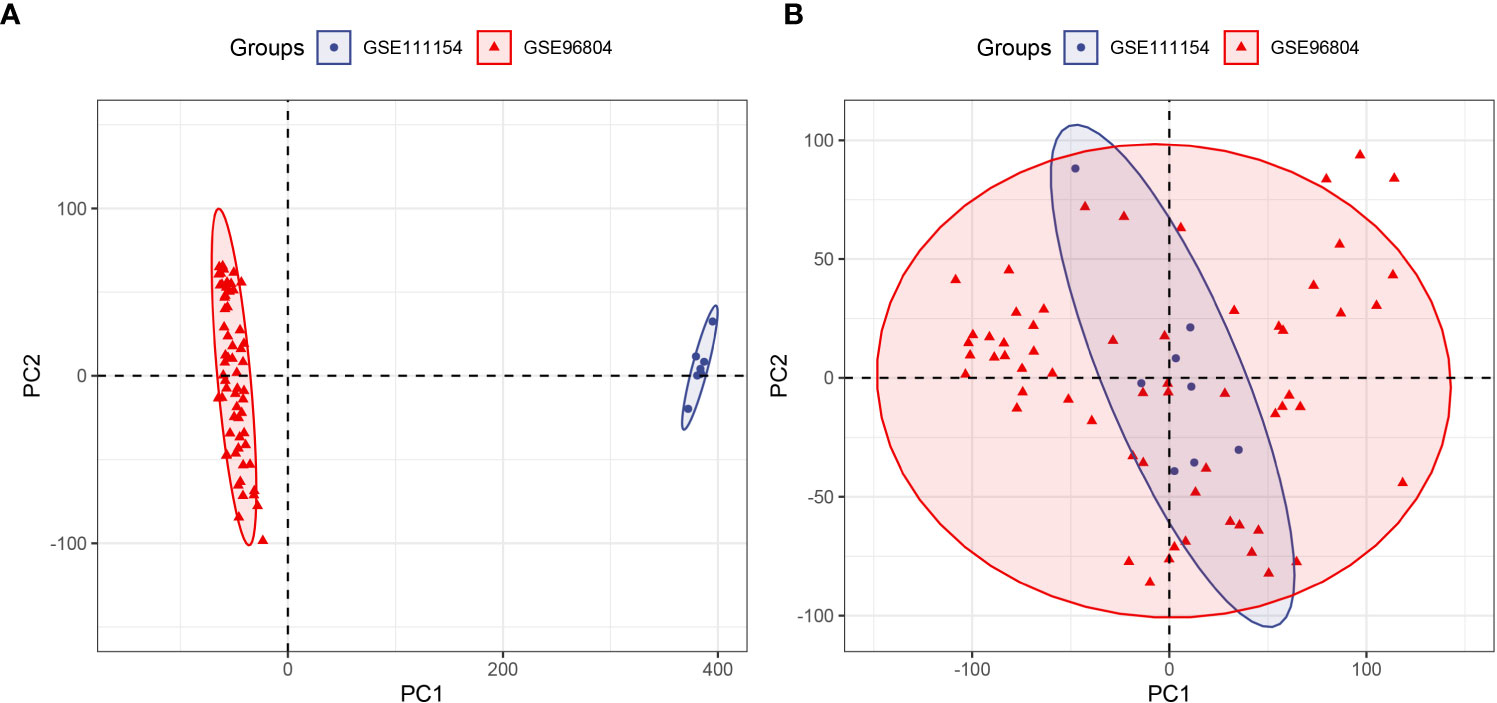
Figure 2 Principal component analysis (PCA) of two datasets (GSE96804 and GSE111154). The points of the scatter plot represent the samples without (A) and with (B) the removal of batch effects according to the first two principal components of gene expression profiles.
DECRGs in DN
The GSE96804 and GSE111154 datasets in the GEO database were examined. A total of 69 samples were obtained, which included 24 normal samples and 45 DN samples. Eighty-two DECRGs were identified between normal and DN samples. Of these, 26 genes were up-regulated and 56 down-regulated (Figure 3A). The PPI network for DECRGs in DN was constructed with a minimum required interaction score of 0.900 and disconnected nodes hidden in the network, which included 80 nodes and 42 edges (Figure 3B). Notably, the PPI network revealed a close relationship between prostaglandin-endoperoxide synthase (PTGS2) and cytochrome P450 (CYP) family 2 subfamily B member 6 (CYP2B6).
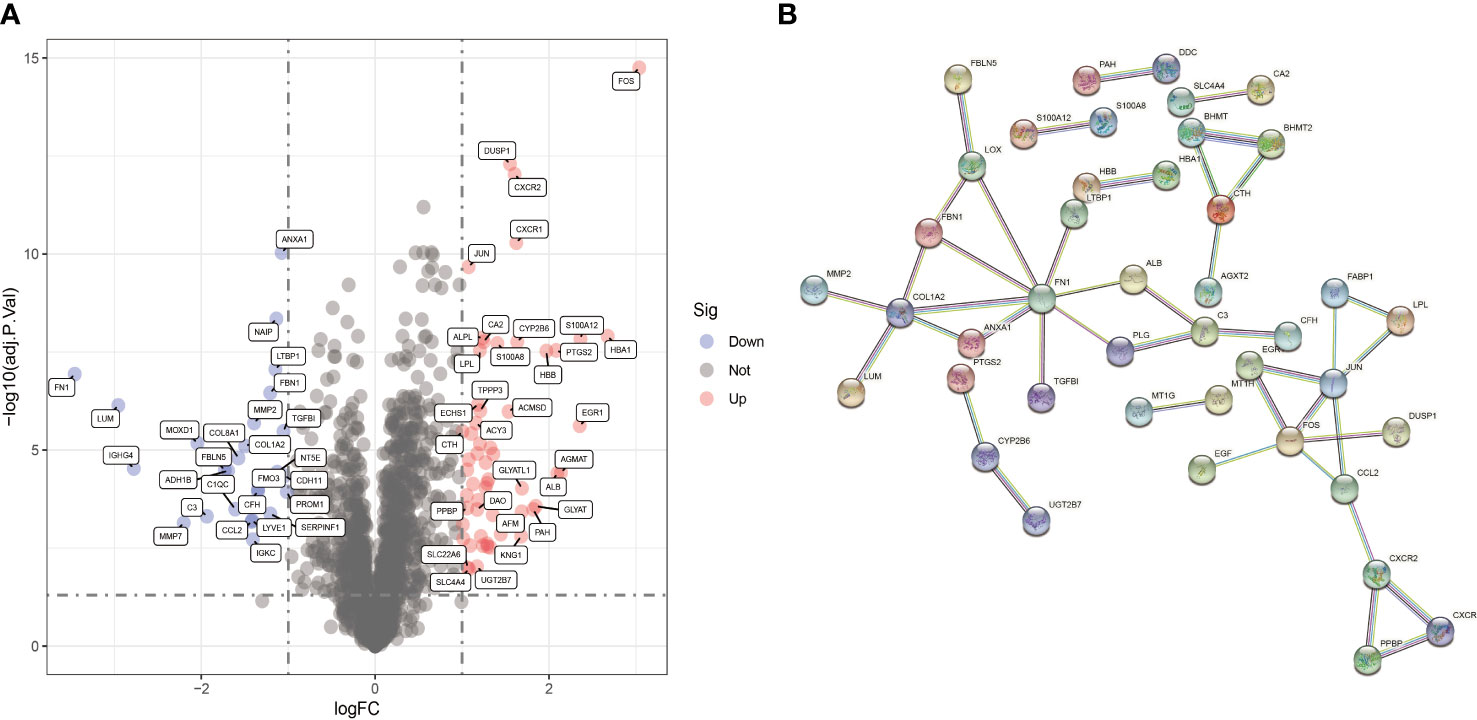
Figure 3 Identification of DECRGs. (A) Volcano plot of DECRGs between normal and DN samples. (B) PPI network for DECRGs in DN (80 nodes and 42 edges).
Analysis of module closely related to DN
The samples of the GSE96804 and GSE111154 datasets were clustered using the average linkage and Pearson’s correlation methods (Figure 4A). A β value of 13 was selected as the soft-thresholding power to ensure a scale free network (scale free R2 = 0.856), as shown in Figure 4B. A total of seven gene modules were acquired via the average linkage hierarchical clustering (Figure 4C). The correlation between modules and DN status is depicted in Figure 4D. The turquoise module that includes 564 genes was most significantly associated with DN. This module was chosen for the further identification of hub CRGs (R =0.77, p =7e-15).
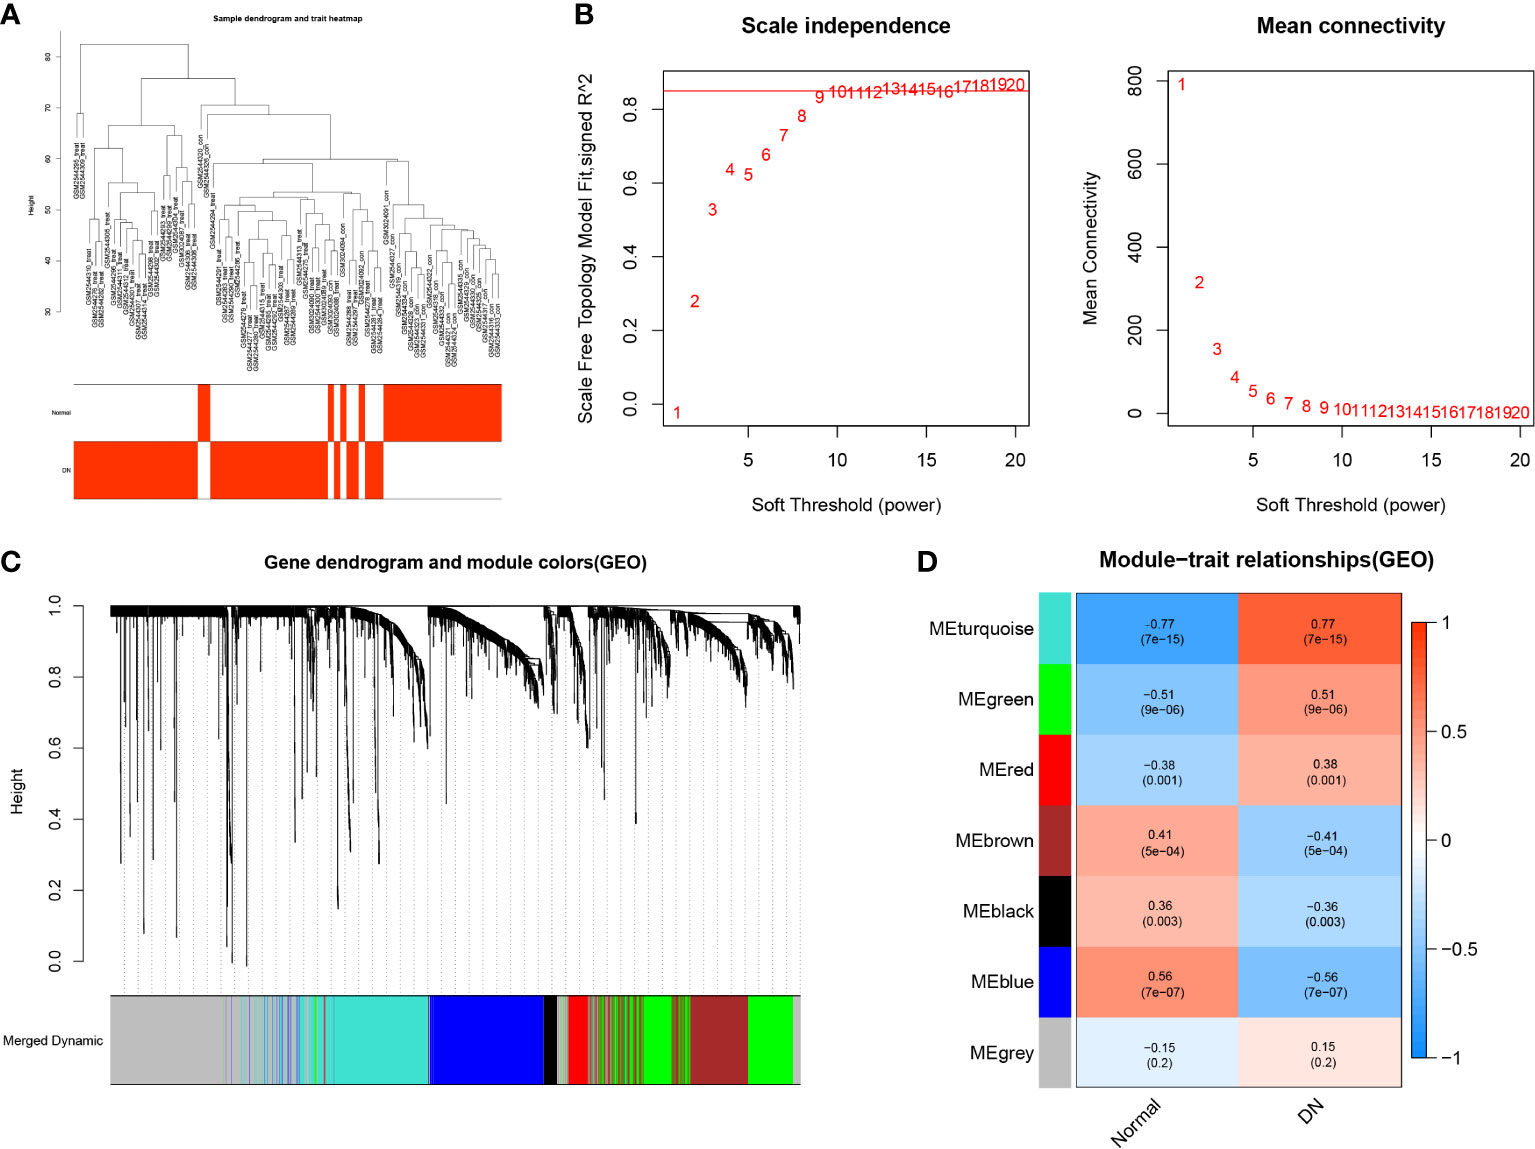
Figure 4 Weighted Gene Co-expression Network Analysis. (A) Clustering dendrogram of 69 samples. (B) Analysis of the scale free fit index for different soft-thresholding powers (β), and analysis of the mean connectivity for different soft-thresholding powers. (C) Dendrogram of differentially expressed genes clustered based on a dissimilarity measure (1-TOM). (D) Heatmap of correlations between different modules and clinical traits, including normal tissues and DN tissues.
Identification and analysis of 10 hub CRGs
By taking the intersection of DECRGs and genes in the turquoise module, 10 hub CRGs were identified. These were PTGS2, Fos proto-oncogene, activator protein 1 (AP-1) transcription factor subunit (FOS), Jun proto-oncogene, AP-1 transcription factor subunit (JUN), S100 calcium binding protein A12 (S100A12), S100 calcium binding protein A8 (S100A8), C-X-C motif chemokine receptor 1 (CXCR1), C-X-C motif chemokine receptor 2 (CXCR2), dual specificity phosphatase 1 (DUSP1), C-type lectin domain family 4 member E (CLEC4E), and NLR family apoptosis inhibitory protein (NAIP) (Figure 5A). The location of each hub CRG on the chromosome is presented in Figure 5B (PTGS2-1q31.1, JUN-1p32.1, S100A12-1q21.3, S100A8-1q21.3, FOS-14q24.3, CXCR1-2q35, CXCR2-2q35, DUSP1-5q35.1, CLEC4E-12p13.31, and NAIP-5q13.2). The PPI network of the DECRG expression products in DN were constructed using the STRING database. The network included 13 edges and 10 nodes (Figure 5C).
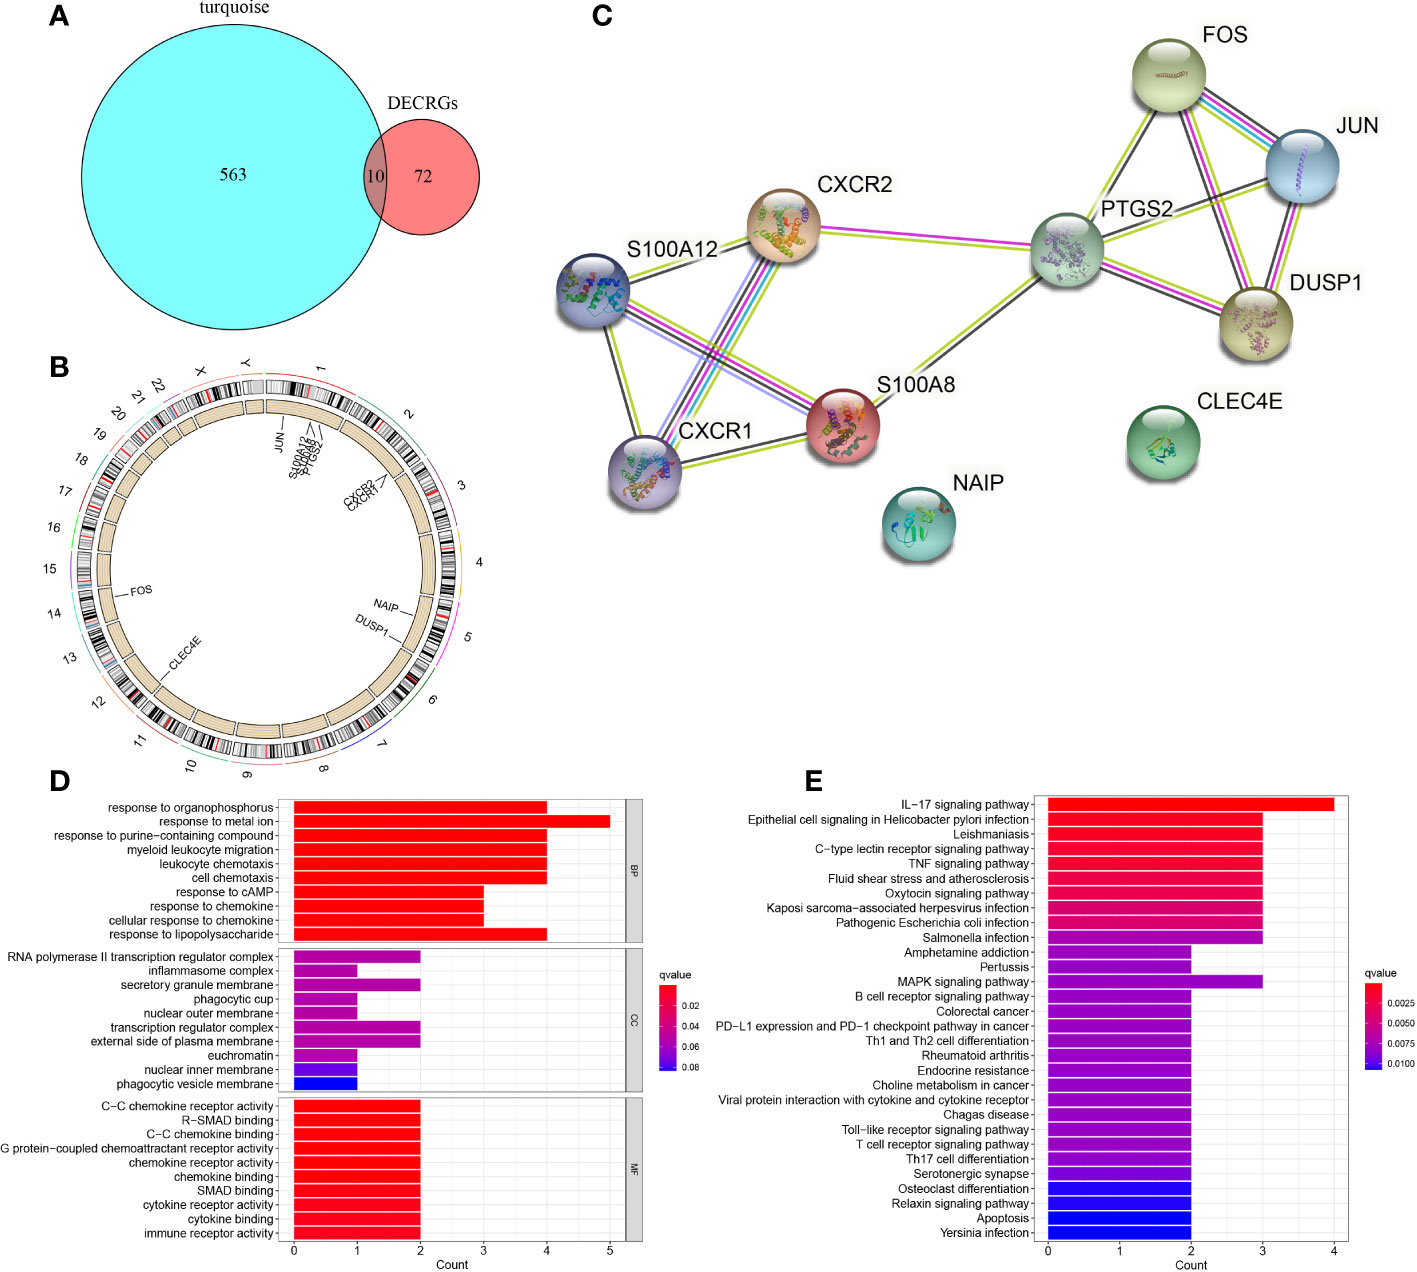
Figure 5 Identification of 10 hub CRGs. (A) The 10 hub CRGs were obtained by determining the intersection of DECRGs and genes in the turquoise module. (B) The specific location of each CRG on the chromosome. (C) PPI network of the 10 hub CRGs (10 nodes and 13 edges). (D) GO terms in the enrichment analysis of the 10 CRGs. (E) KEGG terms in the enrichment analysis of the 10 CRGs.
GO enrichment analysis revealed that in terms of BP, the 10 hub genes were mainly enriched in response to metal ion, response to organophosphorus, response to purine−containing compound; in terms of CC, the hub genes were prominently involved in RNA polymerase II transcription regulator complex, secretory granule membrane, and transcription regulator complex; with regard to MF, the hub genes were engaged in C−C chemokine receptor activity, R−SMAD binding, and C−C chemokine binding (Figure 5D). KEGG pathway analysis revealed the involvement of these genes mainly in the IL−17 signaling pathway, epithelial cell signaling in Helicobacter pylori infection, Leishmaniasis, C−type lectin receptor signaling pathway, and tumor necrosis factor signaling pathway (Figure 5E).
Determination of regulatory signatures for 10 hub CRGs
To gain insights into the CRG regulatory molecules and identify substantial changes at the transcriptional level, we employed publicly available bioinformatic database to reveal the potential TFs and miRNAs. Here, we present the results from the JASPAR and miRTarBase databases. The interaction of TFs and hub CRGs is depicted in Figure 6A and the interaction of potential miRNAs and hub CRGs is shown in Figure 6B. The TFs–CRGs and miRNAs–CRGs interaction network analysis revealed the regulatory activities of 39 TFs and 165 miRNAs with more than one CRGs, indicating strong interference between them. The specific regulatory molecules from JASPAR and miRTarBase for each hub CRG are summarized in Supplementary Table 2.
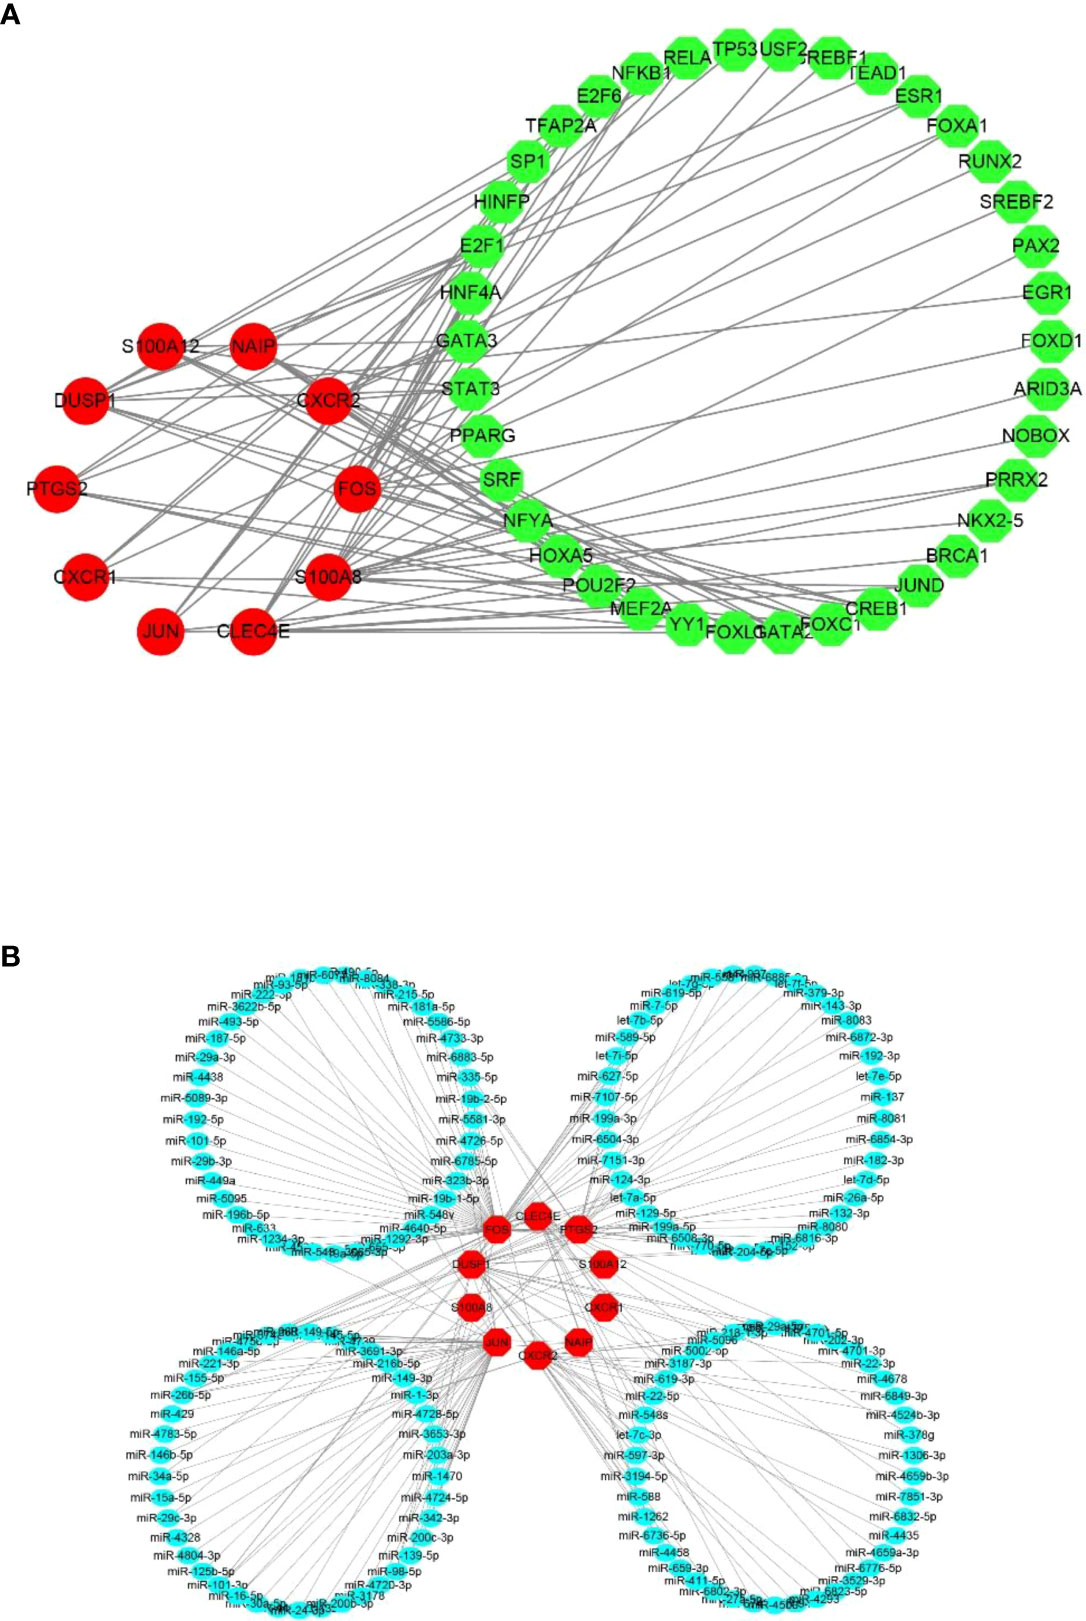
Figure 6 Potential regulatory molecules for the 10 hub CRGs. The red nodes depict the hub CRGs). (A) Ten hub CRGs and their interactions with potential transcription factors (TFs) based on the JASPAR database (49 nodes and 76 edges). (B) Ten hub CRGs and their interactions with potential miRNAs based on the miRTarBase database (175 nodes and 189 edges).
Identification of hub regulatory molecules for two key CRGs
Based on MCC algorithm of cytohubba plugin in Cytoscape software, PTGS2 scored the highest among 10 hub CRGs (Figure 7A). Aside from being the most significant DECRG according to the differential expression analysis (Figure 3A), FOS also ranked just behind PTGS2 according to the MCC algorithm (Figure 7A). Hence, PTGS2 and FOS were considered the two key CRGs. To find the hub regulatory molecules targeting these two key CRGs, the intersection of the TFs or miRNAs was determined from multiple databases.
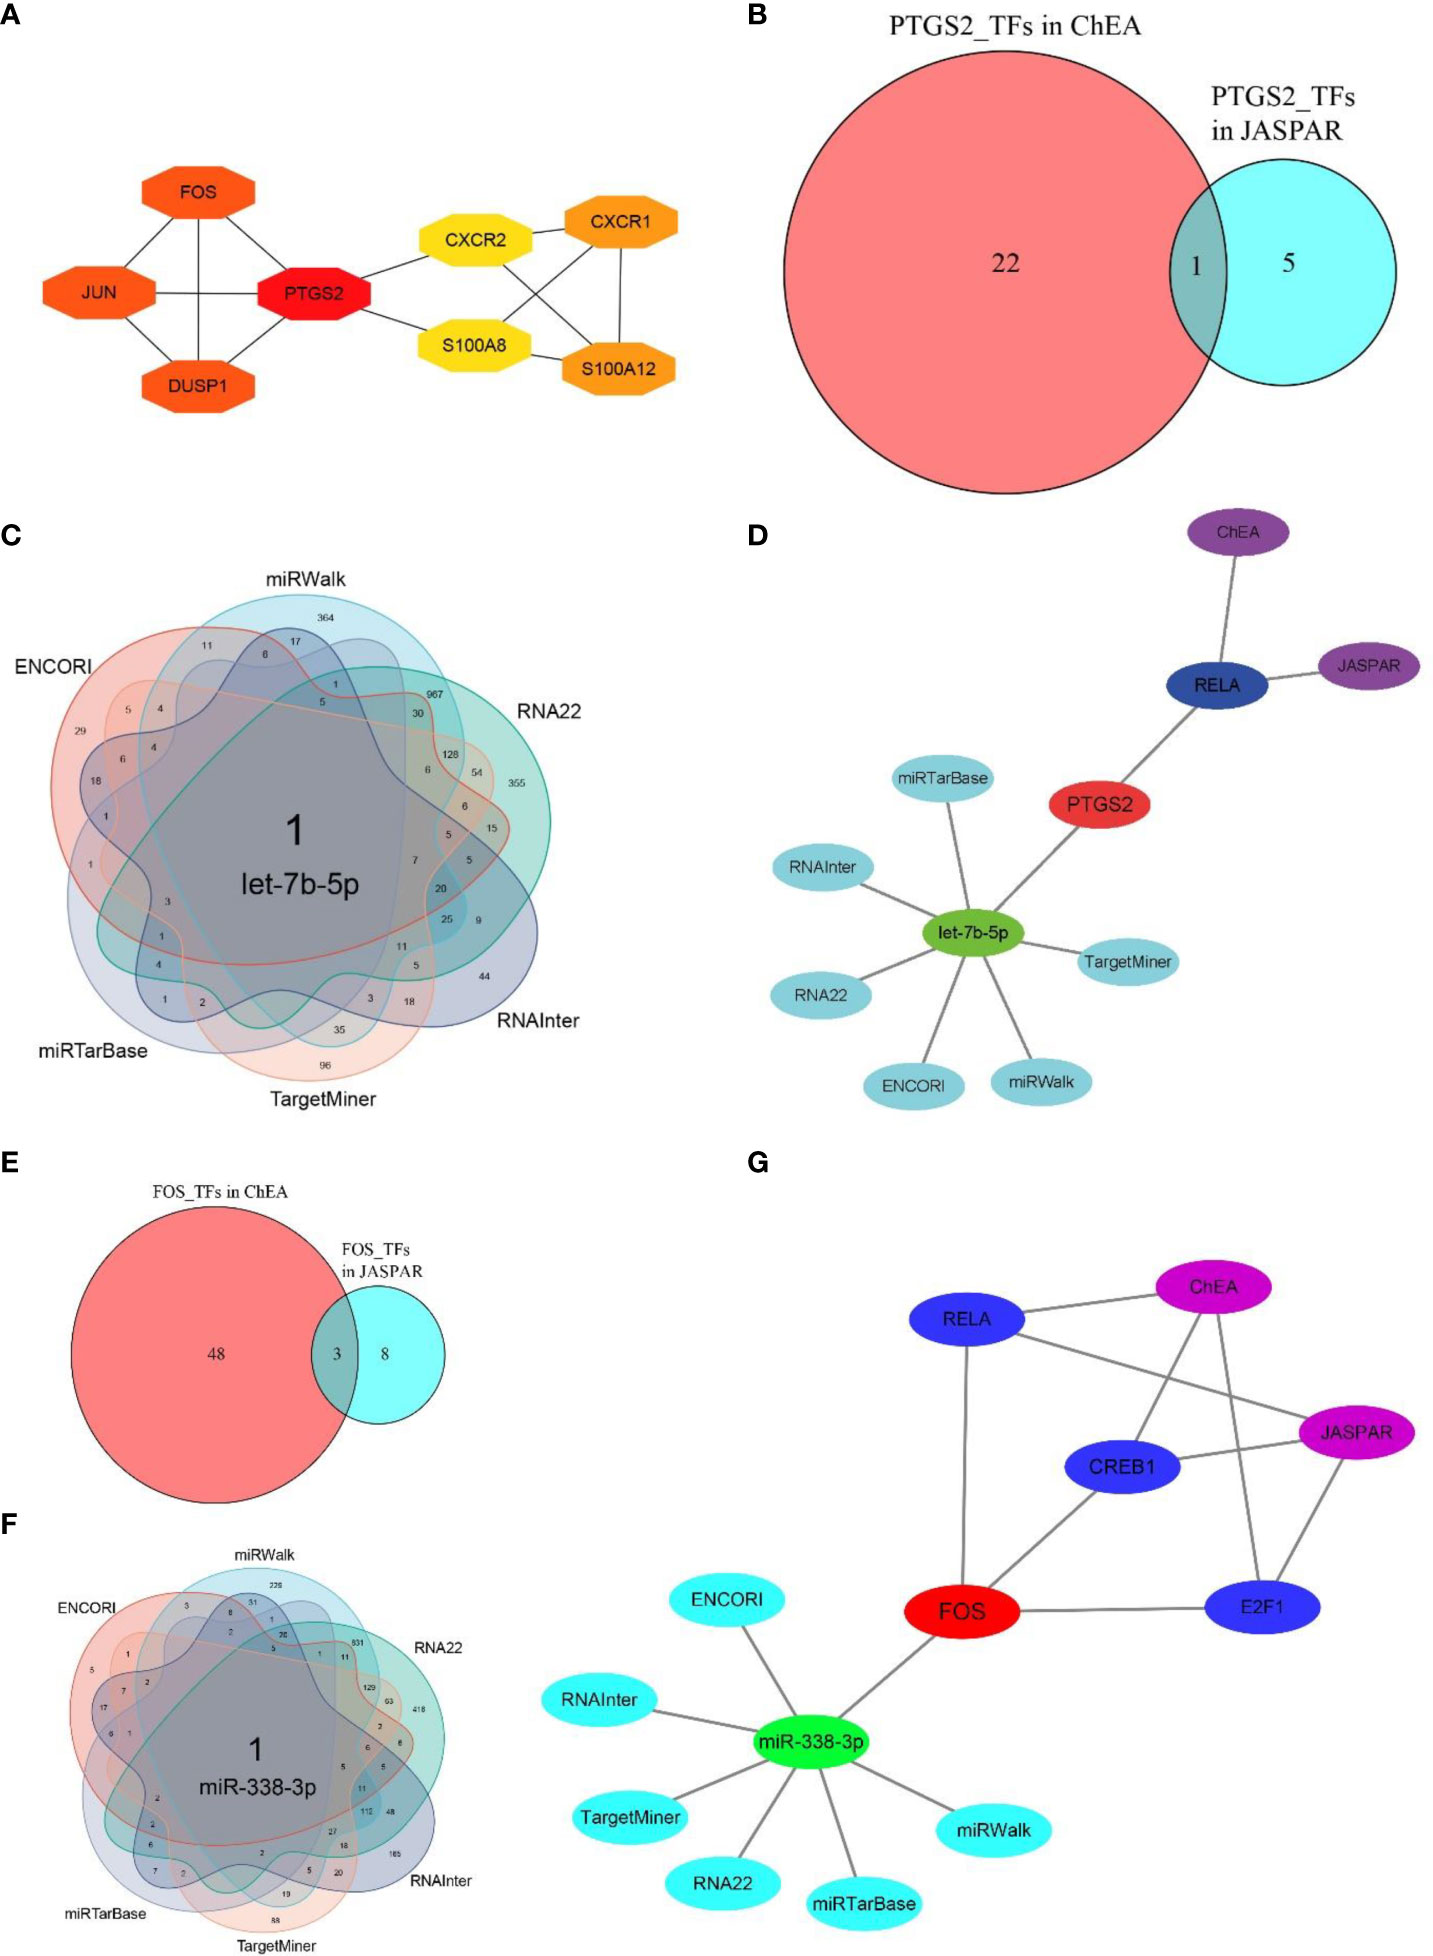
Figure 7 Determination of hub regulatory molecules for PTGS2 and FOS. (A) Top eight essential CRGs ranked by MCC scores (NAIP and CLEC4E are not shown because of the absence of interactions with other CRGs), and PTGS scores the highest among 10 hub CRGs. (B) One hub TF targeting PTGS2 was identified by taking the interaction of TFs from two databases (JASPAR and ChEA). (C) One hub miRNA targeting PTGS2 was identified by taking the intersection of miRNAs from six databases (miRWalk, RNA22, RNAInter, TargetMiner, miRTarBase, and ENCORI). (D) Hub TFs and miRNAs identified by multiple databases for PTGS2. (E) Three hub TFs targeting FOS were identified by taking the interaction of TFs of two databases. (F) One hub miRNA targeting FOS was identified by taking the intersection of miRNAs from six databases. (G) Hub TFs and miRNAs identified by multiple databases for FOS.
By taking the intersection of the predicted results from both the JASPAR and ChEA databases, RELA proto-oncogene, NF-κB subunit (RELA), was screened as the hub TF interacting with PTGS2. After combining six databases, i.e., miRTarBase, ENCORI, RNAInter, TargetMiner, miRWalk, and RNA22, let-7b-5p was identified as the hub miRNA (Figures 7B–D). Similarly, cAMP responsive element binding protein (CREB1), E2F transcription factor (E2F1), and RELA were identified as the hub TFs for FOS, and miR-338-3p was screened as the hub miRNA (Figures 7E–G). The detailed regulatory molecules derived from each database for two key CRGs are summarized in Supplementary Table 3.
Analysis of immune cell infiltration between normal and DN groups
PCA indicated no overlap of two clusters, indicating a significant difference in immune cell infiltration between normal and DN samples (Figure 8A). Based on the CIBERSORT algorithm, the heatmap for correlation between immune cells is presented in Figure 8B. The most significant positive correlation was between activated dendritic cells and naïve CD4+ T cells (correlation coefficient = 0.93). A remarkable inverse correlation exists between T cells gamma delta and activated NK cells (correlation coefficient = -0.51). The relative proportion of various immune cells in each sample is shown in Figure 8C. Subsequently, we compared the expression level of different immune cells between two groups (Figures 8D, E). In contrast to normal tissues, infiltration in DN tissue was statistically greater for memory B cells (p = 0.03), macrophages M1 (p = 0.007), macrophages M2 (p< 0.001), and resting mast cells (p< 0.001), while activated mast cells (p< 0.001) and neutrophils (p< 0.001) infiltrated statistically less in DN tissue.
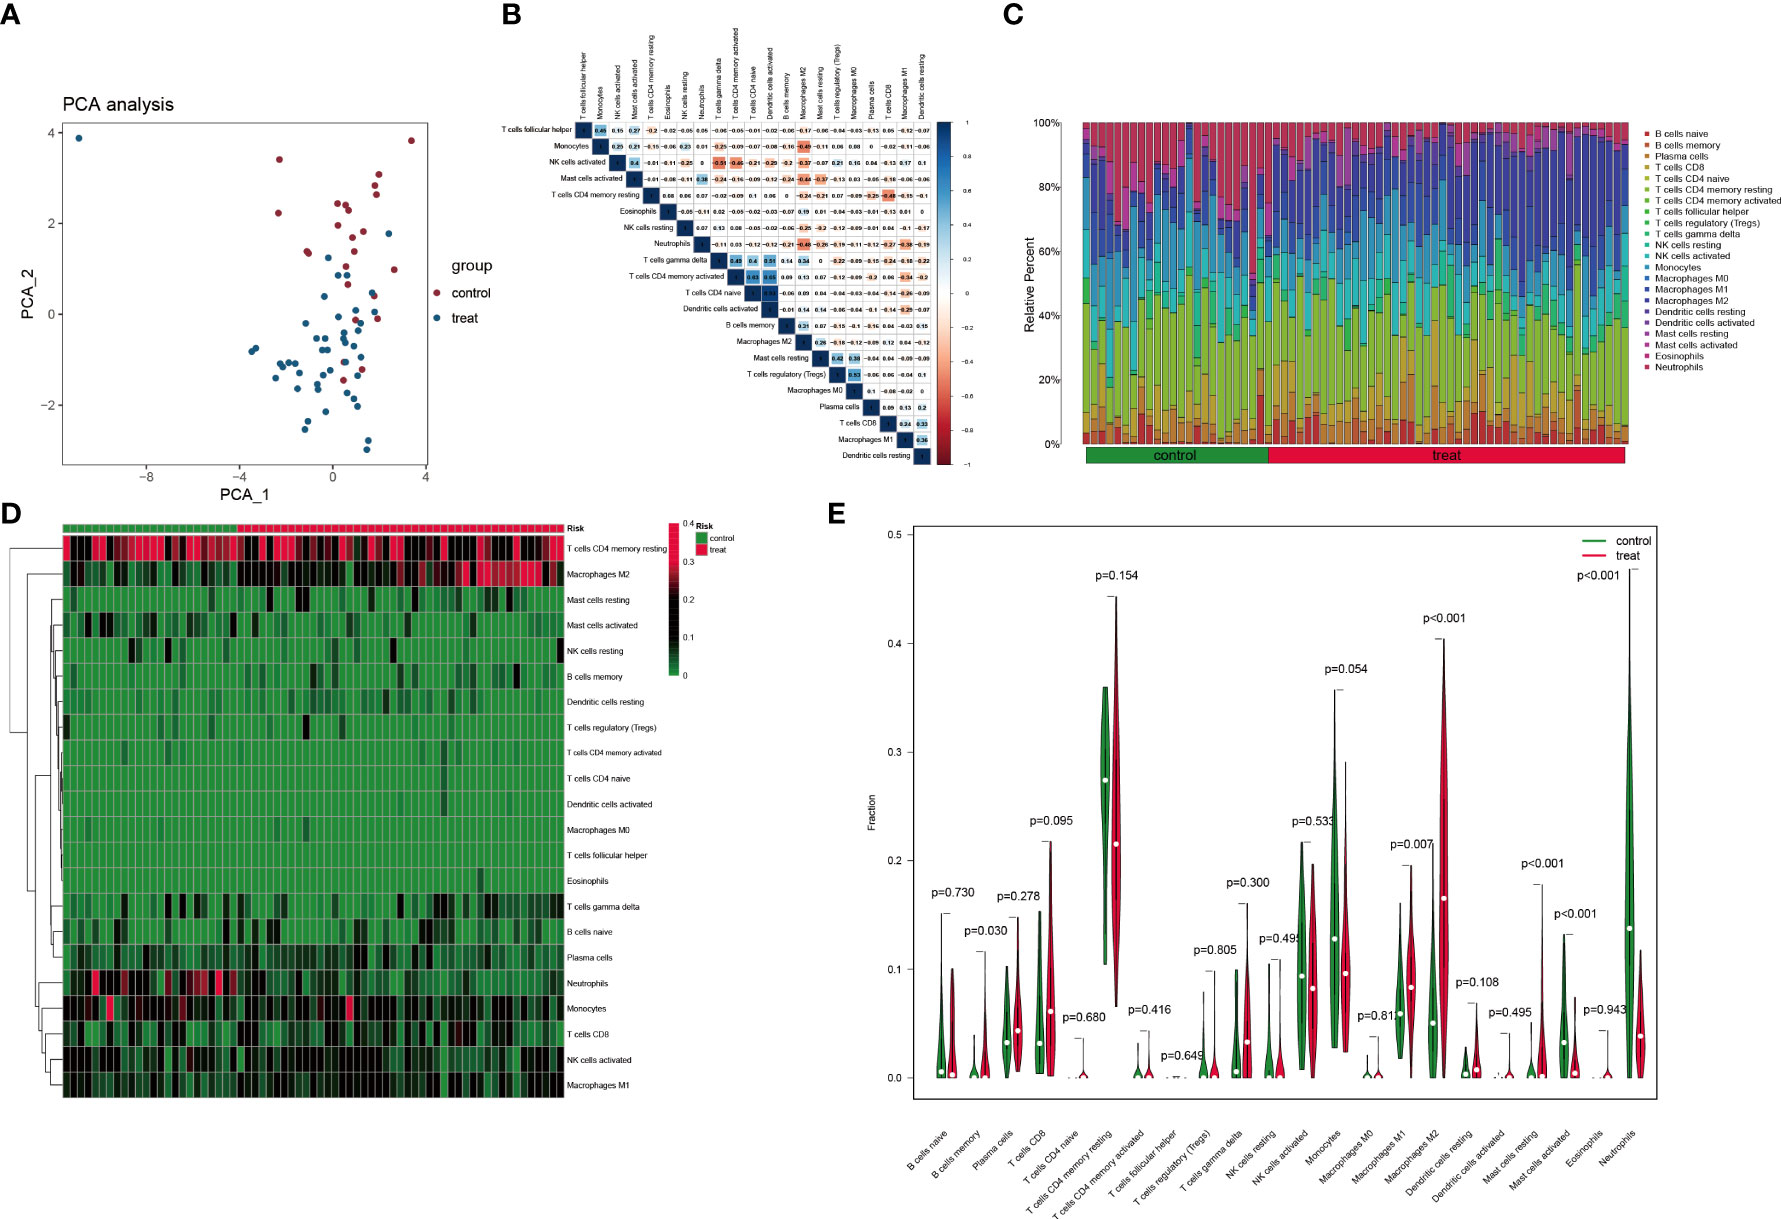
Figure 8 Immune cell infiltration analysis based on the CIBERSORT algorithm. (A) PCA performed on two groups. Red points indicate normal samples and green points indicate DN samples. (B) Correlation matrix of infiltration degree of immune cells in DN samples. (C) The abundance of different immune cells in each sample. (D) The infiltration degree of 22 immune cells in each sample. Red squares indicate higher immune infiltration expression and green squares indicate lower expression. (E) Violin plots of the differential analysis of different immune cells between two groups.
Correlation between PTGS2 expression and immune cell infiltration
Next, we investigated the relationship between PTGS2 and immunological characteristics. It was clear from the lollipop chart (Figure 9A) and scatter plot (Figures 9B–G) that PTGS2 expression was significantly and positively associated with the level of infiltration of neutrophils (R = 0.62, p< 0.001) and activated mast cells (R = 0.39, p< 0.001) and negatively correlated with plasma cells (R = -0.24, p = 0.049), resting mast cells (R = -0.29, p = 0.015), macrophages M1 (R = -0.32, p = 0.0082), and macrophages M2 (R = -0.36, p = 0.0025).
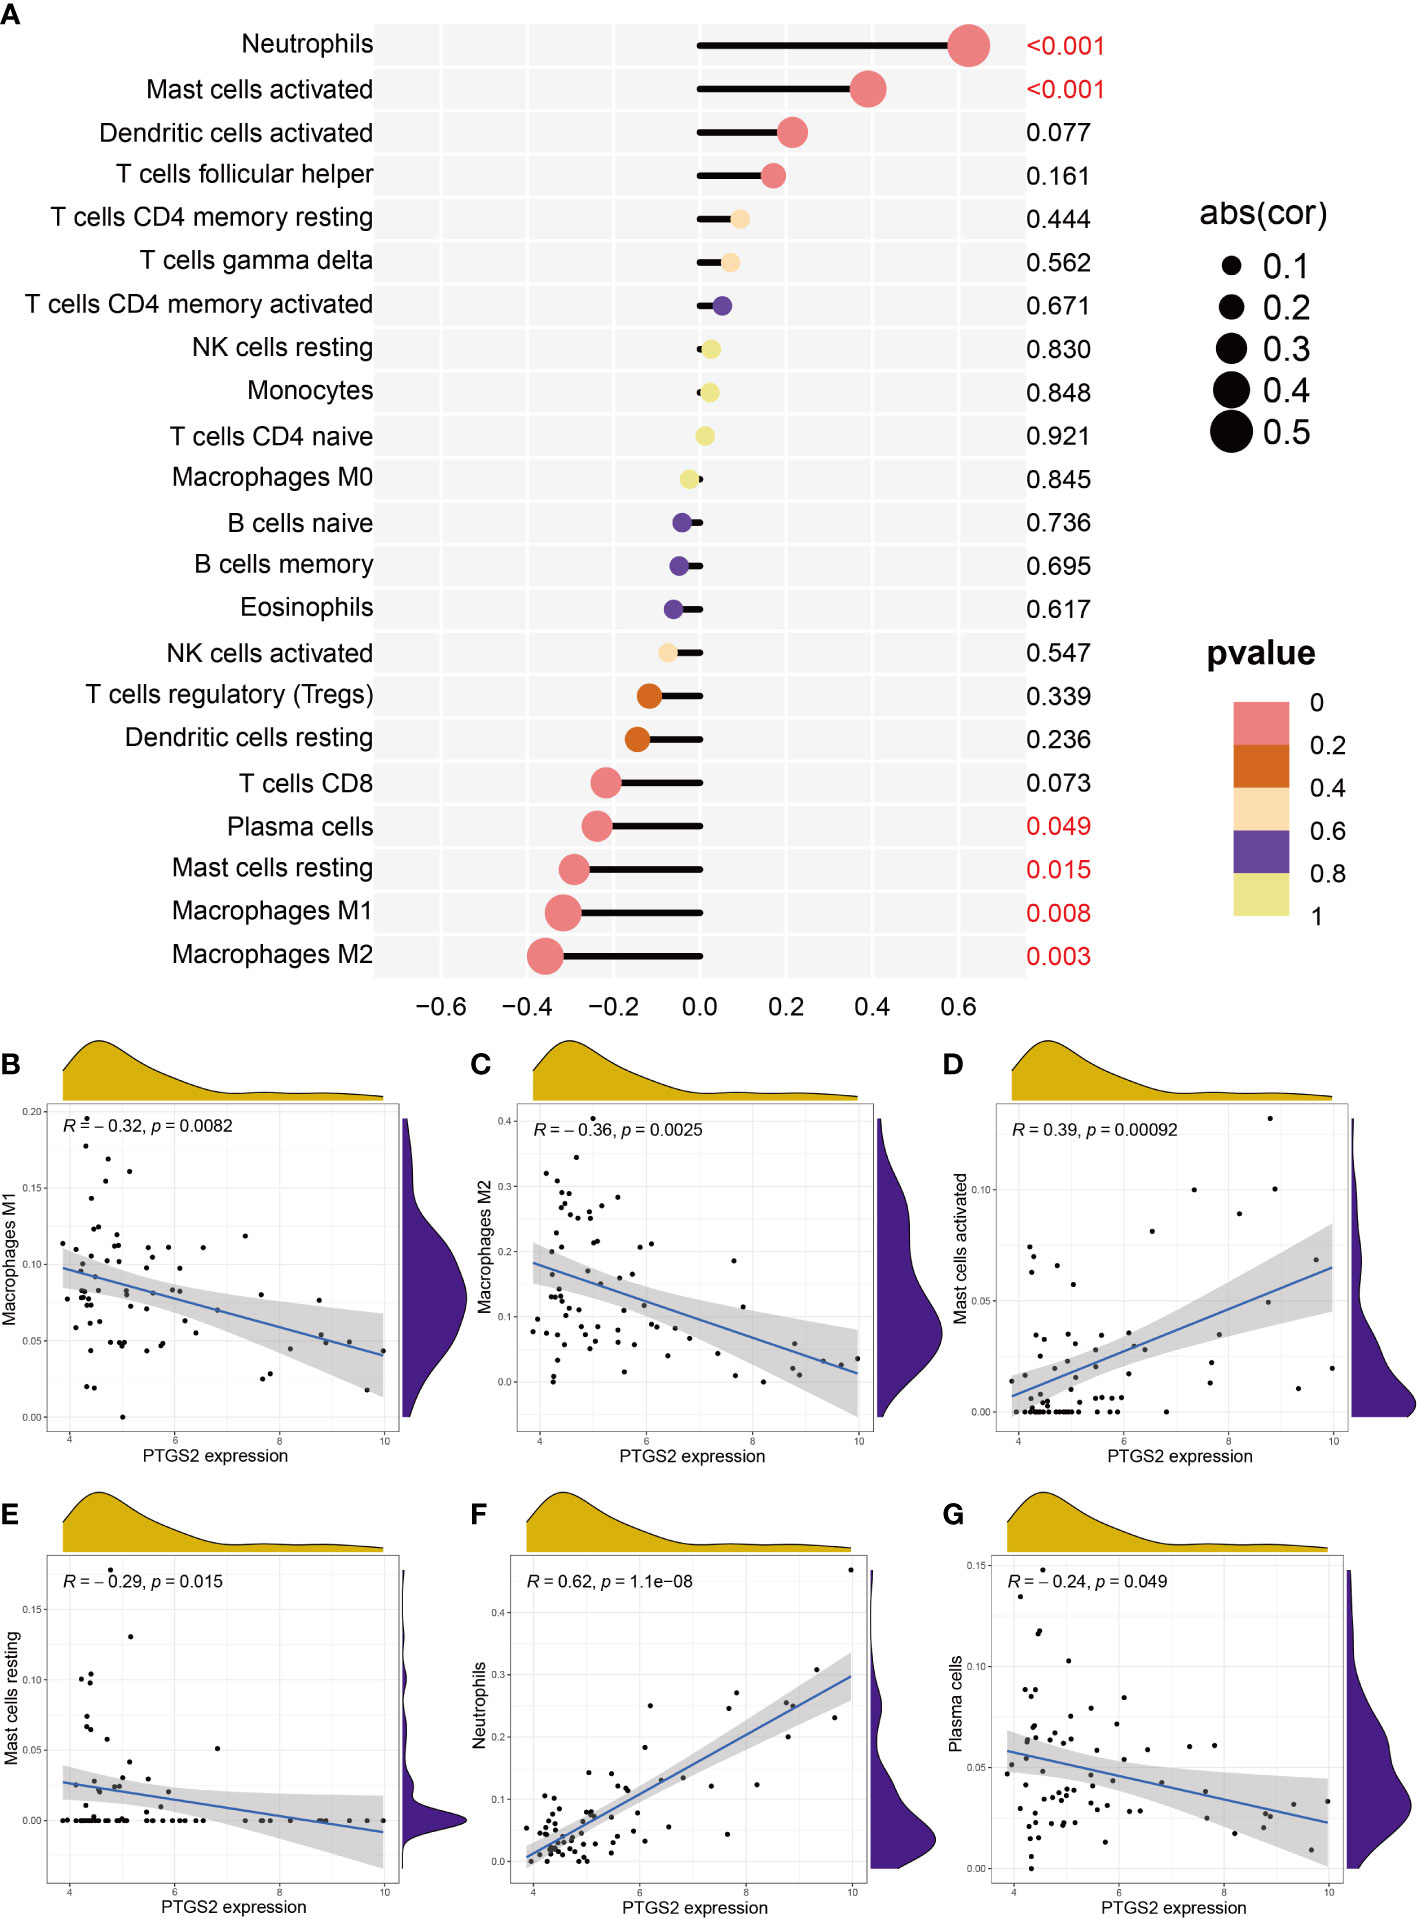
Figure 9 Correlation between expression PTGS2 expression and different immune cell infiltration degree in DN. (A) Lollipop plot. (B–G) Correlation between expression of PTGS2 and (B) M1 macrophages expression, (C) M2 macrophage expression, (D) activated mast cell expression, (E) resting mast cell expression, (F) neutrophil expression, and (G) plasma cell expression.
Discussion
In our study, the determination of the intersection of DECRGs and genes in the turquoise module (R = 0.77, p< 0.001) identified 10 intersection genes (PTGS2, JUN, S100A12, S100A8, FOS, CXCR1, CXCR2, DUSP1, NAIP, and CLEC4E). Subsequently, we analyzed the interaction of genes encoding TFs and miRNAs to discover transcriptional and post-transcriptional regulators of the intersection genes. TFs, including STAT3 (43), SP1 (44), USF1 (45), USF2 (46), YY1 (47), EGR1 (48), FOXA1 (49), E2F1 (50), NRF1 (51), SRF (52), PPARG (53), JUND (54), TP53 (55), and HNF4A (56), were identified as being associated with the development of DN. Further, some miRNAs involved in DN (e.g., miR-155-5p, miR-221-3p, miR-103-3P) (57–59), immune disorder (e.g., miR-4701-5p, miR-232b-3p, miR-338-3p) (60–62), and different cancers (e.g., miR-22-3p, miR-5096, miR-588, miR-29a-5p) (63–66) have been identified. TFs and miRNAs basically target main proteins to influence the progression of various diseases. Dou et al. (67) described the upregulation of miR-202-3p in type 1 gastric neuroendocrine neoplasms (g-NENs), which might initiate the pathogenesis of type 1 g-NENs by targeting DUSP1. Yao et al. found that miR-29c-3p targeted FOS to inhibit epithelial-mesenchymal transition and cell proliferation and contribute to apoptosis in transforming growth factor-beta 2 treated SRA01/04 cells (68). High miR-139-5p expression reportedly suppressed the c-Jun-vascular endothelial growth factor/platelet derived growth factor B pathway and reduced the migration of endothelial colony-forming cells isolated from patients with diabetes, tube formation, and proliferation. These events prevent diabetic vascular disease (69). miR-22-3p targets CXCR2 and then contributes to injury induced by oxidized low-density lipoprotein (70). The majority of miRNAs are associated with cancer tissues and lead to various types of cancer in humans.
Based on the MCC algorithm, we identified PTGS2 as the hub gene. This gene could be the key Cu-related biomarker or drug target and could be associated with pathophysiological mechanisms in DN. PTGS, also known as cyclooxygenase (COX), is the key gene responsible for prostaglandin biosynthesis from arachidonic acid, including prostaglandin E2, prostacyclin, prostaglandin 2 alpha, prostaglandin D2, and thromboxane. There are two COX isozymes: COX-1 and COX-2. In the kidney, COX-1 is constitutively expressed and is mainly present along the distal tubule. COX-1 mediates the synthesis of prostaglandin E2. The COX-2 gene is inducible and shares significant homology with COX-1. COX-2 is mainly expressed in both macula densa cells in the cortex and the thick limb of the ascending loop of Henle and medulla. Cortical COX-2 plays a pivotal role in renin release and subsequent pro-hypertensive effects, while COX-2 in the medullary region contributes to salt and water reabsorption (71). Accumulated evidence has associated the overexpression of COX-2 with the progression of DN, with COX-2 inhibition reducing hyperfiltration and proteinuria, abrogating Ang II-mediated reductions in GFR, and retarding progressive renal injury (72–75).
By determining the intersection of TFs or miRNAs from multiple databases, RELA (p65) and has-let-7b-5p were identified as the hub regulatory molecules. NF-κB, frequently under the form of p50/p65 (RELA) dimer, is a universal TF that can be post-transcriptionally activated by a number of stimuli, including infections, radiation, and oxidants, with pro-inflammatory effects (76, 77). A body of literature supports the view that the NF-κB signaling pathway serves as the link of Cu and PTGS. For example, Cu can activate and induce NF-κB-dependent genes, including COX-2, NOS-II, and TNF-α, through production of ROS (78). Liu et al. observed that the intragastrical provision of distilled water with dissolved copper sulfate (more than 4 mg/kg) to mice was able to activate the NF-κB signaling pathway and subsequently increase the expression of COX-2 and prostaglandin E2, thereby inducing an inflammatory response in the liver (79). Similarly, Yang et al. observed that excessive Cu intake led to oxidative stress with activated NF-κB pathway and up-regulated COX-2, inducing inflammatory responses in immune organs of chickens (80). These findings indicate that anti-inflammatory therapy involving COX-2 inhibition might be a promising therapeutic strategy for DN (74, 81–83). However, few investigators have linked this anti-inflammatory mechanism to the regulation of Cu homeostasis (84). let-7b-5p is down-regulated in different biological sources of patients with type 2 DM (85). Li et al. reported that let-7b-5p could translocate into mitochondria and lead to reduced ROS production by cardiomyocytes in db/db mice via the positive modulation of mitochondrial gene cytochrome b (86). In a prospective study incorporating 116 patients with type 1 DM, let-7b-5p was significantly associated with the increased risk of ESRD (Odds ratio = 2.38, p = 0.004) based on logistic regression analysis (87). However, no study has investigated the relationship of Cu, let-7b-5p, and PTGS2. Interestingly, the present PPI network analysis revealed a strong interaction of PTGS2 with CYP2B6. CYP2B6, accounting for approximately 3% to 6% of the total hepatic CYP content, is an important biotransformation enzyme for numerous clinical drugs and environmental toxins (88). A considerable interindividual variability in CYP2B6 protein expression has been observed, which is explained by genetic factors that include extensive genetic polymorphisms and non-genetic factors including some inhibitors and inducers (89).
In addition, we identified miR-338-3p as the hub miRNA for FOS, and CREB1, E2F1, and RELA were screened as the hub TFs. The Fos gene family is composed of four members: FOS, FOSB, FOSL1, and FOSL2. These genes encode leucine zipper proteins that dimerize with the JUN family proteins to form activator protein 1 (AP-1) TF (90). AP-1 activation contributes to the accumulation of mesangial cell proliferation, extracellular matrix production, and subsequent progressive fibrosis in DN (91, 92). Expression changes of miR-338-3p occur long before the onset of diabetes. The overexpression of miR-338-3p is able to inhibit tumor necrosis factor-alpha (TNF-α)-mediated hepatic gluconeogenesis and rescue TNF-α-induced insulin resistance by targeting protein phosphatase 4 regulatory subunit 1 (93–95). E2F transcription factor 1 (E2F1) is crucial in the regulation of DNA synthesis and cell cycle. E2F1 promotes hepatic gluconeogenesis and hyperglycemia through the cyclin dependent kinase 4-Rb1-E2F1 pathway and downstream activation of phosphoenolpyruvate carboxykinase 1 (96). CREB1 is a key TF in the basic leucine zipper class. The elevated phosphorylation level of CREB1 can promote the synthesis of fibronectin in the mesangial cells treated with high glucose (25 mmol/L) (97). Although some reports suggested that inhibition of CREB reduces blood glucose in the liver (4, 11, 12), another study reported that CREB is not necessary for the regulation of hepatic glucose metabolism (98). Therefore, the role of CREB in the regulation of hepatic gluconeogenesis is still controversial.
In the present study, immune cell infiltration analysis revealed significant differences in macrophages M1 and M2, resting mast cells, activated mast cells, and neutrophils between normal and DN samples. Macrophages are the most prevalent infiltrating immune cells in the kidney of DN patients. Despite the elimination of apoptotic cells or any other foreign pathogens by phagocytosis or T cells activation, macrophages are closely associated with a decline in renal function (99). Traditionally, macrophages are classified as classically activated M1 phenotype and alternatively activated M2 phenotype. M1 is the predominant phenotype at the site of diabetic kidney injury, which mediates the initiation phase of inflammation, tissue damage, and renal fibrosis through proinflammation cytokines that include TNF-α, interleukin (IL)-6, IL-10 and monocyte chemoattractant protein 1 (100, 101). M2 is involved in the wound healing process through production of anti-inflammatory cytokines, growth factor, and proangiogenic cytokines. Switching from the M1 to M2 phenotype may effectively reduce podocyte injury, albuminuria, and glomerulosclerosis and protect the kidney against DN (102–105). PTGS2 stimulates a tissue-repair M2 phenotypic changes in macrophages (101). There is also a close interaction between mast cells and development of DN, and the vast majority of mast cells are located in the peritubular, perivascular, and periglomerular interstitial regions rather than in intraglomerular areas where inflammatory cells accumulate. Through release of some bioactive substances, such as tryptase, chymase, transforming growth factor-beta 1, renin, and TNF-α, into the tubular interstitium by degranulation, mast cells can lead to renal inflammation, fibrosis, and the progression of DN (106). There are very few studies on the role of neutrophils in DN. Some researchers suggested that a high blood neutrophil to lymphocyte ratio is a predictor of poor GFR in patients with diabetes (107, 108).
There are two limitations of our study. First, due to the small sample size and database limitations, we cannot externally validate our results. Second, there is a paucity of confirmatory experiments. Further fundamental and prospective studies would be beneficial.
Conclusion
We identified 10 hub Cu-related genes (PTGS2, FOS, DUSP1, JUN, S100A8, S100A12, NAIP, CLEC4E, CXCR1, and CXCR2). The findings provide insight into the mechanisms of DN development at the transcriptome level. It is beneficial to examine and understand the interaction between hub Cu-related genes and potential regulatory molecules in DN, which may provide a novel theoretical foundation for the development of diagnostic biomarkers and copper-related therapy targets in DN. Further relevant molecular biological experiments are needed to confirm the function of the identified genes associated with DN.
Data availability statement
The original contributions presented in the study are included in the article/Supplementary Material. Further inquiries can be directed to the corresponding author.
Author contributions
JM: Investigation, Data Collection and Analysis, Writing-Original Draft and Editing; SS: Protocol Development, Writing-Editing; and XD: Supervision. All authors contributed to the article and approved the submitted version.
Funding
This work was supported by Beijing Xinyue Foundation (2022IIT037) awarded to Sana SRGL.
Conflict of interest
The authors declare that the research was conducted in the absence of any commercial or financial relationships that could be construed as a potential conflict of interest.
Publisher’s note
All claims expressed in this article are solely those of the authors and do not necessarily represent those of their affiliated organizations, or those of the publisher, the editors and the reviewers. Any product that may be evaluated in this article, or claim that may be made by its manufacturer, is not guaranteed or endorsed by the publisher.
Supplementary material
The Supplementary Material for this article can be found online at: https://www.frontiersin.org/articles/10.3389/fendo.2022.978601/full#supplementary-material
References
1. Gheith O, Farouk N, Nampoory N, Halim MA, Al-Otaibi T. Diabetic kidney disease: world wide difference of prevalence and risk factors. J Nephropharmacol (2016) 5:49–56. doi: 10.4103/1110-9165.197379
2. Cosentino F, Grant PJ, Aboyans V, Bailey CJ, Ceriello A, Delgado V, et al. 2019 ESC Guidelines on diabetes, pre-diabetes, and cardiovascular diseases developed in collaboration with the EASD. Eur Heart J (2020) 41:255–323. doi: 10.1093/eurheartj/ehz486
3. Persson F, Rossing P. Diagnosis of diabetic kidney disease: state of the art and future perspective. Kidney Int Suppl (2018) 8:2–7. doi: 10.1016/j.kisu.2017.10.003
4. Raval N, Kumawat A, Kalyane D, Kalia K, Tekade RK. Understanding molecular upsets in diabetic nephropathy to identify novel targets and treatment opportunities. Drug Discovery Today (2020) 25:862–78. doi: 10.1016/j.drudis.2020.01.008
5. Chan GCW, Tang SCW. Diabetic nephropathy: landmark clinical trials and tribulations. Nephrol Dial Transplant (2016) 31:359–68. doi: 10.1093/ndt/gfu411
6. Coleman CI, Weeda ER, Kharat A, Bookhart B, Baker WL. Impact of angiotensin-converting enzyme inhibitors or angiotensin receptor blockers on renal and mortality outcomes in people with type 2 diabetes and proteinuria. Diabetes Med (2020) 37:44–52. doi: 10.1111/dme.14107
7. Jia Z, Sun Y, Yang G, Zhang A, Huang S, Heiney KM, et al. New insights into the PPARγ agonists for the treatment of diabetic nephropathy. PPAR Res (2014) 2014:1–7. doi: 10.1155/2014/818530
8. Tuttle KR, Anderson PW. A novel potential therapy for diabetic nephropathy and vascular complications: protein kinase c β inhibition. Am J Kidney Dis (2003) 42:456–65. doi: 10.1016/S0272-6386(03)00741-8
9. Chen JLT, Francis J. Pyridoxamine, advanced glycation inhibition, and diabetic nephropathy. J Am Soc Nephrol (2012) 23:6–8. doi: 10.1681/ASN.2011111097
10. Kohan DE, Pritchett Y, Molitch M, Wen S, Garimella T, Audhya P, et al. Addition of atrasentan to renin-angiotensin system blockade reduces albuminuria in diabetic nephropathy. J Am Soc Nephrol (2011) 22:763–72. doi: 10.1681/ASN.2010080869
11. Oliveri V. Selective targeting of cancer cells by copper ionophores: An overview. Front Mol Biosci (2022) 9:841814. doi: 10.3389/fmolb.2022.841814
12. Kim BE, Nevitt T, Thiele DJ. Mechanisms for copper acquisition, distribution and regulation. Nat Chem Biol (2008) 4:176–85. doi: 10.1038/nchembio.72
13. Lutsenko S. Human copper homeostasis: a network of interconnected pathways. Curr Opin Chem Biol (2010) 14:211–7. doi: 10.1016/j.cbpa.2010.01.003
14. Wang Y, Zhao H, Shao Y, Liu J, Li J, Luo L, et al. Copper (II) and/or arsenite-induced oxidative stress cascades apoptosis and autophagy in the skeletal muscles of chicken. Chemosphere (2018) 206:597–605. doi: 10.1016/j.chemosphere.2018.05.013
15. Guo H, Ouyang Y, Wang J, Cui H, Deng H, Zhong X, et al. Cu-Induced spermatogenesis disease is related to oxidative stress-mediated germ cell apoptosis and DNA damage. J Hazard Mater (2021) 416:125903. doi: 10.1016/j.jhazmat.2021.125903
16. Li Y, Chen H, Liao J, Chen K, Javed MT, Qiao N, et al. Long-term copper exposure promotes apoptosis and autophagy by inducing oxidative stress in pig testis. Environ Sci pollut Res (2021) 28:55140–53. doi: 10.1007/s11356-021-14853-y
17. Liu H, Lai W, Liu X, Yang H, Fang Y, Tian L, et al. Exposure to copper oxide nanoparticles triggers oxidative stress and endoplasmic reticulum (ER)-stress induced toxicology and apoptosis in male rat liver and BRL-3A cell. J Hazard Mater (2021) 401:123349. doi: 10.1016/j.jhazmat.2020.123349
18. Tsymbal SA, Moiseeva AA, Agadzhanian NA, Efimova SS, Markova AA, Guk DA, et al. Copper-containing nanoparticles and organic complexes: Metal reduction triggers rapid cell death via oxidative burst. Int J Mol Sci (2021) 22:11065. doi: 10.3390/ijms222011065
19. Zhang J, Duan D, Xu J, Fang J. Redox-dependent copper carrier promotes cellular copper uptake and oxidative stress-mediated apoptosis of cancer cells. ACS Appl Mater Interfaces (2018) 10:33010–21. doi: 10.1021/acsami.8b11061
20. Skrott Z, Mistrik M, Andersen KK, Friis S, Majera D, Gursky J, et al. Alcohol-abuse drug disulfiram targets cancer via p97 segregase adaptor NPL4. Nature (2017) 552:194–9. doi: 10.1038/nature25016
21. Chen X, Yang Q, Xiao L, Tang D, Dou QP, Liu J. Metal-based proteasomal deubiquitinase inhibitors as potential anticancer agents. Cancer Metastasis Rev (2017) 36:655–68. doi: 10.1007/s10555-017-9701-1
22. Liu N, Liu C, Li X, Liao S, Song W, Yang C, et al. A novel proteasome inhibitor suppresses tumor growth via targeting both 19S proteasome deubiquitinases and 20S proteolytic peptidases. Sci Rep (2015) 4:5240. doi: 10.1038/srep05240
23. Liu N, Huang H, Dou QP, Liu J. Inhibition of 19S proteasome-associated deubiquitinases by metal-containing compounds. Oncoscience (2015) 2:457–66. doi: 10.18632/oncoscience.167
24. Tsvetkov P, Coy S, Petrova B, Dreishpoon M, Verma A, Abdusamad M, et al. Copper induces cell death by targeting lipoylated TCA cycle proteins. Science (2022) 375:1254–61. doi: 10.1126/science.abf0529
25. Kirshner JR, He S, Balasubramanyam V, Kepros J, Yang CY, Zhang M, et al. Elesclomol induces cancer cell apoptosis through oxidative stress. Mol Cancer Ther (2008) 7:2319–27. doi: 10.1158/1535-7163.MCT-08-0298
26. Allensworth JL, Evans MK, Bertucci F, Aldrich AJ, Festa RA, Finetti P, et al. Disulfiram (DSF) acts as a copper ionophore to induce copper-dependent oxidative stress and mediate anti-tumor efficacy in inflammatory breast cancer. Mol Oncol (2015) 9:1155–68. doi: 10.1016/j.molonc.2015.02.007
27. Gong D, Lu J, Chen X, Reddy S, Crossman DJ, Glyn-Jones S, et al. A copper(II)-selective chelator ameliorates diabetes-evoked renal fibrosis and albuminuria, and suppresses pathogenic TGF-β activation in the kidneys of rats used as a model of diabetes. Diabetologia (2008) 51:1741–51. doi: 10.1007/s00125-008-1088-7
28. Leek JT, Scharpf RB, Bravo HC, Simcha D, Langmead B, Johnson WE, et al. Tackling the widespread and critical impact of batch effects in high-throughput data. Nat Rev Genet (2010) 11:733–9. doi: 10.1038/nrg2825
29. Ritchie ME, Phipson B, Wu D, Hu Y, Law CW, Shi W, et al. Limma powers differential expression analyses for RNA-sequencing and microarray studies. Nucleic Acids Res (2015) 43:e47–7. doi: 10.1093/nar/gkv007
30. Leek JT, Johnson WE, Parker HS, Jaffe AE, Storey JD. The sva package for removing batch effects and other unwanted variation in high-throughput experiments. Bioinformatics (2012) 28:882–3. doi: 10.1093/bioinformatics/bts034
31. Langfelder P, Horvath S. WGCNA: an r package for weighted correlation network analysis. BMC Bioinf (2008) 9:559. doi: 10.1186/1471-2105-9-559
32. Huang HY, Lin YCD, Li J, Huang KY, Shrestha S, Hong HC, et al. miRTarBase 2020: updates to the experimentally validated microRNA–target interaction database. Nucleic Acids Res (2019) 48:D148–54. doi: 10.1093/nar/gkz896
33. Yu G, Wang LG, Han Y, He QY. clusterProfiler: an r package for comparing biological themes among gene clusters. Omics J Integr Biol (2012) 16:284–7. doi: 10.1089/omi.2011.0118
34. Drysdale R, Cook CE, Petryszak R, Baillie-Gerritsen V, Barlow M, Gasteiger E, et al. The ELIXIR core data resources: Fundamental infrastructure for the life sciences. Bioinformatics (2020) 36:2636–42. doi: 10.1093/bioinformatics/btz959
35. Szklarczyk D, Gable AL, Nastou KC, Lyon D, Kirsch R, Pyysalo S, et al. The STRING database in 2021: Customizable protein–protein networks, and functional characterization of user-uploaded gene/measurement sets. Nucleic Acids Res (2021) 49:D605–12. doi: 10.1093/nar/gkaa1074
36. Zhang W, Sun F, Jiang R. Integrating multiple protein-protein interaction networks to prioritize disease genes: A Bayesian regression approach. BMC Bioinf (2011) 12:S11. doi: 10.1186/1471-2105-12-S1-S11
37. Xing C, Dunson DB. Bayesian Inference for genomic data integration reduces misclassification rate in predicting protein-protein interactions. PloS Comput Biol (2011) 7:e1002110. doi: 10.1371/journal.pcbi.1002110
38. Lu LJ, Xia Y, Paccanaro A, Yu H, Gerstein M. Assessing the limits of genomic data integration for predicting protein networks. Genome Res (2005) 15:945–53. doi: 10.1101/gr.3610305
39. Jansen R, Yu H, Greenbaum D, Kluger Y, Krogan NJ, Chung S, et al. A Bayesian networks approach for predicting protein-protein interactions from genomic data. Science (2003) 302:449–53. doi: 10.1126/science.1087361
40. Huang JK, Carlin DE, Yu MK, Zhang W, Kreisberg JF, Tamayo P, et al. Systematic evaluation of molecular networks for discovery of disease genes. Cell Syst (2018) 6:484–495.e5. doi: 10.1016/j.cels.2018.03.001
41. Chin CH, Chen SH, Wu HH, Ho CW, Ko MT, Lin CY. cytoHubba: identifying hub objects and sub-networks from complex interactome. BMC Syst Biol (2014) 8:S11. doi: 10.1186/1752-0509-8-S4-S11
42. Newman AM, Liu CL, Green MR, Gentles AJ, Feng W, Xu Y, et al. Robust enumeration of cell subsets from tissue expression profiles. Nat Methods (2015) 12:453–7. doi: 10.1038/nmeth.3337
43. Sun HJ, Xiong SP, Cao X, Cao L, Zhu MY, Wu ZY, et al. Polysulfide-mediated sulfhydration of SIRT1 prevents diabetic nephropathy by suppressing phosphorylation and acetylation of p65 NF-κB and STAT3. Redox Biol (2021) 38:101813. doi: 10.1016/j.redox.2020.101813
44. Zhang Q, Hu Y, Hu J-E, Ding Y, Shen Y, Xu H, et al. Sp1-mediated upregulation of Prdx6 expression prevents podocyte injury in diabetic nephropathy via mitigation of oxidative stress and ferroptosis. Life Sci (2021) 278:119529. doi: 10.1016/j.lfs.2021.119529
45. Sanchez AP, Zhao J, You Y, Declèves A-E, Diamond-Stanic M, Sharma K. Role of the USF1 transcription factor in diabetic kidney disease. Am J Physiol-Ren Physiol (2011) 301:F271–9. doi: 10.1152/ajprenal.00221.2011
46. Sato AYS, Antonioli E, Tambellini R, Campos AH. ID1 inhibits USF2 and blocks TGF-β-induced apoptosis in mesangial cells. Am J Physiol-Ren Physiol (2011) 301:F1260–9. doi: 10.1152/ajprenal.00128.2011
47. Yang T, Shu F, Yang H, Heng C, Zhou Y, Chen Y, et al. YY1: A novel therapeutic target for diabetic nephropathy orchestrated renal fibrosis. Metabolism (2019) 96:33–45. doi: 10.1016/j.metabol.2019.04.013
48. Hu F, Xue M, Li Y, Jia YJ, Zheng ZJ, Yang YL, et al. Early growth response 1 (Egr1) is a transcriptional activator of NOX4 in oxidative stress of diabetic kidney disease. J Diabetes Res (2018) 2018:1–10. doi: 10.1155/2018/3405695
49. Liu DW, Zhang JH, Liu FX, Wang XT, Pan SK, Jiang DK, et al. Silencing of long noncoding RNA PVT1 inhibits podocyte damage and apoptosis in diabetic nephropathy by upregulating FOXA1. Exp Mol Med (2019) 51:1–15. doi: 10.1038/s12276-019-0259-6
50. Faherty N, O’Donovan H, Kavanagh D, Madden S, McKay GJ, Maxwell AP, et al. TGFβ and CCN2/CTGF mediate actin related gene expression by differential E2F1/CREB activation. BMC Genomics (2013) 14:525. doi: 10.1186/1471-2164-14-525
51. Wang L, Yuan X, Lian L, Guo H, Zhang H, Zhang M. Knockdown of lncRNA NORAD inhibits the proliferation, inflammation and fibrosis of human mesangial cells under high−glucose conditions by regulating the miR−485/NRF1 axis. Exp Ther Med (2021) 22:874. doi: 10.3892/etm.2021.10306
52. Zhao L, Zhao J, Wang X, Chen Z, Peng K, Lu X, et al. Serum response factor induces endothelial-mesenchymal transition in glomerular endothelial cells to aggravate proteinuria in diabetic nephropathy. Physiol Genomics (2016) 48:711–8. doi: 10.1152/physiolgenomics.00082.2016
53. Liu L, Zheng T, Wang F, Wang N, Song Y, Li M, et al. Pro12Ala polymorphism in the PPARG gene contributes to the development of diabetic nephropathy in Chinese type 2 diabetic patients. Diabetes Care (2010) 33:144–9. doi: 10.2337/dc09-1258
54. Yang H, Wang J, Zhang Z, Peng R, Lv D, Liu H, et al. Sp1-induced lncRNA rmrp promotes mesangial cell proliferation and fibrosis in diabetic nephropathy by modulating the miR-1a-3p/JunD pathway. Front Endocrinol (2021) 12:690784. doi: 10.3389/fendo.2021.690784
55. Zhang SZ, Qiu XJ, Dong SS, Zhou LN, Zhu Y, Wang MD, et al. MicroRNA-770-5p is involved in the development of diabetic nephropathy through regulating podocyte apoptosis by targeting TP53 regulated inhibitor of apoptosis 1. Eur Rev Med Pharmacol Sci (2019) 23:1248–56. doi: 10.26355/eurrev_201902_17018
56. Zhang Y, Yao H, Li C, Sun W, Chen X, Cao Y, et al. Gandi capsule improved podocyte lipid metabolism of diabetic nephropathy mice through SIRT1/AMPK/HNF4A pathway. Oxid Med Cell Longev (2022) 2022:1–17. doi: 10.1155/2022/6275505
57. Silambarasan M, Tan J, Karolina D, Armugam A, Kaur C, Jeyaseelan K. MicroRNAs in hyperglycemia induced endothelial cell dysfunction. Int J Mol Sci (2016) 17:518. doi: 10.3390/ijms17040518
58. Wang Y, Zheng Z, Jia Y, Yang Y, Xue Y. Role of p53/miR-155-5p/sirt1 loop in renal tubular injury of diabetic kidney disease. J Transl Med (2018) 16:146. doi: 10.1186/s12967-018-1486-7
59. Peters LJF, Floege J, Biessen EAL, Jankowski J, van der Vorst EPC. MicroRNAs in chronic kidney disease: Four candidates for clinical application. Int J Mol Sci (2020) 21:6547. doi: 10.3390/ijms21186547
60. Bi X, Guo XH, Mo BY, Wang ML, Luo XQ, Chen YX, et al. LncRNA PICSAR promotes cell proliferation, migration and invasion of fibroblast-like synoviocytes by sponging miRNA-4701-5p in rheumatoid arthritis. EBioMedicine (2019) 50:408–20. doi: 10.1016/j.ebiom.2019.11.024
61. Cavalcante P, Mizrachi T, Barzago C, Scandiffio L, Bortone F, Bonanno S, et al. MicroRNA signature associated with treatment response in myasthenia gravis: A further step towards precision medicine. Pharmacol Res (2019) 148:104388. doi: 10.1016/j.phrs.2019.104388
62. Kong X, Wang J, Cao Y, Zhang H, Lu X, Wang Y, et al. The long noncoding RNA MALAT-1 functions as a competing endogenous RNA to regulate MSL2 expression by sponging miR-338-3p in myasthenia gravis. J Cell Biochem (2019) 120:5542–50. doi: 10.1002/jcb.27838
63. Dai Y, Chen Z, Zhao W, Cai G, Wang Z, Wang X, et al. miR-29a-5p regulates the proliferation, invasion, and migration of gliomas by targeting DHRS4. Front Oncol (2020) 10:1772. doi: 10.3389/fonc.2020.01772
64. Han M, Wang S, Fritah S, Wang X, Zhou W, Yang N, et al. Interfering with long non-coding RNA MIR22HG processing inhibits glioblastoma progression through suppression of wnt/β-catenin signalling. Brain (2020) 143:512–30. doi: 10.1093/brain/awz406
65. Chen Y, Zhang J, Gong W, Dai W, Xu X, Xu S. miR-588 is a prognostic marker in gastric cancer. Aging (2021) 13:2101–17. doi: 10.18632/aging.202212
66. Yadav P, Sharma P, Sundaram S, Venkatraman G, Bera AK, Karunagaran D. SLC7A11/ xCT is a target of miR-5096 and its restoration partially rescues miR-5096-mediated ferroptosis and anti-tumor effects in human breast cancer cells. Cancer Lett (2021) 522:211–24. doi: 10.1016/j.canlet.2021.09.033
67. Dou D, Shi YF, Liu Q, Luo J, Liu JX, Liu M, et al. Hsa-miR-202-3p, up-regulated in type 1 gastric neuroendocrine neoplasms, may target. DUSP1. World J Gastroenterol (2018) 24:573–82. doi: 10.3748/wjg.v24.i5.573
68. Yao L, Yang L, Song H, Liu T, Yan H. MicroRNA miR-29c-3p modulates FOS expression to repress EMT and cell proliferation while induces apoptosis in TGF-β2-treated lens epithelial cells regulated by lncRNA KCNQ1OT1. BioMed Pharmacother (2020) 129:110290. doi: 10.1016/j.biopha.2020.110290
69. Luo YF, Wan XX, Zhao LL, Guo Z, Shen RT, Zeng PY, et al. MicroRNA-139-5p upregulation is associated with diabetic endothelial cell dysfunction by targeting c-jun. Aging (2021) 13:1186–211. doi: 10.18632/aging.202257
70. Tang Y, Jin X, Xiang Y, Chen Y, Shen C, Zhang Y, et al. The lncRNA MALAT1 protects the endothelium against ox-LDL-induced dysfunction via upregulating the expression of the miR-22-3p target genes CXCR2 and AKT. FEBS Lett (2015) 589:3189–96. doi: 10.1016/j.febslet.2015.08.046
71. Siragy HM. Interaction of the renin angiotensin and cox systems in the kidney. Front Biosci (2016) 8:215–26. doi: 10.2741/s459
72. Vogt L, de Zeeuw D, Woittiez AJJ, Navis G. Selective cyclooxygenase-2 (COX-2) inhibition reduces proteinuria in renal patients. Nephrol Dial Transplant (2008) 24:1182–9. doi: 10.1093/ndt/gfn644
73. Wang JL, Cheng HF, Shappell S, Harris RC. A selective cyclooxygenase-2 inhibitor decreases proteinuria and retards progressive renal injury in rats. Kidney Int (2000) 57:2334–42. doi: 10.1046/j.1523-1755.2000.00093.x
74. Moeckel GW, Zhang MZ, Mckanna JA, Harris RC. Cyclooxygenase-2 inhibitor blocks expression of mediators of renal injury in a model of diabetes and hypertension1. Kidney Int (2002) 62:929–39. doi: 10.1046/j.1523-1755.2002.00520.x
75. Quilley J, Santos M, Pedraza P. Renal protective effect of chronic inhibition of COX-2 with SC-58236 in streptozotocin-diabetic rats. Am J Physiol-Heart Circ Physiol (2011) 300:H2316–22. doi: 10.1152/ajpheart.01259.2010
76. Baeuerle PA, Baltimore D. Activation of DNA-binding activity in an apparently cytoplasmic precursor of the NF-κB transcription factor. Cell (1988) 53:211–7. doi: 10.1016/0092-8674(88)90382-0
77. Dai F, Du YT, Zheng YL, Zhou B. Inhibiting NF-κB-Mediated inflammation by catechol-type diphenylbutadiene via an intracellular copper- and iron-dependent pro-oxidative role. J Agric Food Chem (2020) 68:10029–35. doi: 10.1021/acs.jafc.0c04399
78. Persichini T, Percario Z, Mazzon E, Colasanti M, Cuzzocrea S, Musci G. Copper activates the NF-κB pathway In vivo. Antioxid Redox Signal (2006) 8:1897–904. doi: 10.1089/ars.2006.8.1897
79. Liu H, Guo H, Deng H, Cui H, Fang J, Zuo Z, et al. Copper induces hepatic inflammatory responses by activation of MAPKs and NF-κB signalling pathways in the mouse. Ecotoxicol Environ Saf (2020) 201:110806. doi: 10.1016/j.ecoenv.2020.110806
80. Yang F, Liao J, Yu W, Pei R, Qiao N, Han Q, et al. Copper induces oxidative stress with triggered NF-κB pathway leading to inflammatory responses in immune organs of chicken. Ecotoxicol Environ Saf (2020) 200:110715. doi: 10.1016/j.ecoenv.2020.110715
81. Nasrallah R, Robertson SJ, Hébert RL. Chronic COX inhibition reduces diabetes-induced hyperfiltration, proteinuria, and renal pathological markers in 36-week B6-Ins2Akita mice. Am J Nephrol (2009) 30:346–53. doi: 10.1159/000229304
82. Agrawal NK. Targeting inflammation in diabetes: Newer therapeutic options. World J Diabetes (2014) 5:697. doi: 10.4239/wjd.v5.i5.697
83. Cheng H, Fan X, Moeckel GW, Harris RC. Podocyte COX-2 exacerbates diabetic nephropathy by increasing podocyte (Pro)renin receptor expression. J Am Soc Nephrol (2011) 22:1240–51. doi: 10.1681/ASN.2010111149
84. Al-Nimer MSM, Al-Deen SM, Abdul Lateef ZW. Rofecoxib prevents ctdsDNA against damage induced by copper sulfate and ultraviolet b radiation in vitro study. J Basic Clin Pharm (2010) 2:21–5.
85. Taheri M, Eghtedarian R, Ghafouri-Fard S, Omrani MD. Non-coding RNAs and type 2 diabetes mellitus. Arch Physiol Biochem (2020), 1–10. doi: 10.1080/13813455.2020.1843498
86. Li H, Dai B, Fan J, Chen C, Nie X, Yin Z, et al. The different roles of miRNA-92a-2-5p and let-7b-5p in mitochondrial translation in db/db mice. Mol Ther - Nucleic Acids (2019) 17:424–35. doi: 10.1016/j.omtn.2019.06.013
87. Pezzolesi MG, Satake E, McDonnell KP, Major M, Smiles AM, Krolewski AS. Circulating TGF-β1-Regulated miRNAs and the risk of rapid progression to ESRD in type 1 diabetes. Diabetes (2015) 64:3285–93. doi: 10.2337/db15-0116
88. Wang H, Tompkins L. CYP2B6: New insights into a historically overlooked cytochrome P450 isozyme. Curr Drug Metab (2008) 9:598–610. doi: 10.2174/138920008785821710
89. Turpeinen M, Zanger UM. Cytochrome P450 2B6: function, genetics, and clinical relevance. Drug Metabol Drug Interact (2012) 27 185–97. doi: 10.1515/dmdi-2012-0027
90. Karin M, Liu Z, Zandi E. AP-1 function and regulation. Curr Opin Cell Biol (1997) 9:240–6. doi: 10.1016/S0955-0674(97)80068-3
91. Sanchez AP, Sharma K. Transcription factors in the pathogenesis of diabetic nephropathy. Expert Rev Mol Med (2009) 11:e13. doi: 10.1017/S1462399409001057
92. Nam JS, Cho MH, Lee GT, Park JS, Ahn CW, Cha BS, et al. The activation of NF-κB and AP-1 in peripheral blood mononuclear cells isolated from patients with diabetic nephropathy. Diabetes Res Clin Pract (2008) 81:25–32. doi: 10.1016/j.diabres.2008.01.032
93. Dou L, Wang S, Sun L, Huang X, Zhang Y, Shen T, et al. Mir-338-3p mediates tnf-A-Induced hepatic insulin resistance by targeting PP4r1 to regulate PP4 expression. Cell Physiol Biochem (2017) 41:2419–31. doi: 10.1159/000475912
94. Wang S, Li L, Chen X, Huang X, Liu J, Sun X, et al. miR−338−3p mediates gluconeogenesis via targeting of PP4R1 in hepatocytes. Mol Med Rep (2018) 18 4129–37. doi: 10.3892/mmr.2018.9400
95. Jacovetti C, Abderrahmani A, Parnaud G, Jonas JC, Peyot ML, Cornu M, et al. MicroRNAs contribute to compensatory β cell expansion during pregnancy and obesity. J Clin Invest (2012) 122:3541–51. doi: 10.1172/JCI64151
96. Giralt A, Denechaud PD, Lopez-Mejia IC, Delacuisine B, Blanchet E, Bonner C, et al. E2F1 promotes hepatic gluconeogenesis and contributes to hyperglycemia during diabetes. Mol Metab (2018) 11:104–12. doi: 10.1016/j.molmet.2018.02.011
97. Singh LP, Andy J, Anyamale V, Greene K, Alexander M, Crook ED. Hexosamine-induced fibronectin protein synthesis in mesangial cells is associated with increases in cAMP responsive element binding (CREB) phosphorylation and nuclear CREB. Diabetes (2001) 50:2355–62. doi: 10.2337/diabetes.50.10.2355
98. Lee D, Le Lay J, Kaestner KH. The transcription factor CREB has no non-redundant functions in hepatic glucose metabolism in mice. Diabetologia (2014) 57:1242–8. doi: 10.1007/s00125-014-3203-2
99. Cao Q, Harris DCH, Wang Y. Macrophages in kidney injury, inflammation, and fibrosis. Physiology (2015) 30:183–94. doi: 10.1152/physiol.00046.2014
100. Kim SM, Lee SH, Lee A, Kim DJ, Kim YG, Kim SY, et al. Targeting T helper 17 by mycophenolate mofetil attenuates diabetic nephropathy progression. Transl Res (2015) 166:375–83. doi: 10.1016/j.trsl.2015.04.013
101. Wang X, Yao B, Wang Y, Fan X, Wang S, Niu A, et al. Macrophage cyclooxygenase-2 protects against development of diabetic nephropathy. Diabetes (2017) 66:494–504. doi: 10.2337/db16-0773
102. Sun H, Tian J, Xian W, Xie T, Yang X. Pentraxin-3 attenuates renal damage in diabetic nephropathy by promoting M2 macrophage differentiation. Inflammation (2015) 38:1739–47. doi: 10.1007/s10753-015-0151-z
103. Mohamed R, Jayakumar C, Chen F, Fulton D, Stepp D, Gansevoort RT, et al. Low-dose IL-17 therapy prevents and reverses diabetic nephropathy, metabolic syndrome, and associated organ fibrosis. J Am Soc Nephrol (2016) 27:745–65. doi: 10.1681/ASN.2014111136
104. Zhang XL, Guo YF, Song ZX, Zhou M. Vitamin d prevents podocyte injury via regulation of macrophage M1/M2 phenotype in diabetic nephropathy rats. Endocrinology (2014) 155:4939–50. doi: 10.1210/en.2014-1020
105. Ji L, Chen Y, Wang H, Zhang W, He L, Wu J, et al. Overexpression of Sirt6 promotes M2 macrophage transformation, alleviating renal injury in diabetic nephropathy. Int J Oncol (2019) 55:103–115. doi: 10.3892/ijo.2019.4800
106. Zheng JM, Yao GH, Cheng Z, Wang R, Liu ZH. Pathogenic role of mast cells in the development of diabetic nephropathy: a study of patients at different stages of the disease. Diabetologia (2012) 55:801–11. doi: 10.1007/s00125-011-2391-2
107. Azab B, Daoud J, Naeem FB, Nasr R, Ross J, Ghimire P, et al. Neutrophil-to-Lymphocyte ratio as a predictor of worsening renal function in diabetic patients (3-year follow-up study). Ren Fail (2012) 34:571–6. doi: 10.3109/0886022X.2012.668741
108. Ciray H, Aksoy AH, Ulu N, Cizmecioglu A, Gaipov A, Solak Y. Nephropathy, but not angiographically proven retinopathy, is associated with neutrophil to lymphocyte ratio in patients with type 2 diabetes. Exp Clin Endocrinol Diabetes Off J Ger Soc Endocrinol Ger Diabetes Assoc (2015) 123:267–71. doi: 10.1055/s-0035-1547257
Keywords: diabetic nephropathy, copper-related genes, WGCNA, transcriptional factors, miRNAs, immune cell infiltration
Citation: Ming J, Sana SRGL and Deng X (2022) Identification of copper-related biomarkers and potential molecule mechanism in diabetic nephropathy. Front. Endocrinol. 13:978601. doi: 10.3389/fendo.2022.978601
Received: 26 June 2022; Accepted: 05 October 2022;
Published: 18 October 2022.
Edited by:
Jehad Ahmed Abubaker, Dasman Diabetes Institute, KuwaitReviewed by:
Alphonse Thanaraj Thangavel, Dasman Diabetes Institute, KuwaitRandhir Singh, Central University of Punjab, India
Copyright © 2022 Ming, Sana and Deng. This is an open-access article distributed under the terms of the Creative Commons Attribution License (CC BY). The use, distribution or reproduction in other forums is permitted, provided the original author(s) and the copyright owner(s) are credited and that the original publication in this journal is cited, in accordance with accepted academic practice. No use, distribution or reproduction is permitted which does not comply with these terms.
*Correspondence: Si Ri Gu Leng Sana, c2FuYTgyMDgxNkAxNjMuY29t