
94% of researchers rate our articles as excellent or good
Learn more about the work of our research integrity team to safeguard the quality of each article we publish.
Find out more
ORIGINAL RESEARCH article
Front. Endocrinol., 22 August 2022
Sec. Clinical Diabetes
Volume 13 - 2022 | https://doi.org/10.3389/fendo.2022.965890
This article is part of the Research TopicPrediabetes: New Insights on the Diagnosis, Risk Stratification, Comorbidites, Cardiovascular Disease, Microvascular Complications, and TreatmentView all 7 articles
 Xiaoyue Zhu1Zhipeng Yang2
 Zhiliang He1Jingyao Hu1Tianxiu Yin1
 Hexiang Bai1
 Ruoyu Li1Le Cai1Haijian Guo3Mingma Li1Tao Yan1You Li1Chenye Shen1Kaicheng Sun4Yu Liu5
 Zilin Sun6
 Bei Wang1*
Background: There is still controversy surrounding the precise characterization of prediabetic population. We aim to identify and examine factors of demographic, behavioral, clinical, and biochemical characteristics, and obesity indicators (anthropometric characteristics and anthropometric prediction equation) for prediabetes according to different definition criteria of the American Diabetes Association (ADA) in the Chinese population.
Methods: A longitudinal study consisted of baseline survey and two follow-ups was conducted, and a pooled data were analyzed. Prediabetes was defined as either impaired fasting glucose (IFG), impaired glucose tolerance (IGT), or elevated glycosylated hemoglobin (HbA1c) according to the ADA criteria. Robust generalized estimating equation models were used.
Results: A total of 5,713 (58.42%) observations were prediabetes (IGT, 38.07%; IGT, 26.51%; elevated HbA1c, 23.45%); 9.66% prediabetes fulfilled all the three ADA criteria. Among demographic characteristics, higher age was more evident in elevated HbA1c [adjusted OR (aOR)=2.85]. Female individuals were less likely to have IFG (aOR=0.70) and more likely to suffer from IGT than male individuals (aOR=1.41). Several inconsistency correlations of biochemical characteristics and obesity indicators were detected by prediabetes criteria. Body adiposity estimator exhibited strong association with prediabetes (D10: aOR=4.05). For IFG and elevated HbA1c, the odds of predicted lean body mass exceed other indicators (D10: aOR=3.34; aOR=3.64). For IGT, predicted percent fat presented the highest odds (D10: aOR=6.58).
Conclusion: Some correlated factors of prediabetes under different criteria differed, and obesity indicators were easily measured for target identification. Our findings could be used for targeted intervention to optimize preventions to mitigate the obviously increased prevalence of diabetes.
Diabetes mellitus (DM), with major complications, is a burdensome and costly disease worldwide, in which type 2 diabetes mellitus (T2DM) accounts for approximately 90% of the total (1, 2). It is reported that 463 million people were living with DM in 2019, and the number is expected to increase to 700 million in 2045 globally (1). Meanwhile, the estimated global direct health expenditure on DM in 2019 is USD 760 billion, let alone its acute and long-term complications on health expenditures (2). Remarkably, China and India are the top 2 epicenters of the global epidemic of T2DM (3). Epidemiological study has revealed that approximately 11% of the Chinese were suffering from DM, with a significant proportion undiagnosed (4). Although China has committed to combat DM through health system reform and national initiatives, the burdens of DM and its complications remain an ongoing challenge (5–7).
People at intermediate stages of hyperglycemia conditions, which are considered as prediabetes, could be at high risk of developing DM, since a large proportion of people with prediabetes progresses towards DM (8). Despite the tremendous efforts for prolonging lives of DM patients, DM remains as the eighth leading cause of death among both sexes and fifth leading cause of death in women (9). Without doubt, it is more important to put focus on prediabetes, which can be the effective target of high-risk groups. As the vast majority of individuals with prediabetes are unaware of their diagnosis, it is vital that the associated conditions should be identified and people with high risk of prediabetes need to be targeted, so they may benefit from early intervention (10, 11). Moreover, prediabetes is a risk factor for the development of cardiovascular disease and stroke (12). Macrovascular complications may already present before the official diagnosis of DM; as a result, prediabetes should not be reflected as benign with the absence of co-morbid conditions (8, 10). Thus, target identification and early prevention for prediabetes are not only beneficial for the alarming epidemic of DM but also contribute to slow down the overall prevalence of diabetic complications (8, 12). A previous study has suggested that even though interventions in people classified as having prediabetes by screening have some efficacy in preventing or delaying onsets of DM in trial populations, “screen and treat” policies alone are unlikely to have substantial impact on the worsening epidemic of DM (13). Hence, effective strategies to identify, inform, and motivate individuals at risk to get tested, and appropriate managements to initiate lifestyle interventions to these people as well, are core components to assure widespread adoption of interventions at reasonable costs (14).
To halt the epidemic of diabetes, we need to target those at risk of developing prediabetes and steer effective strategies, which premises from understanding the characteristics of individuals at “high-risk” systematically. Even though the new thresholds for defining prediabetes have been around for more than 10 years, there is still controversy surrounding the precise characterization of prediabetic population (15). To date, little is known about the prediabetic conditions, and some knowledge of prediabetes gaps still remains in China (16), especially with regard to the potentially different characteristics of prediabetic subgroups classified by impaired fasting glucose (IFG), impaired glucose tolerance (IGT), or elevated glycosylated hemoglobin (HbA1c), in which more tailored and adjusted advices for interventions could be needed. As IFG, IGT, and elevated HbA1c pose different underlying pathophysiologies, the efficacy of different preventive measures may differ for these prediabetic groups (8). Thus, we investigated the overlap in populations that have prediabetes defined by one of the three prediabetes criteria. Furthermore, we aim to comprehensively identify and examine factors of demographic, behavioral, clinical, and biochemical characteristics, and obesity indicators (anthropometric characteristics and anthropometric prediction equation) that are correlated with prediabetes defined by different prediabetes criteria in the Chinese population.
A longitudinal study, which consisted of a baseline survey conducted from April to July 2017 and its two follow-ups from July to August 2018 and from July to August 2020, was established in Jiangsu province, China. Multistage-stratified sampling method was used from Jurong Zhengjiang and Yandu Yancheng, two cities in Jiangsu province (Supplementary Material 1: Figure S1). Detailed information about study design, organization, and implementation of this longitudinal study has been described previously (17). Overall, 5,250 residents participated in the baseline survey, which consisted of a questionnaire and physical and laboratory examinations. A total of 4,331 participants without diabetes who met the inclusion criteria were recruited in the baseline study and received two follow-up studies: follow-up 1 (2018, n=3,060) and follow-up 2 (2020, n=2,994). We pooled data from these three studies with a total of 10,385 observations. As the aim of our study was putting focus on preventive efforts of people with high risk of diabetes, observations with newly diagnosed diabetes were excluded from the analysis sample (n=488). We further excluded those observations with certain anthropometric or biochemical examination uncompleted (n=27) and with missing values in one of the outcome variables (fasting plasma glucose (FPG), namely, 2-h postprandial glucose (2hPG) or HbA1c (n=91). This resulted in a final analysis sample of 9,779 observations across three time points. Thus, we obtained an analysis dataset with repeated observations, including 859 participates with one observation, 1,496 participants with two observations, and 1,976 participants with three observations. By design, Figure 1 shows detailed information of the study flowchart, in which enrollment and exclusion criteria are presented.
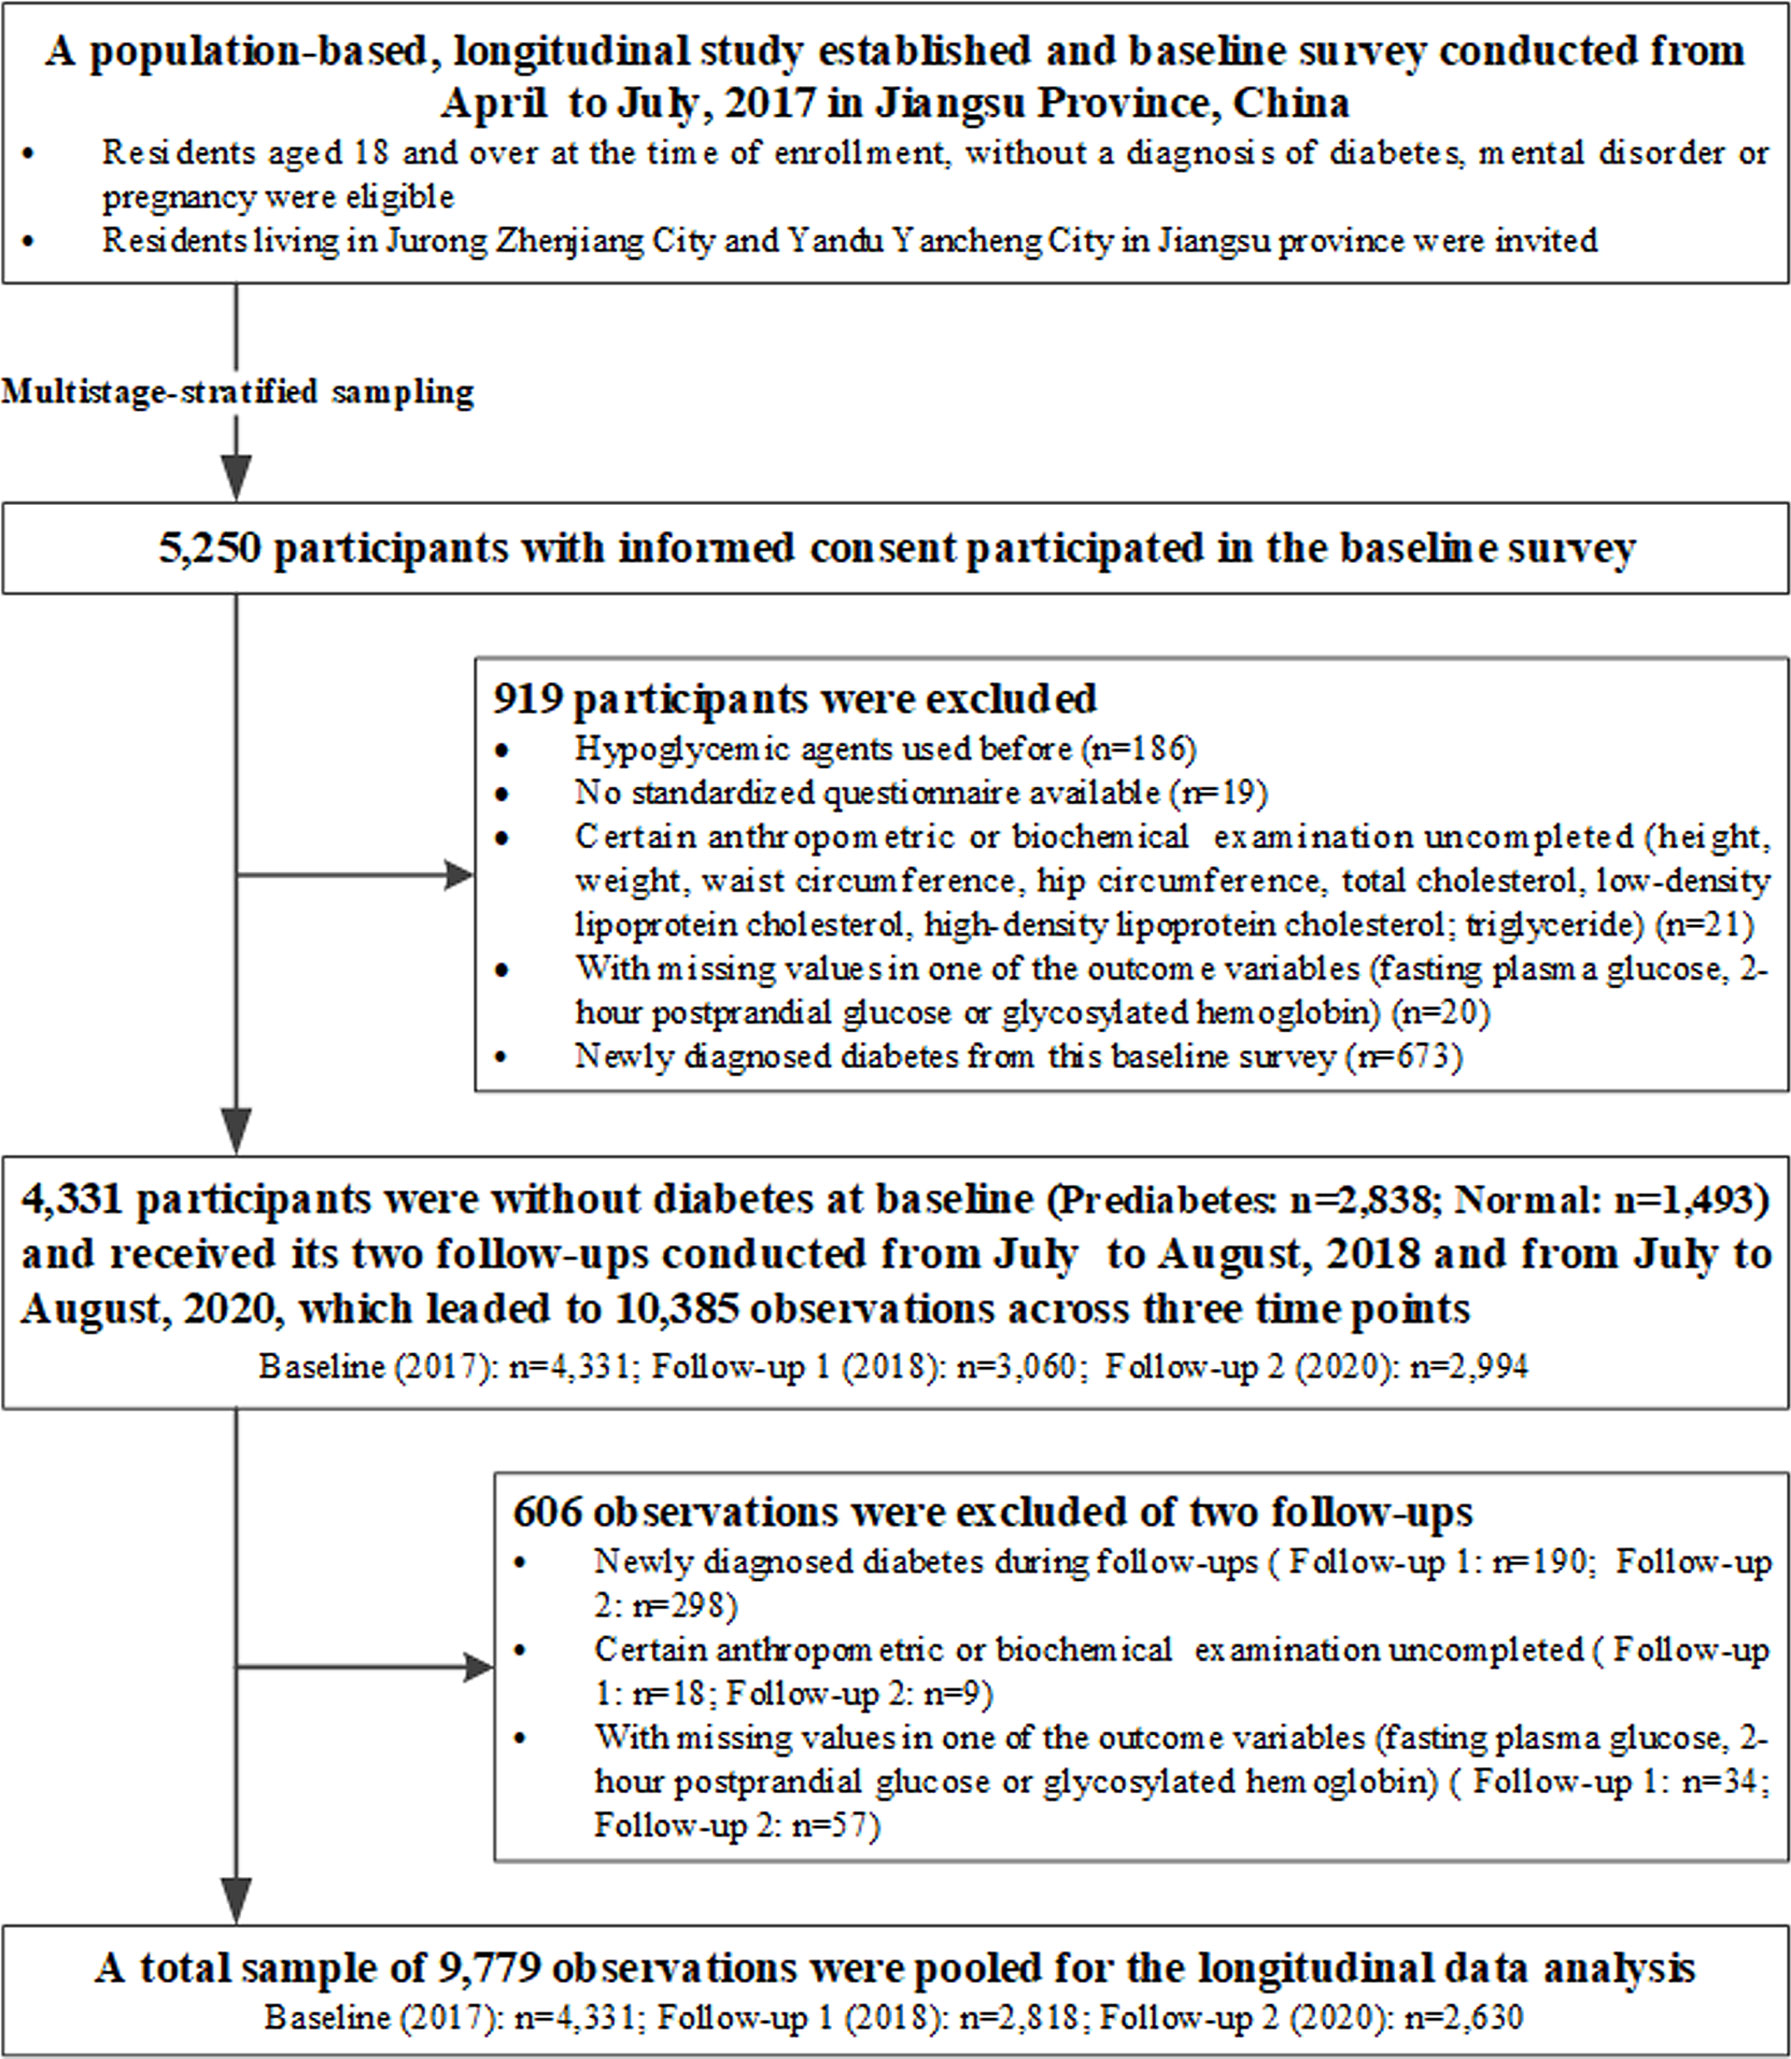
Figure 1 Flowchart for selection of study participants.
This study was conducted in accordance with the Declaration of Helsinki. The study was viewed and approved by the Ethics Review Committee of Zhongda Hospital, Southeast University, and Jiangsu Provincial Centre for Disease Control and Prevention (JSJK2017-B003-02). All study participants provided written informed consent.
In all these three studies, participants completed an interview conducted by experienced local health workers using a standardized questionnaire to collect information regarding demographic characteristics (age, gender, education level and self-reported drug history, equivalent household income, and family history of diabetes), and behavioral characteristics (smoking status, drinking status, and regular exercise). These characteristics were further categorized as follows: age (<50/50–59/≥60), gender (male/female), education level (junior high school or below/senior high school or above), equivalent household income (low: per capita monthly household income < 1,000 RMB; moderate: 1,000 RMB ≤ per capita monthly household income < 3,000 RMB; high: per capita monthly household income ≥ 3000RMB), drug history (no/yes: drugs included antihypertensive agent, antilipemic agent, antithrombotic agent, antineoplastic agent, and non-steroid anti-inflammatory drug), and family history of diabetes (no/yes/unclear). Smoking status was divided as follows: non-smoker, current smoker or ex-smoker, and drinking status as (never/ever). Regular exercise was grouped as follows: no and yes (recreational sports activities more than 30 min per time, more than three times a week). Participants were asked to have at least a 5-min rest in a seated position before their systolic and diastolic blood pressures were measured by electronic sphygmomanometers. Hypertension was defined as a systolic blood pressure ≥140 mmHg and/or a diastolic blood pressure ≥90 mm Hg, or using antihypertensive agent (18).
Forearm venous blood samples were collected and measured for biochemical characteristics after overnight fasting for more than 8 h before examination. Subsequently, standard oral glucose tolerance tests (75 g anhydrous glucose) were administered and conducted without eating breakfast; 2 h later, a second blood sample was taken for 2hPG. Blood tests were all conducted in the same central laboratory (Adicon, Nanjing China) to maintain consistency and included FPG, 2hPG, HbA1c, total cholesterol (TC), low-density lipoprotein cholesterol (LDL-C), high-density lipoprotein cholesterol (HDL-C), and triglyceride (TG). Classifications of cholesterol and triglyceride levels were based on the Chinese guideline for the management of dyslipidemia in adults, which was consistent with the National Lipid Association Recommendation (19, 20). They were grouped as follows: TC (above desirable: <5.2 mmol/L; borderline high: 5.2–6.1 mmol/L; high: ≥6.2 mmol/L), LDL-C (desirable: <2.6 mmol/L; above desirable: 2.6–3.3 mmol/L; borderline high: 3.4–4.0 mmol/L; high: ≥4.1mmol/L), HDL-C (normal: ≥1.0 mmol/L; low: <1.0 mmol/L), and TG (above desirable: <1.7 mmol/L; borderline high, 1.7–2.2 mmol/L; high: ≥2.3 mmol/L). Weight was measured with a digital scale to the nearest 0.1 kg with light clothes, and height was measured to the nearest 0.1 cm using a wall-mounted stadiometer. Waist circumference (WC) and hip circumference were measured using a tape with a metric scale under standardized procedures, with the participants in a standing position. Waist-to-height ratio (WHtR) (21), waist-to-hip ratio (WHR) (22), body mass index (BMI) (23), ponderal index (PI) (24), conicity index (25), relative fat mass (RFM) (26), abdominal volume index (AVI) (27), lipid accumulation product (LAP) (28), visceral adiposity index (VAI) (29), Chinese visceral adiposity index (CVAI) (30), body roundness index (BRI) (31), and body adiposity estimator (BAE) were calculated based on the formulas, respectively (Supplementary Materials 2) (32). We derived predicted lean body mass, fat mass, and percent fat (%) by using anthropometric prediction equations developed and validated by the National Health and Nutrition Examination Survey previously, which included 7,531 men and 6,534 women who underwent dual-energy X-ray absorptiometry-measured examination (33). Details on the calculation of anthropometric characteristics and prediction equations can be found in Supplementary Materials 2. The thresholds for WC were specified according to the International Diabetes Foundation for the Chinese populations (WC > 80 cm for women and WC > 90 cm for men) (34). WHtR ≥ 0.50 was considered as the optimal cutoff value in the Chinese adults (35). According to the World Health Organization, the cutoff values for WHR were defined (0.85 in women and 0.90 in men) (34). The classification of BMI was defined according to the criteria of the working group on obesity in China (23): underweight (BMI < 18.5 kg/m2), normal (18.5 ≤ BMI < 24.0 kg/m2), overweight (24.0 ≤ BMI < 28.0 kg/m2), and obesity (BMI ≥ 28.0 kg/m2). We created quartiles for other anthropometric characteristics and anthropometric prediction equation, as there were lack of specific cutoffs for clinical practice (36), with quartile 1 (Q1) representing the lowest level and quartile 4 (Q4) standing for the highest level. All the factors of anthropometric characteristics and anthropometric prediction equation, considered as obesity indicators, were furtherly classified into deciles, in which decile 1 (D1) presented the lowest level and decile 10 (D10) showed the highest level. The method of questionnaires and physical and laboratory examinations for the two follow-ups was exactly as same as for the baseline survey. All variables, including demographic, behavioral, clinical and biochemical, and anthropometric characteristics, and anthropometric prediction equation were similarly assessed at each follow-up. Therefore, pooling of these three studies was allowed.
Prediabetes and diabetes were defined according to the diagnostic criteria of the American Diabetes Association (ADA) (37). An FPG ≥ 7.0mmol/L and/or a 2hPG ≥ 11.1 mmol/L and/or an HbA1c ≥ 6.5% were defined as diabetes (37, 38). Participants with IFG (5.6 mmol/L ≤ FPG < 7.0 mmol/L) and/or IGT (7.8 mmol/L ≤ 2hPG < 11.1 mmol/L) and/or elevated HbA1c (5.7% ≤ HbA1c < 6.5%) were defined as prediabetes (37). Accordingly, people with an FPG <5.6 mmol/L and 2hPG <7.8 mmol/L and HbA1c 5.7% were defined as normal glucose tolerance.
Descriptive statistics were used to present participant characteristics, with mean ± standard deviations (SDs), median with inter quartile range, or numbers with percentages to present characteristics of participants when appropriate. The χ2 test for categorical variables or t test and the Wilcoxon tests for continuous variables were introduced for statistical evaluations of demographic, behavioral, clinical, and biochemical characteristics, and obesity indicators (anthropometric characteristics and anthropometric prediction equation) between prediabetes and the normal group at baseline. Given the correlations between repetitive observations among baseline study and follow-up studies, which violated independence assumptions that are required for traditional regression procedures (39), and in order to increase the analytical power, robust generalized estimating equation (GEE) models with a binary distribution using a logit link and exchange structure were applied for the pooled analysis sample. The correlation coefficients between two repetitive outcome measurements at each follow-up times were approximately equal (Supplementary Materials 1: Table S1). Univariate and multivariate models were simultaneously adopted with odd ratios (ORs) and 95% confidence intervals (CIs) to analyze factors correlated with prediabetes classified by the three diagnostic criteria separately and combined. For the aspects of anthropometric characteristics and anthropometric prediction equation, obesity indicators were correlated with each other and were evaluated in separate multivariate models. Covariate missingness in our pooled sample ranged from 0% to 0.34% (0.05% for drinking status and 0.34% for hypertension). We created five imputed datasets using multivariate imputation by chained equations (MICE) package in R software, and the main analysis results were pooled after appropriate transformation (40). All statistical analyses were performed with R software (version 4.1.1). Two-sided p-values <0.05 were considered as statistically significant.
A total of 4,331 participants without diabetes (prediabetes: n=2,838; normal: n=1,493) were included in the baseline study in 2017 and received its two follow-ups in 2018 and 2020, respectively. Hence, a total sample of 9,779 observations that fitted all inclusion criteria (baseline: n=4,331; follow-up 1 = 2,818; follow-up 2 = 2,630) were pooled for the longitudinal data analysis (Figure 1). A total of 1,672 (38.61%) men and 2,659 (61.39%) women were included at baseline. The average ages were 52.03 ± 8.61 for prediabetes and 48.64 ± 9.97 for the normal group at study entry. All of the characteristics were compared between the prediabetes and normal group for baseline study (Supplementary Materials 1: Table S2). A summary on the characteristics of observations combined by three studies with and without prediabetes is presented in Table 1. Totally, 5,713 (58.42%) observations were prediabetes (IGT: 38.07%; IGT: 26.51%; elevated HbA1c: 23.45%).
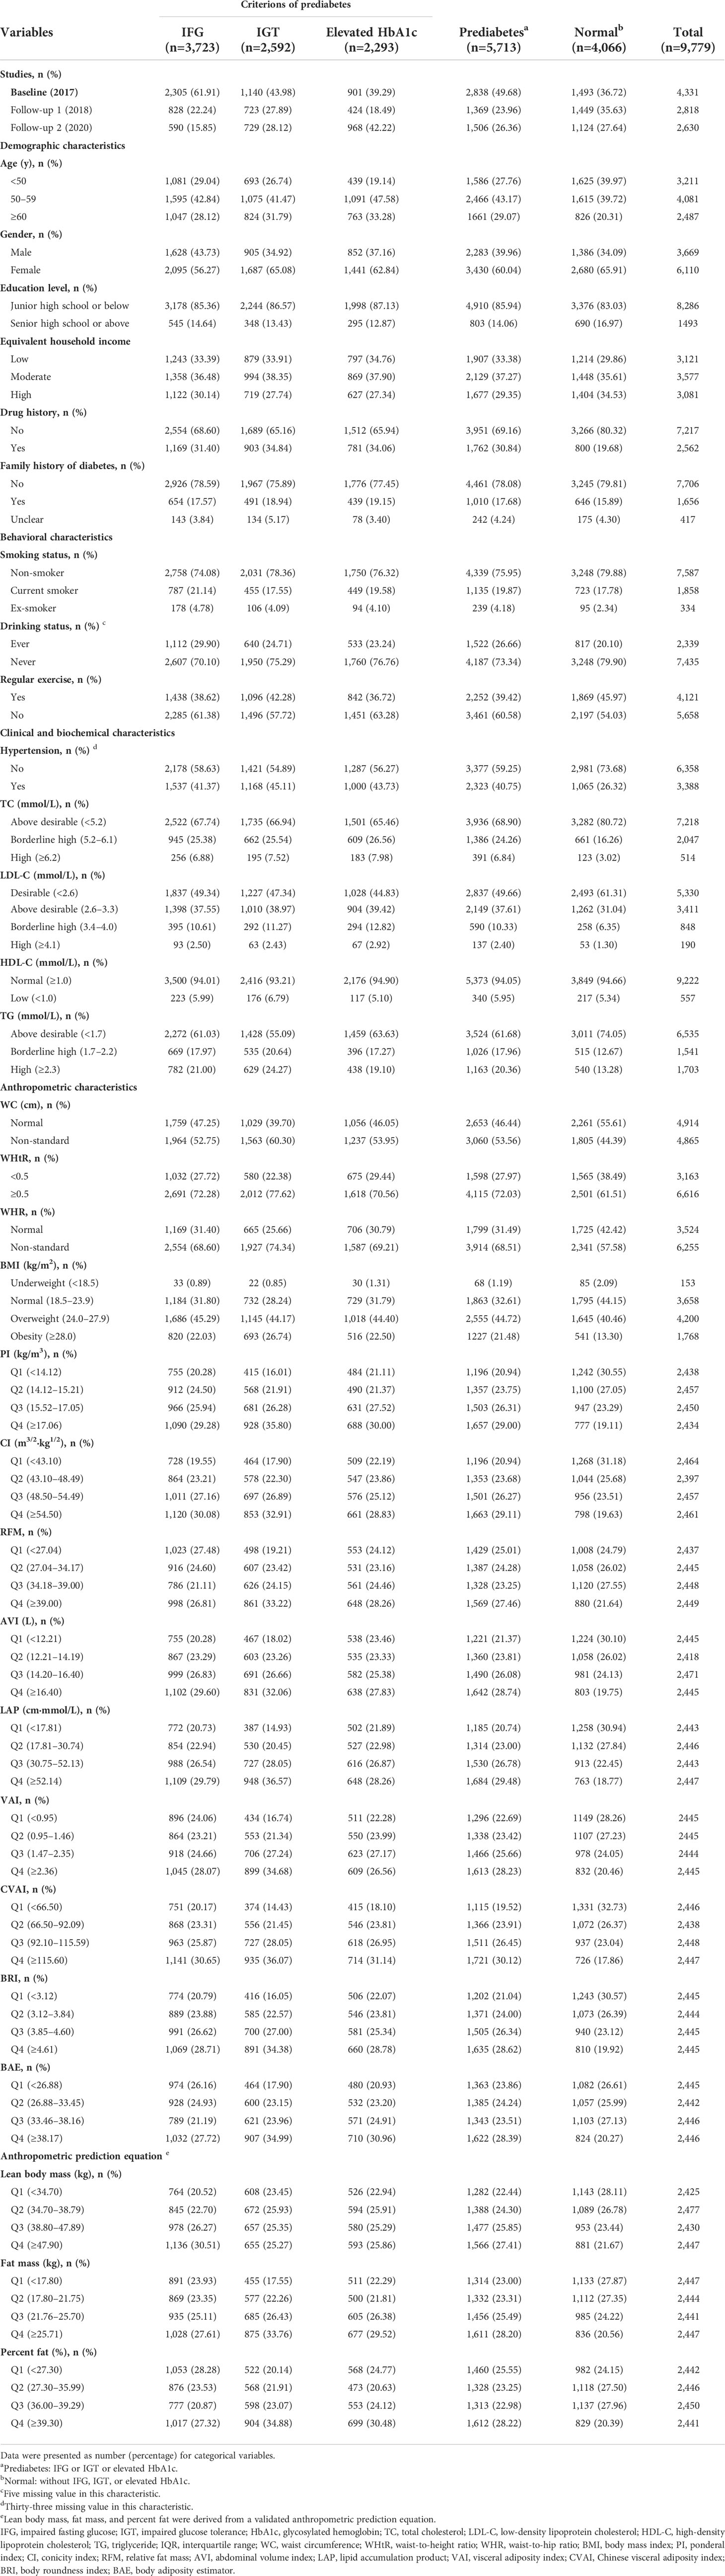
Table 1 Characteristics of the observations without diabetes.
A total of 552 (9.66%) observations satisfied all the three ADA criteria among 5,713 prediabetes, and 1,791(31.35%) fulfilled two of them simultaneously. A total of 852 (14.91%) overlapped between IFG and IGT, showing the largest overlap, whereas the smallest (6.07%) was found between IGT and elevated HbA1c (Figure 2). In the stratified analyses, the distributions were consistent with the total observations. Proportion of IFG were higher in men (71.31%) than in women (61.08%) with prediabetes, whereas the proportion of IGT or elevated HbA1c was higher in women (49.18%, 42.01%) than in men (39.64%, 37.32%). Additionally, the proportion of prediabetes fulfilling all the criteria was lower in men (8.63%) than in women (10.35%) (Supplementary Materials 1: Figure S2).
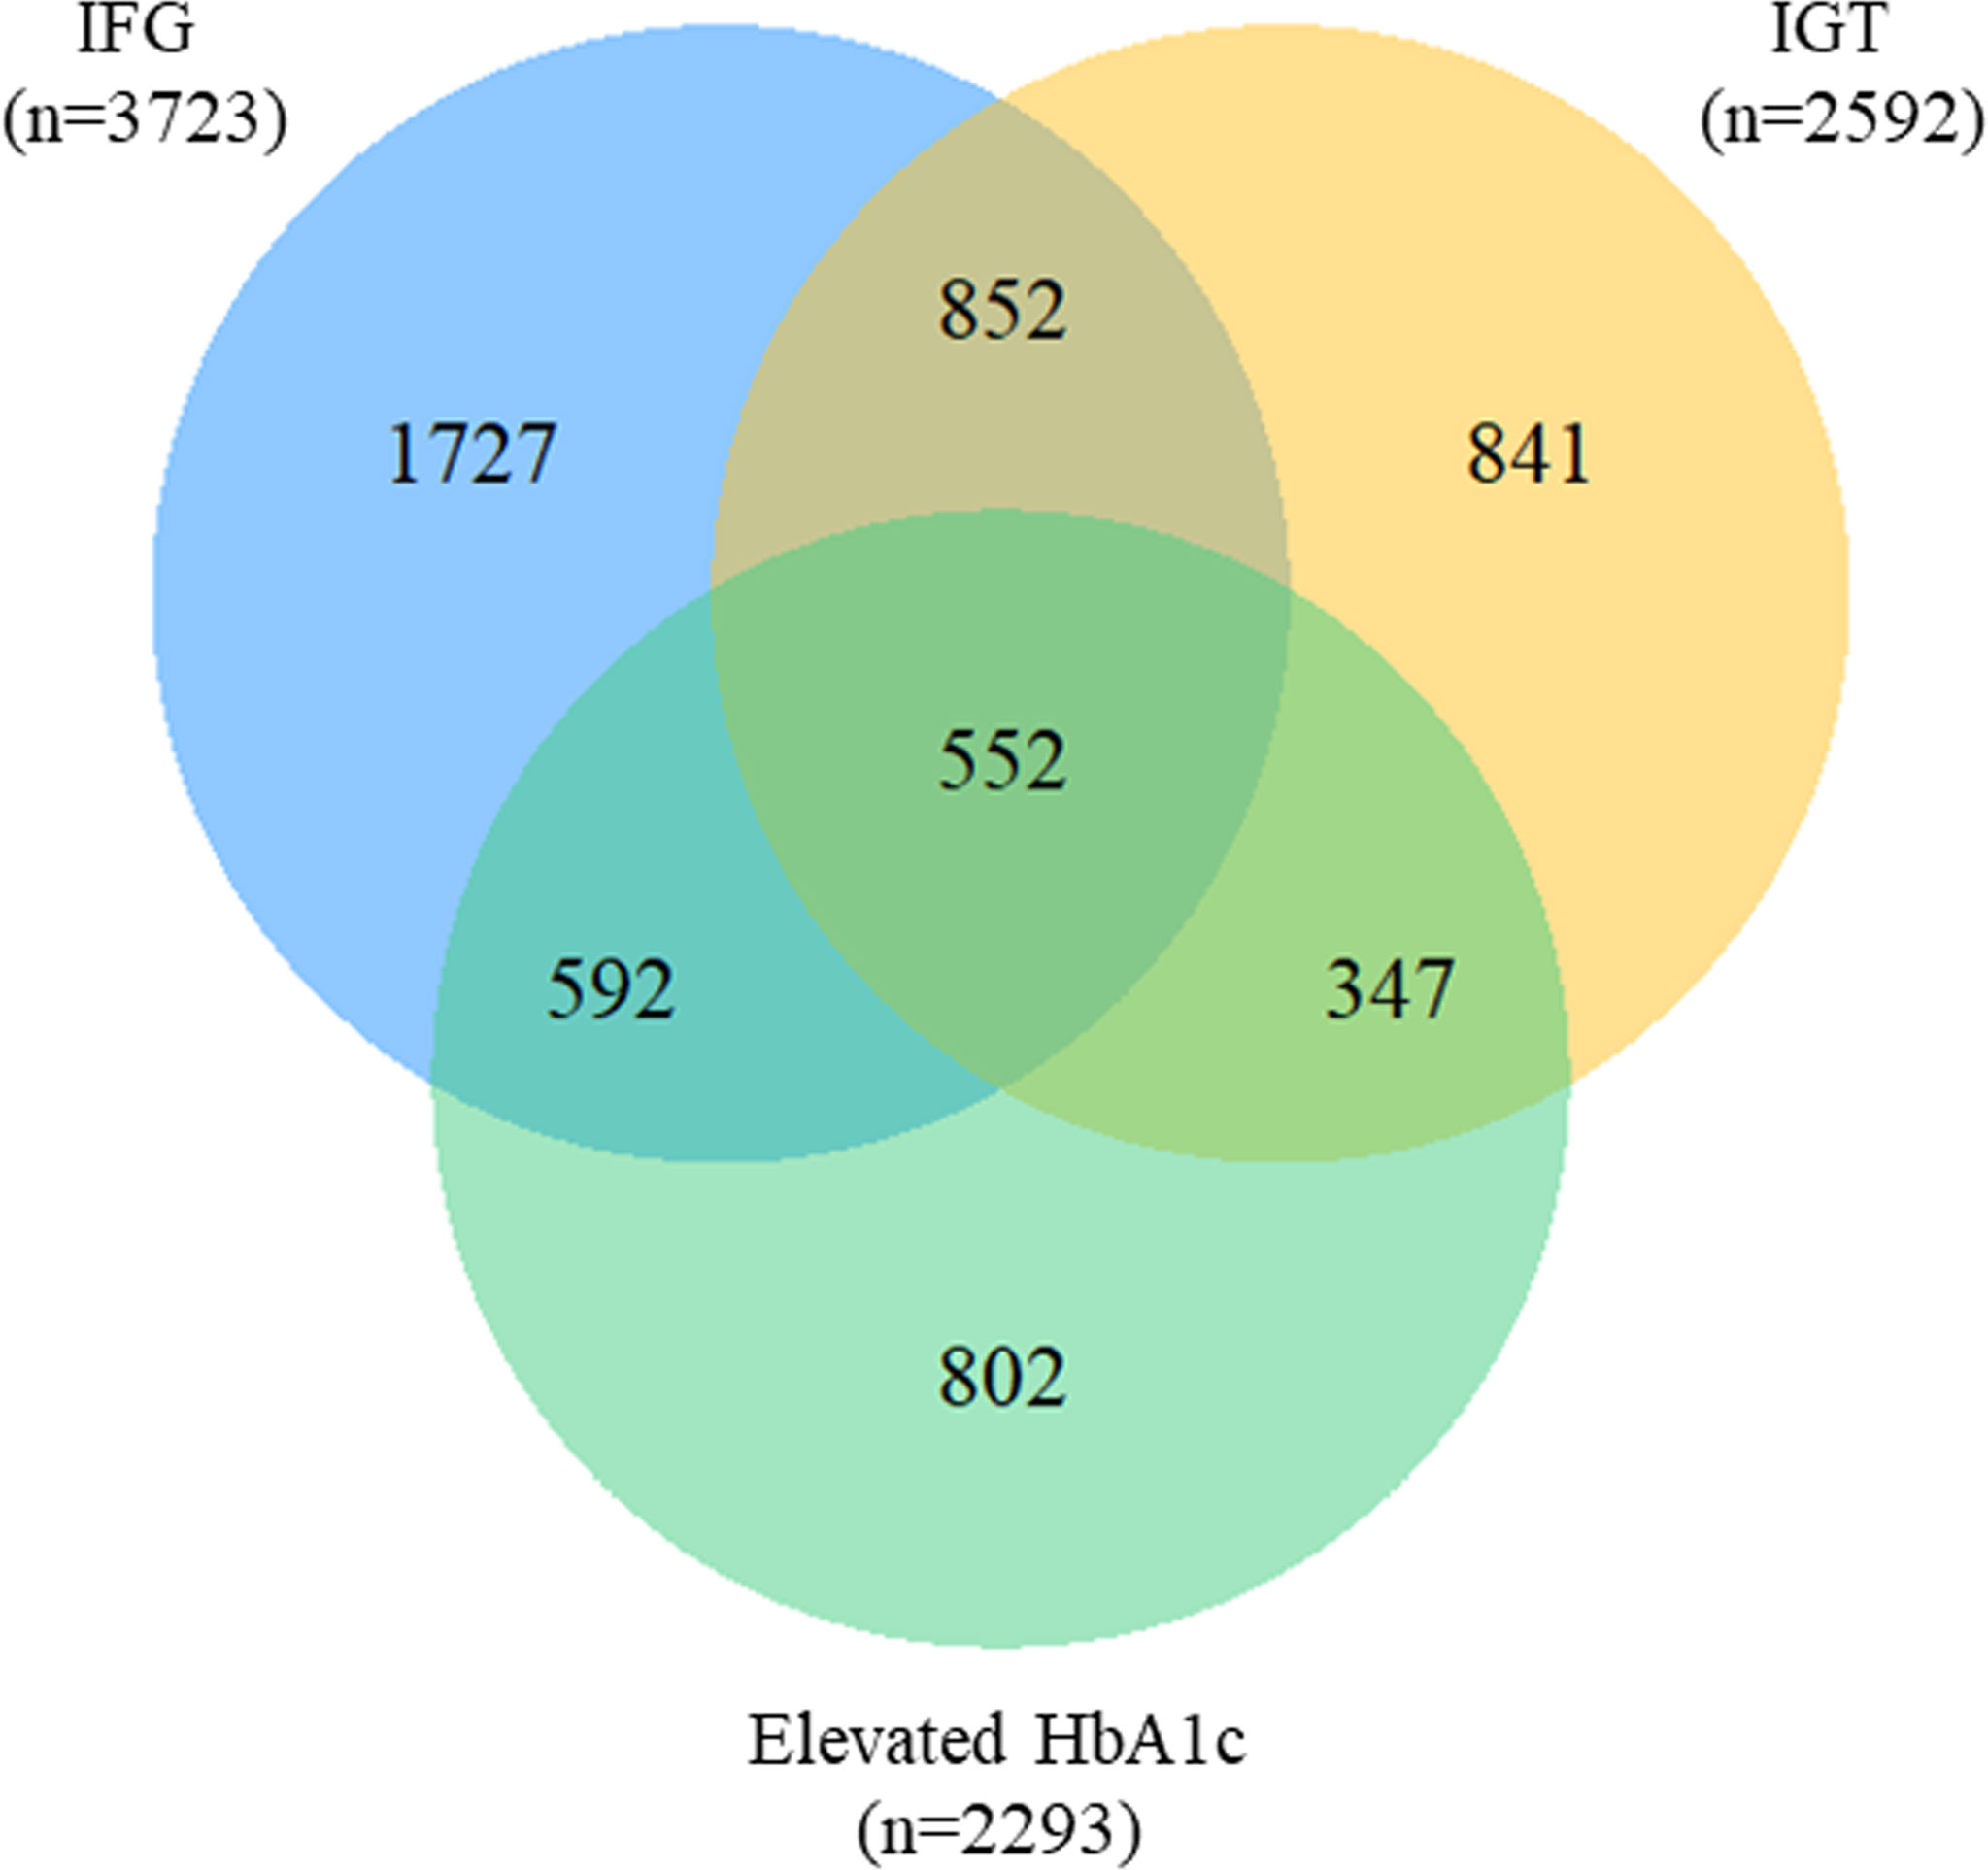
Figure 2 Venn diagram for the overlap of prediabetes criteria. IFG, impaired fasting glucose; IGT, impaired glucose tolerance; HbA1c, glycosylated hemoglobin.
Compared with participants aged below 50 years, the higher age groups were more likely to suffer from prediabetes by multivariate analysis (ptrend<0.01), especially in participants aged ≥ 60 years [adjusted OR (aOR)=1.74, 95% CI: 1.52–2.00]. Similar associations were also found in IGT (aOR=1.74, 95% CI: 1.50–2.01) and elevated HbA1c, which seemed more evident (aOR=2.85, 95% CI: 2.42–3.35). However, no significant association was detected between age groups and IFG (ptrend=0.22). Being a woman (aOR=0.83, 95% CI: 0.72–0.96) and having a higher education level (aOR=0.80, 95% CI: 0.69-0.92) significantly decreased the likelihood of having prediabetes. According to the three criteria of prediabetes, women were less likely to have IFG and more likely to suffer from IGT than men. No significant association was found in gender for elevated HbA1c. Additionally, only IFG presented association with education levels. High equivalent household income was only correlated with IFG (aOR=0.88, 95% CI: 0.78–0.99). No significant associations of drug history were found in any prediabetes types. People with family history of diabetes consistently showed increased odds for having prediabetes of any criterion except for IFG (aOR=1.09, 95% CI: 0.95–1.24) (Supplementary Materials 3: Table S1). For behavioral characteristics, smoking status showed no association with prediabetes. Compared with people drinking alcohol, those who never drink showed decreased likelihood of having prediabetes (aOR=0.82, 95% CI: 0.72–0.93), while a contrary association was detected in elevated HbA1c category (aOR=1.19, 95% CI: 1.03–1.38). People without regular exercise presented higher odder (aOR=1.43, 95% CI: 1.32–1.55), but not for IGT (Supplementary Materials 3: Table S1). In terms of clinical and biochemical characteristics, having hypertension (aOR=1.33, 95% CI: 1.17–1.53), high TC (aOR=1.97, 95% CI: 1.49–2.62), above desirable LDL-C (aOR=1.18, 95% CI: 1.06–1.30), and high TG (aOR=1.35, 95% CI: 1.19–1.54) were associated with increased odds of prediabetes. Generally, factors of this aspect showed consistent associations categorized by prediabetes criteria, except the correlation between TC and elevated HbA1c (Supplementary Materials 3: Table S1).
Factors of anthropometric characteristics and anthropometric prediction equation were also presented. Among these 16 obesity indicators, BAE was correlated with all classifications of prediabetes, and only VAI was not significantly associated with prediabetes classified by any criterion in multivariate models. Non-standard WC, WHtR, WHR, and higher levels of BMI were correlated with increased odds of prediabetes. These correlations were consistent according to prediabetes diagnostic criteria, except for HbA1c. For other obesity indicators, people with higher quartiles had higher odds of experiencing prediabetes. Inconsistencies were found in CI, RFM, AVI, LAP, CVAI, BRI, predicted fat mass, and percent fat classified by prediabetes criteria (Supplementary Materials 3: Table S1). We further introduced deciles of these obesity indicators to examine the associations in finer categories (Supplementary Materials 1: Table S3; Figures 3–6). BAE exhibited consistently strong association with prediabetes, especially at 10th deciles (aOR=4.05, 95% CI: 3.02–5.42) (Figure 6). For IFG, the odds of predicted lean body mass exceeded that of the others (D10: aOR=3.34, 95% CI: 1.92–5.81) (Figure 3). Except predicted lean body mass, other 15 obesity indicators all presented significant associations with IGT, particularly at 9th and 10th deciles in predicted percent fat (aOR=5.28, 95% CI: 3.48–8.00; aOR=6.58, 95% CI: 4.33–10.00) (Figure 4). Correspondingly, only BMI, PI, CVAI, BAE, and predicted lean body mass made sense in detecting correlation with elevated HbA1c, in which predicted lean body mass presented the highest odds at 10th deciles (aOR=3.64, 95% CI: 1.92–6.91) (Figures 5, 6).
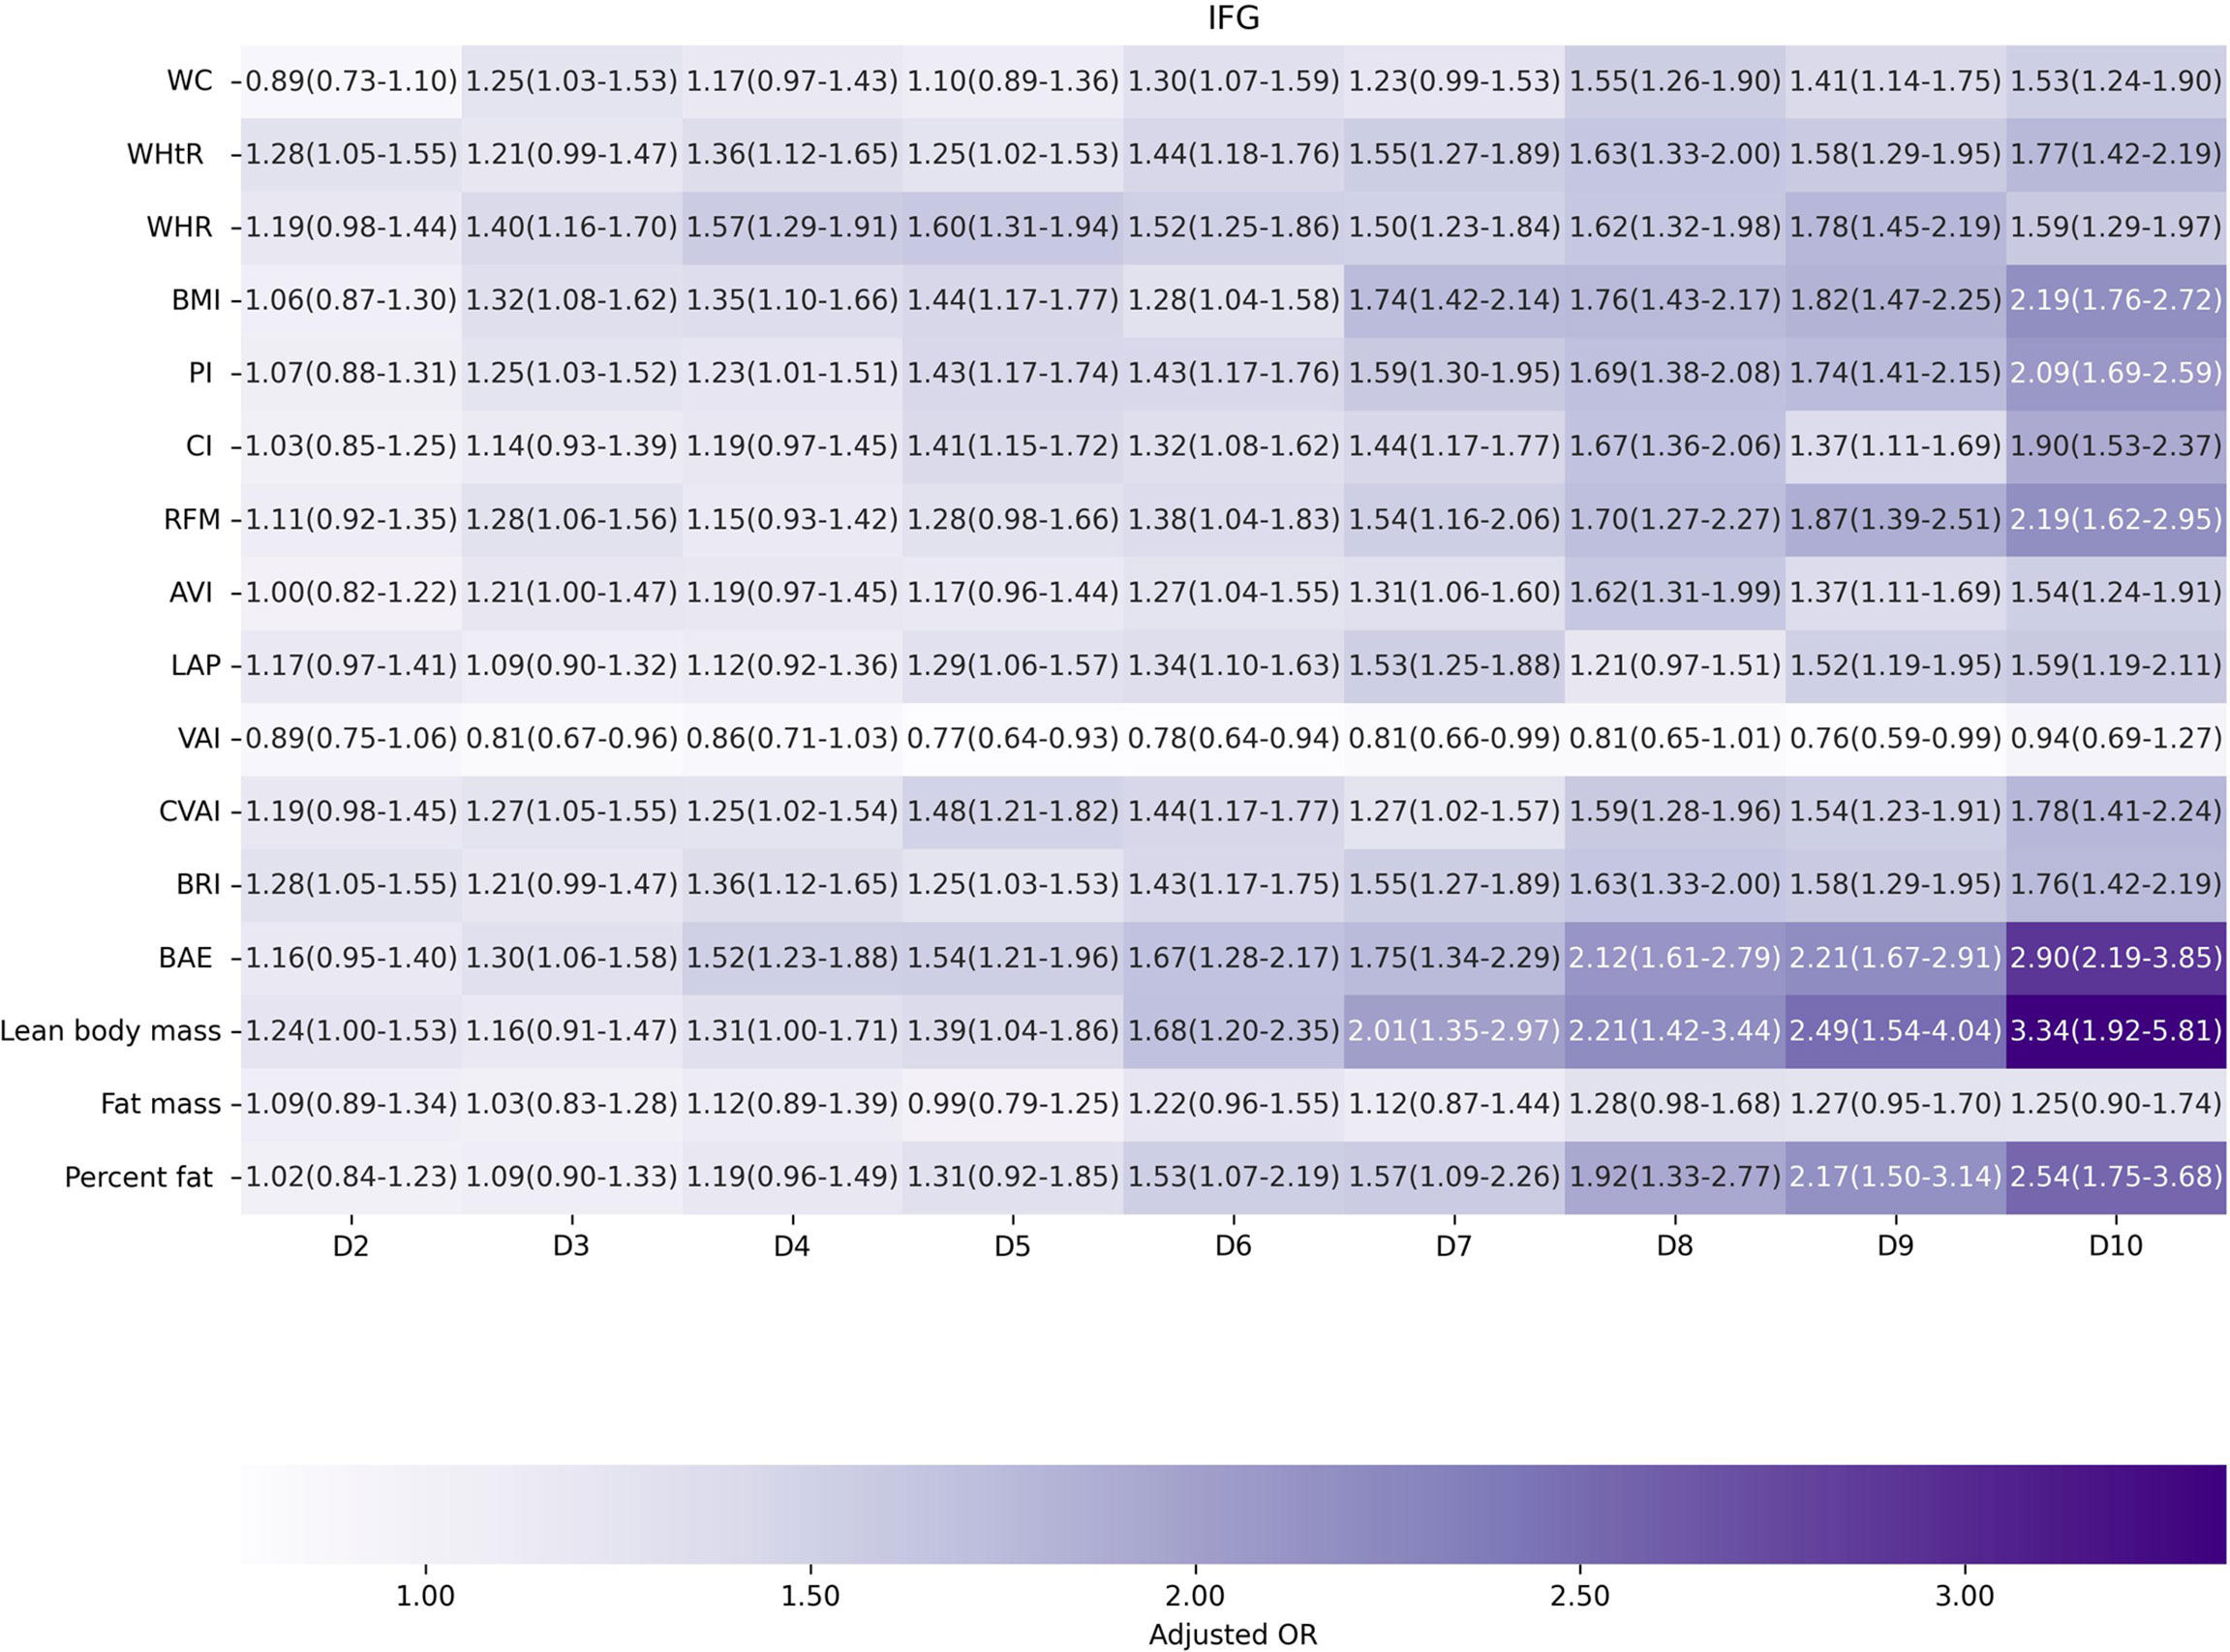
Figure 3 The association between deciles of obesity indicators and impaired fasting glucose. The first decile (D1) was used as reference. Adjusted for age, gender, education level, equivalent household income, drug history, family history of diabetes, smoking status, drinking status, regular exercise, hypertension, TC, LDL-C, HDL-C, and TG; for lean body mass, fat mass and height were further adjusted; for fat mass, lean body mass and height were further adjusted. WC, waist circumference; WHtR, waist-to-height ratio; WHR, waist-to-hip ratio; BMI, body mass index; PI, ponderal index; CI, conicity index; RFM, relative fat mass; AVI, abdominal volume index; LAP, lipid accumulation product; VAI, visceral adiposity index; CVAI, Chinese visceral adiposity index; BRI, body roundness index; BAE, body adiposity estimator.
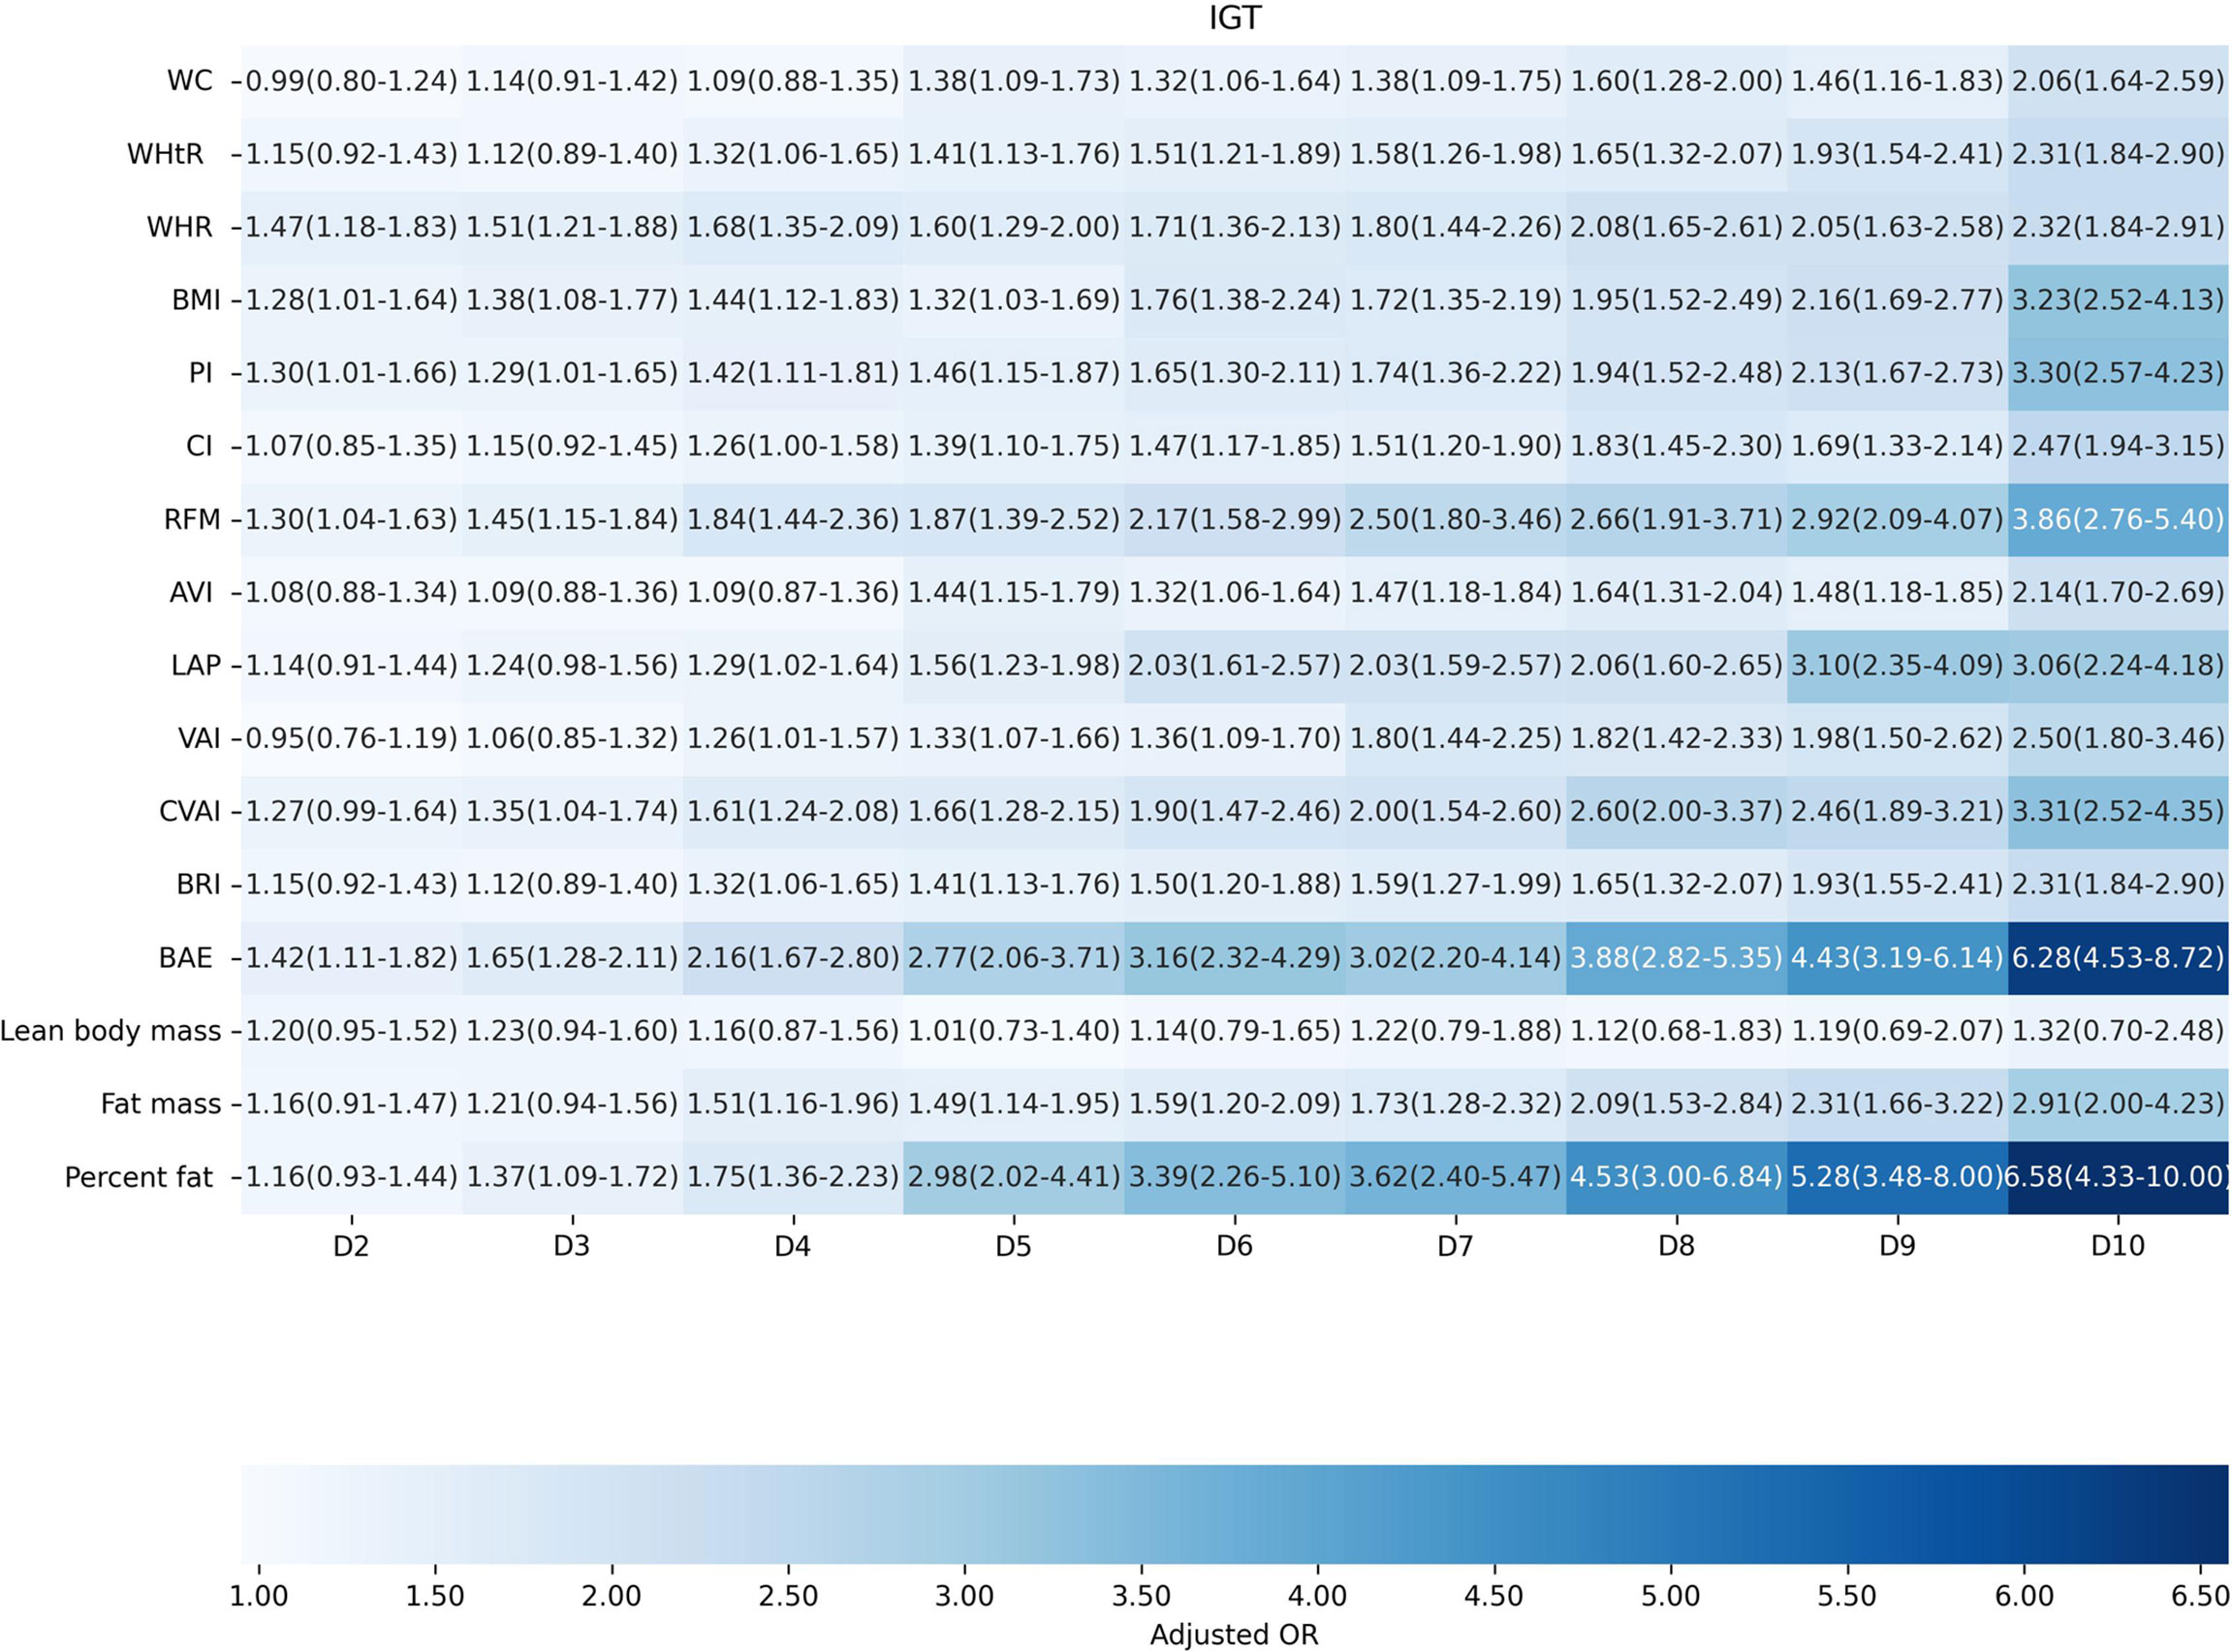
Figure 4 The association between deciles of obesity indicators and impaired glucose tolerance. The first decile (D1) was used as reference. Adjusted for age, gender, education level, equivalent household income, drug history, family history of diabetes, smoking status, drinking status, regular exercise, hypertension, TC, LDL-C, HDL-C, and TG; for lean body mass, fat mass and height were further adjusted; for fat mass, lean body mass and height were further adjusted. WC, waist circumference; WHtR, waist-to-height ratio; WHR, waist-to-hip ratio; BMI, body mass index; PI, ponderal index; CI, conicity index; RFM, relative fat mass; AVI, abdominal volume index; LAP, lipid accumulation product; VAI, visceral adiposity index; CVAI, Chinese visceral adiposity index; BRI, body roundness index; BAE, body adiposity estimator.
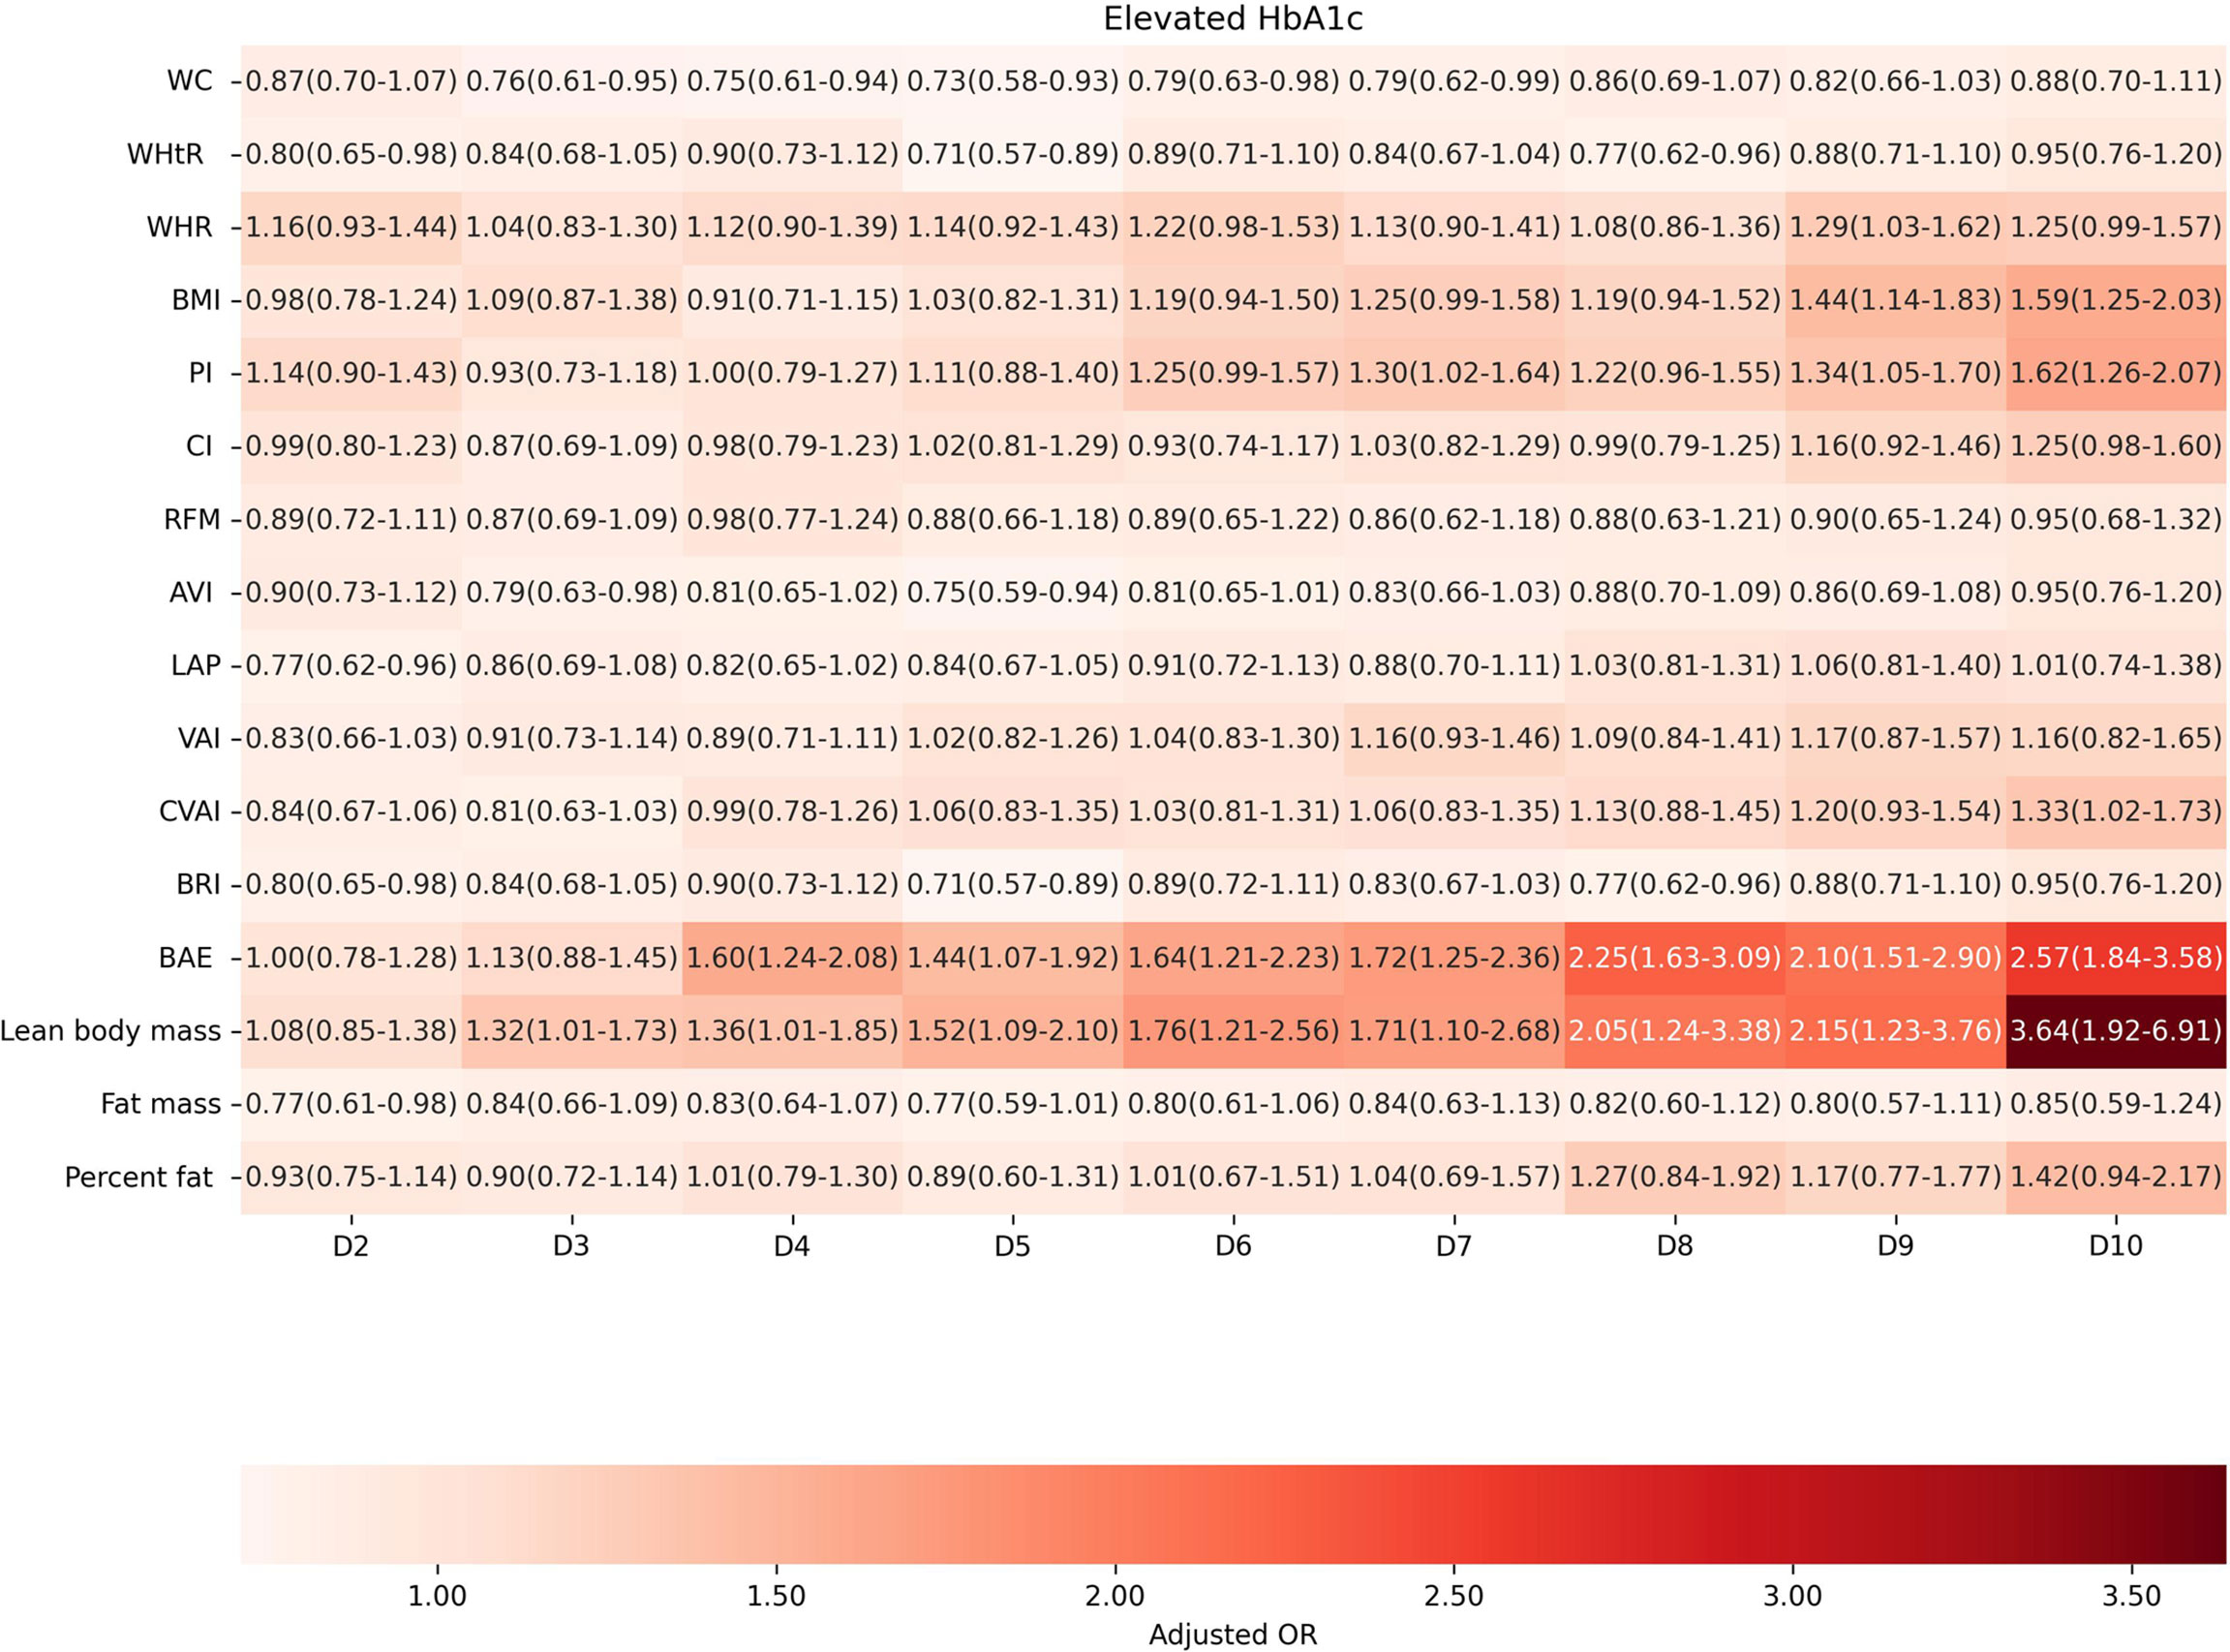
Figure 5 The association between deciles of obesity indicators and elevated HbA1c. The first decile (D1) was used as reference. Adjusted for age, gender, education level, equivalent household income, drug history, family history of diabetes, smoking status, drinking status, regular exercise, hypertension, TC, LDL-C, HDL-C, and TG; for lean body mass, fat mass and height were further adjusted; for fat mass, lean body mass and height were further adjusted. WC, waist circumference; WHtR, waist-to-height ratio; WHR, waist-to-hip ratio; BMI, body mass index; PI, ponderal index; CI, conicity index; RFM, relative fat mass; AVI, abdominal volume index; LAP, lipid accumulation product; VAI, visceral adiposity index; CVAI, Chinese visceral adiposity index; BRI, body roundness index; BAE, body adiposity estimator.
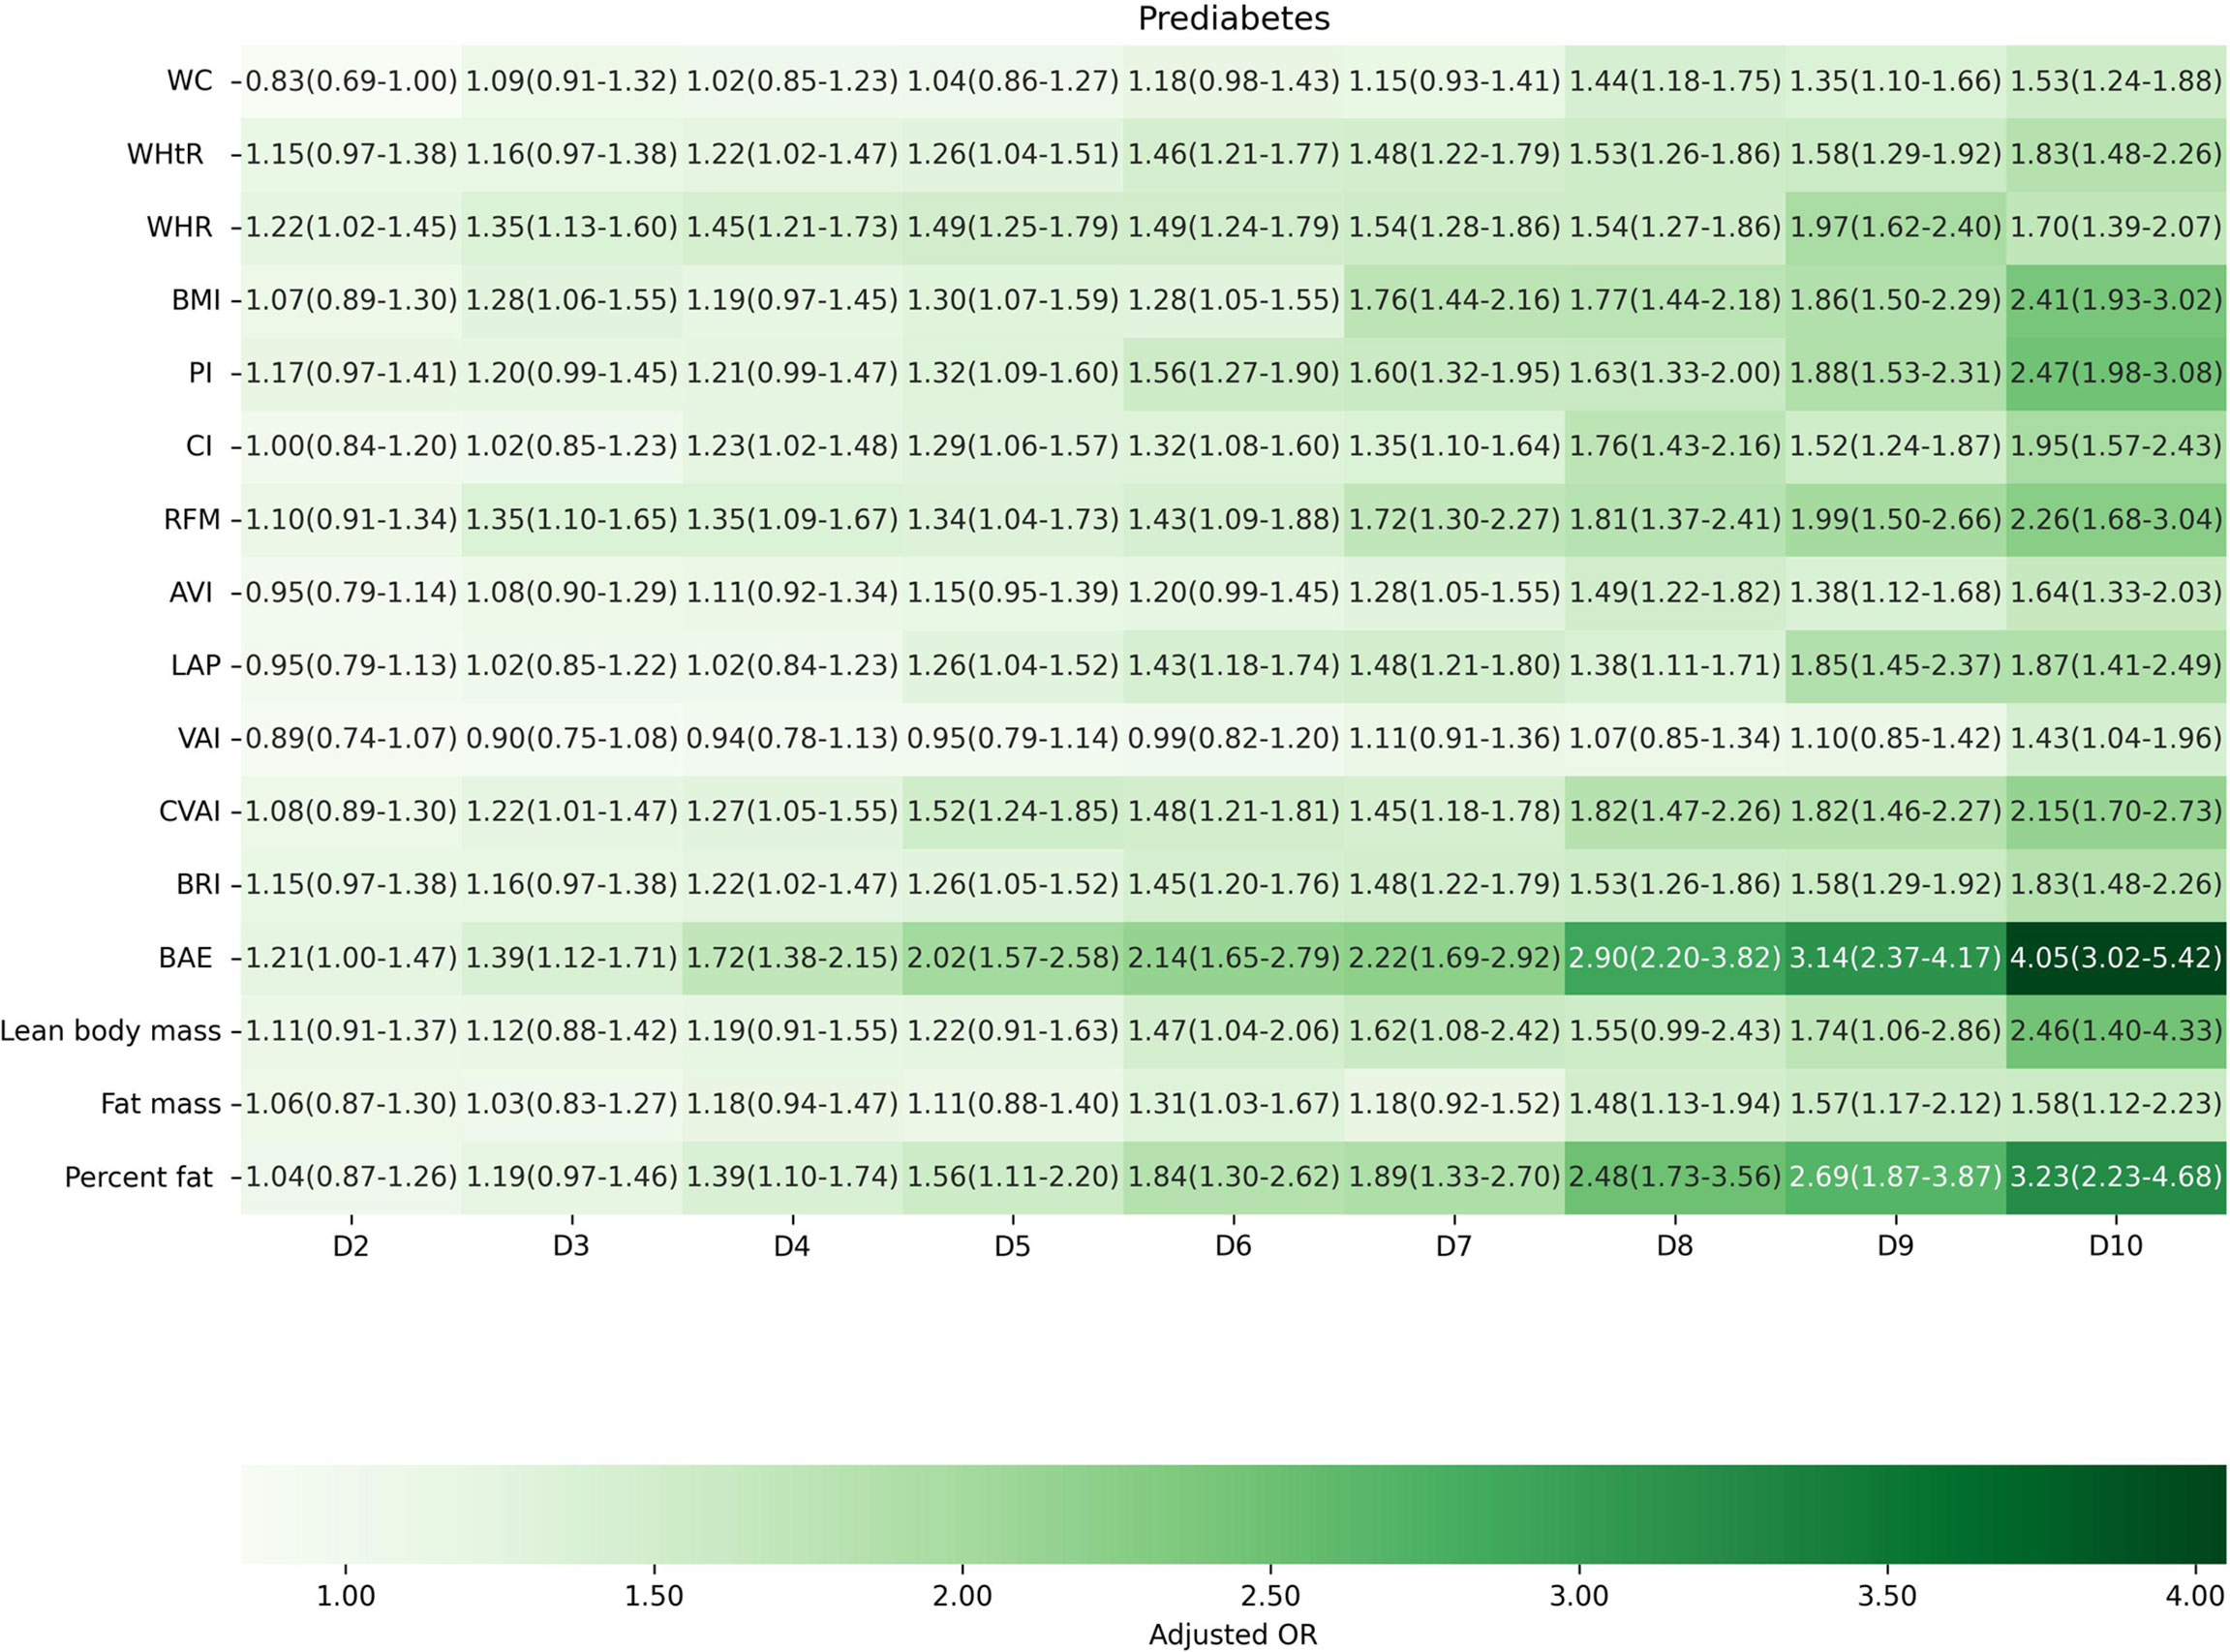
Figure 6 The association between deciles of obesity indicators and prediabetes based on the combined criteria of American Diabetes Association. The first decile (D1) was used as reference. Adjusted for age, gender, education level, equivalent household income, drug history, family history of diabetes, smoking status, drinking status, regular exercise, hypertension, TC, LDL-C, HDL-C, and TG; for lean body mass, fat mass and height were further adjusted; for fat mass, lean body mass and height were further adjusted. WC, waist circumference; WHtR, waist-to-height ratio; WHR, waist-to-hip ratio; BMI, body mass index; PI, ponderal index; CI, conicity index; RFM, relative fat mass; AVI, abdominal volume index; LAP, lipid accumulation product; VAI, visceral adiposity index; CVAI, Chinese visceral adiposity index; BRI, body roundness index; BAE, body adiposity estimator.
DM, a silent killer, is a growing epidemic with disease burden increased globally (1, 41). Currently, DM and its complications constitute huge health burden in China (7). As prediabetes is a precursor before the diagnosis of DM, aiming people at high risk of prediabetes, identifying factors for the early screening of prediabetes, and implementing early prevention program could be cost effective and essential to break the vicious cycle of DM epidemic (8, 12, 13). Hence, knowledge on the correlated factors of corresponding high-risk groups classified by ADA diagnostic criteria of prediabetes was important for targeted and tailored prevention approaches. In our present study, we comprehensively identified and evaluated factors of demographic, behavioral, clinical, and biochemical characteristics, anthropometric characteristics, and anthropometric prediction equation that were correlated with prediabetes defined by different prediabetes criteria in the Chinese population. As far as we know, there are few studies that take full range of factors into consideration for prediabetes explicitly in a large Chinese population, particularly for the more extensive obesity indicators.
A meta-analysis that pooled five studies with three tests used (FPG, 2hPG, and HbA1c) showed that 8.7% prediabetes fulfilled all the three criteria of ADA (13). A study in Guangdong, China conducted in 2010 reported that the joint distribution of IGT, IFG, and elevated HbA1c was 5.2% (42). In addition, Gregory and colleagues revealed that the overlap in people with IGT, IFG, and elevated HbA1c levels was small (14). A similar finding of the overlap was also found in our present study. Comparable to the study of Gregory, with IGT showing the much lower proportion of prediabetes in their study (14), the elevated HbA1c took the lowest proportion in our study. Our present study suggested that the distribution of IFG, IGT, and elevated HbA1c of prediabetes in China was different from that in Europe, particular in gender, in which European women were mostly classified as prediabetes with the HbA1c criteria (13, 14), while prediabetic phenotype distributions under different diagnostic criteria stratified by gender were consistent with the total observations in our study. Therefore, it might be eligible to carry out certain types of prevention for these different prediabetic groups in China.
A considerable number of studies have found that the risk of prediabetes increased with the increase in age (16, 43), which was similar to our present study. The most likely pathophysiological reason could be that the human body became less sensitive to insulin and the β cells got altered insulin production with advancing age (44). Additionally, our study found that higher age groups were more likely to suffer from IGT and HbA1c, except IFG. These findings were partially consistent with the study of Gregory, in which the association between IFG and age was also detected in their study (14). It was reported that there were 17.1 million more men diagnosed with DM than women (16), and our study also presented that women had lower odds for total prediabetes when compared with men. Nevertheless, compared with men, a higher odd in women was detected for IGT. To date, no study has revealed the association between gender and IGT separately in the Chinese population. Income and smoking status in our study were found to have no statistical association with prediabetes in the multivariable analysis, which was consistent with a European study (14). Compared with previous studies, we also found that other demographic characteristics, such as educational level, drug history, family history, and regular exercise, presented similar associations with prediabetes (14, 16, 43, 45). It is suggested that alcohol was a risk factor for DM when consumed above a certain threshold value, and it reduced the risk of DM when below the threshold value (46). A European study found no statistical association between alcohol consumption and prediabetes, and only a decreased risk was detected between alcohol consumption and elevated HbA1c (14). Our study presented that a never drinking status was associated with a reduced risk of prediabetes. However, an increased risk was detected for elevated HbA1c phenotype when compared with people who ever drank alcohol. Nevertheless, Shinya and colleagues conducted a study to estimate the effect of alcohol consumption on the plasma glucose in non-diabetic men and found that as the level of alcohol consumption increased, the plasma glucose levels rose, but the HbA1c level was lower, which was partially verified by our findings (46). Although there was controversy on the topic of alcohol consumption, alcohol consumption negatively impacted diabetes self-care adherence (47). We found that hypertension was correlated with increased risk for prediabetes, which was consistent with previous studies (14, 45). For the aspect of dyslipidemia, a Spanish study reported the association of TC, LDL-c, and TG with IFG (48). A study of Mexican-Americans detected that HDL-c and TG were related to prediabetes, and no associations were found in TC and LDL-c (43). In our study, only TC, LDL-c, and TG presented correlations with prediabetes, and inconsistencies existed among certain prediabetic phenotypes.
Our results regarding the association between prediabetes and certain obesity indicators, which were well-studied recently, such as WC, WHtR, WHR, and BM, were consistent with previous findings where increases in WC, WHtR, WHR, and BMI were correlated with increased odds of prediabetes (45). However, we found that WC, WHtR, and WHR all failed to detect the association with the elevated HbA1c. Remarkably, obesity has been associated with an increased risk of T2DM, and the obese phenotypes were complex (36). It was suggested that the risk of obesity did not lie so much in the amount of fat accumulated but in its distribution (36). WC was a major clinical parameter for indirect evaluation of increased visceral fat, but it did not contribute to distinguish between subcutaneous and visceral fat mass (29). However, none of the anthropometric indices were considered a sufficiently accurate method for the estimation of adiposity and its distribution. To the best of our knowledge, it was the first study to take these anthropometric indices into account comprehensively, which estimated the associations in every certain prediabetic phenotypes in the Chinese population. In addition, it could contribute to the evaluation of the predictive capacity of these indicators to identify people with high risk of prediabetes. Although a recent study reported that a specific PI growth trajectory pattern during adolescence might be critical for diabetes prevention efforts (49), few studies examined the association between PI and prediabetes in adults. Conicity index was considered as a simple anthropometric index of body fat distribution to assess the central obesity with high accuracy (25). Mirelli and colleagues reported that the conicity index was an important tool in estimating the risk of DM in women (50). In our present study, we found that the conicity index was correlated with IFG and IGT, except elevated HbA1c group. RFM, as a new estimator of whole-body fat percentage, provided high predictability for dyslipidemias and metabolic syndrome (51). A cohort study suggested that RFM was confirmed to outperform BMI in predicting overall mortality but was not superior to WHR or WC (52). Our study presented that RFM showed stronger correlation than WC, WHtR, WHR, and BMI for prediabetes but failed to detected association with the elevated HbA1c. Previous studies suggested that significant positive correlations were observed between AVI, LAP, BRI, BAE, and DM (53–56), but few studies have focused on the Chinese population and prediabetes. BAE showed the strongest correlation than other indicators for total prediabetes in our study. A study for discriminating prediabetes/diabetes in the German population showed that VAI is a useful index for identifying prediabetes/diabetes in both men and women, as it is a valuable indictor of visceral adipose function (57), whereas no significant association between VAI and prediabetes was found in our study. The pronounced differences in body fat distribution existed among various ethnicities (58). It was worth mentioning that VAI seemed not suitable for the Chinese, as the Asian population is characterized by relatively higher body fat content at lower BMI values when compared with Caucasians (30). In contrast to VAI, CVAI was created for the Chinese population (30), and it was found to be correlated with prediabetes in our study. Furthermore, anthropometric prediction equation was applied and found that predicted fat mass demonstrated consistently stronger association with DM risk in the US people (33). However, the association between other indicators of anthropometric prediction equation and prediabetes remained absent. In our study, the odds of predicted lean body mass exceed other indicators for IFG and elevated HbA1c, and predicted percent fat presented the highest odds for IGT. Our results of obesity indicators provide new insights on the relationship between obesity and prediabetes, which in turn could help improve clinical and public health intervention for early prediabetes prevention.
There was no doubt that prevention approaches in Chinese individuals should differ from those advocated in other populations currently (4). The precise knowledge of prediabetes was not only helpful to distinguish people who might develop prediabetes from those who might not (15) but also contribute to self-identification and self-management. Thus, targeted and regular screening for people at high risk of prediabetes could be cost saving than universal screening (13, 14). Meanwhile, intervention via lifestyle changes of these people might be of importance to provide an excellent opportunity in the early prevention to reduce the prevalence and burden of DM. Moreover, the different criteria only showed limited overlap of prediabetes population in our study, which may indicate that people with different pathophysiologies were identified, as IGT and IFG have a different underlying pathophysiology (8). It is likely that the efficacy of different preventive treatments may differ for these subgroups. Thus, personalized interventions targeting these factors and measures were needed among Chinese adults. Obviously, the prediabetic population was far from being homogeneous, and phenotyping it into less heterogeneous groups might prove useful for long-term risk assessment, follow-up, and primary prevention (15). Several merits of our study deserve to be pointed. First, the population-based design, standardized data collection methods, and strict laboratory measurement with all the three tests used (FPG, 2hPG, and HbA1c) insured the reliability of the data, which permitted accurate estimates for the factors. Second, application of the GEE models provided an opportunity to power the overall study and prediabetes diagnostic criteria-specific analyses. Third, a broad set of obesity indicators were systematically evaluated in our study, incompletely characterized in previous studies, which were pragmatic and easy-to-measure characteristics as potential predictors for targeted screening and personalized intervention. However, some limitations existed. First, potential bias could not be avoided in our study, as information on behavioral characteristics was self-reported. Some unknown confounders cannot be avoided as with any observational study. Second, due to the lack of information on dietary factors and psychological stress, we could not evaluate them in our present study. Third, a majority of the participants in our study were rural inhabitants and of Han nationality. Consequently, speculation on the general population of China should be interpreted with caution.
Overall, 58.42% observations were prediabetes. The proportion of prediabetes with IFG, IGT, and elevated HbA1c was 9.66%. Despite demographic, behavioral, clinical, and biochemical characteristics, obesity indicators were also easily measured for target identification. Some correlated factors among IFG, IGT, and elevated HbA1c differed. Our findings could be used for targeted intervention to optimize prevention to mitigate the obviously increased prevalence of DM.
The datasets presented in this article are not readily available because of the requirements of this project. Requests to access the datasets should be directed to d2FuZ2JlaWx4YkAxNjMuY29t.
This study was reviewed and approved by Ethics Review Committee of Jiangsu Provincial Centre for Disease Control and Privation and Zhongda Hospital, Southeast University (JSJK2017-B003-02). The patients/participants provided their written informed consent to participate in this study.
All authors certified that they have participated in the conceptual design of this work, the analysis of the data, and the writing of the manuscript to take public responsibility for it. All authors reviewed the final version of the manuscript and approve it for publication. Conceptualization, BW. Methodology, XZ. Software, XZ. Validation, ZH, LC, and TXY. Formal analysis, XZ, HB, and RL. Investigation, JH, ML, and TY. Data curation, YOL and CS. Writing—original draft preparation, XZ. Writing—review and editing, BW and XZ. Visualization, ZY. Supervision, ZS. Project administration, HG, KS, and YL.
This research has received funding from the National Key Research and Development Program of China (Grant No. 2016YFC1305700).
We would like to express our sincere gratitude to the health workers and participants in this National Key Research and Development Program of China for their considerable efforts and collaboration.
The authors declare that the research was conducted in the absence of any commercial or financial relationships that could be construed as a potential conflict of interest.
All claims expressed in this article are solely those of the authors and do not necessarily represent those of their affiliated organizations, or those of the publisher, the editors and the reviewers. Any product that may be evaluated in this article, or claim that may be made by its manufacturer, is not guaranteed or endorsed by the publisher.
The Supplementary Material for this article can be found online at: https://www.frontiersin.org/articles/10.3389/fendo.2022.965890/full#supplementary-material
DM, diabetes mellitus; T2DM, type 2 diabetes mellitus; IFG, impaired fasting glucose; IGT, impaired glucose tolerance; FPG, fasting plasma glucose; 2hPG, 2-h postprandial glucose; HbA1c, glycosylated hemoglobin; TC, total cholesterol; LDL-c, low-density lipoprotein cholesterol; HDL-c, high-density lipoprotein cholesterol; TG, triglyceride; WC, waist circumference; WHtR, waist-to-height ratio; WHR, waist-to-hip ratio; BMI, body mass index; PI, ponderal index; RFM, relative fat mass; AVI, abdominal volume index; LAP, lipid accumulation product; VAI, visceral adiposity index; CVAI, Chinese visceral adiposity index; BRI, body roundness index; BAE, body adiposity estimator; ADA: American Diabetes Association; SDs, standard deviations; GEE, generalized estimating equation; ORs, odd ratios; CIs, confidence intervals.
1. Saeedi P, Petersohn I, Salpea P, Malanda B, Karuranga S, Unwin N, et al. Global and regional diabetes prevalence estimates for 2019 and projections for 2030 and 2045: Results from the international diabetes federation diabetes atlas, 9(th) edition. Diabetes Res Clin Pract (2019) 157:107843. doi: 10.1016/j.diabres.2019.107843
2. Williams R, Karuranga S, Malanda B, Saeedi P, Basit A, Besancon S, et al. Global and regional estimates and projections of diabetes-related health expenditure: Results from the international diabetes federation diabetes atlas, 9th edition. Diabetes Res Clin Pract (2020) 162:108072. doi: 10.1016/j.diabres.2020.108072
3. Zheng Y, Ley SH, Hu FB. Global aetiology and epidemiology of type 2 diabetes mellitus and its complications. Nat Rev Endocrinol (2018) 14(2):88–98. doi: 10.1038/nrendo.2017.151
4. Ma RCW. Epidemiology of diabetes and diabetic complications in China. Diabetologia (2018) 61(6):1249–60. doi: 10.1007/s00125-018-4557-7
5. Deng Y, Li N, Wu Y, Wang M, Yang S, Zheng Y, et al. Global, regional, and national burden of diabetes-related chronic kidney disease from 1990 to 2019. Front Endocrinol (Lausanne) (2021) 12:672350. doi: 10.3389/fendo.2021.672350
6. Wei W, Jiang W, Han T, Tian M, Ding G, Li Y, et al. The future of prevention and treatment of diabetes with nutrition in China. Cell Metab (2021) 33(10):1908–10. doi: 10.1016/j.cmet.2021.09.012
7. Luo Z, Fabre G, Rodwin VG. Meeting the challenge of diabetes in China. Int J Health Policy Manag (2020) 9(2):47–52. doi: 10.15171/ijhpm.2019.80
8. Beulens J, Rutters F, Ryden L, Schnell O, Mellbin L, Hart HE, et al. Risk and management of pre-diabetes. Eur J Prev Cardiol (2019) 26(2_suppl):47–54. doi: 10.1177/2047487319880041
9. World Health Organization. Global report on diabetes Geneva, Switzerland: World Health Organization (2016).
10. Islam Z, Akter S, Inoue Y, Hu H, Kuwahara K, Nakagawa T, et al. Prediabetes, diabetes, and the risk of all-cause and cause-specific mortality in a Japanese working population: Japan epidemiology collaboration on occupational health study. Diabetes Care (2021) 44(3):757–64. doi: 10.2337/dc20-1213
11. Buysschaert M, Medina JL, Bergman M, Shah A, Lonier J. Prediabetes and associated disorders. Endocrine (2015) 48(2):371–93. doi: 10.1007/s12020-014-0436-2
12. Alvarez S, Coffey R, Algotar AM. Prediabetes. Treasure Island (FL): StatPearls Publishing (2022).
13. Barry E, Roberts S, Oke J, Vijayaraghavan S, Normansell R, Greenhalgh T. Efficacy and effectiveness of screen and treat policies in prevention of type 2 diabetes: systematic review and meta-analysis of screening tests and interventions. BMJ (2017) 356:i6538. doi: 10.1136/bmj.i6538
14. Greiner GG, Emmert-Fees KMF, Becker J, Rathmann W, Thorand B, Peters A, et al. Toward targeted prevention: risk factors for prediabetes defined by impaired fasting glucose, impaired glucose tolerance and increased HbA1c in the population-based KORA study from Germany. Acta Diabetol (2020) 57(12):1481–91. doi: 10.1007/s00592-020-01573-x
15. Barbu E, Popescu MR, Popescu AC, Balanescu SM. Phenotyping the prediabetic population-a closer look at intermediate glucose status and cardiovascular disease. Int J Mol Sci (2021) 22(13):6864. doi: 10.3390/ijms22136864
16. Khan RMM, Chua ZJY, Tan JC, Yang Y, Liao Z, Zhao Y. From pre-diabetes to diabetes: Diagnosis, treatments and translational research. Medicina (Kaunas) (2019) 55(9):546. doi: 10.3390/medicina55090546
17. Zhu X, Hu J, Guo H, Ji D, Yuan D, Li M, et al. Effect of metabolic health and obesity phenotype on risk of diabetes mellitus: A population-based longitudinal study. Diabetes Metab Syndr Obes (2021) 14:3485–98. doi: 10.2147/DMSO.S317739
18. Chobanian AV, Bakris GL, Black HR, Cushman WC, Green LA, Izzo JL Jr., et al. The seventh report of the joint national committee on prevention, detection, evaluation, and treatment of high blood pressure: the JNC 7 report. JAMA (2003) 289(19):2560–72. doi: 10.1001/jama.289.19.2560
19. Joint Committee for Guideline Revision. 2016 Chinese guidelines for the management of dyslipidemia in adults. J Geriatr Cardiol (2018) 15(1):1–29. doi: 10.11909/j.issn.1671-5411.2018.01.011
20. Jacobson TA, Ito MK, Maki KC, Orringer CE, Bays HE, Jones PH, et al. National lipid association recommendations for patient-centered management of dyslipidemia: part 1–full report. J Clin Lipidol (2015) 9(2):129–69. doi: 10.1016/j.jacl.2015.02.003
21. Browning LM, Hsieh SD, Ashwell M. A systematic review of waist-to-height ratio as a screening tool for the prediction of cardiovascular disease and diabetes: 0.5 could be a suitable global boundary value. Nutr Res Rev (2010) 23(2):247–69. doi: 10.1017/S0954422410000144
22. Dalton M, Cameron AJ, Zimmet PZ, Shaw JE, Jolley D, Dunstan DW, et al. Waist circumference, waist-hip ratio and body mass index and their correlation with cardiovascular disease risk factors in Australian adults. J Intern Med (2003) 254(6):555–63. doi: 10.1111/j.1365-2796.2003.01229.x
23. Zhou BF. Predictive values of body mass index and waist circumference for risk factors of certain related diseases in Chinese adults–study on optimal cut-off points of body mass index and waist circumference in Chinese adults. BioMed Environ Sci (2002) 15(1):83–96. doi: CNKI:SUN:SWYX.0.2002-01-010
24. Florey Cdu V. The use and interpretation of ponderal index and other weight-height ratios in epidemiological studies. J Chronic Dis (1970) 23(2):93–103. doi: 10.1016/0021-9681(70)90068-8
25. Valdez R. A simple model-based index of abdominal adiposity. J Clin Epidemiol (1991) 44(9):955–6. doi: 10.1016/0895-4356(91)90059-i
26. Woolcott OO, Bergman RN. Relative fat mass (RFM) as a new estimator of whole-body fat percentage horizontal line a cross-sectional study in American adult individuals. Sci Rep (2018) 8(1):10980. doi: 10.1038/s41598-018-29362-1
27. Guerrero-Romero F, Rodriguez-Moran M. Abdominal volume index. an anthropometry-based index for estimation of obesity is strongly related to impaired glucose tolerance and type 2 diabetes mellitus. Arch Med Res (2003) 34(5):428–32. doi: 10.1016/S0188-4409(03)00073-0
28. Kahn HS. The "lipid accumulation product" performs better than the body mass index for recognizing cardiovascular risk: a population-based comparison. BMC Cardiovasc Disord (2005) 5:26. doi: 10.1186/1471-2261-5-26
29. Amato MC, Giordano C, Galia M, Criscimanna A, Vitabile S, Midiri M, et al. Visceral adiposity index: a reliable indicator of visceral fat function associated with cardiometabolic risk. Diabetes Care (2010) 33(4):920–2. doi: 10.2337/dc09-1825
30. Xia MF, Chen Y, Lin HD, Ma H, Li XM, Aleteng Q, et al. A indicator of visceral adipose dysfunction to evaluate metabolic health in adult Chinese. Sci Rep (2016) 6:38214. doi: 10.1038/srep38214
31. Thomas DM, Bredlau C, Bosy-Westphal A, Mueller M, Shen W, Gallagher D, et al. Relationships between body roundness with body fat and visceral adipose tissue emerging from a new geometrical model. Obes (Silver Spring) (2013) 21(11):2264–71. doi: 10.1002/oby.20408
32. Gomez-Ambrosi J, Silva C, Catalan V, Rodriguez A, Galofre JC, Escalada J, et al. Clinical usefulness of a new equation for estimating body fat. Diabetes Care (2012) 35(2):383–8. doi: 10.2337/dc11-1334
33. Lee DH, Keum N, Hu FB, Orav EJ, Rimm EB, Sun Q, et al. Development and validation of anthropometric prediction equations for lean body mass, fat mass and percent fat in adults using the national health and nutrition examination survey (NHANES) 1999-2006. Br J Nutr (2017) 118(10):858–66. doi: 10.1017/S0007114517002665
34. World Health Organization. Waist circumference and waist-hip ratio: Report of a WHO expert consultation. Geneva: World Health Organization (2011) 8–11 p.
35. Zhao L, Li Y, Peng Y, Zhang L, Guo M, Wu Y. The cut-off value of waist-to-height ratio in detecting central obesity in Chinese adult population. Chin J Prev Med (2012) 13(07):481–5. doi: CNKI:SUN:ZGYC.0.2012-07-001
36. Piqueras P, Ballester A, Dura-Gil JV, Martinez-Hervas S, Redon J, Real JT. Anthropometric indicators as a tool for diagnosis of obesity and other health risk factors: A literature review. Front Psychol (2021) 12:631179:631179. doi: 10.3389/fpsyg.2021.631179
37. A. D. Association. Classification and diagnosis of diabetes: Standards of medical care in diabetes-2019. Diabetes Care (2019) 42(Suppl 1):S13–28. doi: 10.2337/dc19-S002
38. World Health Organization. Definition and diagnosis of diabetes mellitus and intermediate hyperglycaemia: Report of a WHO/IDF consultation. Geneva, Switzerland: WHO Document Production Services (2006).
39. Hubbard AE, Ahern J, Fleischer NL, van der Laan M, Lippman SA, Jewell N, et al. To GEE or not to GEE: comparing population average and mixed models for estimating the associations between neighborhood risk factors and health. Epidemiology (2010) 21(4):467–74. doi: 10.1097/EDE.0b013e3181caeb90
40. Zhang Z. Multiple imputation with multivariate imputation by chained equation (MICE) package. Ann Transl Med (2016) 4(2):30. doi: 10.3978/j.issn.2305-5839.2015.12.63
41. Liu J, Bai R, Chai Z, Cooper ME, Zimmet PZ, Zhang L. Low- and middle-income countries demonstrate rapid growth of type 2 diabetes: an analysis based on global burden of disease 1990-2019 data. Diabetologia (2022) 65(8):1339–52. doi: 10.1007/s00125-022-05713-6
42. Zhang YH, Ma WJ, Thomas GN, Xu YJ, Lao XQ, Xu XJ, et al. Diabetes and pre-diabetes as determined by glycated haemoglobin A1c and glucose levels in a developing southern Chinese population. PloS One (2012) 7(5):e37260. doi: 10.1371/journal.pone.0037260
43. Vatcheva KP, Fisher-Hoch SP, Reininger BM, McCormick JB. Sex and age differences in prevalence and risk factors for prediabetes in Mexican-americans. Diabetes Res Clin Pract (2020) 159:107950. doi: 10.1016/j.diabres.2019.107950
44. Kurauti MA, Soares GM, Marmentini C, Bronczek GA, Branco RCS, Boschero AC. Insulin and aging. Vitam Horm (2021) 115:185–219. doi: 10.1016/bs.vh.2020.12.010
45. Hu Z, Gao F, Qin L, Yang Y, Xu H. A case-control study on risk factors and their interactions with prediabetes among the elderly in rural communities of yiyang city, hunan province. J Diabetes Res (2019) 2019:1386048. doi: 10.1155/2019/1386048
46. Knott C, Bell S, Britton A. Alcohol consumption and the risk of type 2 diabetes: A systematic review and dose-response meta-analysis of more than 1.9 million individuals from 38 observational studies. Diabetes Care (2015) 38(9):1804–12. doi: 10.2337/dc15-0710
47. Engler PA, Ramsey SE, Smith RJ. Alcohol use of diabetes patients: the need for assessment and intervention. Acta Diabetol (2013) 50(2):93–9. doi: 10.1007/s00592-010-0200-x
48. Lopez-Gonzalez AA, Manzanero Z, Vicente-Herrero MT, Garcia-Agudo S, Gil-Llinas M, Moreno-Morcillo F. Relationship between blood glucose levels and cardiovascular risk in the Spanish Mediterranean population. Turk J Med Sci (2017) 47(3):754–63. doi: 10.3906/sag-1509-26
49. Wu YF, Fan HY, Chen YC, Kuo KL, Chien KL. Adolescent tri-ponderal mass index growth trajectories and incident diabetes mellitus in early adulthood. J Clin Endocrinol Metab (2021) 106(8):e2919–27. doi: 10.1210/clinem/dgab235
50. Andrade MD, Freitas MC, Sakumoto AM, Pappiani C, Andrade SC, Vieira VL, et al. Association of the conicity index with diabetes and hypertension in Brazilian women. Arch Endocrinol Metab (2016) 60(5):436–42. doi: 10.1590/2359-3997000000187
51. Kobo O, Leiba R, Avizohar O, Karban A. Relative fat mass is a better predictor of dyslipidemia and metabolic syndrome than body mass index. Cardiovasc Endocrinol Metab (2019) 8(3):77–81. doi: 10.1097/XCE.0000000000000176
52. Andreasson A, Carlsson AC, Onnerhag K, Hagstrom H. Predictive capacity for mortality and severe liver disease of the relative fat mass algorithm. Clin Gastroenterol Hepatol (2019) 17(12):2619–20. doi: 10.1016/j.cgh.2018.11.026
53. Amiri P, Javid AZ, Moradi L, Haghighat N, Moradi R, Behbahani HB, et al. Associations between new and old anthropometric indices with type 2 diabetes mellitus and risk of metabolic complications: a cross-sectional analytical study. J Vasc Bras (2021) 20:e20200236. doi: 10.1590/1677-5449.200236
54. Hu X, Appleton AA, Ou Y, Zhang Y, Cai A, Zhou Y, et al. Abdominal volume index trajectories and risk of diabetes mellitus: Results from the China health and nutrition survey. J Diabetes Investig (2022) 13(5):868–77. doi: 10.1111/jdi.13733
55. Zhao W, Tong J, Li J, Cao Y. Relationship between body roundness index and risk of type 2 diabetes in Japanese men and women: A reanalysis of a cohort study. Int J Endocrinol (2021) 2021:4535983. doi: 10.1155/2021/4535983
56. Vinknes KJ, Nurk E, Tell GS, Sulo G, Refsum H, Elshorbagy AK. The relation of CUN-BAE index and BMI with body fat, cardiovascular events and diabetes during a 6-year follow-up: the hordaland health study. Clin Epidemiol (2017) 9:555–66. doi: 10.2147/CLEP.S145130
57. Ahn N, Baumeister SE, Amann U, Rathmann W, Peters A, Huth C, et al. Visceral adiposity index (VAI), lipid accumulation product (LAP), and product of triglycerides and glucose (TyG) to discriminate prediabetes and diabetes. Sci Rep (2019) 9(1):9693. doi: 10.1038/s41598-019-46187-8
Keywords: prediabetes, prevention, correlated factors, obesity indicators, epidemiology
Citation: Zhu X, Yang Z, He Z, Hu J, Yin T, Bai H, Li R, Cai L, Guo H, Li M, Yan T, Li Y, Shen C, Sun K, Liu Y, Sun Z and Wang B (2022) Factors correlated with targeted prevention for prediabetes classified by impaired fasting glucose, impaired glucose tolerance, and elevated HbA1c: A population-based longitudinal study. Front. Endocrinol. 13:965890. doi: 10.3389/fendo.2022.965890
Received: 10 June 2022; Accepted: 25 July 2022;
Published: 22 August 2022.
Edited by:
João Sérgio Neves, Centro Hospitalar Universitário de São João (CHUSJ), PortugalReviewed by:
Hai-Tao Gao, Wenzhou Medical University, ChinaCopyright © 2022 Zhu, Yang, He, Hu, Yin, Bai, Li, Cai, Guo, Li, Yan, Li, Shen, Sun, Liu, Sun and Wang. This is an open-access article distributed under the terms of the Creative Commons Attribution License (CC BY). The use, distribution or reproduction in other forums is permitted, provided the original author(s) and the copyright owner(s) are credited and that the original publication in this journal is cited, in accordance with accepted academic practice. No use, distribution or reproduction is permitted which does not comply with these terms.
*Correspondence: Bei Wang, d2FuZ2JlaWx4YkAxNjMuY29t
Disclaimer: All claims expressed in this article are solely those of the authors and do not necessarily represent those of their affiliated organizations, or those of the publisher, the editors and the reviewers. Any product that may be evaluated in this article or claim that may be made by its manufacturer is not guaranteed or endorsed by the publisher.
Research integrity at Frontiers
Learn more about the work of our research integrity team to safeguard the quality of each article we publish.