 Wei Wang
 Zhe Yuan Chen†
95% of researchers rate our articles as excellent or good
Learn more about the work of our research integrity team to safeguard the quality of each article we publish.
Find out more
ORIGINAL RESEARCH article
Front. Endocrinol. , 14 July 2022
Sec. Obesity
Volume 13 - 2022 | https://doi.org/10.3389/fendo.2022.935776
This article is part of the Research Topic Association of Novel Anthropometric Indexes with Metabolic Syndrome and Beyond, volume II View all 16 articles
Objective: Increasing evidence highlighted that chronic inflammation involved in the development of metabolic syndrome (MetS) and Type 2 diabetes mellitus (T2DM). This prospective study was aimed to assess the association between MetS and novel pro-inflammatory indicators like monocyte–to–high-density lipoprotein and monocyte–to–apolipoprotein A1 ratios (MHR and MAR) in Chinese newly diagnosed T2DM.
Method: A total of 605 Chinese newly diagnosed T2DM with complete and available data were enrolled in this study. Demographic and anthropometric information were collected. Laboratory assessments were determined by standard methods. MetS was based on the Chinese Diabetes Society definition. Multiple binomial logistic regression model was used to estimate the independent variables of MHR and MAR for MetS. Receiver operating characteristic (ROC) curve was conducted to assess the optimal cutoff value of MHR and MAR in identifying MetS.
Results: Overall, the prevalence of MetS was 60.2%. The correlation analysis showed that MHR and MAR were closely correlated with metabolic risk factors like body mass index, waist circumference, triglycerides, high-density lipoprotein cholesterol, systolic blood pressure, diastolic blood pressure, uric acid, and insulin resistance. MHR and MAR were also significantly associated with higher odds of MetS after adjustment for other confounders, the odds ratios (ORs) (95%CI) were 1.50 (1.14–1.97) and 2.26(1.79–2.87) respectively. Furthermore, MHR and MAR were also seemed to have higher area under the curve (AUC) for MetS than ApoA1 and monocyte alone from the ROC curve analysis (P < 0.05). The AUCs of MHR and MAR identifying MetS were 0.804 (95% CI: 0.768–0.839) and 0.840 (95% CI: 0.806–0.873) respectively (P < 0.001). The optimal cutoff values of MHR and MAR were 3.57 × 10⁸/mmol (sensitivity: 76.1%, specificity: 73.4%) and 3.95 × 10⁸/g (sensitivity: 79.7%, specificity: 84.6%), respectively.
Conclusions: MHR and MAR were significantly associated with MetS. These two novel pro-inflammatory indicators may be useful markers for MetS in Chinese newly diagnosed T2DM.
Type 2 diabetes mellitus (T2DM) is a kind of metabolic disease characterized by chronic hyperglycemia that often accompanied with other metabolic disorders like obesity, hypertension, and hyperlipidemia. Metabolic syndrome (MetS) has gradually become an increasing worldwide health problem that was associated with increased cardiovascular disease (CVD), stroke, and T2DM (1). MetS is closely correlated with T2DM, and epidemiological survey reported the prevalence of MetS was up to 68.1% in Chinese T2DM (2). Chronic low-concentration inflammation, cellular dysfunction, and oxidative stress participate in the occurrence and development of T2DM and MetS (3); the non-invasive detection index of “chronic low concentration inflammatory statues” can be an effective marker for in T2DM with MetS.
Circulating monocyte is a cluster of blood cell modulated by immune factors including tumor necrosis factors alpha (TNF-α) and Toll-like receptor (TLR) 2, TLR4, and TLR8 ligands that can interact with thrombocytes and endothelial cells, resulting in exaggerated inflammation and increased oxidative stress (4–6). These biological features provided a basis for monocyte involving in development of systematic inflammation disease like MetS, T2DM, and CVD (7). High-density lipoprotein (HDL-c) is considered as “good cholesterol” that can bind lipid molecules such as triglyceride (TG) and cholesterol and participate in the cholesterol clearance, resulting in decreased CVD risk (8). Monocyte–to–HDL-c ratio (MHR) was also recognized as indicators of oxidative stress and systemic inflammation, which has been identified as a predictive marker for some disease, such as CVD, polycystic ovarian syndrome (PCOS), and Parkinson’s Disease (9–11). Besides fewer studies reported the predictive value of MHR for MetS in patients with PCOS (10, 12), there was no study that has focused on the potential ability of MHR for MetS in newly diagnosed T2DM. Apolipoprotein A1 (ApoA1) is a constituent of HDL-c produced by liver that participates in the process of peripheral cholesterol reverse transportation to the liver, which was also considered as protective proteins in CVD (13). Despite numerous studies have confirmed that the ratio of apolipoprotein B (ApoB) to ApoA1 is significantly correlated with MetS, no study has put insights to the association between monocyte to ApoA1 ratio (MAR) and MetS. Thereby, this prospective study was aimed to assess the association between MetS and novel pro-inflammatory indicators MHR and MAR in Chinese newly diagnosed T2DM, further evaluating the ability of MHR and MAR in identifying MetS.
This cross-sectional study was consecutively conducted with newly diagnosed T2DM from the Department of Endocrinology at Longyan First Affiliated Hospital of Fujian Medical University who fulfilled the study criteria between January, 2021 and December, 2021. The T2DM was defined according to the World Health Organization (WHO) 2019 criteria: (1) fasting plasma glucose ≥126 mg/dl or 2-h postprandial ≥200 mg/dl during oral glucose tolerance test (OGTT) or HbA1C ≥6.5% or participants with classic symptoms of hyperglycemia or hyperglycemic crisis with random plasma glucose ≥200 mg/dl and (2) with negative diabetic autoimmune antibodies and excluded other specific types of diabetes. Previous unknown hyperglycemia status and c were considered as newly diagnosed T2DM. Participants were excluded if they met the following criteria: (1) presence of acute diseases that can interfere glucose metabolism; (2) presence of acute or chronic infection, obvious liver or renal dysfunction, anemia, hemolytic diseases, and bleeding that can interfere circulating monocyte count; (3) treatment with medications that can interfere circulating monocyte count; (4) currently receiving lipid-lowering therapies; (5) presence of secondary hypertension or a history of tumors; and (6) unwillingness to participate in this study. In this study, we estimated the sample size according to the requirement of multiple binomial logistic regression model; 12–14 variables may be put into the logistic regression model according to the principle of 5–10 events per variable, and the prevalence of MetS is about 50%–70% in newly diagnosed T2DM. Thus, we planned a sampling size of 500–600 participants (2). Overall, a total of 636 participants were screened. Among them, 605 participants meeting the inclusion and exclusion criteria were enrolled in this study. The flow diagram of excluded and included participant was presented in Figure 1. All procedures were conducted in accordance with the Declaration of Helsinki. This study was approved by the ethical committee of Longyan First Affiliated Hospital of Fujian Medical University (LY-2020-088). All participants enrolled in the study provided informed consent.
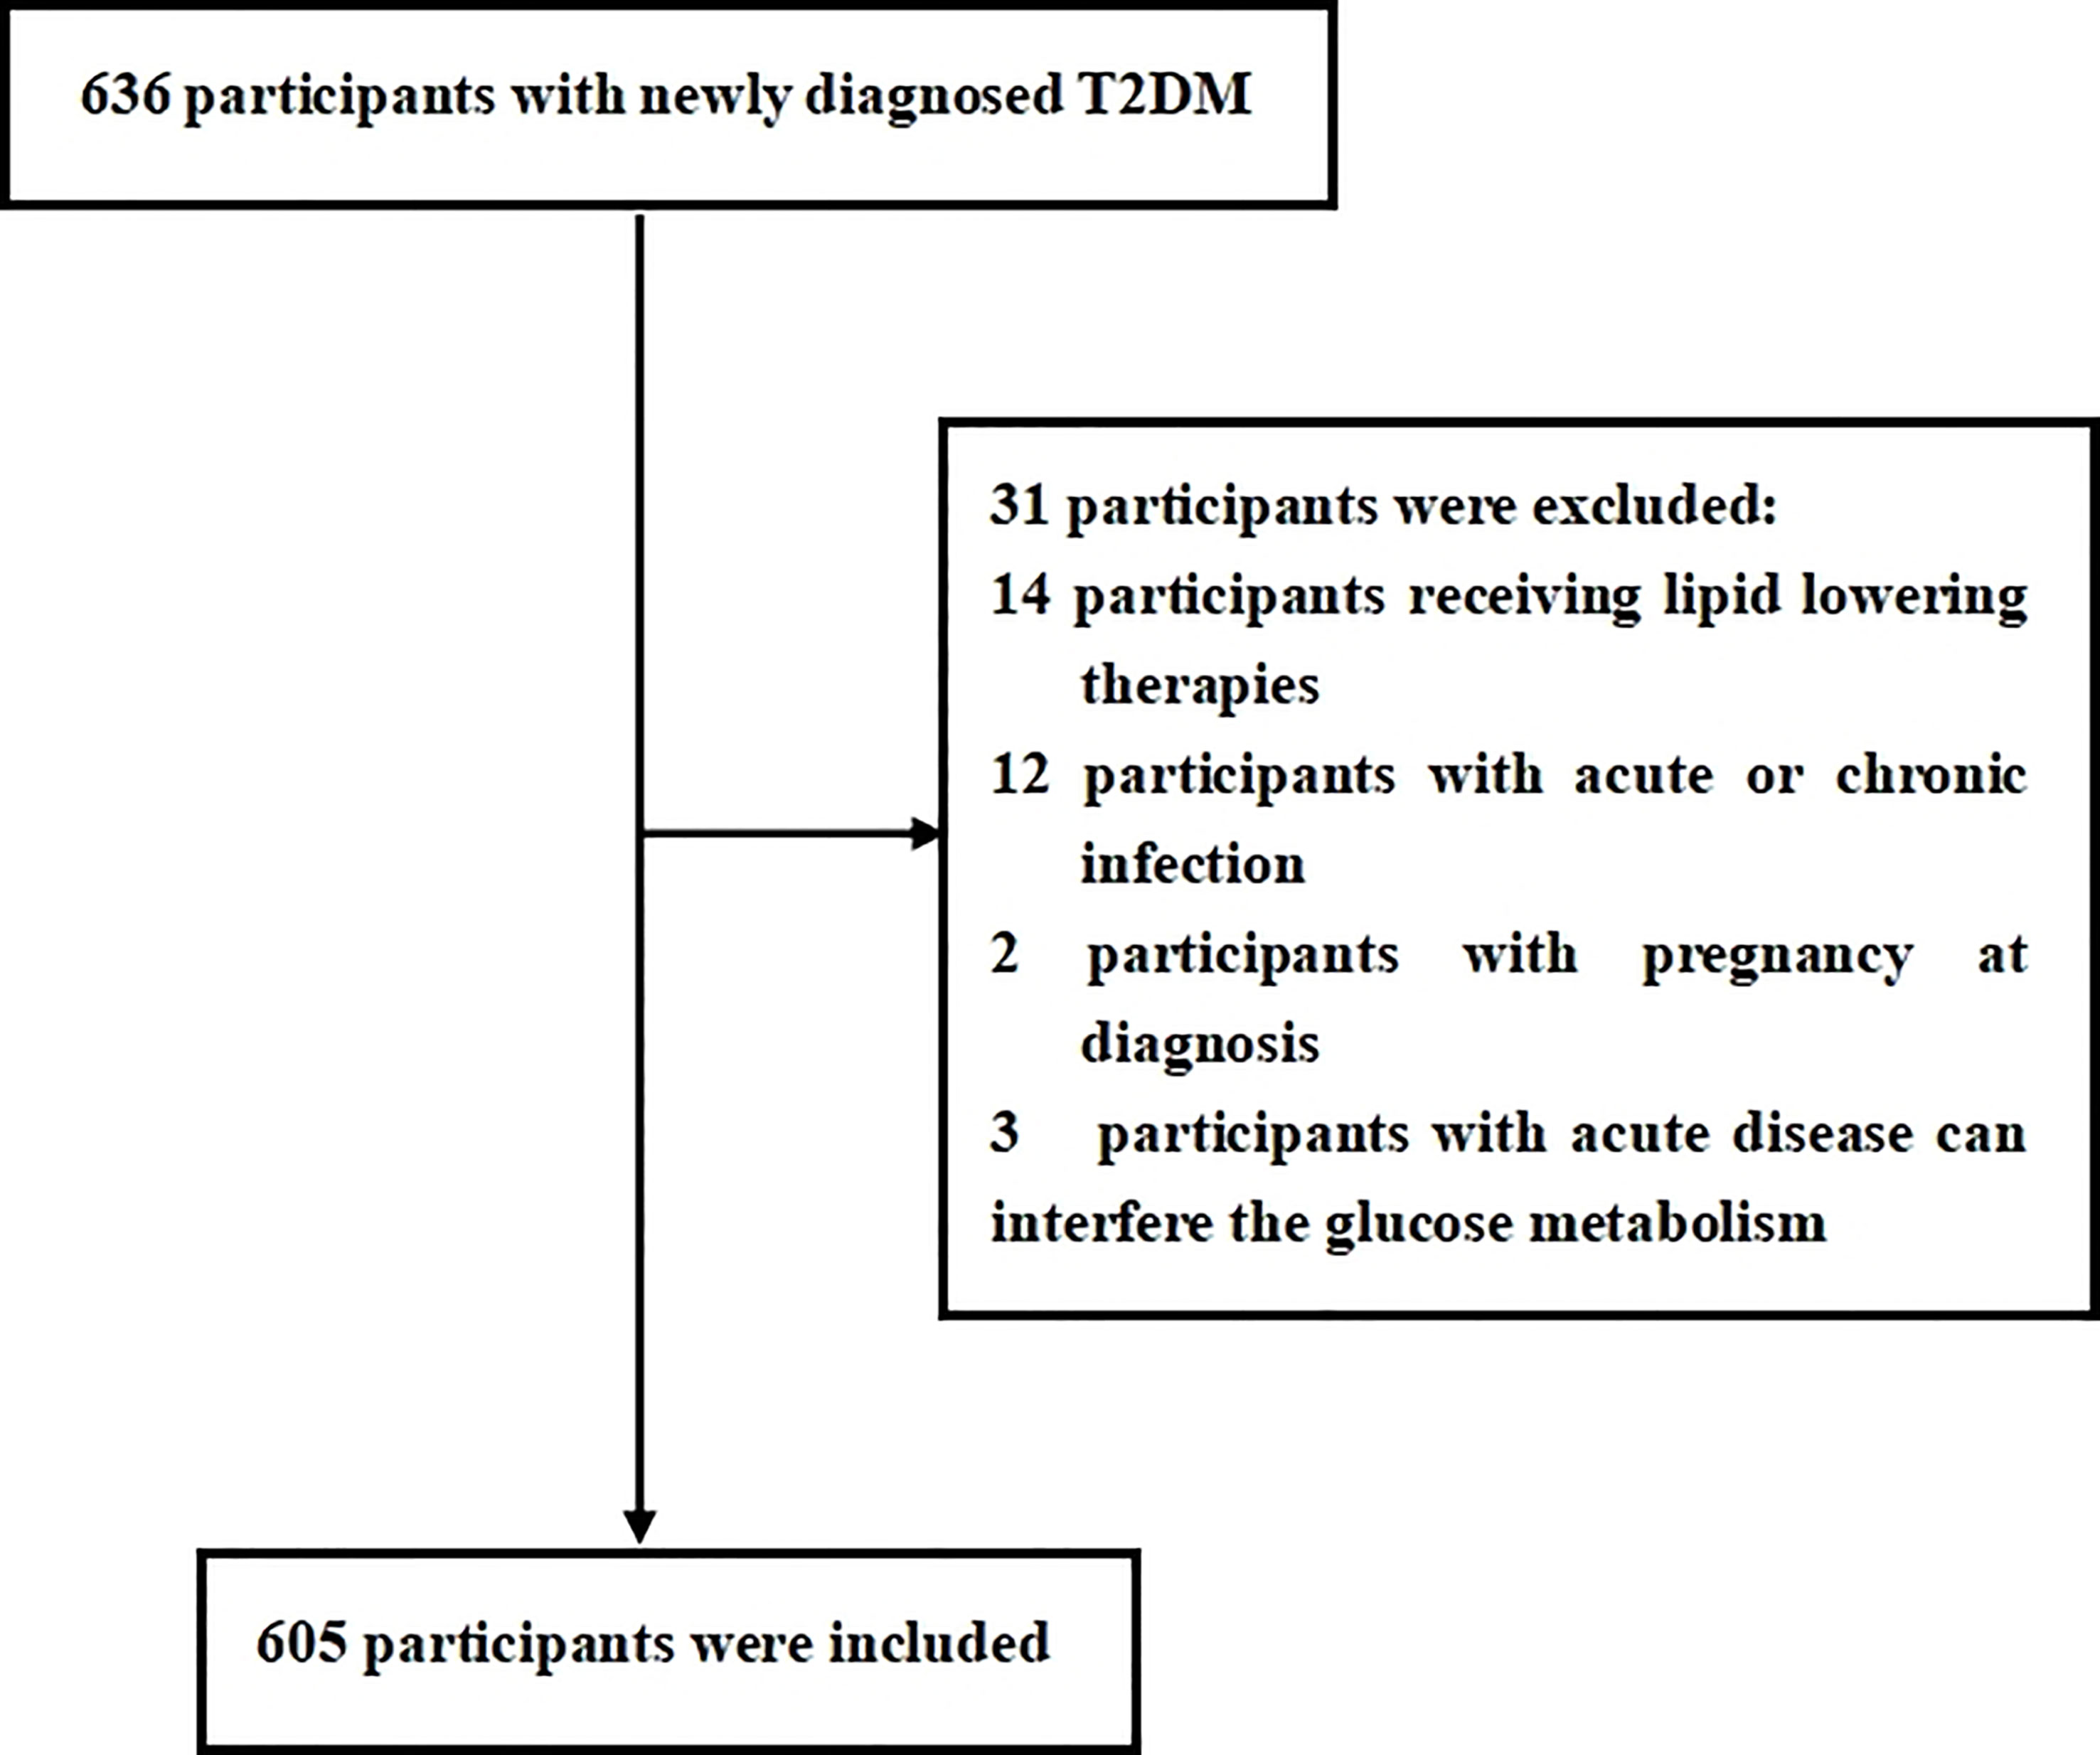
Figure 1 Flow diagram of the participants excluded and included in this study.
Demographic information was collected by trained interviewers through a standard questionnaire and also obtained by a review of medical records and laboratory data, including gender, age, and history of diseases that can interfere circulating monocyte, current or prior use of drugs, smoking, and drinking. Participants that smoke more than four cigarettes a week for at least 6 months continually or accumulative were considered as smoking according to standardized methodological recommendations of WHO for smoking surveys (14). Participants that drink more than once a year were considered as drinking according to global burden of disease study (15). Physical examination was conducted by the research nurses, including height, weight, waist circumference (WC), and blood pressure (BP). Participants wear hospital gowns and bare feet. Height and weight were measured to the nearest 0.1 cm and 0.1 kg, respectively. Weight was measured using the gauges real-time load cell, and height was measured using the gauges ultrasonic probe. Body mass index (BMI) was calculated as the weight divided by the square of height (kg/m2). WC was measured at the natural depression between the iliac crest and 10th rib, which should be the narrowest part of the abdomen. Systolic and diastolic BP (SBP and DBP) were measured by an electronic sphygmomanometer with an appropriate cuff size after the participants take a rest for more than 5 min on at least three different occasions; the mean of three measurements was calculated as final BP.
Laboratory assessments were measured by standard methods using fasting venous blood samples that were taken between 8:00 a.m. and 9:00 a.m. after fasting overnight. Blood samples were taken into standardized tubes containing dipotassium ethylenedinitrilotetraacetic acid. Serum levels of the following variables were determined: creatinine, alanine aminotransferase (ALT), uric acid (UA), fasting blood glucose (FBG), serum insulin, HbA1c, diabetic autoimmune antibodies (GADA, IAA, and ICA), HDL-c, low-density lipoprotein (LDL-c), TGs, ApoA1, high-sensitivity C-reactive protein (hs-CRP), and complete blood count. Biochemical indexes were measured by an auto-biochemical analyzer (Roche Diagnostics Corporation). ApoA1 levels were measured by the polyethylene glycol–enhanced immunoturbidimetric assay (Maker, Chengdu, China). HbA1c was evaluated by high-performance liquid chromatography with a D10 set (Bio-Rad). Complete blood count was obtained using the Coulter LH 780 Analyzer (Beckman Coulter Ireland, Galway, Ireland). Homeostasis model assessment (HOMA-IR) was used to assess insulin sensitively. HOMA-IR was calculated with the following formula: fasting serum insulin (µU/ml) × fasting plasma glucose (mmol/l)/22.5 (16). MHR or MAR was calculated with the following formulas: the monocyte count divided by HDL-c or ApoA1 level.
Participants were diagnosed with MetS according to Chinese diabetes guideline for MetS management (17). Participants that met three or more of the following criteria are considered to have MetS: (1) abdominal obesity: WC≥90 cm in men or ≥85 cm in women; (2) hyperglycemia: FBG ≥6.1 mmol/L or OGTT 2-h blood glucose≥7.8 mmol/L or previously diagnosed diabetes with treatment; (3) hypertension: BP ≥130/85 mmHg or currently under antihypertension therapy; (4) fasting TGs ≥1.70 mmol/L; and (5) fasting HDL-c <1.04 mmol/L. All participants in this study should fulfill the criteria for hyperglycemia and diagnosed as newly diagnosed T2DM.
Data were analyzed by using the SPSS 23.0 software (SPSS Inc. IBM). Descriptive data are expressed as means ± standard deviation (SD). Discrete variables were summarized in frequency tables (N, %). Participants were divided into three groups based on tertiles of MHR and MAR. Statistical differences among groups were performed with one-way analysis of variance (ANOVA) followed by Tukey’s test for multiple comparisons. Chi-squared (χ2) test or Fisher’s exact test was used for comparison of categorical variables. Correlation between MHR, MAR, and metabolic parameters was evaluated by Pearson’s or Spearman’s correlation analysis. Multiple binomial logistic regression model was used to estimate the independent variables of MHR and MAR for MetS after adjusting for other covariates. The receiver operating characteristic (ROC) curves were used to assess the identifying value of MHR and MAR for MetS in newly diagnosed T2DM. Optimal cutoff value was based on the greatest value of the Youden’s index. A two-tailed value of P < 0.05 was considered statistically significant.
Overall, a total of 605 newly diagnosed T2DM with complete and available data were included in the final analysis. Clinical and laboratory characteristics of participants were summarized in Table 1. Among them, 304 (50.2%) participants were men. The prevalence of MetS was 60.2% with a mean age of 53.4 ± 7.5 years. The MetS group was more likely to have hypertension as compared with the non-MetS group (P < 0.05). The BMI, WC, TG, SBP, DBP, UA, HOMA-IR, serum insulin, monocyte count, MAR, and MHR were significantly higher, whereas HDL-c and ApoA1 were significantly lower in the MetS group than the non-MetS group (P < 0.05). Moreover, the MHR and MAR were also calculated and divided into three tertiles. Clinical and laboratory characteristics of participants based on tertiles of MHR and MAR were summarized in Tables 2, 3. Increasing trends were observed in BMI, WC, TG, SBP, DBP, UA, serum insulin, HOMA-IR, and monocyte count across the MHR and MAR tertiles (P < 0.05). In addition, decreasing trends were also observed in HDL-c and ApoA1 across the MHR and MAR tertiles (P < 0.05). Furthermore, participants in higher tertiles of MHR and MAR groups showed the higher prevalence of MetS and hypertension (P < 0.05).
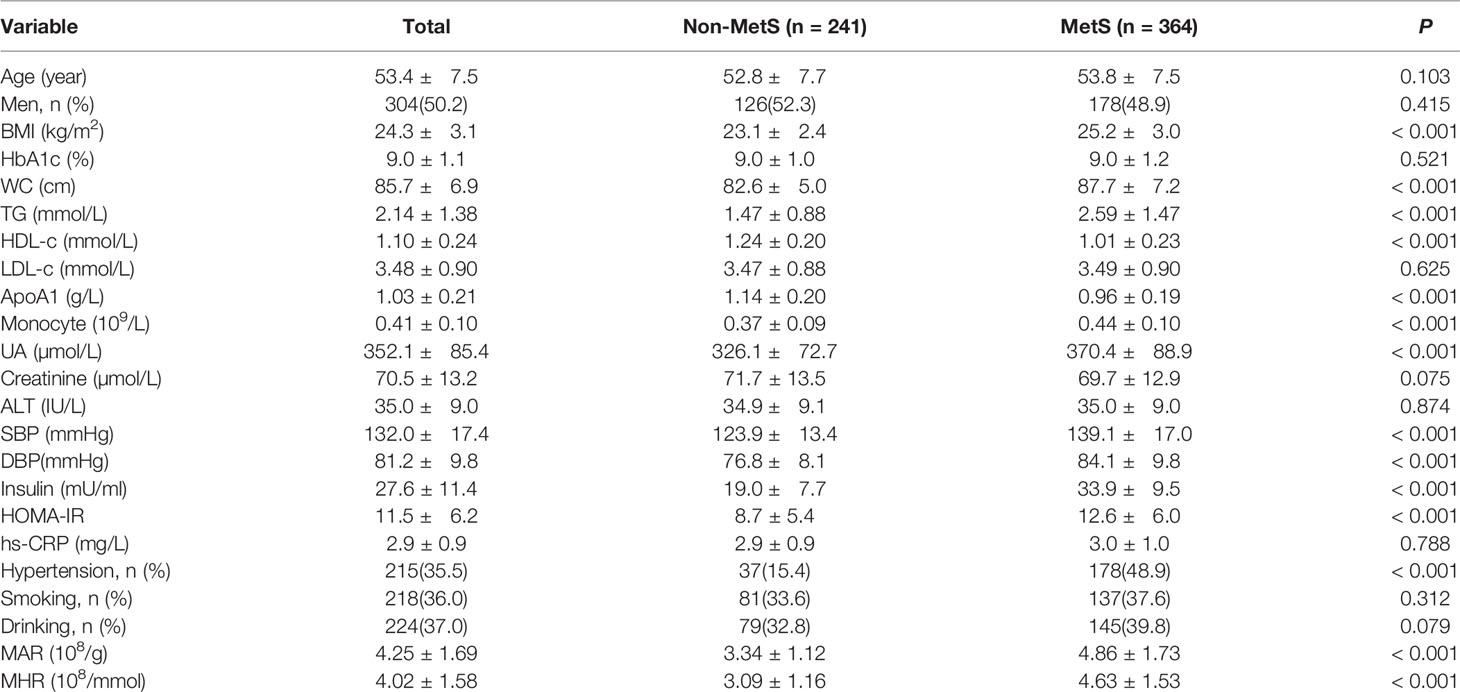
Table 1 Clinical and laboratory characteristics of participants.
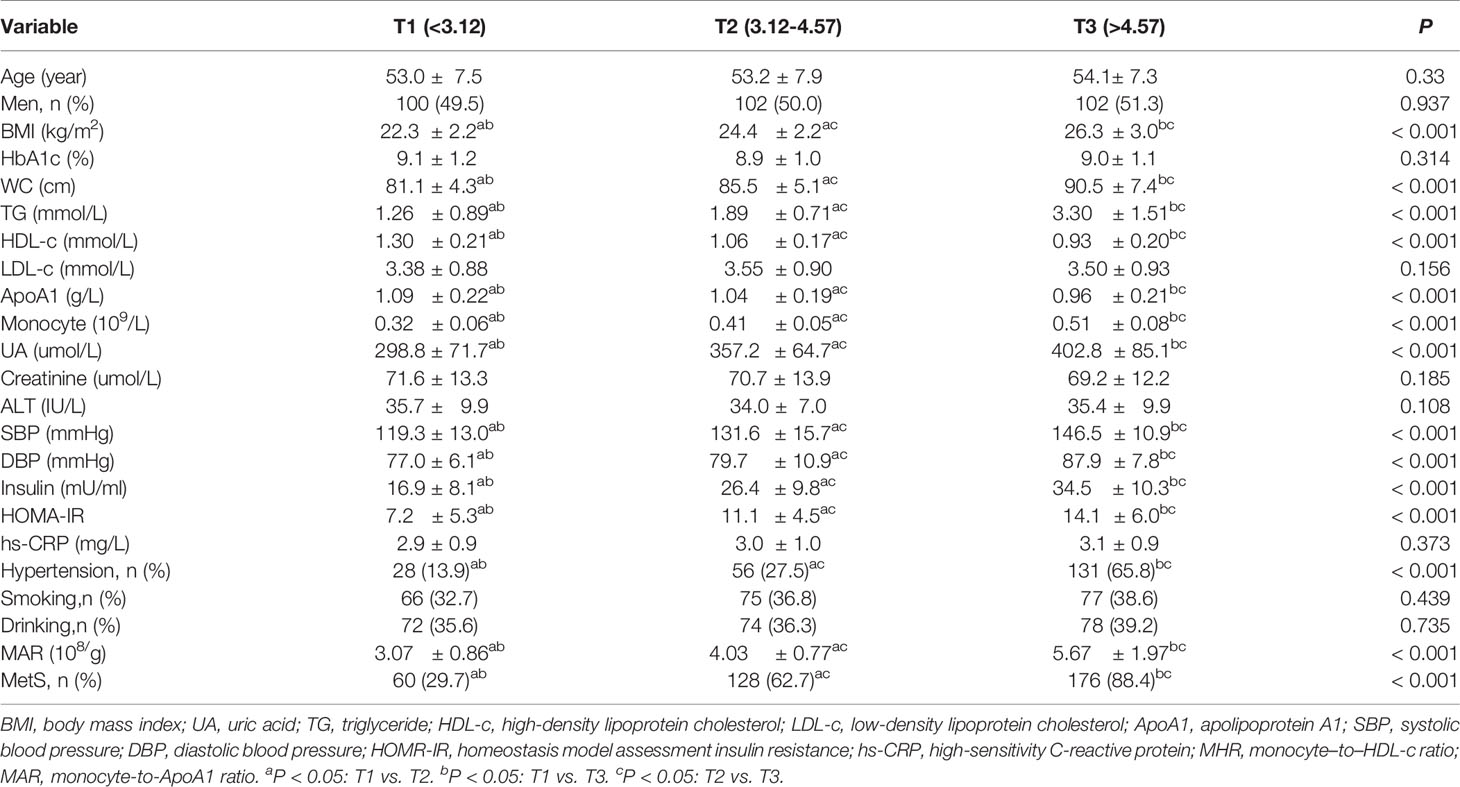
Table 2 Clinical and laboratory characteristics of participants based on tertiles of MHR (108/mmol).
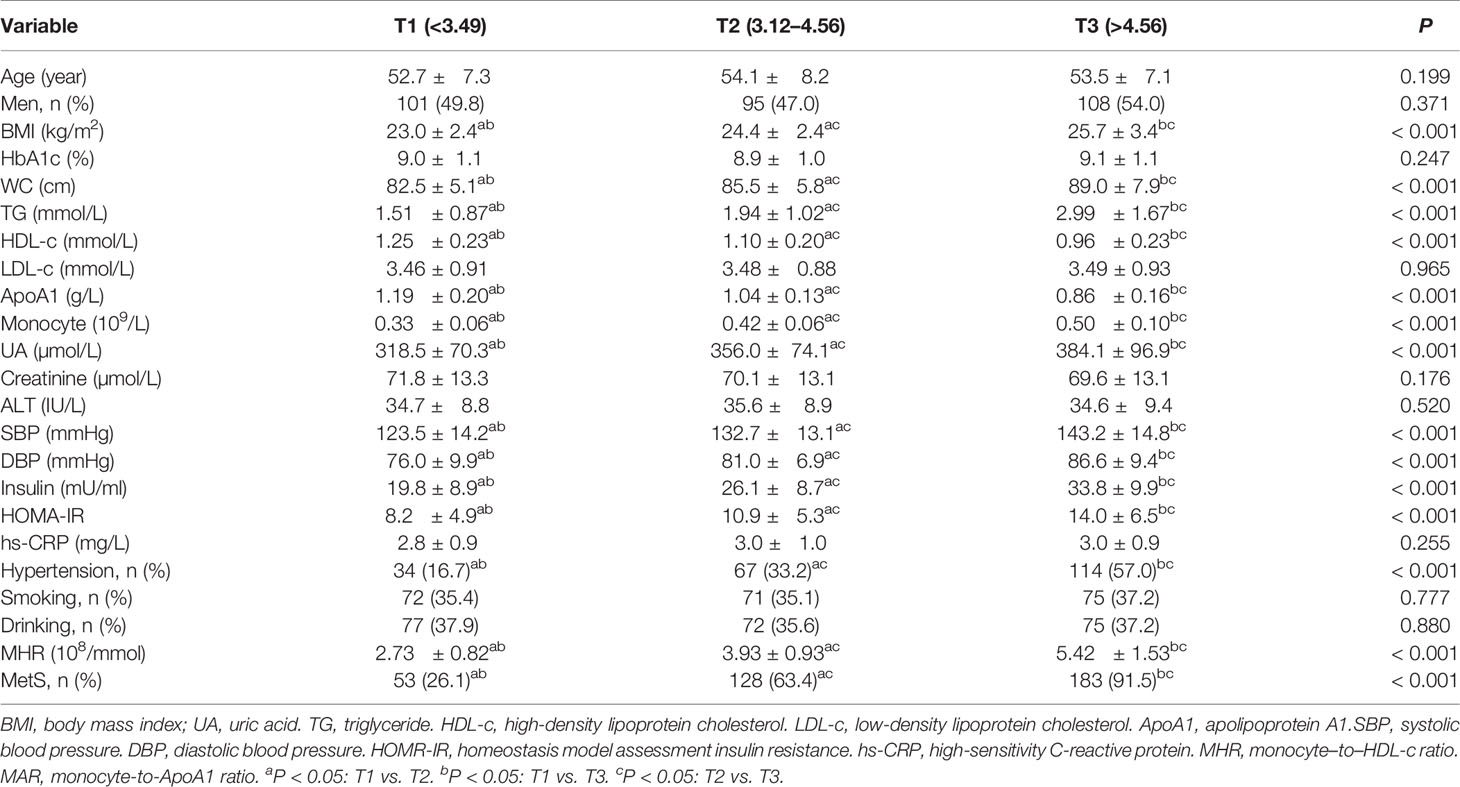
Table 3 Clinical and laboratory characteristics of participants based on tertiles of MAR (108/g).
The correlations between MHR, MAR, and metabolic parameters were presented in Table 4. The results showed that MHR and MAR were positively associated with BMI, WC, TG, SBP, DBP, UA, HOMA-IR, and monocyte count, whereas MHR and MAR were negatively associated with HDL-c and ApoA1 (P < 0.05). In addition, A positive correlation between MHR and MAR was also observed (R = 0.762, P < 0.001).
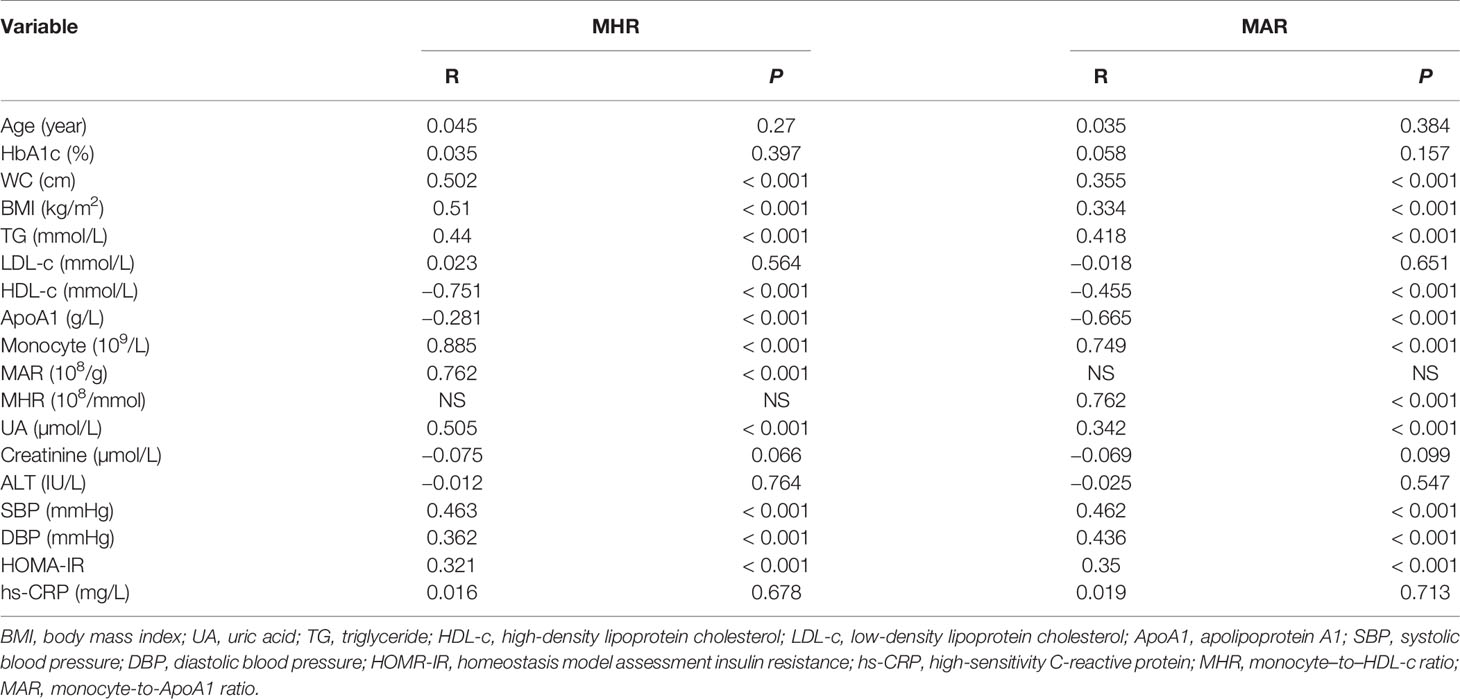
Table 4 Correlations between MHR, MAR and metabolic parameters.
To determine independent variables of MHR and MAR for MetS, binomial logistic regression analysis was also performed (Table 5). The MHR and MAR were associated with MetS in an unadjusted model (model 0), and the odds ratios (ORs) (95%CI) were 2.50(2.12–2.98) and 3.17(2.57–3.91), respectively. The MHR and MAR were shown to be independently associated with MetS after adjustment for age and gender (model 1), and the ORs (95%CI) were 2.51 (2.11–2.98) and 3.18 (2.57–3.92), respectively. A significant association between MHR, MAR, and MetS was also found after further adjustment for HbA1c, BMI, LDL-c, ApoA1, monocyte, UA, and HOMA-IR (model 2), and the ORs (95%CI) were 2.24 (1.82–2.76) and 2.68 (2.14–3.35), respectively. After further additional adjustment for TG, WC, HDL-c, SBP, and DBP (model 3), the ORs remained significant, and the ORs (95%CI) were 1.50 (1.14–1.97) and 2.26(1.79–2.87), respectively. In addition, the ApoA1 and monocyte count were also associated with MetS in model 0, and the ORs (95%CI) were 0.76 (0.68–0.83) and 2.46 (1.99–3.03), respectively. A significant association between ApoA1, monocyte count, and MetS was also found in model 1, and the ORs (95%CI) were 0.77 (0.68–0.84) and 2.47 (1.98–3.03), respectively.
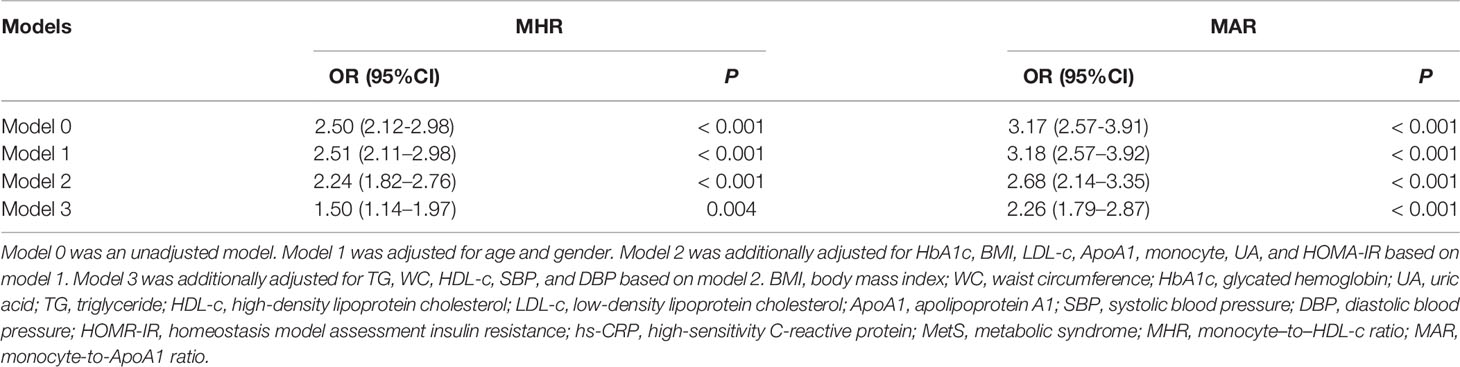
Table 5 Binomial Logistic Regression Analysis adjusted ORs (95% CIs) for the associations between MHR, MAR and the risk of MetS.
The ROC curve analysis was used to further evaluate the ability of MHR and MAR in identifying MetS. From the ROC curve analysis, the results showed a good identifying value of MHR and MAR for MetS. In addition, MHR and MAR showed higher area under the curve (AUC) in identifying MetS compared with ApoA1 and monocyte alone (P < 0.05). MAR also showed the highest AUC in identifying MetS. The AUC of MHR and MAR in identifying MetS was 0.804 (95% CI: 0.768–0.839, P < 0.001) and 0.840 (95% CI: 0.806–0.873, P < 0.001), respectively (Figure 2). The optimal cutoff values of MHR and MAR were 3.57 × 10⁸/mmol (sensitivity: 76.1%, specificity: 73.4%) and 3.95 × 10⁸/g (sensitivity: 79.7%, specificity: 84.6%), respectively (Table 6).
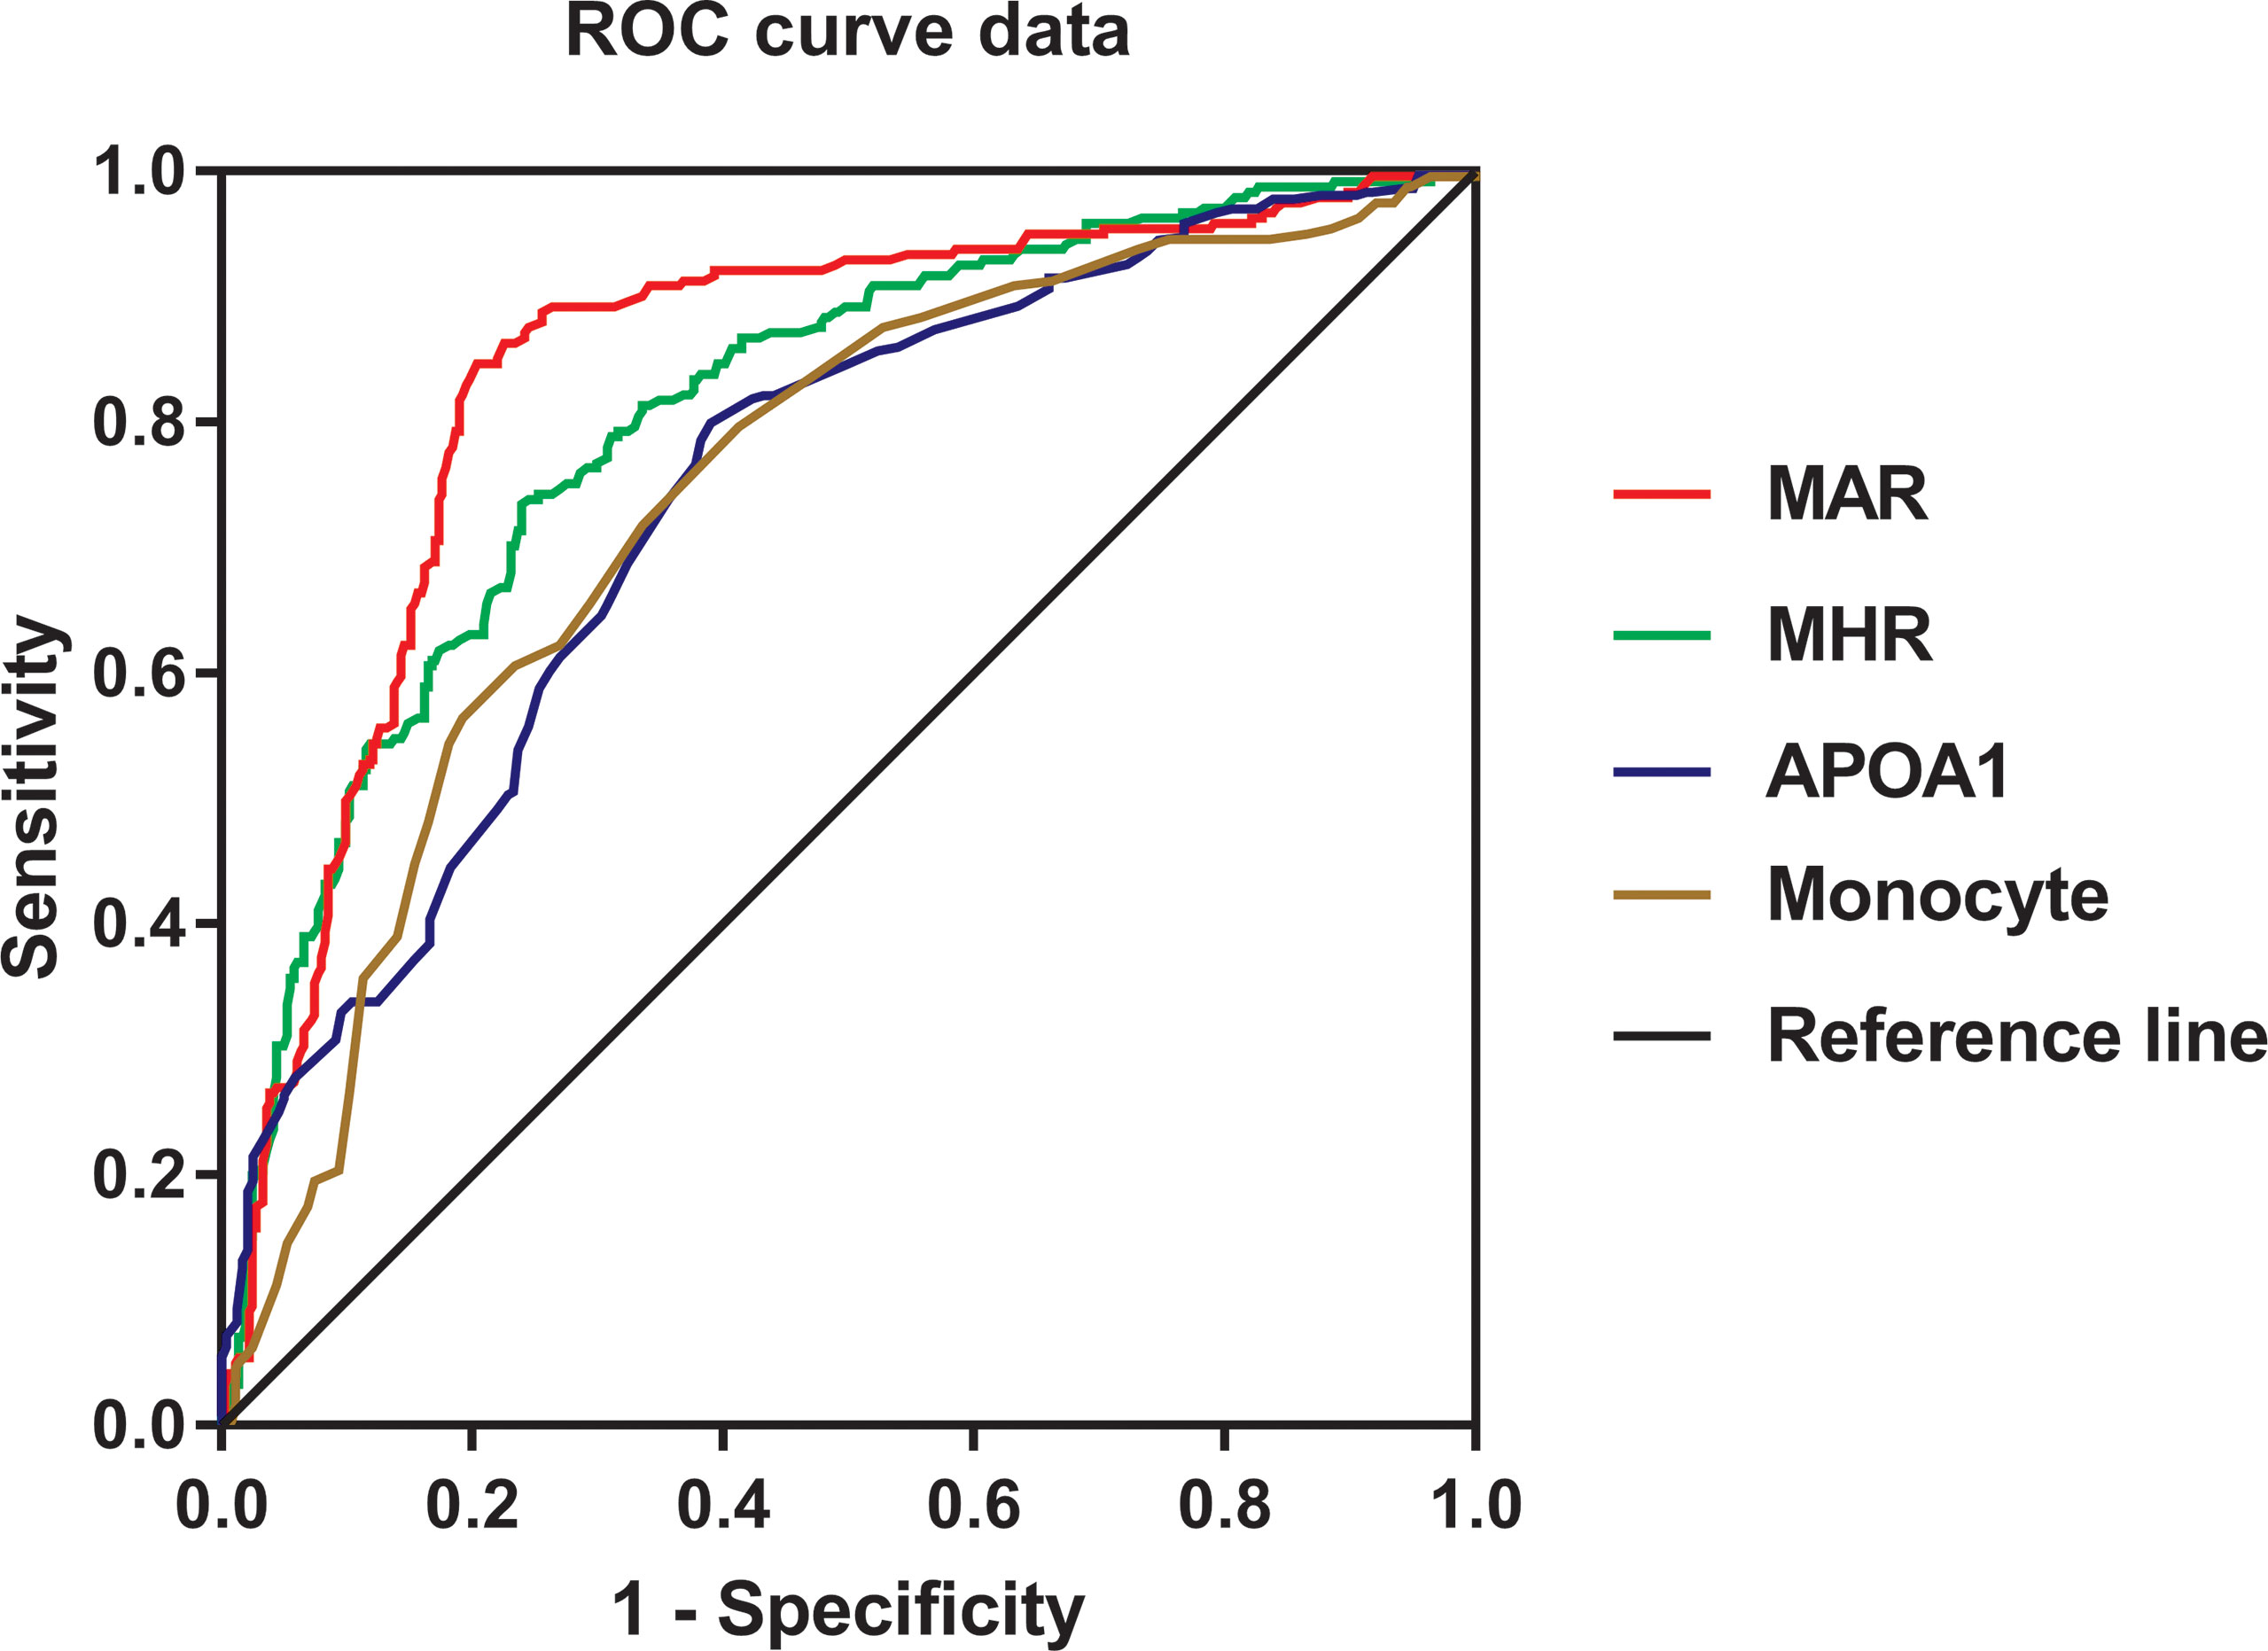
Figure 2 Receiver operating characteristic curves for the cutoff value of MHR, MAR, monocyte, and ApoA1 to identify MetS.
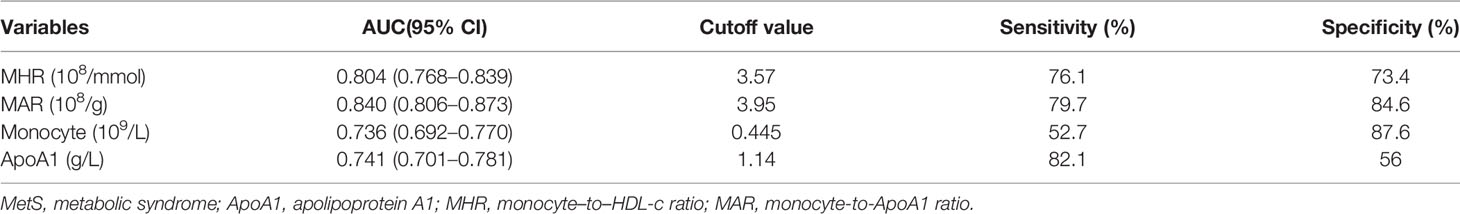
Table 6 ROC Curve Analysis of MHR and MAR in identifying MetS.
T2DM is a cluster of metabolic disease that often accompanied with MetS at the first diagnosis. Increasing evidence highlighted that inflammation involved in the development of MetS and T2DM. In this cross-sectional study, we mainly assessed the association between MetS and novel inflammatory indicators MHR and MAR in Chinese newly diagnosed T2DM. As expected, the results in the present study demonstrated that MHR and MAR were closely associated with metabolic risk factors. MHR and MAR were also significantly associated with higher odds of MetS after adjustment for other confounders. Furthermore, MHR and MAR were also seemed to have higher AUC value for MetS than ApoA1 and monocyte alone from the ROC curve analysis. These findings indicated that MHR and MAR can be novel markers for MetS in Chinese newly diagnosed T2DM.
In recent years, increasing evidence demonstrated that metabolic disorders can trigger inflammatory responses as a coping mechanism toward metabolic changes, leading to chronic inflammation occur. Thereby, chronic inflammation is widely considered as common denominator in many diseases such as obesity, MetS, T2DM, and CVD (7, 18, 19). The inflammatory process is continuous when chronic inflammation occurs, WBCs play an important role and involved in the process of inflammation that can secrete inflammatory cytokines, which can initiate and upregulate inflammatory responses. In the classification of WBCs, monocyte are produced from bone marrow and accumulated in circulatory system for a few days before migrating and differentiating into macrophages (20), which are known to stimulate the immune system and increase inflammation through releasing inflammatory cytokines like tumor necrosis TNF-ɑ, interleukin-6, and monocyte chemoattractant protein 1 (4, 21). In addition, clinical studies also observed that peripheral total monocyte counts were increased parallel to the clustering of component of MetS in T2DM (22, 23). These biological features provided a basis for monocyte to may be a predictive marker for chronic inflammatory disease like MetS and T2DM. Despite the result in our study suggested that monocyte alone is capable of predicting MetS, the identifying value is not good enough with relatively lower AUC of 0.736. The ratio of monocyte to other anti-inflammatory factors may better reflect inflammatory state and has better identifying value for MetS in newly diagnosed T2DM.
HDL-c is capable of binding to lipid molecules that ensure that it has anti-inflammatory effects, which was also considered as an ideal marker of anti-inflammatory factors. More studies have put insights on the association between ratio of neutrophils, lymphocyte to HDL-c (NHR and LHR) or MHR and systematic inflammatory diseases. Chen et al. reported that NHR and LHR have strong predictive power for MetS in Chinese population (24). MHR was also considered as indicators of oxidative stress and systemic inflammatory disease. Several studies reported that MHR showed a powerful predictive value for chronic inflammatory disease like PCOS (10), peripheral artery disease (25), central retinal artery occlusion (26), Parkinson’s Disease (11), nonalcoholic fatty liver disease (27), and ST-elevation myocardial infarction (28). Furthermore, Jiang et al. found that MHR was significantly related to all-cause and cardiovascular mortality in the general population independent of established risk factors (9). De Matteis et al. reported that MHR was independently correlated with vitamin D deficiency in healthy and metabolic women (29). All clinical findings indicated MHR can be a predictive marker for other kinds of chronic inflammatory disease like MetS. To our expectation, the results in our study showed that MHR was significantly associated with higher odds of MetS and seemed to have a higher predictive value for MetS than monocyte alone, and more studies with enough follow-up should be conducted to further confirm these findings. ApoA1 is another kind of hypothetical markers for anti-inflammation produced by the liver and responsible for peripheral cholesterol transportation and redistribution, which was also well recognized as anti-inflammatory lipid proteins in CVD (13). Previous studies have focused on the association between APOB/ApoA1 and MetS. Several studies observed that APOB/ApoA1 was significantly associated with higher odds of MetS and insulin resistance in Chinese population and PCOS patients (30, 31). To further explore the potential effects of ApoA1 in predicting MetS, we analyzed the association between MAR and MetS. To our surprise, MAR was not only an independent risk factor of MetS but it also showed the highest AUC of 0.840 with 79.7% sensitivity and 84.6% specificity in identifying MetS. These findings indicated that MAR may be a more promising indicator of MetS for Chinese newly diagnosed T2DM, whereas more longitudinal studies compared with other inflammatory indicators are needed to further confirm these findings.
To our knowledge, this is the first study that confirmed the identifying value of MHR and MAR for MetS in Chinese newly diagnosed T2DM. The other strengths of this study adjusted several potential confounding variables in final analysis and included enough sample size that can represent the Chinese newly diagnosed T2DM population. Meanwhile, some limitations need to be mentioned. First, this study was designed as a cross-sectional study without follow-up, and it cannot directly reflect the associations MHR, MAR, and MetS. Second, the studied population is the Chinese newly diagnosed T2DM, and the optimal cutoff values of MHR and MAR may be not applicable to other races.
In conclusion, two novel indicators of MetS for Chinese newly diagnosed T2DM was found in this study. The results showed that MHR and MAR were significantly associated with MetS and seemed to have higher AUC value for MetS than ApoA1 and monocyte alone. All these findings indicated that MHR and MAR could be convenient and reliable predictors to screen for MetS in Chinese newly diagnosed T2DM, whereas more longitudinal studies are needed to further confirm these associations.
The raw data supporting the conclusions of this article will be made available by the authors, without undue reservation.
The studies involving human participants were reviewed and approved by the ethical committee of Longyan First Affiliated Hospital of Fujian Medical University. The patients/participants provided their written informed consent to participate in this study.
WW took charge of the software and contributed to writing— original draft. WW, ZC, XG, and MT conducted the investigation. MT contributed to data curation and writing-editing. All authors contributed to the article and approved the submitted version.
The authors declare that the research was conducted in the absence of any commercial or financial relationships that could be construed as a potential conflict of interest.
All claims expressed in this article are solely those of the authors and do not necessarily represent those of their affiliated organizations, or those of the publisher, the editors and the reviewers. Any product that may be evaluated in this article, or claim that may be made by its manufacturer, is not guaranteed or endorsed by the publisher.
1. Eckel Robert H, Grundy Scott M, Zimmet Paul Z. The Metabolic Syndrome. .Lancet (2005) 365:1415–28. doi: 10.1016/S0140-6736(05)66378-7
2. Li X, Cao C, Tang X, Yan X, Zhou H, Liu J, et al. Prevalence of Metabolic Syndrome and Its Determinants in Newly-Diagnosed Adult-Onset Diabetes in China: A Multi-Center, Cross-Sectional Survey. Front Endocrinol (2019) 10):661. doi: 10.3389/fendo.2019.00661
3. Kempf K, Rose B, Herder C, Kleophas U, Martin S, Kolb H, et al. Inflammation in Metabolic Syndrome and Type 2 Diabetes: Impact of Dietary Glucose. Ann N Y Acad Sci (2006) 1084:30–48. doi: 10.1196/annals.1372.012
4. Ghanim H, Aljada A, Hofmeyer D, Syed T, Mohanty P, Dandona P, et al. Circulating Mononuclear Cells in the Obese are in a Proinflammatory State. Circulation (2004) 110:1564–71. doi: 10.1161/01.CIR.0000142055.53122.FA
5. Shi C, Pamer Eric G. Monocyte Recruitment During Infection and Inflammation. Nat Rev Immunol (2011) 11:762–74. doi: 10.1038/nri3070
6. Orozco Susana L, Canny Susan P, Hamerman Jessica A. Signals Governing Monocyte Differentiation During Inflammation. Curr Opin Immunol (2021) 73:16–24. doi: 10.1016/j.coi.2021.07.007
7. Williams H, Mack Corinne D, Li Stephen CH, Fletcher JP, Medbury HJ, et al. Nature Versus Number: Monocytes in Cardiovascular Disease. Int J Mol Sci (2021) 22(17):9119. doi: 10.3390/ijms22179119
8. Singh Inder M, Shishehbor Mehdi H, Ansell Benjamin J. High-Density Lipoprotein as a Therapeutic Target: A Systematic Review. .JAMA (2007) 298:786–98. doi: 10.1001/jama.298.7.786
9. Jiang M, Yang J, Zou H, Li M, Sun W, Kong X, et al. Monocyte-To-High-Density Lipoprotein-Cholesterol Ratio (MHR) and the Risk of All-Cause and Cardiovascular Mortality: A Nationwide Cohort Study in the United States. Lipids Health Dis (2022) 21:30. doi: 10.1186/s12944-022-01638-6
10. Herkiloglu D, Gokce S. Correlation of Monocyte/HDL Ratio (MHR) With Inflammatory Parameters in Obese Patients Diagnosed With Polycystic Ovary Syndrome. Ginekol Pol (2021) 92:537–43. doi: 10.5603/GP.a2020.0191
11. Liu Z, Fan Q, Wu S, Wan Y, Lei Y. Compared With the Monocyte to High-Density Lipoprotein Ratio (MHR) and the Neutrophil to Lymphocyte Ratio (NLR), the Neutrophil to High-Density Lipoprotein Ratio (NHR) is More Valuable for Assessing the Inflammatory Process in Parkinson’s Disease. Lipids Health Dis (2021) 20:35. doi: 10.1186/s12944-021-01462-4
12. Dincgez Cakmak B, Dundar B, Ketenci Gencer F, Aydin BB, Yildiz DE, et al. TWEAK and Monocyte to HDL Ratio as a Predictor of Metabolic Syndrome in Patients With Polycystic Ovary Syndrome. Gynecol Endocrinol (2019) 35:66–71. doi: 10.1080/09513590.2018.1490401
13. Rhainds D, Brodeur Mathieu R, Tardif Jean C. Lipids, Apolipoproteins, and Inflammatory Biomarkers of Cardiovascular Risk: What Have We Learned? Clin Pharmacol Ther (2018) 104:244–56. doi: 10.1002/cpt.1114
14. Organization WH. Guidelines for Controlling and Monitoring the Tobacco Epidemic. Geneva, Switzerland: World Health Organization (1998) p. 1–190.
15. GBD 2016 Alcohol Collaborators. Alcohol Use and Burden for 195 Countries and Territories, 1990-2016: A Systematic Analysis for the Global Burden of Disease Study 2016. Lancet (2018) 392:1015–35. doi: 10.1016/S0140-6736(18)31310-2
16. Bonora E, Targher G, Alberiche M, Bonadonna RC, Saggiani F, Zenere MB, et al. Homeostasis Model Assessment Closely Mirrors the Glucose Clamp Technique in the Assessment of Insulin Sensitivity: Studies in Subjects With Various Degrees of Glucose Tolerance and Insulin Sensitivity. Diabetes Care (2000) 23(1):57–63. doi: 10.2337/diacare.23.1.57
17. Society CD. Guideline for the Prevention and Treatment of Type 2 Diabetes Mellitus in China (2020 Edition). Chin J Diabetes Mellitus (2021) 13(4):378–9. doi: 10.3760/cma.j.cn112138-20211027-00751
18. Naidoo V, Naidoo M, Ghai M. Cell- and Tissue-Specific Epigenetic Changes Associated With Chronic Inflammation in Insulin Resistance and Type 2 Diabetes Mellitus. Scand J Immunol (2018) 88:e12723. doi: 10.1111/sji.12723
19. Grandl G, olfrum C. Hemostasis, Endothelial Stress, Inflammation, and the Metabolic Syndrome. Semin Immunopathol (2018) 40:215–24. doi: 10.1007/s00281-017-0666-5
20. Ziegler-Heitbrock L. Blood Monocytes and Their Subsets: Established Features and Open Questions. Front Immunol (2015) 6:423. doi: 10.3389/fimmu.2015.00423
21. Singh S, Anshita D, Ravichandiran V. MCP-1: Function, Regulation, and Involvement in Disease. Int Immunopharmacol (2021) 101:107598. doi: 10.1016/j.intimp.2021.107598
22. Tsai Jack C-R, Sheu S-H, Chiu H-C, Chung FM, Chang DM, Chen MP, et al. Association of Peripheral Total and Differential Leukocyte Counts With Metabolic Syndrome and Risk of Ischemic Cardiovascular Diseases in Patients With Type 2 Diabetes Mellitus. Diabetes Metab Res Rev (2007) 23:111–8. doi: 10.1002/dmrr.647
23. Yang X, Tian S, Ma Q, Sun HP, Xu Y, Pan CW, et al. Leukocyte-Related Parameters in Older Adults With Metabolic Syndrome. Endocrine (2020) 68:312–9. doi: 10.1007/s12020-020-02243-2
24. Chen T, Chen H, Xiao H, Tang H, Xiang Z, Wang X, et al. Comparison of the Value of Neutrophil to High-Density Lipoprotein Cholesterol Ratio and Lymphocyte to High-Density Lipoprotein Cholesterol Ratio for Predicting Metabolic Syndrome Among a Population in the Southern Coast of China. Diabetes Metab Syndr Obes (2020) 13:597–605. doi: 10.2147/DMSO.S238990
25. Ceyhun G, Engin Muhammed Ç. The Monocyte/High Density Lipoprotein Cholesterol Ratio (MHR) as an Indicator of the Need for Amputation in Patients With Peripheral Artery Disease Developing Critical Limb Ischemia. Angiology (2021) 72:268–73. doi: 10.1177/0003319720965808
26. Guven S, Kilic D. Neutrophil to Lymphocyte Ratio (NLR) is a Better Tool Rather Than Monocyte to High-Density Lipoprotein Ratio (MHR) and Platelet to Lymphocyte Ratio (PLR) in Central Retinal Artery Occlusions. .Ocul Immunol Inflammation (2021) 29:997–1001. doi: 10.1080/09273948.2020.1712433
27. Huang H, Wang Q, Shi X, Chen Y, Shen C, Zhang J, et al. Association Between Monocyte to High-Density Lipoprotein Cholesterol Ratio and Nonalcoholic Fatty Liver Disease: A Cross-Sectional Study. Mediators Inflammation (2021) 2021:6642246. doi: 10.1155/2021/6642246
28. Villanueva Danielle Louis E, Tiongson Marc D, Ramos John D. Monocyte to High-Density Lipoprotein Ratio (MHR) as a Predictor of Mortality and Major Adverse Cardiovascular Events (MACE) Among ST Elevation Myocardial Infarction (STEMI) Patients Undergoing Primary Percutaneous Coronary Intervention: A Meta-Analysis. Lipids Health Dis (2020) 19:55. doi: 10.1186/s12944-020-01242-6
29. De Matteis C, Crudele L, Cariello M, Battaglia S, Piazzolla G, Suppressa P, et al. Monocyte-To-HDL Ratio (MHR) Predicts Vitamin D Deficiency in Healthy and Metabolic Women: A Cross-Sectional Study in 1048 Subjects. Nutrients (2022) 14(2):347. doi: 10.3390/nu14020347
30. He H, Feng J, Zhang S, Wang Y, Li J, Gao J, et al. The Apolipoprotein B/A1 Ratio is Associated With Metabolic Syndrome Components, Insulin Resistance, Androgen Hormones, and Liver Enzymes in Women With Polycystic Ovary Syndrome. Front Endocrinol (Lausanne) (2021) 12:773–81. doi: 10.3389/fendo.2021.773781
31. Yin Q, Chen X, Li L, Zhou R, Huang J, Yang D, et al. Apolipoprotein B/apolipoprotein A1 Ratio is a Good Predictive Marker of Metabolic Syndrome and Pre-Metabolic Syndrome in Chinese Adolescent Women With Polycystic Ovary Syndrome. J Obstet Gynaecol Res (2013) 39:203–9. doi: 10.1111/j.1447-0756.2012.01907.x
Keywords: monocyte to high-density lipoprotein ratio, monocyte to apolipoprotein A1 ratio, metabolic syndrome, newly diagnosed type 2 diabetes, optimal cut-off value
Citation: Wang W, Chen ZY, Guo XL and Tu M (2022) Monocyte to High-Density lipoprotein and Apolipoprotein A1 Ratios: Novel Indicators for Metabolic Syndrome in Chinese Newly Diagnosed Type 2 Diabetes. Front. Endocrinol. 13:935776. doi: 10.3389/fendo.2022.935776
Received: 04 May 2022; Accepted: 16 June 2022;
Published: 14 July 2022.
Edited by:
Ozra Tabatabaei-Malazy, Tehran University of Medical Sciences, IranReviewed by:
Solaleh Emamgholipour, Tehran University of Medical Sciences, IranCopyright © 2022 Wang, Chen, Guo and Tu. This is an open-access article distributed under the terms of the Creative Commons Attribution License (CC BY). The use, distribution or reproduction in other forums is permitted, provided the original author(s) and the copyright owner(s) are credited and that the original publication in this journal is cited, in accordance with accepted academic practice. No use, distribution or reproduction is permitted which does not comply with these terms.
*Correspondence: Mei Tu, bmZta2x5c3lAMTYzLmNvbQ==
†These authors have contributed equally to this work
Disclaimer: All claims expressed in this article are solely those of the authors and do not necessarily represent those of their affiliated organizations, or those of the publisher, the editors and the reviewers. Any product that may be evaluated in this article or claim that may be made by its manufacturer is not guaranteed or endorsed by the publisher.
Research integrity at Frontiers
Learn more about the work of our research integrity team to safeguard the quality of each article we publish.