 Yujuan Ouyang1
 Yingping Quan2Chengyi Guo3Songlin Xie3Changxiong Liu3Xiongjie Huang3Xinfeng Huang3Yanming Chen3Xiangjun Xiao3Nengqian Ma4
 Ruijie Xie3*
- 1Nuclear Industry Health School, The Affiliated Nanhua Hospital, Hengyang Medical School, University of South China, Hengyang, China
- 2Department of Gastrointestinal Surgery, The Affiliated Nanhua Hospital, Hengyang Medical School, University of South China, Hengyang, China
- 3Department of Hand & Microsurgery, The Affiliated Nanhua Hospital, Hengyang Medical School, University of South China, Hengyang, China
- 4Department of Hepatobiliary Surgery, The Affiliated Nanhua Hospital, Hengyang Medical School, University of South China, Hengyang, China
Background: Adolescence is a critical period for bone development, and peak bone mass may be reached in late adolescence. Boosting bone accumulation at this time can help preserve adult bone health and avoid osteoporosis later in life. Body mass index (BMI) has been found to have a favorable impact on bone mineral density (BMD) in previous research. However, excessive obesity is harmful to health and may lead to various systemic diseases. Therefore, finding an appropriate BMI to maintain a balance between obesity and BMD is critical for adolescents.
Methods: The datasets from the National Health and Nutrition Examination Survey (NHANES) 2011–2020 were used in a cross-sectional investigation. Multivariate linear regression models were used to examine the linear connection between BMI and BMD. Fitted smoothing curves and threshold effect analysis were used to describe the nonlinear relationship. Subgroup analyses were then conducted based on gender and age.
Results: This population-based study included a total of 6,143 adolescents aged 8–19 years. In a multivariate linear regression analysis, a good association between BMI and total BMD was shown [0.014 (0.013, 0.014)]. This positive association was maintained in all subgroup analyses grouped by sex and age. Furthermore, the association between BMI and BMD was nonlinear with a saturation point present, as evidenced by smoothed curve fitting. According to the threshold effect study, with an age group of two years, adolescents of different ages had different BMI saturation values with respect to BMD.
Conclusions: Our study showed a significant positive and saturated association between BMI and BMD in adolescents aged 8–19 years. Maintaining BMI at saturation values may reduce other adverse effects while achieving optimal BMD.
Background
Osteoporosis is a long-term disorder marked by reduced bone mineral density (BMD) that affects a huge number of people (1). Adolescence is a critical period for bone development, and peak bone mass (PBM) may be reached in late adolescence (2, 3). There is evidence that increasing PBM by 5% throughout childhood and adolescence reduces the risk of osteoporotic fractures by 40%, whereas increasing PBM by 10% reduces the risk by half (4, 5). As a result, boosting bone accumulation at this time can help preserve adult bone health and avoid osteoporosis later in life (6, 7). In addition to metabolic disorders such as lipids (8, 9), serum calcium (10), and non-alcoholic fatty liver disease (11), obesity has been shown to have an impact on adolescent BMD (12). Meanwhile, scientists are working to discover novel ways to prevent and treat osteoporosis.
Obesity is a major health issue that affects individuals all over the globe (13). The prevalence of overweight and obesity among children and adolescents aged 5–19 years rose sharply from 4% in 1975 to more than 18% in 2016 (14). Previous research has shown that body mass index (BMI) and BMD have a significant positive relationship (15, 16). However, excessive obesity not only has very serious consequences for various organs and systems (17, 18) but may also increase the risk of fractures in children (19). We hypothesized that BMI had a saturation point, and that keeping BMI at this level would provide the greatest balance between obesity and BMD. Therefore, finding an appropriate BMI to maintain a balance between obesity and BMD is critical for adolescents. As a result, we examined the relationship between BMI and BMD in adolescents in this study, utilizing a large sample of people aged 8–19 from the National Health and Nutrition Examination Survey (NHANES).
Methods
Study Population
The National Health and Nutrition Examination Survey is a representative survey of the US national population that uses a complicated, multistage, and probabilistic sampling methodology to provide a wealth of information about the general US population’s nutrition and health (20). The 2011–2020 continuous cycle of the US NHANES dataset was used for this investigation. In this round, there were 68,394 participants. After eliminating patients who lacked information on laboratory and demographic characteristics, a total of 6,143 subjects were included in the analysis. Figure 1 illustrates the sample selection flow chart.
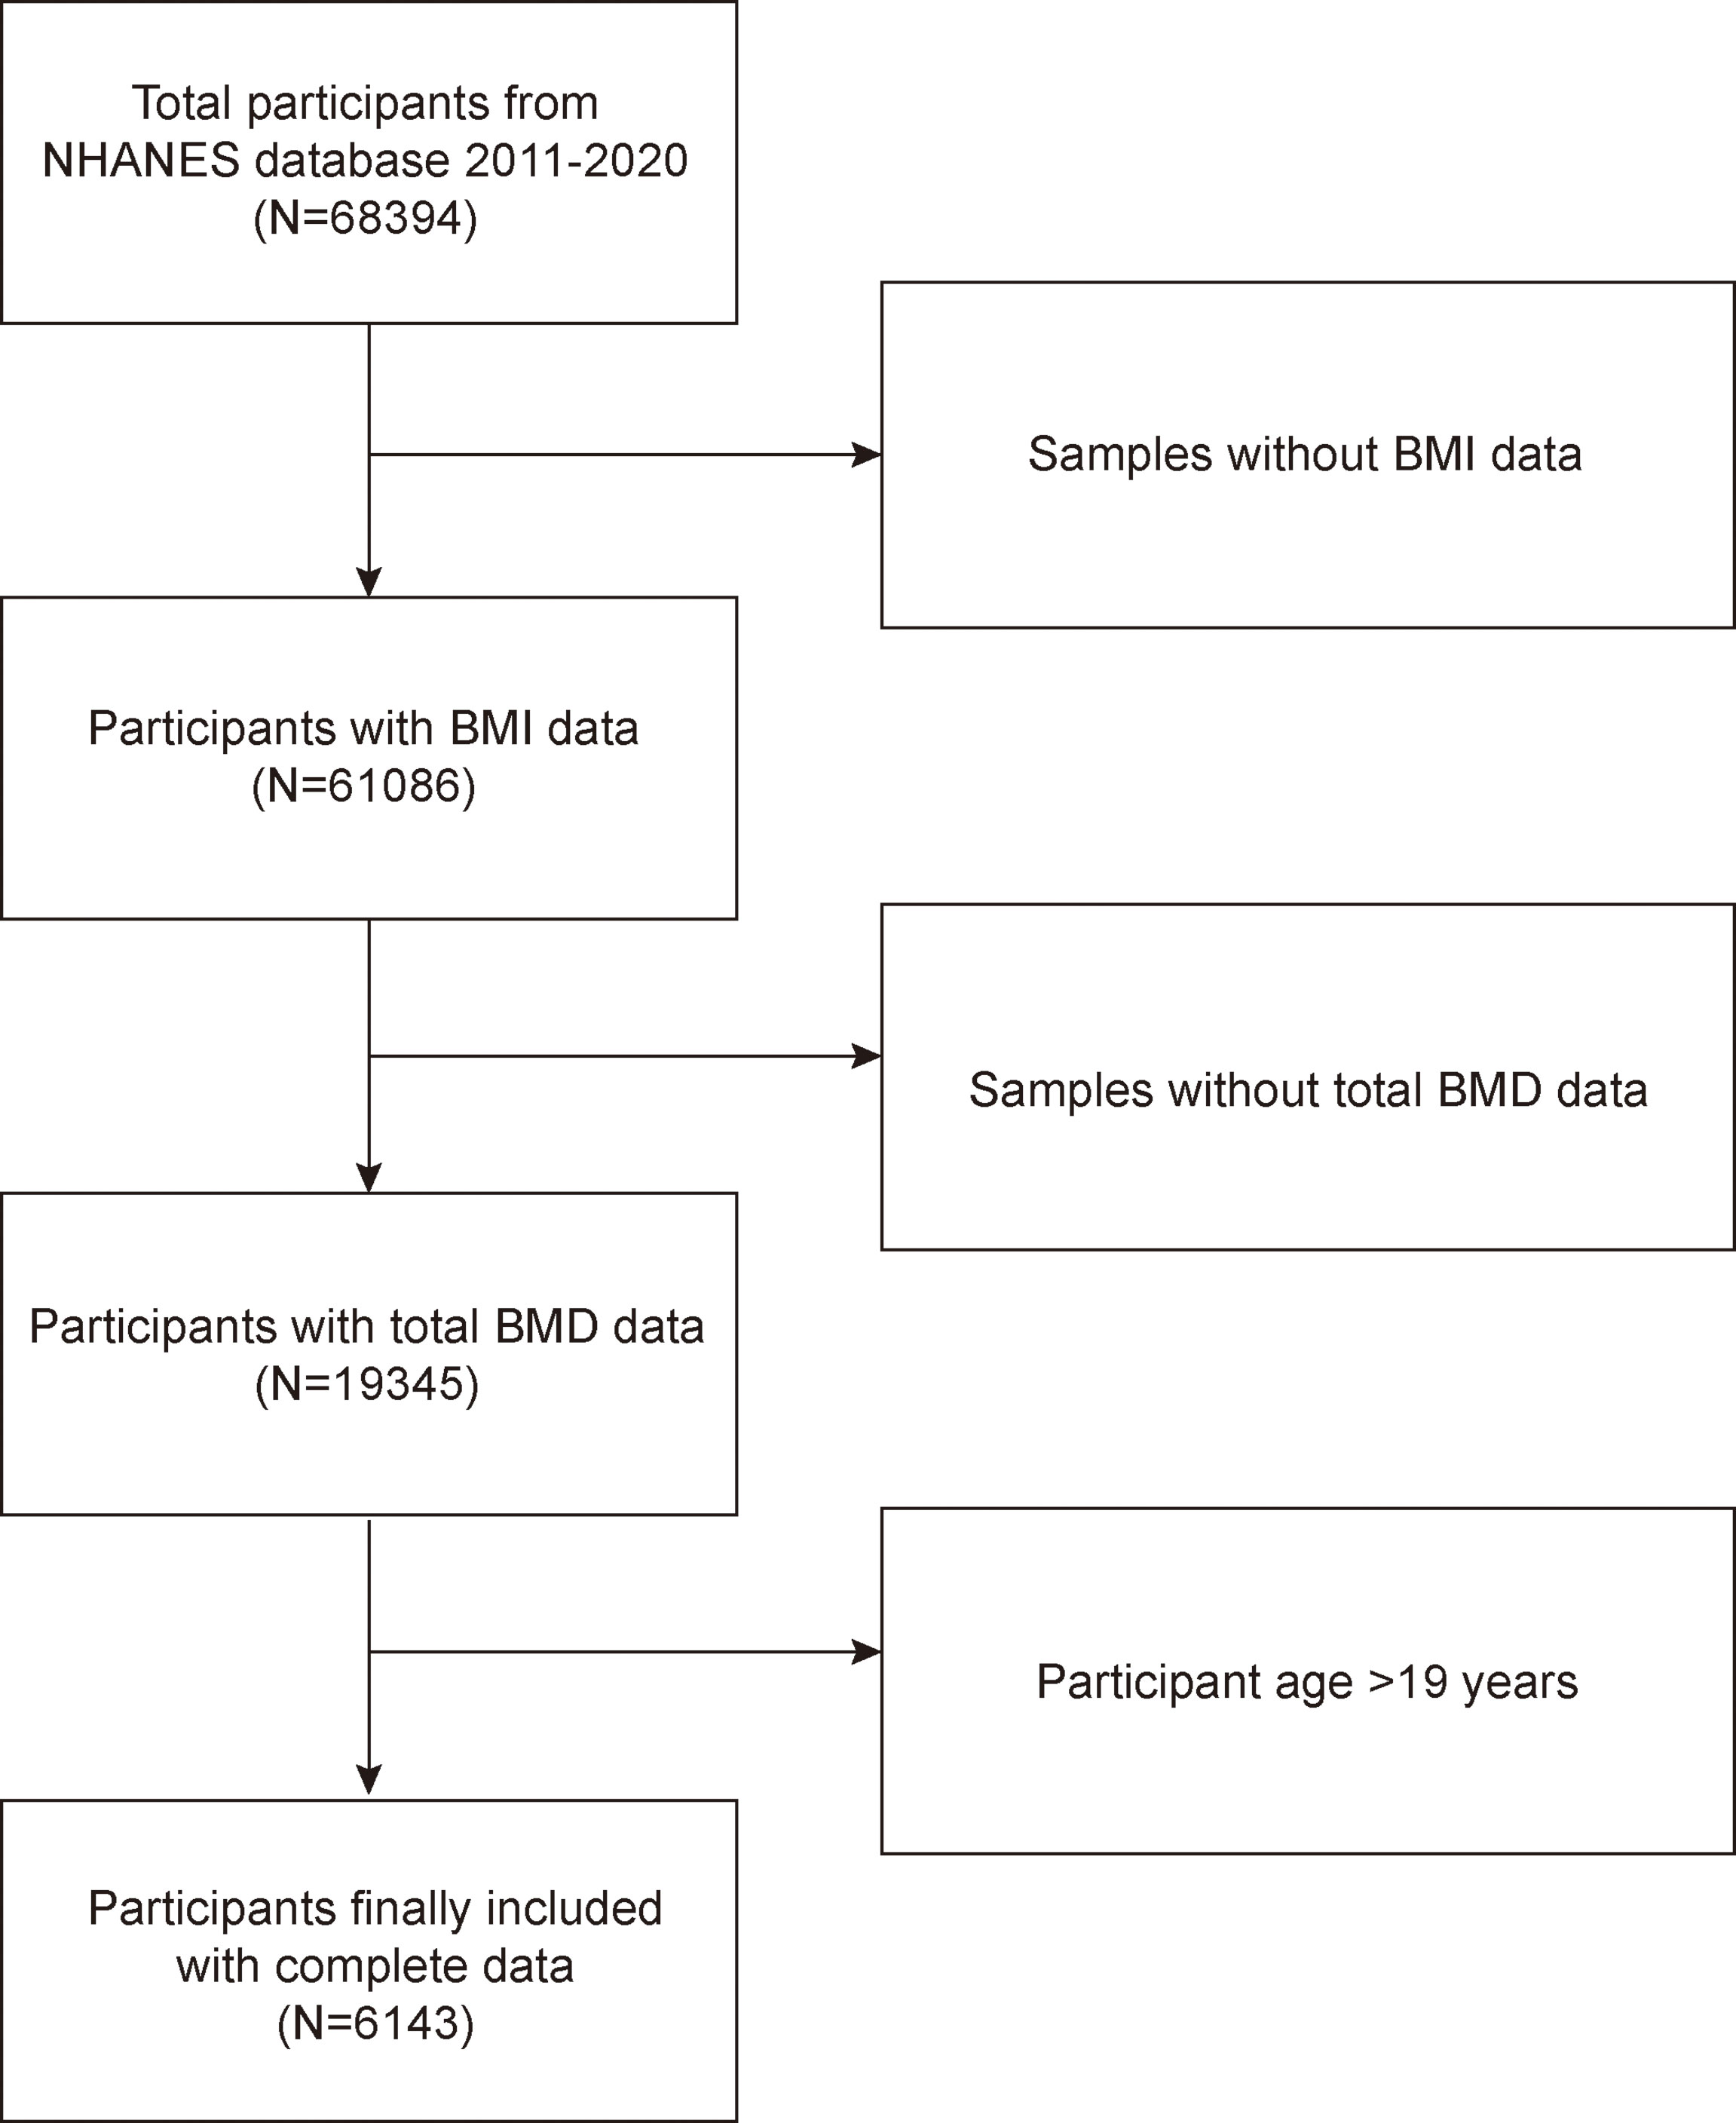
Figure 1 Flow chart of participants selection. NHANES, National Health and Nutrition Examination Survey; BMD, bone mineral density; Body Mass Index, BMI.
Study Variables
The dependent variable in this study is BMI, with total BMD as the intended independent variable. Weight divided by height squared is how BMI is computed according to the international guidelines. To ensure that the data are trustworthy, outliers will be subjected to appropriate scrutiny. The age, weight, height, and gender of the individual are used to verify the accuracy of the data. After verification, inaccurate data were removed. A dual-energy X-ray absorptiometry scan was used to calculate the total BMD. Covariates included age, gender, race, standing height, education level, family income-to-poverty ratio, activities status, diabetes status, alanine transaminase (ALT), weight, alkaline phosphatase (ALP), waist circumference, aspartate aminotransferase (AST), total calcium, total cholesterol, direct high-density lipoprotein (HDL) cholesterol, low-density lipoprotein (LDL) cholesterol, triglyceride, phosphorus, blood urea nitrogen, and serum glucose. For more detailed information on BMI, total BMD, and confounders, visit http://www.cdc.gov/nchs/nhanes/.
Statistical Analysis
The statistical study was carried out using the statistical computing and graphics software R (version 4.1.3), Origin (version 2021b), and EmpowerStats (version 2.0). Baseline tables for the study population were statistically described by BMI subgroup, and continuous variables are described using means ± standard deviation and weighted linear regression models. The beta values and 95% confidence intervals (CI) were calculated using multivariate linear regression analysis between the BMI and BMD. The multivariate test was built using three models: Model 1: no variables adjusted; Model 2: gender, age, and race adjusted; Model 3: adjusted for all covariates except for height and weight, which had a large effect on exposure factors. By adjusting the variables, smoothed curve fits were done simultaneously. A threshold effects analysis model was used to examine the relationship and saturation value between BMI and BMD. Finally, the same statistical study methods described above were conducted for the gender and BMI subgroups. It was determined that P < 0.05 was statistically significant. We used a weighting approach to reduce the significant volatility of our dataset.
Results
Baseline Characteristics
A total of 6,143 adolescents were included in this study based on the inclusion and exclusion criteria, and the average age of the participants was 13.10 ± 3.46 years. Among these participants, 51.77% were boys, 48.23% were girls, 27.53% were non-Hispanic white, 23.98% were non-Hispanic black, 20.56% were Mexican-American, and 27.93% were other races. The mean (SD) concentrations of BMI and total BMD were 22.28 (5.99) kg/m2 and 0.95 (0.16) g/cm2, respectively. Table 1 lists the clinical features of the study participants, and column stratified grouping was based on BMI dividing all participants equally into four groups by number. Figure 2 shows the frequency distribution of BMI for total participants and for participants of different genders. In comparison to the bottom quartile, those in the top quartile with higher BMI were more likely to be females and older, with a higher proportion of non-Hispanic blacks and Mexican-Americans, with higher prevalence of diabetes, and with higher levels of weight, standing height, waist circumference, AST, ALT, Total cholesterol, LDL cholesterol, serum glucose, total BMD, triglyceride, and total BMD but with lower levels of ratio of family income to poverty, ALP, total calcium, direct HDL cholesterol, phosphorus, and blood urea nitrogen (P < 0.05).
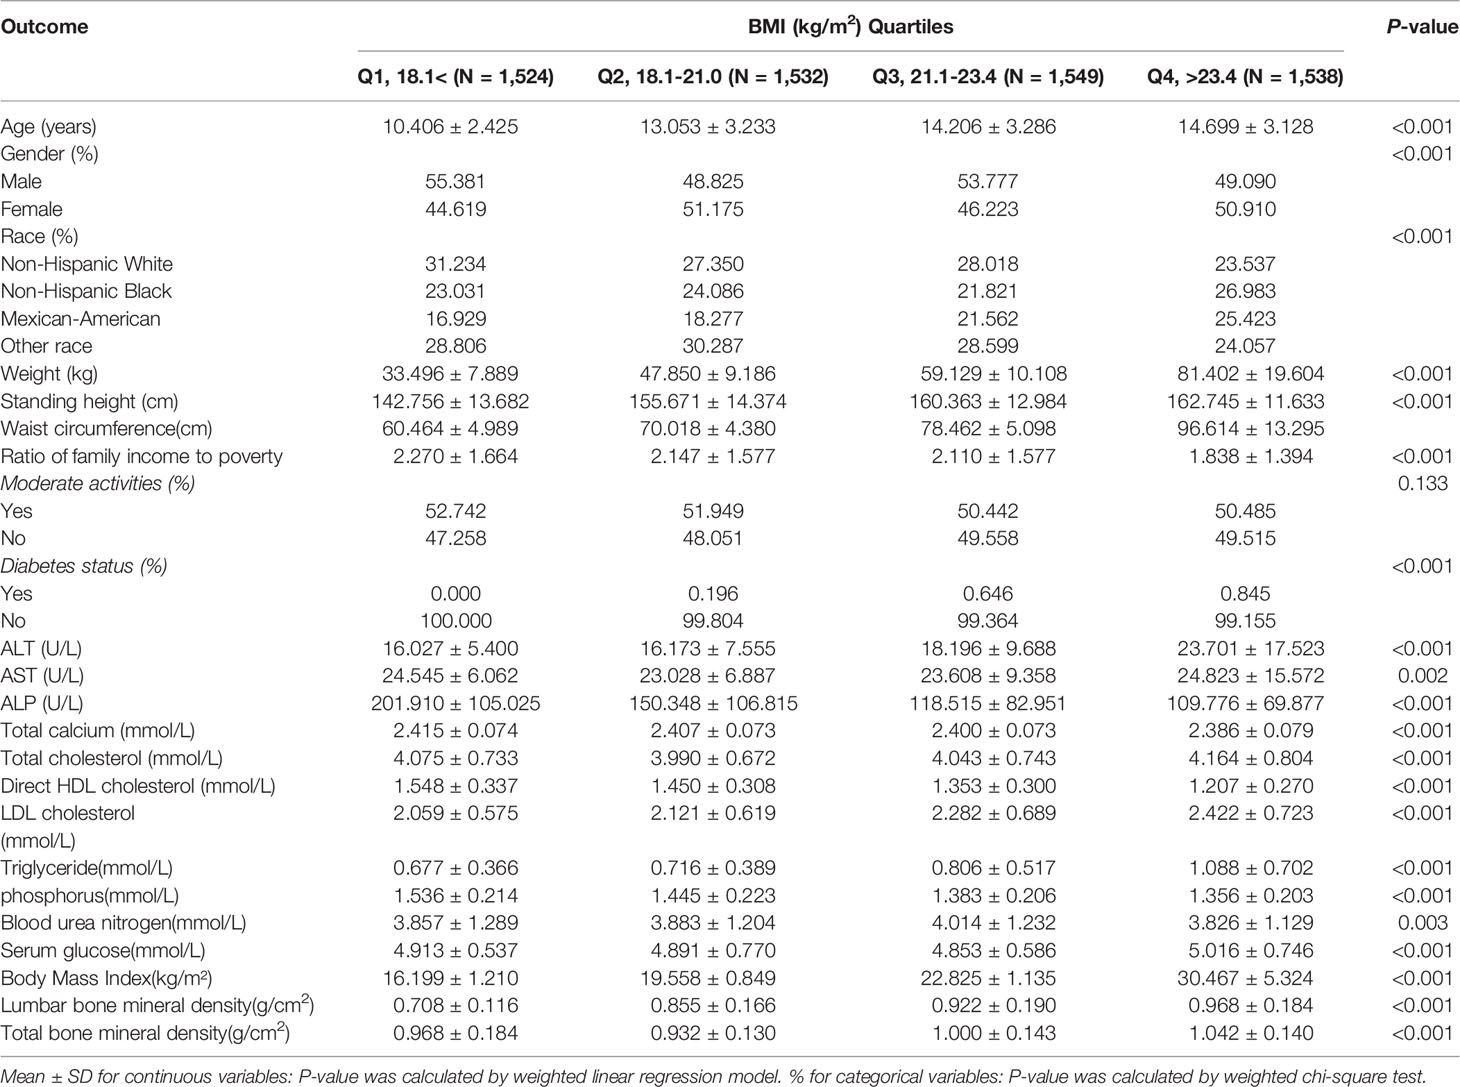
Table 1 Characteristics of the participants.
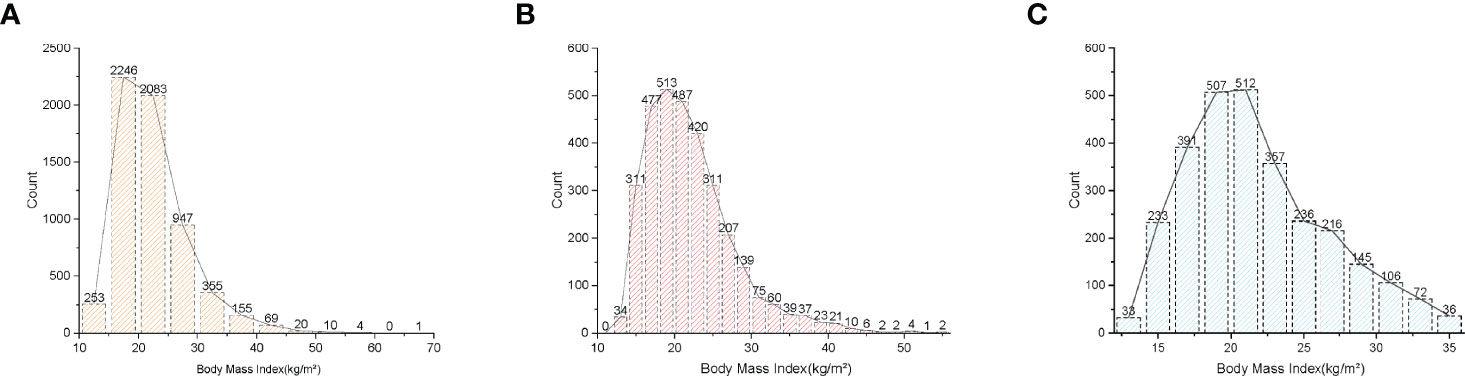
Figure 2 Distribution histogram of BMI. (A) Among all participants. (B) Among all males. (C) Among all females. Body Mass Index, BMI.
Association Between BMI and Total BMD
Table 2 shows the results of the multivariate regression analysis. In the unadjusted model [0.014 (0.013, 0.014)], BMI was highly associated with total BMD. In addition, this relationship remained significant after adjusting corresponding variables in Model 2 [0.006 (0.005, 0.006)] and Model 3 [0.005 (0.004, 0.005)]. In the unadjusted model, the beta value was 0.014, meaning that, for every unit increase in BMI, the total BMD increased by 0.014 g/cm2.
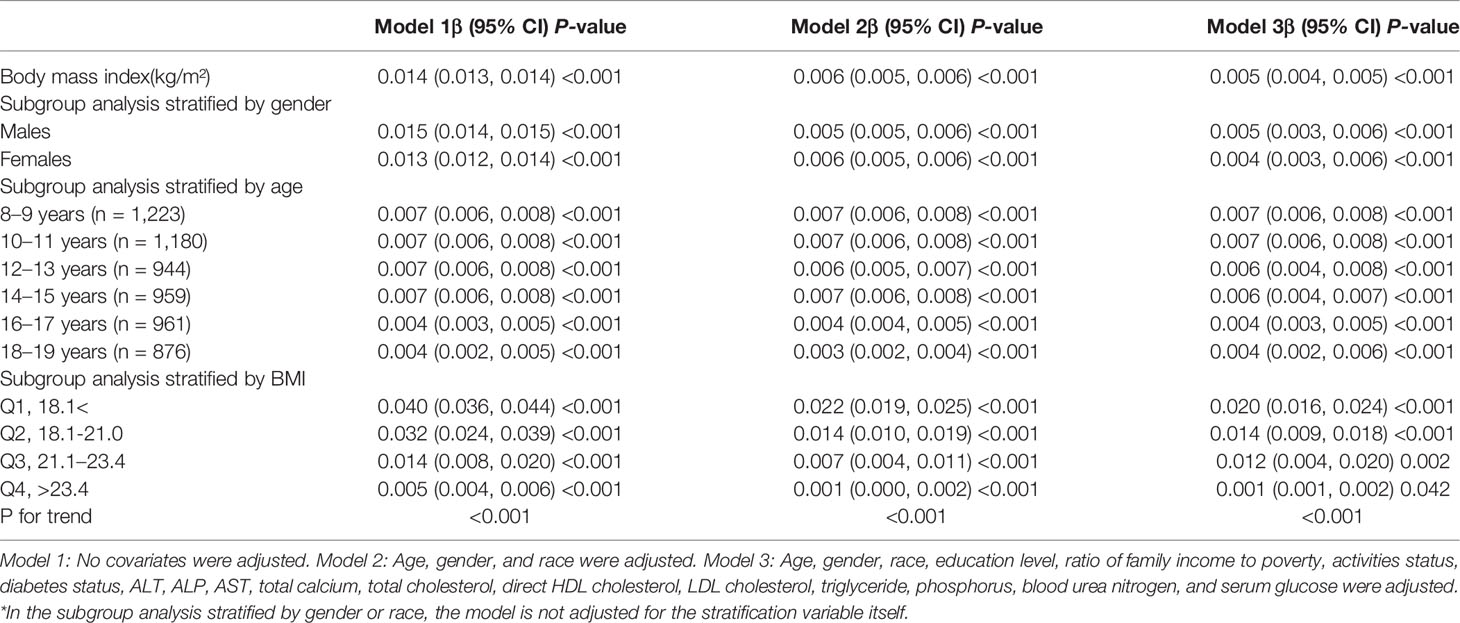
Table 2 Association between BMI (kg/m²) and total bone mineral density (g/cm2).
In all subgroups, BMI showed a significant positive association with total BMD. In the subgroup analysis stratified by sex, the effect values were closer for boys and girls, 0.015 and 0. 013, respectively. Whereas in the subgroup analysis stratified by age, the effect values for adolescents aged 8–15 years were significantly larger than those for adolescents aged 16–19 years, implying that, for each unit increase in BMI for adolescents aged 8–15 years, BMD increased by 0.07 g/cm2 and, for each unit increase in BMI for adolescents aged 16–19 years, BMD increased by only 0.04 g/cm2. In addition, the results of the BMI quartile subgroup analysis showed that there was a dose-response relationship between BMI and total BMD.
Non-Linearity and Saturation Effect Analysis Between BMI and Total BMD
Smooth curve fittings were performed to characterize the non-linear relationship and saturation effect between BMI and total BMD (Figures 3, 4). We discovered that the saturation effect value between BMI and total BMD was 21.5 kg/m2 in total participants (Table 3). When the BMI was under 21.5 kg/m2, the effect value was 0.036. However, when BMI exceeded 21.5 kg/m2, the effect value became 0.005. All participants were divided into six groups according to an age group of 2 years and the saturation values of BMI for total BMD of adolescents at different ages were determined using smoothed fitted curves and saturation effects analysis (Table 3).
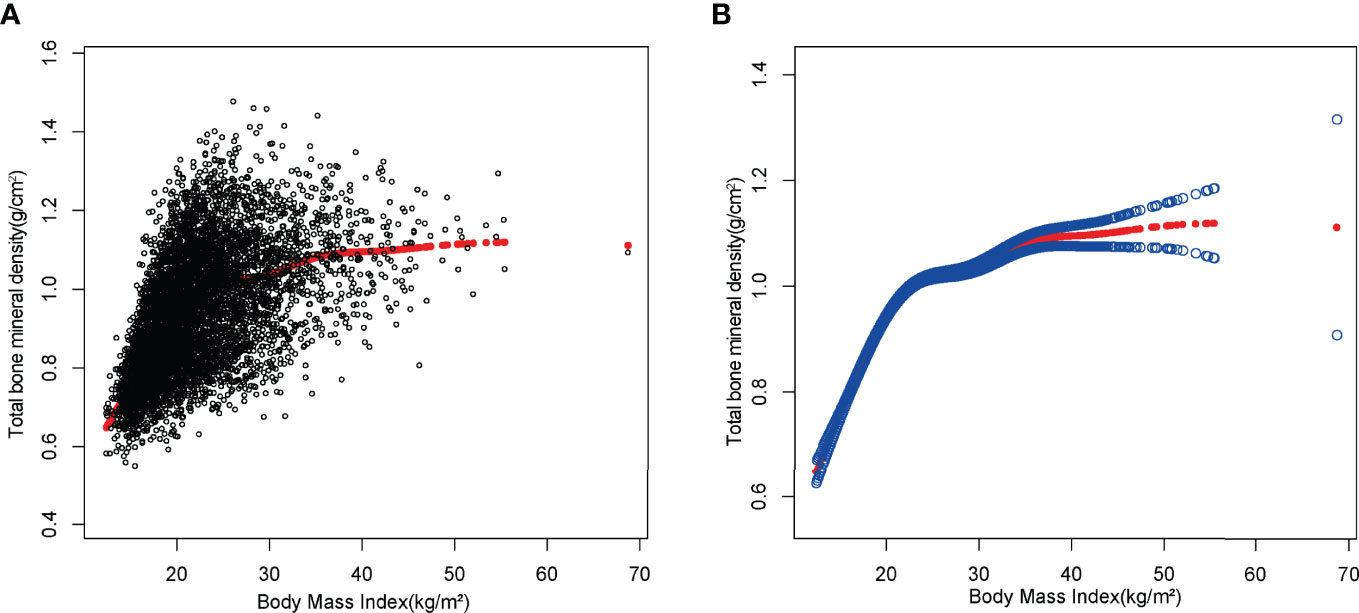
Figure 3 The association between BMI and total bone mineral density. (A) Each black point represents a sample. (B) The solid red line represents the smooth curve fit between variables. Blue bands represent the 95% confidence interval from the fit.
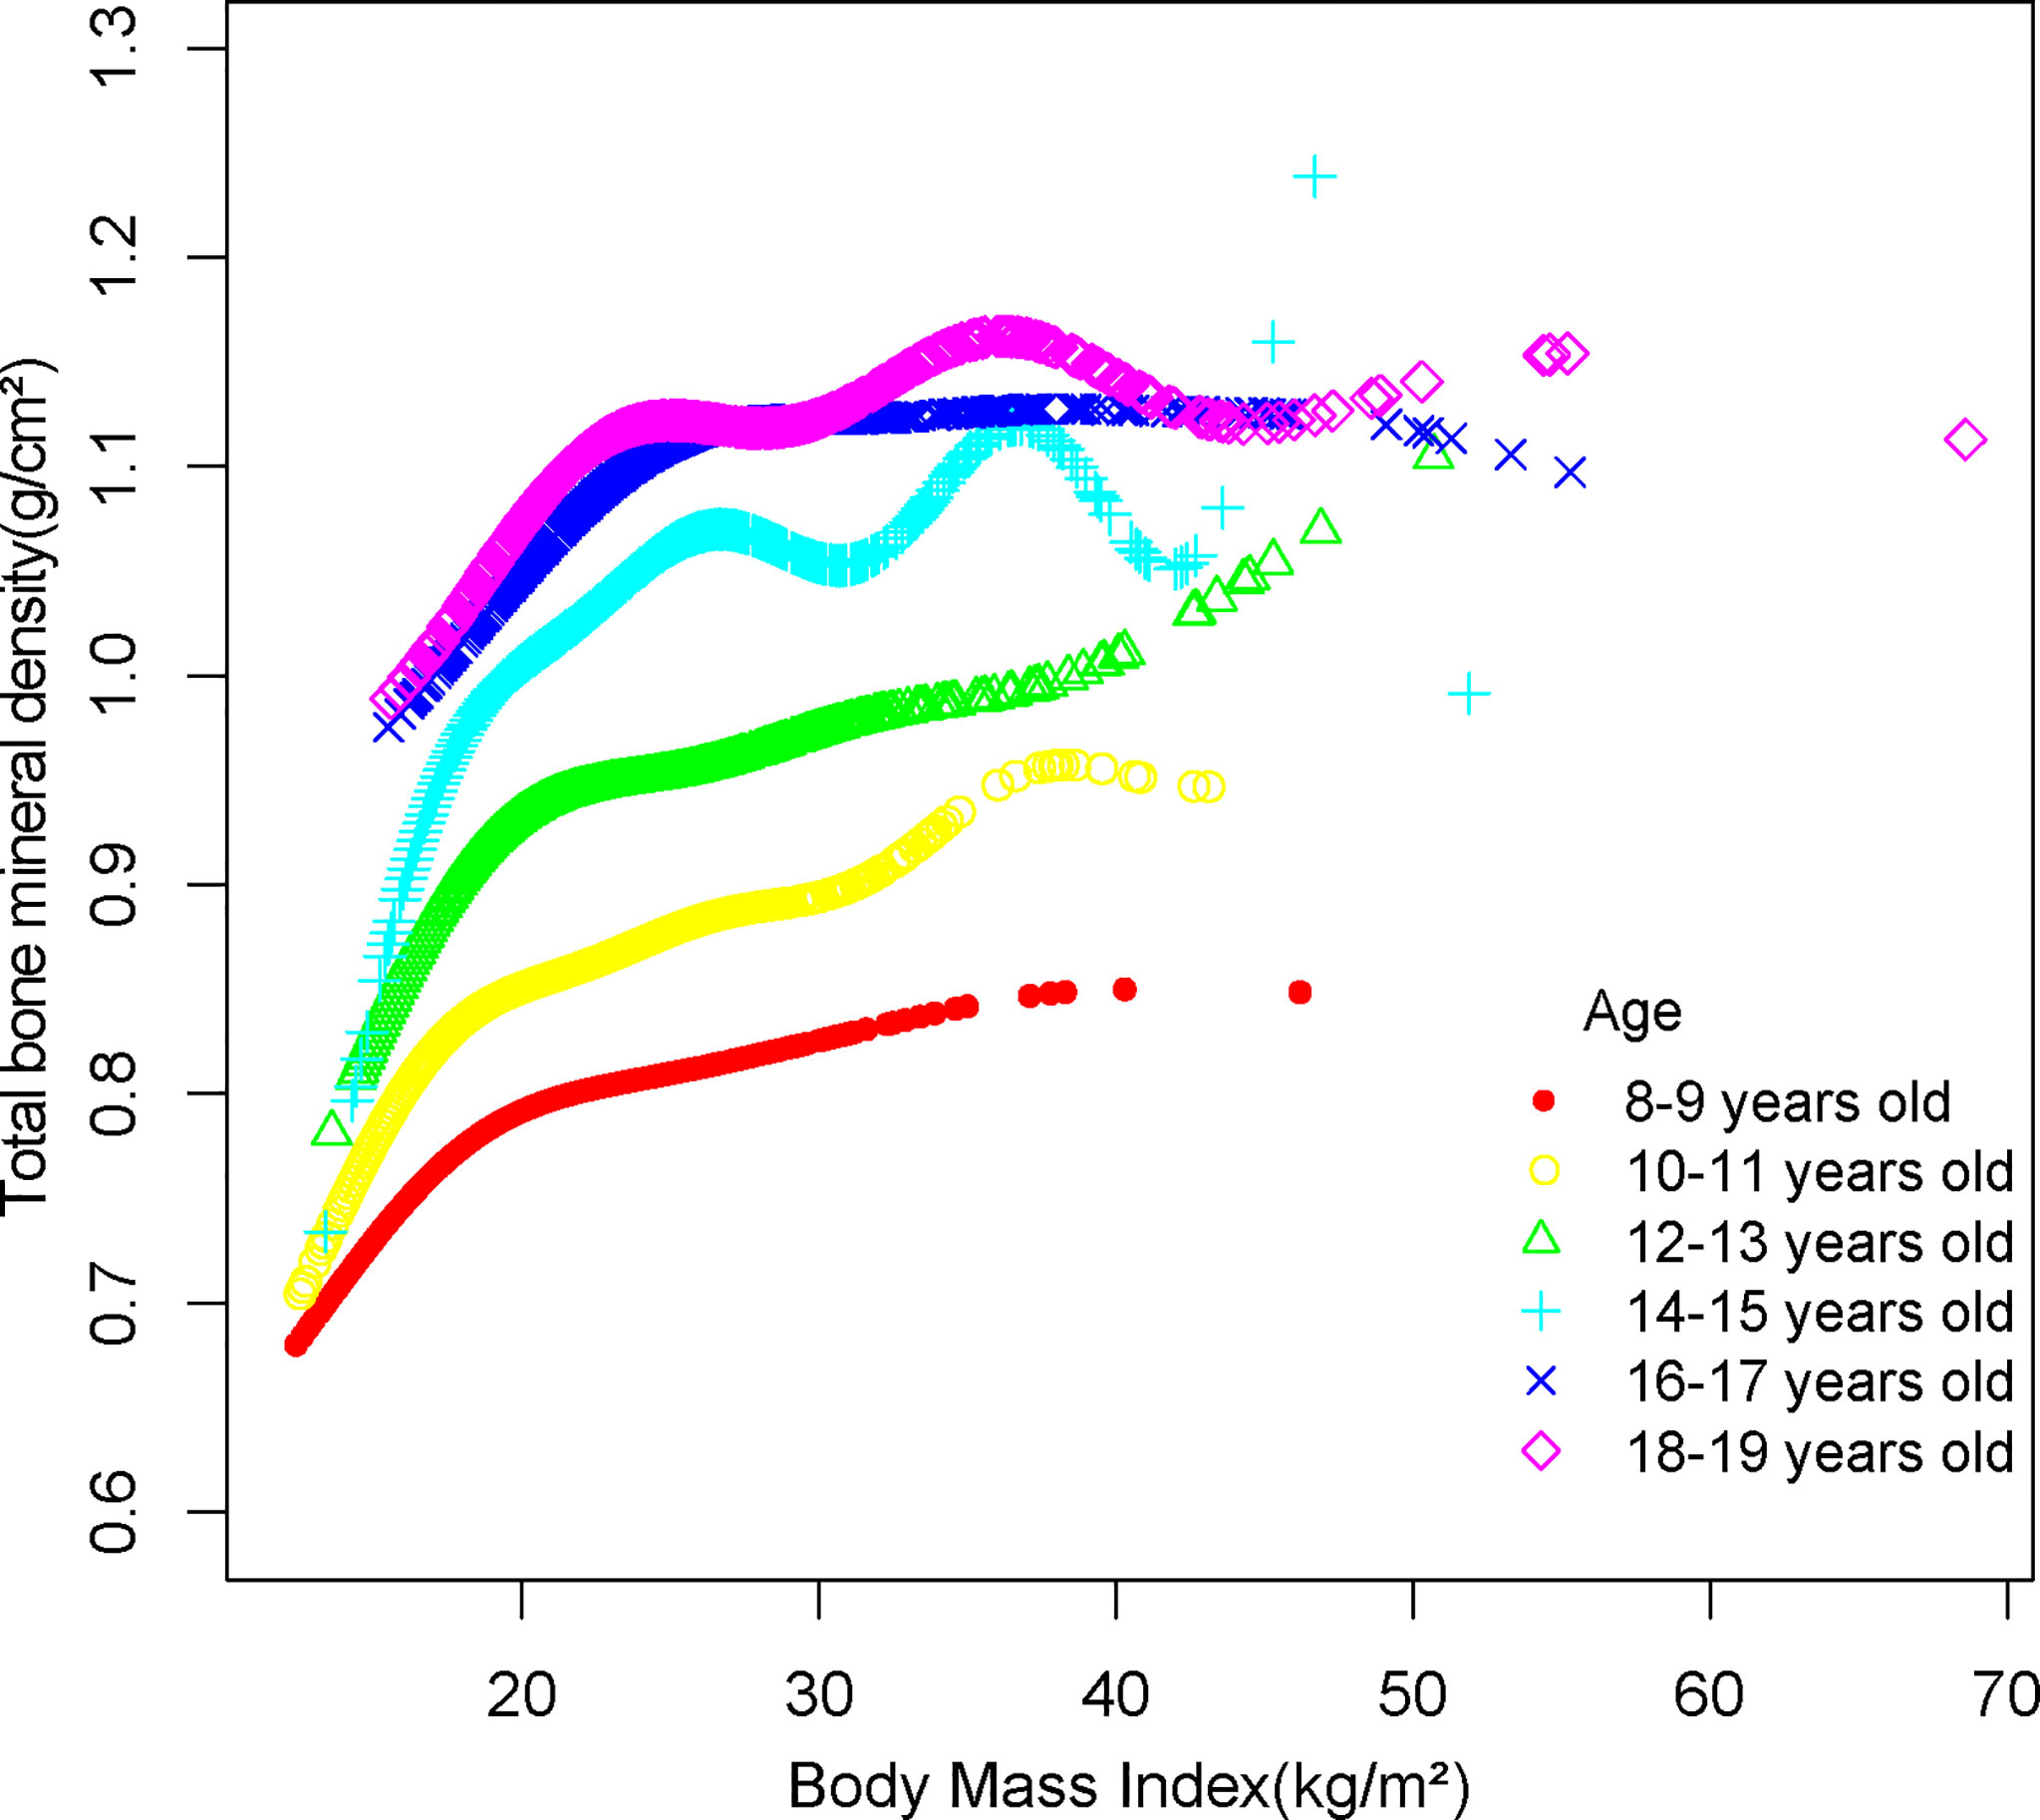
Figure 4 The association between BMI and total bone mineral density stratified by age.
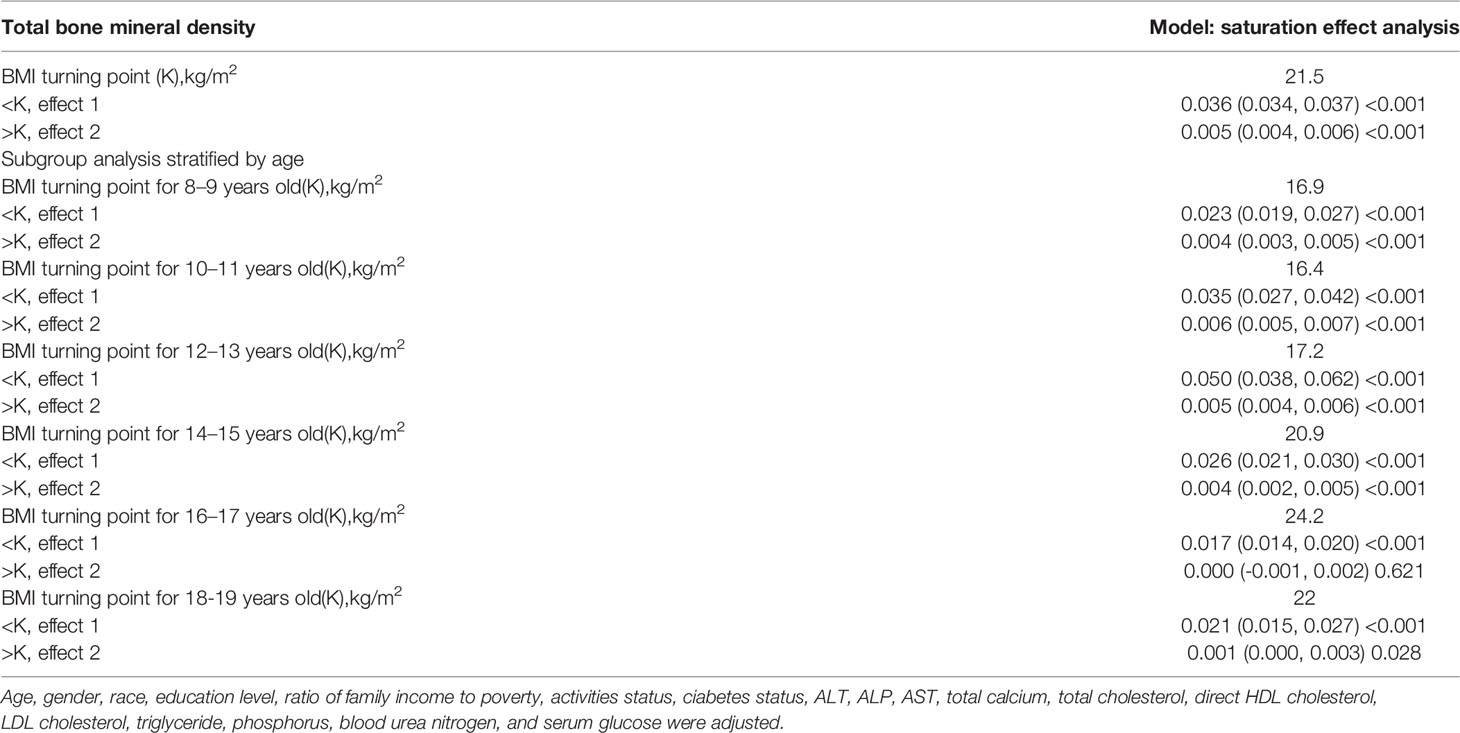
Table 3 Saturation effect analysis of BMI (kg/m2) on total BMD (g/cm2).
Discussion
Higher BMI was linked to higher total BMD in a weighted analysis involving US adolescents aged 8–19. We also performed a threshold effect analysis based on multiple regression analysis for different age groups of adolescents, and the results supported our hypothesis that the presence of a saturation value of BMI on total BMD among different age groups of adolescents could maintain a relatively healthy BMI while maintaining a higher BMD.
Several epidemiological studies in the past have demonstrated that BMD in adolescents is closely related to BMI (21–23). A cross-sectional study from Korea that included 1,063 adolescents found that BMI, lean body mass, and fat mass were all positively associated with BMD (24). Similarly, a study from Lebanon showed that obese and overweight boys had significantly higher total hip BMD and femoral neck BMD compared to boys with normal BMI (25). Our findings also demonstrate that higher BMI is associated with higher BMD in both boys and girls.
The mechanisms behind the obesity-BMD connection are unclear. One explanation is that people with obesity have a greater BMD because of the mechanical impact of their weight on their bones (26–28). Animal studies have revealed that osteocytes are particularly vulnerable to biomechanical stressors (29). They die from apoptosis in the absence of load (30), whereas when osteoblasts receive shear stress signals (31), they do not undergo apoptosis and their sclerostin secretion is inhibited (32). At the same time, osteoclast activity is slowed and osteoblast differentiation is boosted (33–35). In the population with obesity, Garnero et al. discovered a decrease in biochemical bone indicators, with a higher fall in bone resorption markers than bone production markers (36). This finding supports the theory that increased body weight causes orthostatic equilibrium. In addition to mechanical considerations, the increased BMD associated with obesity appears to be linked to estrogen activity. Estrogen has been shown to play a significant function in bone metabolism, promoting bone growth and inhibiting bone resorption (37, 38). The metabolism of estrogen and fat tissue are inextricably linked. In reality, adipose tissue is a major source of aromatase enzymes, which are needed for estrogen synthesis. Obese postmenopausal women had greater serum estrogen concentrations than non-obese women, and 17β-estradiol levels were higher in obese patients (39).
Although it is well proven that a higher BMI leads to a higher BMD, this does not mean that the risk of fracture is reduced (19). The “obesity paradox” is the name given to this phenomena (40). In children and adolescents, even being overweight has a positive effect on BMD, but the incidence of fractures is higher than in non-obese individuals (41). Preschool obesity was linked to an increased incidence of fracture in adolescents, according to a comprehensive study conducted by Lane et al. in Catalonia (42). This could be owing to excessive mechanical loading generated by extra adipose tissue (43). Whether from the perspective of reducing other systemic diseases caused by obesity or reducing the incidence of fractures in adolescents, we should find an appropriate BMI while striving for a higher BMD. Ma et al. found that, for Americans over 50 years of age, keeping the BMI at a slightly overweight value (about 26 kg/m2) may reduce other adverse effects while obtaining an optimal BMD (44). While in adolescents, BMI saturation values for BMD may change substantially with age, and our findings are the first to investigate BMI saturation values for BMD in US adolescents aged 8–19 years at different ages.
The mechanism of maintaining a BMI of saturation value and hence achieving optimal BMD is still unknown. Bone development trajectories and PBM are established early in life, which could explain why adult BMD does not rise after a time of restricted growth (45, 46). Another reason for BMI saturation effects is the presence of a separate bone–fat axis in vivo between adipose and bone tissues (47); supporting bone homeostasis and linked by numerous bioactive substances, bone and adipocytes are descended from the same stem cell parent and are competitive, according to existing research, with an increase in extra fat leading to bone loss (48). According to investigations in animal models caused by increased fat intake, BMD decreases as obesity increases in obese animals (49, 50). As a result, we hypothesized that maintaining a saturated BMI would retain enough BMD while reducing the risk of obesity-related diseases and comorbidities.
Our study has some limitations. First, this is a cross-sectional analysis; thus, temporality cannot be ascertained. Second, due to database limitations, we were unable to obtain data on participants taking calcium supplements, dietary intake of calcium, vitamin D, and lipid-lowering medications that may have an effect on BMD; therefore, our findings should be interpreted with caution. Finally, given the database limitations, we were unable to obtain a history of fractures in adolescent participants; therefore, we were unable to assess whether fracture rates were higher in adolescents with high BMI than in the general population. Despite these limitations, our study has several advantages. Because we used a nationally representative sample, our study is representative of a multi-ethnic and gender-diverse population of adolescents in the United States. In addition to this, because of the large sample size included in our study, this allowed us to divide adolescents aged 8–19 years into multiple age groups for subgroup analysis. To our knowledge, past studies have demonstrated the saturating effect of adult BMI on BMD, and the present study is the first to investigate the saturating effect of BMI on BMD in adolescents of different ages.
Conclusion
In this study, we used multiple linear regression models, smoothed curve fitting, and saturation effect analysis models to examine the relationship between BMI and BMD in US adolescents aged 8–19 years. We found not only a simple linear positive correlation between BMI and BMD but also a saturation value that persisted across gender and age subgroups in the analysis. This work suggests that keeping BMI at saturation values may provide benefits for adolescents to maintain optimal BMD and reduce other obesity-related diseases.
Data Availability Statement
Publicly available datasets were analyzed in this study. This data can be found here: www.cdc.gov/nchs/nhanes/.
Ethics Statement
The studies involving human participants were reviewed and approved by NCHS Ethics Review Board. Written informed consent to participate in this study was provided by the participants’ legal guardian/next of kin.
Author Contributions
YO and RX designed the research. YO, YQ, and XJH collected and analyzed the data. YO, CG, SX, CL, and NM drafted the manuscript. YC, XX, and RX revised the manuscript. All authors contributed to the article and approved the submitted version.
Funding
This study was funded by the Hengyang Education Bureau Vocational Education General Project (ZJZB2020093).
Conflict of Interest
The authors declare that the research was conducted in the absence of any commercial or financial relationships that could be construed as a potential conflict of interest.
Publisher’s Note
All claims expressed in this article are solely those of the authors and do not necessarily represent those of their affiliated organizations, or those of the publisher, the editors and the reviewers. Any product that may be evaluated in this article, or claim that may be made by its manufacturer, is not guaranteed or endorsed by the publisher.
Abbreviations
BMD, bone mineral density; BMI, Body Mass Index; NHANES, National Health and Nutrition Examination Survey; PBM, peak bone mass.
References
1. Ensrud K, Crandall C. Osteoporosis. Ann Internal Med (2017) 167(3):ITC17–32. doi: 10.7326/AITC201708010
2. Baxter-Jones A, Faulkner R, Forwood M, Mirwald R, Bailey D. Bone Mineral Accrual From 8 to 30 Years of Age: An Estimation of Peak Bone Mass. J Bone mineral Res (2011) 26(8):1729–39. doi: 10.1002/jbmr.412
3. Pan K, Zhang C, Yao X, Zhu Z. Association Between Dietary Calcium Intake and BMD in Children and Adolescents. Endocrine connections (2020) 9:194–20. doi: 10.1530/EC-19-0534
4. van der Sluis I, de Muinck Keizer-Schrama S. Osteoporosis in Childhood: Bone Density of Children in Health and Disease. J Pediatr Endocrinol Metab (2001) 14(7):817–32. doi: 10.1515/JPEM.2001.14.7.817
5. Goulding A, Jones I, Taylor R, Manning P, Williams S. More Broken Bones: A 4-Year Double Cohort Study of Young Girls With and Without Distal Forearm Fractures. J Bone mineral Res (2000) 15(10):2011–8. doi: 10.1359/jbmr.2000.15.10.2011
6. Rizzoli R, Bianchi M, Garabédian M, McKay H, Moreno L. Maximizing Bone Mineral Mass Gain During Growth for the Prevention of Fractures in the Adolescents and the Elderly. Bone (2010) 46(2):294–305. doi: 10.1016/j.bone.2009.10.005
7. Pan K, Yao X, Liu M, Zhu Z. Association of Serum Uric Acid Status With Bone Mineral Density in Adolescents Aged 12-19 Years. Front Med (2020) 7:255. doi: 10.3389/fmed.2020.00255
8. Xie R, Huang X, Liu Q, Liu M. Positive Association Between High-Density Lipoprotein Cholesterol and Bone Mineral Density in U.S. Adults: The NHANES 2011-2018. J Orthop Surg Res (2022) 17(1):92. doi: 10.1186/s13018-022-02986-w
9. Xie R, Huang X, Zhang Y, Liu Q, Liu M. High Low-Density Lipoprotein Cholesterol Levels are Associated With Osteoporosis Among Adults 20-59 Years of Age. Int J Gen Med (2022) 15:2261–70. doi: 10.2147/IJGM.S353531
10. Pan K, Tu R, Yao X, Zhu Z. Associations Between Serum Calcium, 25(OH)D Level and Bone Mineral Density in Adolescents. Adv Rheumatol (2021) 61(1):16. doi: 10.1186/s42358-021-00174-8
11. Xie R, Liu M. Relationship Between Non-Alcoholic Fatty Liver Disease and Degree of Hepatic Steatosis and Bone Mineral Density. Front Endocrinol (2022) 13. doi: 10.3389/fendo.2022.857110
12. Franceschi R, Radetti G, Soffiati M, Maines E. Forearm Fractures in Overweight-Obese Children and Adolescents: A Matter of Bone Density, Bone Geometry or Body Composition? Calcif Tissue Int (2022). doi: 10.1007/s00223-022-00971-3
13. Jaacks L, Vandevijvere S, Pan A, McGowan C, Wallace C, Imamura F, et al. The Obesity Transition: Stages of the Global Epidemic. Lancet Diabetes Endocrinol (2019) 7(3):231–40. doi: 10.1016/S2213-8587(19)30026-9
14. Rinonapoli G, Pace V, Ruggiero C, Ceccarini P, Bisaccia M, Meccariello L, et al. Obesity and Bone: A Complex Relationship. Int J Mol Sci (2021) 22(24):13662. doi: 10.3390/ijms222413662
15. Gkastaris K, Goulis D, Potoupnis M, Anastasilakis A, Kapetanos G. Obesity, Osteoporosis and Bone Metabolism. J Musculoskeletal Neuronal Interact (2020) 20(3):372–81.
16. Barrera G, Bunout D, Gattás V, de la Maza M, Leiva L, Hirsch S. A High Body Mass Index Protects Against Femoral Neck Osteoporosis in Healthy Elderly Subjects. Nutr (Burbank Los Angeles County Calif) (2004) 20(9):769–71. doi: 10.1016/j.nut.2004.05.014
17. Rohm T, Meier D, Olefsky J, Donath M. Inflammation in Obesity, Diabetes, and Related Disorders. Immunity (2022) 55(1):31–55. doi: 10.1016/j.immuni.2021.12.013
18. Seravalle G, Grassi G. Obesity and Hypertension. Pharmacol Res (2017) 122:1–7. doi: 10.1016/j.phrs.2017.05.013
19. Sadeghi O, Saneei P, Nasiri M, Larijani B, Esmaillzadeh A. Abdominal Obesity and Risk of Hip Fracture: A Systematic Review and Meta-Analysis of Prospective Studies. Adv Nutr (2017) 8(5):728–38. doi: 10.3945/an.117.015545
20. Curtin LR, Mohadjer LK, Dohrmann SM, Montaquila JM, Kruszan-Moran D, Mirel LB, et al. The National Health and Nutrition Examination Survey: Sample Design, 1999-2006. Vital Health Stat 2 (2012) 155):1–39.
21. Russell M, Mendes N, Miller KK, Rosen CJ, Lee H, Klibanski A, et al. Visceral Fat is a Negative Predictor of Bone Density Measures in Obese Adolescent Girls. J Clin Endocrinol Metab (2010) 95(3):1247–55. doi: 10.1210/jc.2009-1475
22. Gilsanz V, Chalfant J, Mo AO, Lee DC, Dorey FJ, Mittelman SD. Reciprocal Relations of Subcutaneous and Visceral Fat to Bone Structure and Strength. J Clin Endocrinol Metab (2009) 94(9):3387–93. doi: 10.1210/jc.2008-2422
23. Sayers A, Lawlor DA, Sattar N, Tobias JH. The Association Between Insulin Levels and Cortical Bone: Findings From a Cross-Sectional Analysis of pQCT Parameters in Adolescents. J Bone Miner Res (2012) 27(3):610–8. doi: 10.1002/jbmr.1467
24. Song K, Kwon A, Chae HW, Suh J, Choi HS, Choi Y, et al. Vitamin D Status Is Associated With Bone Mineral Density in Adolescents: Findings From the Korea National Health and Nutrition Examination Survey. Nutr Res (2021) 87:13–21. doi: 10.1016/j.nutres.2020.12.011
25. El Hage R. Geometric Indices of Hip Bone Strength in Obese, Overweight, and Normal-Weight Adolescent Boys. Osteoporos Int (2012) 23(5):1593–600. doi: 10.1007/s00198-011-1754-3
26. Etherington J, Harris PA, Nandra D, Hart DJ, Wolman RL, Doyle DV, et al. The Effect of Weight-Bearing Exercise on Bone Mineral Density: A Study of Female Ex-Elite Athletes and the General Population. J Bone Miner Res (1996) 11(9):1333–8. doi: 10.1002/jbmr.5650110918
27. Fang J, Gao J, Gong H, Zhang T, Zhang R, Zhan B. Multiscale Experimental Study on the Effects of Different Weight-Bearing Levels During Moderate Treadmill Exercise on Bone Quality in Growing Female Rats. BioMed Eng Online (2019) 18(1):33. doi: 10.1186/s12938-019-0654-1
28. Bisaccia M, Rollo G, Caraffa A, Gomez-Garrido D, Popkov D, Rinonapoli G, et al. The Bisaccia and Meccariello Technique in Pediatric Femoral Shaft Fractures With Intramedullary Titanium Nail Osteosynthesis Linked External-Fixator (IOLE): Validity and Reliability. Acta BioMed (2021) 92(4):e2021249. doi: 10.23750/abm.v92i4.10387
29. Klein-Nulend J, van der Plas A, Semeins CM, Ajubi NE, Frangos JA, Nijweide PJ, et al. Sensitivity of Osteocytes to Biomechanical Stress In Vitro. FASEB J (1995) 9(5):441–5. doi: 10.1096/fasebj.9.5.7896017
30. Aguirre JI, Plotkin LI, Stewart SA, Weinstein RS, Parfitt AM, Manolagas SC, et al. Osteocyte Apoptosis is Induced by Weightlessness in Mice and Precedes Osteoclast Recruitment and Bone Loss. J Bone Miner Res (2006) 21(4):605–15. doi: 10.1359/jbmr.060107
31. Gu G, Mulari M, Peng Z, Hentunen TA, Väänänen HK. Death of Osteocytes Turns Off the Inhibition of Osteoclasts and Triggers Local Bone Resorption. Biochem Biophys Res Commun (2005) 335(4):1095–101. doi: 10.1016/j.bbrc.2005.06.211
32. Armamento-Villareal R, Sadler C, Napoli N, Shah K, Chode S, Sinacore DR, et al. Weight Loss in Obese Older Adults Increases Serum Sclerostin and Impairs Hip Geometry But Both are Prevented by Exercise Training. J Bone Miner Res (2012) 27(5):1215–21. doi: 10.1002/jbmr.1560
33. Tan SD, de Vries TJ, Kuijpers-Jagtman AM, Semeins CM, Everts V, Klein-Nulend J. Osteocytes Subjected to Fluid Flow Inhibit Osteoclast Formation and Bone Resorption. Bone (2007) 41(5):745–51. doi: 10.1016/j.bone.2007.07.019
34. You L, Temiyasathit S, Lee P, Kim CH, Tummala P, Yao W, et al. Osteocytes as Mechanosensors in the Inhibition of Bone Resorption Due to Mechanical Loading. Bone (2008) 42(1):172–9. doi: 10.1016/j.bone.2007.09.047
35. Vezeridis PS, Semeins CM, Chen Q, Klein-Nulend J. Osteocytes Subjected to Pulsating Fluid Flow Regulate Osteoblast Proliferation and Differentiation. Biochem Biophys Res Commun (2006) 348(3):1082–8. doi: 10.1016/j.bbrc.2006.07.146
36. Garnero P, Sornay-Rendu E, Claustrat B, Delmas PD. Biochemical Markers of Bone Turnover, Endogenous Hormones and the Risk of Fractures in Postmenopausal Women: The OFELY Study. J Bone Miner Res (2000) 15(8):1526–36. doi: 10.1359/jbmr.2000.15.8.1526
37. Riggs BL. The Mechanisms of Estrogen Regulation of Bone Resorption. J Clin Invest (2000) 106(10):1203–4. doi: 10.1172/JCI11468
38. Cauley JA. Estrogen and Bone Health in Men and Women. Steroids (2015) 99(Pt A):11–5. doi: 10.1016/j.steroids.2014.12.010
39. Nelson L, Bulun S. Estrogen Production and Action. J Am Acad Dermatol (2001) 45:S116–124. doi: 10.1067/mjd.2001.117432
40. Fassio A, Idolazzi L, Rossini M, Gatti D, Adami G, Giollo A, et al. The Obesity Paradox and Osteoporosis. Eat Weight Disord (2018) 23(3):293–302. doi: 10.1007/s40519-018-0505-2
41. Farr JN, Dimitri P. The Impact of Fat and Obesity on Bone Microarchitecture and Strength in Children. Calcif Tissue Int (2017) 100(5):500–13. doi: 10.1007/s00223-016-0218-3
42. Lane JC, Butler KL, Poveda-Marina JL, Martinez-Laguna D, Reyes C, de Bont J, et al. Preschool Obesity Is Associated With an Increased Risk of Childhood Fracture: A Longitudinal Cohort Study of 466,997 Children and Up to 11 Years of Follow-Up in Catalonia, Spain. J Bone Miner Res (2020) 35(6):1022–30. doi: 10.1002/jbmr.3984
43. Goulding A, Jones IE, Taylor RW, Piggot JM, Taylor D. Dynamic and Static Tests of Balance and Postural Sway in Boys: Effects of Previous Wrist Bone Fractures and High Adiposity. Gait Posture (2003) 17(2):136–41. doi: 10.1016/S0966-6362(02)00161-3
44. Ma M, Feng Z, Liu X, Jia G, Geng B, Xia Y. The Saturation Effect of Body Mass Index on Bone Mineral Density for People Over 50 Years Old: A Cross-Sectional Study of the US Population. Front Nutr (2021) 8:763677. doi: 10.3389/fnut.2021.763677
45. Jones G, Dwyer T. Birth Weight, Birth Length, and Bone Density in Prepubertal Children: Evidence for an Association That may be Mediated by Genetic Factors. Calcif Tissue Int (2000) 67(4):304–8. doi: 10.1007/s002230001148
46. Weiler HA, Yuen CK, Seshia MM. Growth and Bone Mineralization of Young Adults Weighing Less Than 1500 G at Birth. Early Hum Dev (2002) 67(1-2):101–12. doi: 10.1016/S0378-3782(02)00003-8
47. Gómez-Ambrosi J, Rodríguez A, Catalán V, Frühbeck G. The Bone-Adipose Axis in Obesity and Weight Loss. Obes Surg (2008) 18(9):1134–43. doi: 10.1007/s11695-008-9548-1
48. Akune T, Ohba S, Kamekura S, Yamaguchi M, Chung UI, Kubota N, et al. PPARgamma Insufficiency Enhances Osteogenesis Through Osteoblast Formation From Bone Marrow Progenitors. J Clin Invest (2004) 113(6):846–55. doi: 10.1172/JCI200419900
49. Halade GV, Rahman MM, Williams PJ, Fernandes G. High Fat Diet-Induced Animal Model of Age-Associated Obesity and Osteoporosis. J Nutr Biochem (2010) 21(12):1162–9. doi: 10.1016/j.jnutbio.2009.10.002
Keywords: bone mineral density, osteoporosis, NHANES, obese, body mass index, adolescent
Citation: Ouyang Y, Quan Y, Guo C, Xie S, Liu C, Huang X, Huang X, Chen Y, Xiao X, Ma N and Xie R (2022) Saturation Effect of Body Mass Index on Bone Mineral Density in Adolescents of Different Ages: A Population-Based Study. Front. Endocrinol. 13:922903. doi: 10.3389/fendo.2022.922903
Received: 18 April 2022; Accepted: 31 May 2022;
Published: 05 July 2022.
Edited by:
Federico Baronio, AOU S.Orsola-Malpighi (IRCCS), ItalyReviewed by:
Ya Zhang, Youjiang Medical University for Nationalities, ChinaLeonor Gallardo, University of Castilla La Mancha, Spain
Copyright © 2022 Ouyang, Quan, Guo, Xie, Liu, Huang, Huang, Chen, Xiao, Ma and Xie. This is an open-access article distributed under the terms of the Creative Commons Attribution License (CC BY). The use, distribution or reproduction in other forums is permitted, provided the original author(s) and the copyright owner(s) are credited and that the original publication in this journal is cited, in accordance with accepted academic practice. No use, distribution or reproduction is permitted which does not comply with these terms.
*Correspondence: Ruijie Xie, b3J0aG94cmpAMTYzLmNvbQ==