 Guo-Tian Ruan1,2,3‡
 Hai-Lun Xie1,2,3‡
 He-Yang Zhang1,2,3‡
 Chen-An Liu1,2,3
 Yi-Zhong Ge1,2,3
 Qi Zhang1,2,3
 Zi-Wen Wang1,2,3
 Xi Zhang1,2,3
 Meng Tang1,2,3
 Meng-Meng Song1,2,3
 Xiao-Wei Zhang1,2,3
 Ming Yang1,2,3
 Yong-Bing Chen1,2,3
 Kai-Ying Yu1,2,3
 Li Deng1,2,3
 Yi-Zhen Gong4,5
 Wen Hu6
 Kun-Hua Wang7,8*
 Ming-Hua Cong9*
 Han-Ping Shi1,2,3*†
- 1Department of Gastrointestinal Surgery, Beijing Shijitan Hospital, Capital Medical University, Beijing, China
- 2Department of Clinical Nutrition, Beijing Shijitan Hospital, Capital Medical University, Beijing, China
- 3Key Laboratory of Cancer Food for Special Medical Purposes (FSMP) for State Market Regulation, Beijing, China
- 4Department of Gastrointestinal Surgery, Guangxi Medical University Cancer Hospital, Nanning, China
- 5Guangxi Clinical Research Center for Colorectal Cancer, Nanning, China
- 6Clinical Nutrition Department, Sichuan University West China Hospital, Chengdu, China
- 7Yunnan University, Kunming, China
- 8General Surgery Clinical Medical Center of Yunnan Province, Kunming, China
- 9Comprehensive Oncology Department, National Cancer Center/Cancer Hospital, Chinese Academy of Medical Sciences and Peking Union Medical College, Beijing, China
Background: Systemic inflammation and insulin resistance (IR) are closely related in patients with cancer. However, there is no relevant indicator that combines inflammation and IR to predict patient prognosis. Therefore, this study aimed to develop and validate a novel inflammation- and IR-related marker in patients with cancer.
Methods: The total cohort of this study included 5221 patients with cancer, and the training and validation cohorts were randomized in a 7:3 ratio. C-reactive protein (CRP) and fasting triglyceride glucose (TyG) were used to reflect patients’ inflammation and IR status, respectively. The CRP-TyG index (CTI) was composed of CRP and TyG. The concordance (C)-index, receiver operator characteristic (ROC) curve, and calibration curve reflected the prognostic predictive power of CTI. Univariate and multivariate survival analyses predicted the prognostic value of CTI in patients with cancer.
Results: The C-indices of CTI in patients with cancer were 0.636, 0.617, and 0.631 in the total, training, and validation cohorts, respectively. The 1-, 3-, and 5-year ROC and calibration curves showed that CTI had a good predictive ability of survival in patients with cancer. Meanwhile, patients with high CTI had a worse prognosis compared to patients with low CTI (total cohort: hazard ratio [HR] = 1.46, 95% confidence interval [95% CI] = 1.33–1.59; training cohort: HR = 1.36, 95% CI = 1.22–1.52; validation cohort: HR = 1.73, 95% CI = 1.47–2.04].
Conclusion: The CTI is a useful prognostic indicator of poor prognosis and a promising tool for treatment strategy decision-making in patients with cancer.
Introduction
The American Cancer Society’s assessment of cancer incidence data in the United States shows that there will be 1,918,030 new cancer cases and 609,360 cancer deaths in 2022 (1). China’s population accounts for one-fifth of the world’s population. With the rapid socioeconomic development and population aging, China, similar to many other developing countries, is facing unprecedented challenges in cancer prevention and control (2). Due to its large population, the current cancer burden in China significantly affects the global scale of cancer (3).
Inflammation and insulin resistance (IR) play important roles in cancer (4). Cancer is an inflammatory disease, and systemic inflammation is a hallmark of patients with cancer (5). Inflammation is involved in the occurrence and progression of cancer, and systemic inflammatory state is considered to be the seventh hallmark of cancer formation through host-tumor interactions (6, 7). The inflammatory state is the main driving force behind the metabolic alterations in patients with cancer (8). The origin of inflammation is multifaceted: on the one hand, tumor cells may release cytokines and other inflammatory mediators; on the other hand, activated immune cells release cytokines and chemokines (9). The production of acute-phase proteins, such as C-reactive protein (CRP) and fibrinogen, is considered an accurate measure of systemic inflammation and pro-inflammatory cytokine activity (10). Elevated CRP levels demonstrate a systemic inflammatory response (8). A previous study showed that interleukin-6 (IL-6) inhibits hepatic albumin production in patients with pancreatic cancer and is positively correlated with serum CRP levels (11). CRP is a strong prognostic indicator of tumor progression, survival, and symptom burden in multiple cancers (12).
Insulin, an anabolic hormone, coordinates the oxidation or storage of glucose in the body. Insulin sensitivity is coordinated by the uptake of glucose by insulin-sensitive cells in muscle, fat, and the liver and the removal of glucose from the circulation when glucose is elevated (13). IR is generally defined as impaired tissue glucose uptake and inhibition of hepatic glucose production (14). IR is a key component of metabolic syndrome, morbidity and mortality are increased in IR patients, mainly due to cardiovascular disease and type 2 diabetes (T2D) (15, 16). In addition, many epidemiological studies have consistently shown that patients with IR are associated with an increased risk of cancers (including that of the breast, liver, colorectum, and pancreas) (17). IR in patients with cancer is characterized by increased hepatic glucose production and gluconeogenesis, and different from T2D, normal fasting glucose is associated with high, normal, or low levels of insulin (13). This may be due to the redistribution of glucose within tumor cells to supply energy requirements (18). The increased glucose demand of cancer cells can lead to hypoglycemia, leading to increases in compensatory hormonal signaling, growth hormone, epinephrine, or glucagon. For instance, activation of IR can stimulate the PI3K/Akt/mTOR pathway and the MAP/ERK kinase pathway, ultimately leading to cell proliferation and migration and inhibiting apoptosis (19). In addition, tumor by-products may lead to IR. Tumor by-products in patients with lung cancer, including corticotropin and corticotropin-releasing factor, may contribute to abnormal glucose metabolism (20). Chronic IR is found in malignant tumors and presumed to contribute to cancer cachexia due to chronic exposure to proinflammatory cytokines, tumor necrosis factor (TNF)-α, IL-6, and insulin growth factor-binding protein, leading to IR (21, 22). A study by Xia et al. has reported that inflammatory responses play an important role in the development of IR through the adaptive immune system (23). In a study of moderate weight loss in 10 men with non-small cell lung cancer, IR was associated with 26% of protein anabolism, which was associated with CRP, but not with weight loss (14).
Currently, the logarithmic product of fasting triglyceride and glucose levels (labeled as the TyG index) is considered a simple measure of IR and has been reported in many tumor-related studies (24–26). Because of the close association between inflammation and IR, their interaction might help predict mortality in patients with cancer. However, to the best of our knowledge, there is no prognostic indicator related to inflammation and IR to predict the survival of patients with cancer. Hence, this study aimed to develop and validate a new inflammatory IR indicator (composed of CRP and TyG) to predict the survival of patients with cancer.
Materials and Methods
Study Population
This was a prospective, cross-sectional, multicenter cohort study-”INSCOC” (Investigation on Nutrition Status and its Clinical Outcome of Common Cancers) (27), which collected the clinical information from patients with cancer in China between 2013 and 2021. The INSCOC cohort prospectively collected data on nutrition and clinical outcomes in patients with cancer, and the cohort was followed up for 8 years. Inclusion criteria for this cohort included: 1. 18 years and older; 2. Pathologically diagnosed with cancer; 3. Clear consciousness and no communication difficulties. There are no strict exclusion criteria. A total of 22783 patients with cancer were initially included, and after deletion of missing data [age (n=12), height (n=1795), albumin (n=35), globulin (n=151), C-reactive protein (n =13583), glucose (n=111), cholesterol(n=1749), neutrocyte(n=83), lymphocyte (n=8), and platelet (n=35)], we obtained 5221 patients with cancer with complete clinical information. A total of 2149 events occurred during the 8-year follow-up of 5221 cancer patients. Finally, a 7:3 randomization of 5221 patients resulted in a training cohort (3657) and a validation cohort (1564) (Figure S1).
This study was conducted in accordance with the Declaration of Helsinki and was ethically approved by the ethics committees of the various research centers. Moreover, patients provided informed consent for inclusion in this study.
Clinical and Laboratory Evaluations
The data collected in this study mainly included demographic characteristics (age, sex, body mass index [BMI]), lifestyle habits (smoking, yes/no; alcohol consumption, yes/no), comorbidities (hypertension, yes/no; diabetes, yes/no; coronary heart disease, yes/no), tumor-related information (surgery, yes/no; radiotherapy, yes/no; chemotherapy, yes/no; tumor-node-metastasis (TNM) stage), Karnofsky Performance Status (KPS), nutritional information (Scored Patient-Generated Subjective Global Assessment [PGSGA]; nutritional intervention, yes/no), body measurements (triceps skin fold thickness [TSF]), and laboratory tests (total cholesterol [TC], blood glucose, CRP).
All questionnaires, body measurements, information collection, and laboratory sample collection were completed within 48 h of patient admission. Patient questionnaires were obtained by experienced physicians or nurses. BMI was calculated from the ratio of body weight (kg) to height squared (m2). The patient’s weight was measured when the patient was wearing a light hospital gown, and the height was obtained when the patient was wearing socks. Medical records were centrally reviewed by two study oncologists to confirm the the cancer diagnosis and staged the cancer based on the 8th edition of the American Joint Committee on Cancer staging manual. Fasting blood samples were taken from all participants at the start of the study. The calculation formula of the IR index TyG is as follows: Ln (TC [mg/dl] × FBG [mg/dl])/2. The inflammation-IR index constructed in this study was defined as C-reactive protein- triglyceride glucose index (CTI), and the calculation formula was 0.412* Ln (CRP) + TyG.
Outcome Assessment
The primary endpoint of this study was overall survival (OS) in patients with cancer. OS was defined as the time from the patient’s initial diagnosis of cancer to the patient’s death or last follow-up. All patient follow-up information was obtained by dedicated and experienced follow-up department personnel. The patient’s follow-up information was obtained through the patient’s outpatient follow-up record information and patient readmission record, or by telephone consultation.
Statistical Analyses
Patients were randomized into the training and validation cohorts in a 7:3 ratio by R software. At baseline, continuous variables are presented as mean ± standard deviation(SD)or median ± interquartile range, whereas categorical variables are presented as percentages (%). Comparisons between the two groups were performed using Student’s t-test for continuous data (If the data met the normal distribution after using the Shapiro-Wilk test, if not, used the Wilcoxon test.) and the χ2 test for categorical data. Statistical correlations between variables were calculated using Pearson correlation coefficients, when the correlation coefficients were greater than 3 or less than -3 and satisfied P<0.05, it was considered a significant correlation. The optimal cut-off value for CTI was calculated using the maximum selected rank statistic, which was 18.67 (Figure S2). For time-event analyses, survival estimates were calculated using the Kaplan–Meier method and compared between groups using the log-rank test. Cox proportional hazards models were used to estimate hazard ratios (HRs) and 95% confidence interval (95% CI) for cancer death. All Cox proportional hazards models were tested for Proportional hazards after Schoenfeld’s test. Moreover, the prognostic performance of CTI was analyzed in the training and validation cohorts. In the multivariate survival analysis, we used different adjusted models, namely, model 0 (unadjusted), model 1 (adjusted for age, sex, BMI,and TNM stage), model 2 (adjusted for age, sex, TNM stage, BMI, tumor types, KPS, surgery, chemotherapy, radiotherapy, smoking, alcohol consumption, nutritional intervention, hypertension, coronary heart disease, and diabetes), and model 3 (adjusted for age, sex, TNM stage, BMI, tumor types, KPS, surgery, chemotherapy, radiotherapy, smoking, alcohol consumption, nutritional intervention, hypertension, coronary heart disease, diabetes, and TSF). All analyses were performed with R software version 4.0.3 using the software packages “timeROC, version 0.4” “rms, version 6.2-0” “survminer, version 0.4.9” “caret, version 6.0-9.0” and “survival, 3.2-11” and a two-sided P value <0.05 was considered statistically significant. P-values for interactions were generated using the interaction term in a Cox multivariate model.
Results
Baseline Characteristics
Clinicopathological characteristics of patients in the total, training, and validation cohorts are presented in Table 1. In the total, training, and validation cohorts, the mean ages of the patients were 59.41 ± 11.15, 59.38 ± 11.18, and 59.49 ± 11.07 years, respectively. Moreover, 3061 (58.6%), 2148 (58.7%), and 913 (58.4%) participants were male in the total, training, and validation cohorts, respectively. In the total, training, and validation cohorts, grouped according to the level of CTI, compared with patients with low CTI, patients with cancer with high CTI were older, comprised more male patients, and had lower KPS and higher PGSGA score (all P < 0.05) (Table 2).
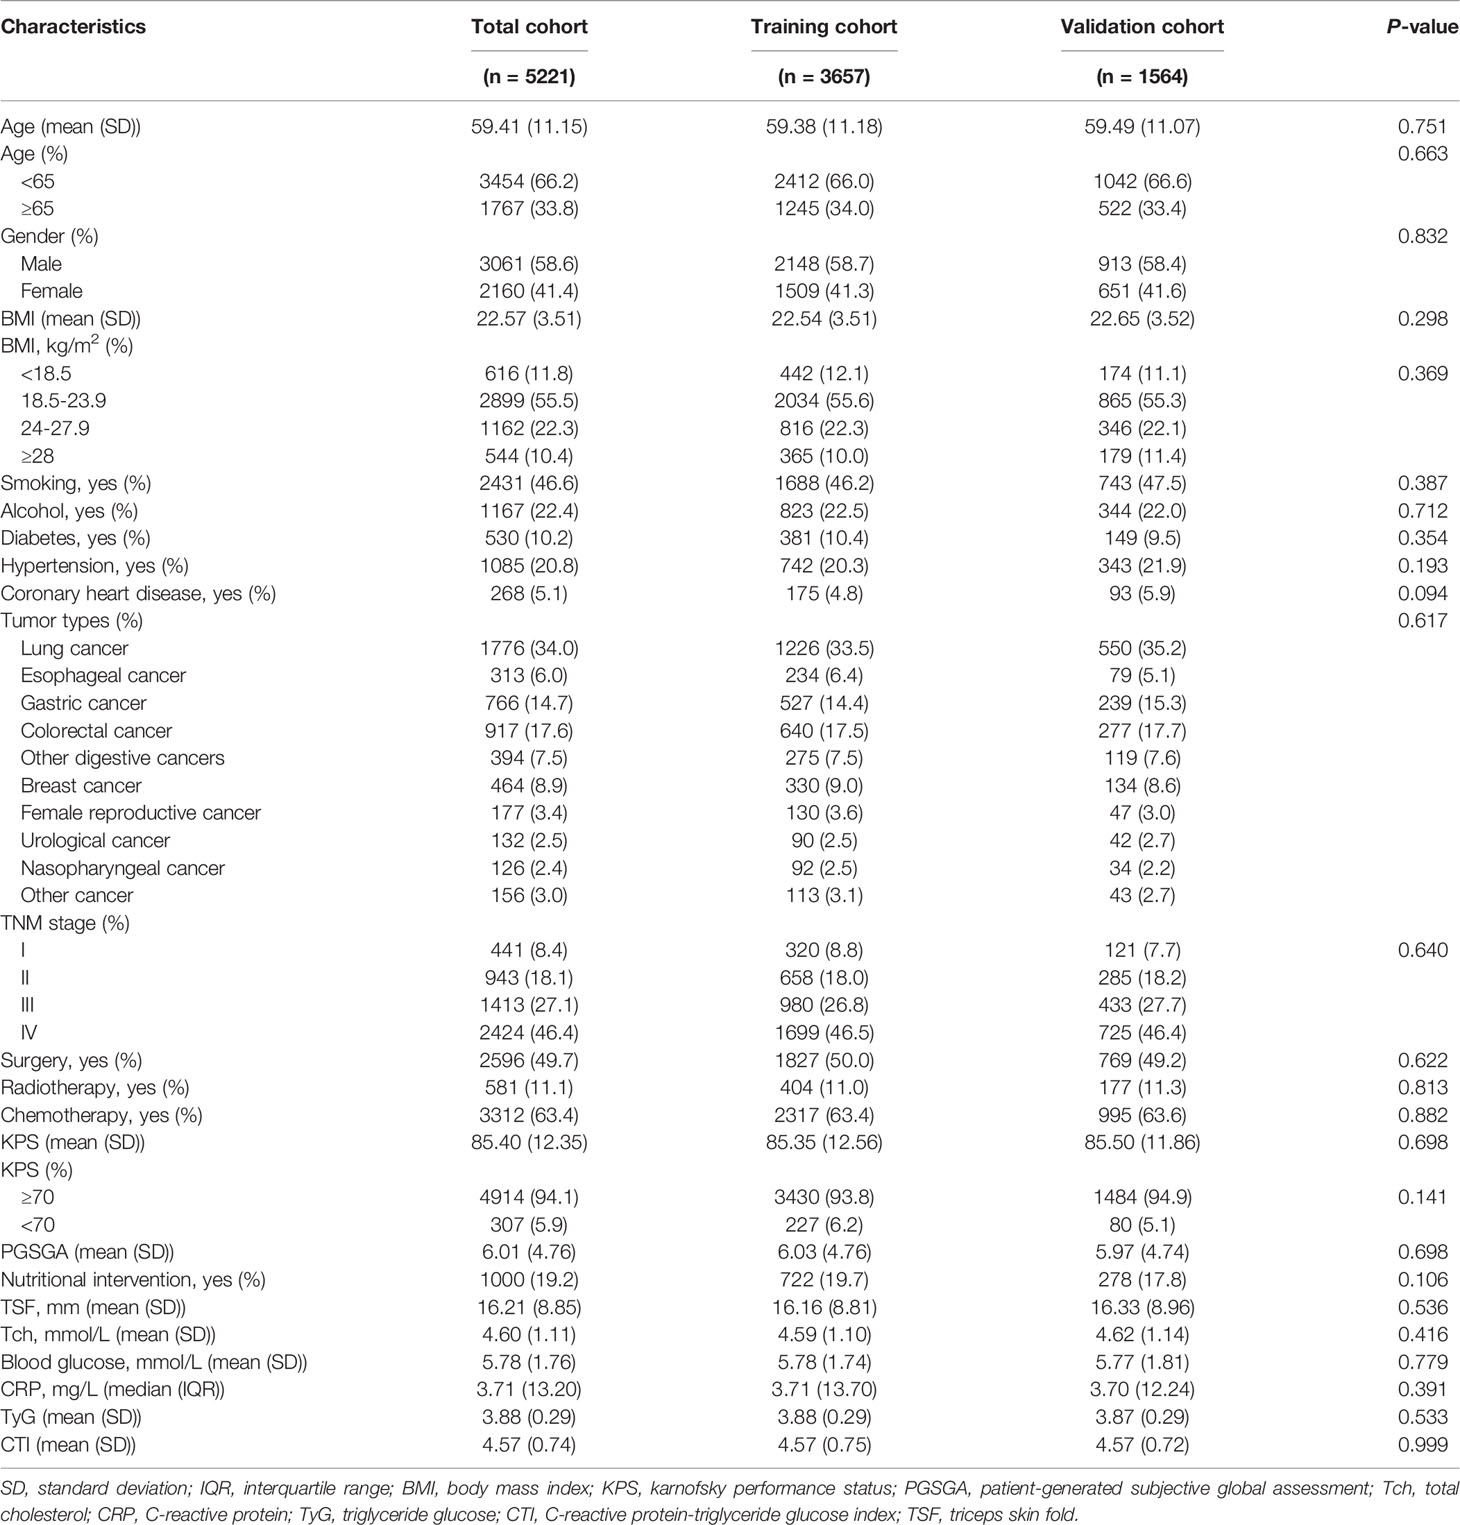
Table 1 Baseline characteristics of the study population.
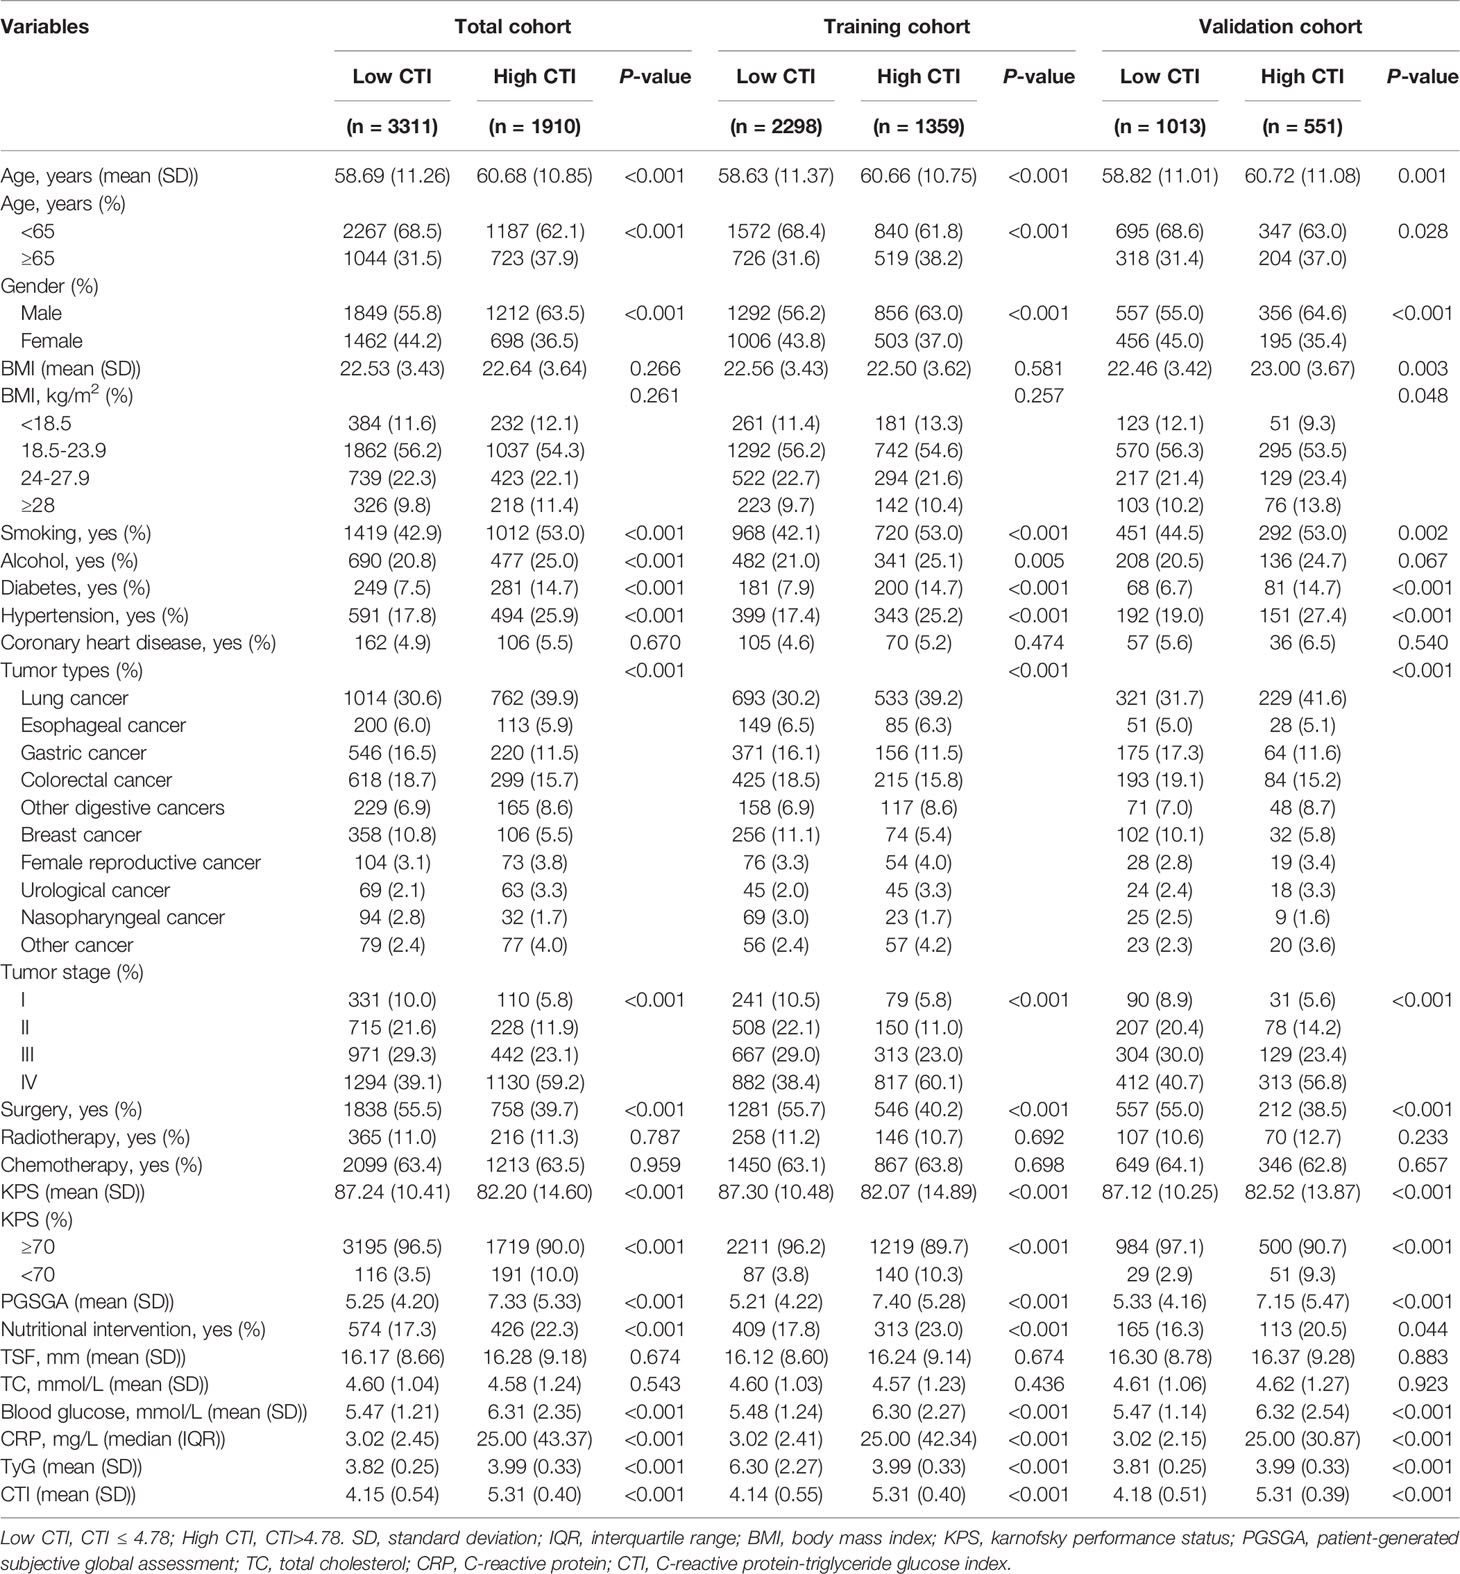
Table 2 Baseline characteristics stratified by CTI.
Correlation Analysis and Distribution of CTI
We performed a correlation analysis between CTI and different prognostic parameters, and the results showed that CTI was significantly positively correlated with CRP (correlation coefficient = 0.627, P < 0.001) and TyG (correlation coefficient = 0.360, P < 0.001), whereas CTI and glucose (correlation coefficient = 0.269, P < 0.001), TNM stage (correlation coefficient = 0.214, P < 0.001), KPS (correlation coefficient = –0.192, P < 0.001) and PGSGA (correlation coefficient = 0.205, P < 0.001) showed a significantly weak correlation. Similarly, the results were relatively consistent in different age and sex groups (Figures S3, S4).
The distribution of CTI in different subgroups showed an upward trend in CTI with TNM stage progression and BMI increase. Interestingly, in different age and sex groups, the CTI levels of male patients or elderly patients (≥65years) were compared with those of female patients or younger patients (<65 years), respectively. (Figure 1). Furthermore, we also analyzed the distribution of CTI in different age groups (As a categorical variable and a continuous variable), and the results showed that the value of CTI increased with age (Figure S5).
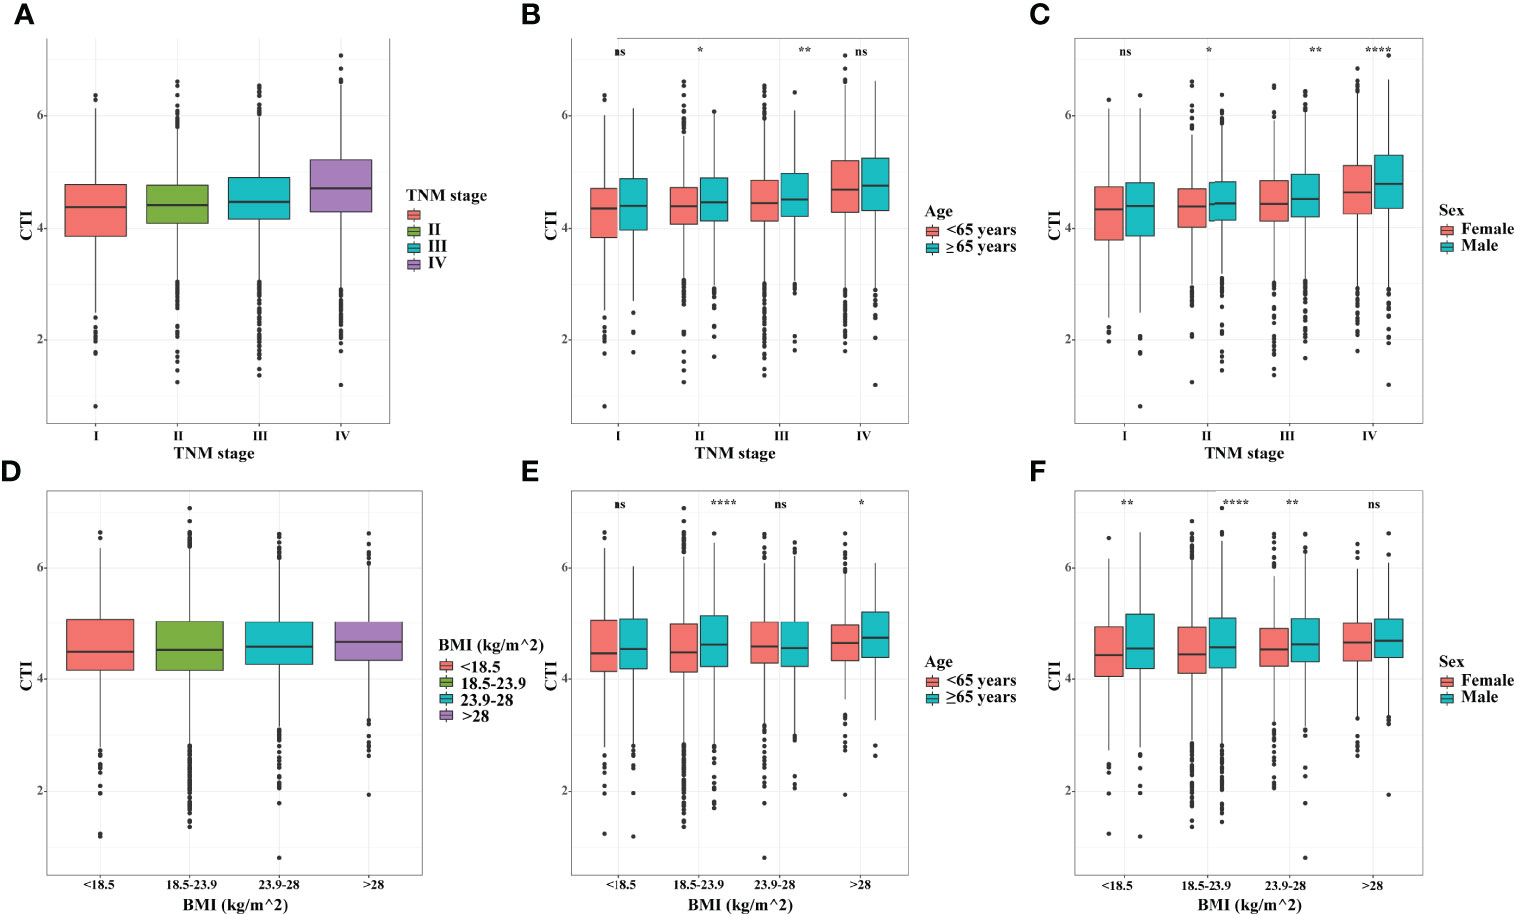
Figure 1 The distribution of CTI in different groups. (A) CTI in TNM stage groups; (B) CTI in TNM stage groups stratified by age; (C) CTI in TNM stage groups stratified by sex; (D) CTI in BMI groups; (E) CTI in BMI groups stratified by age; (F) CTI in BMI groups stratified by sex. CTI, C-reactive protein-triglyceride glucose index; BMI, body mass index. *, P<0.05; **, P<0.01; ****,P<0.0001; ns, not significant.
The distribution curves of CTI in different tumor type subgroups showed good agreement among different tumor type subgroups (except breast cancer and nasopharyngeal cancer) (Figure S6).
Prognostic Effect of CTI in Patients With Cancer
The concordance (C)-indices of CTI in patients with cancer were 0.636 (0.624–0.624), 0.617 (0.602–0.633), and 0.631 (0.608–0.655) in the total, training, and validation cohorts, respectively. We performed survival prediction on the prognosis of CTI in patients with cancer, and the results showed that CTI at 1-year (total cohort, 0.651; training cohort, 0.648; validation cohort, 0.657), 3-year (total cohort, 0.663; training cohort, 0.657; validation cohort, 0.676), and 5-year (total cohort, 0.668; training cohort, 0.664; validation cohort, 0.681) ROCs showed good survival predictors in patients with cancer (Figure 2). Meanwhile, in the total, training, and validation cohorts, the 1-, 3-, and 5-year calibration curve results showed that CTI had good survival prediction consistency for patients with cancer (Figure 3).
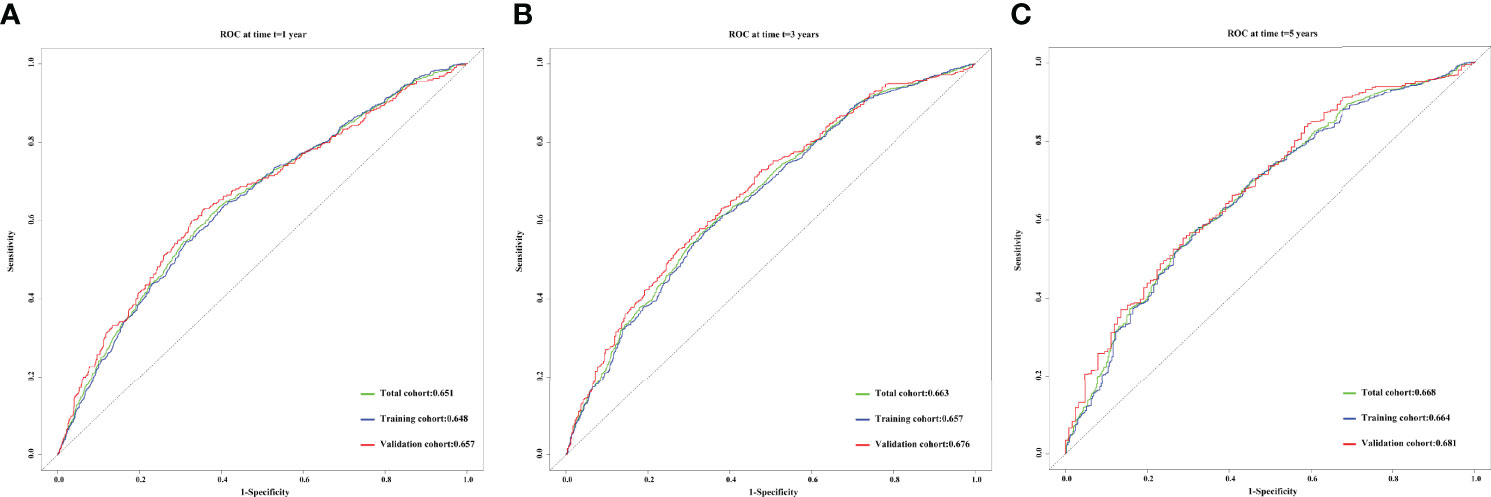
Figure 2 The 1-, 3-, and 5-year prognostic ROC curves of CTI in the different cohorts of patients with cancer. (A) 1- year prognostic ROC curve; (B) 3- year prognostic ROC curve; (C) 5- year prognostic ROC curve. Green line, total cohort; Blue line, training cohort; Red line, validation cohort. CTI, C-reactive protein-triglyceride glucose index; ROC, receiver operating characteristic.
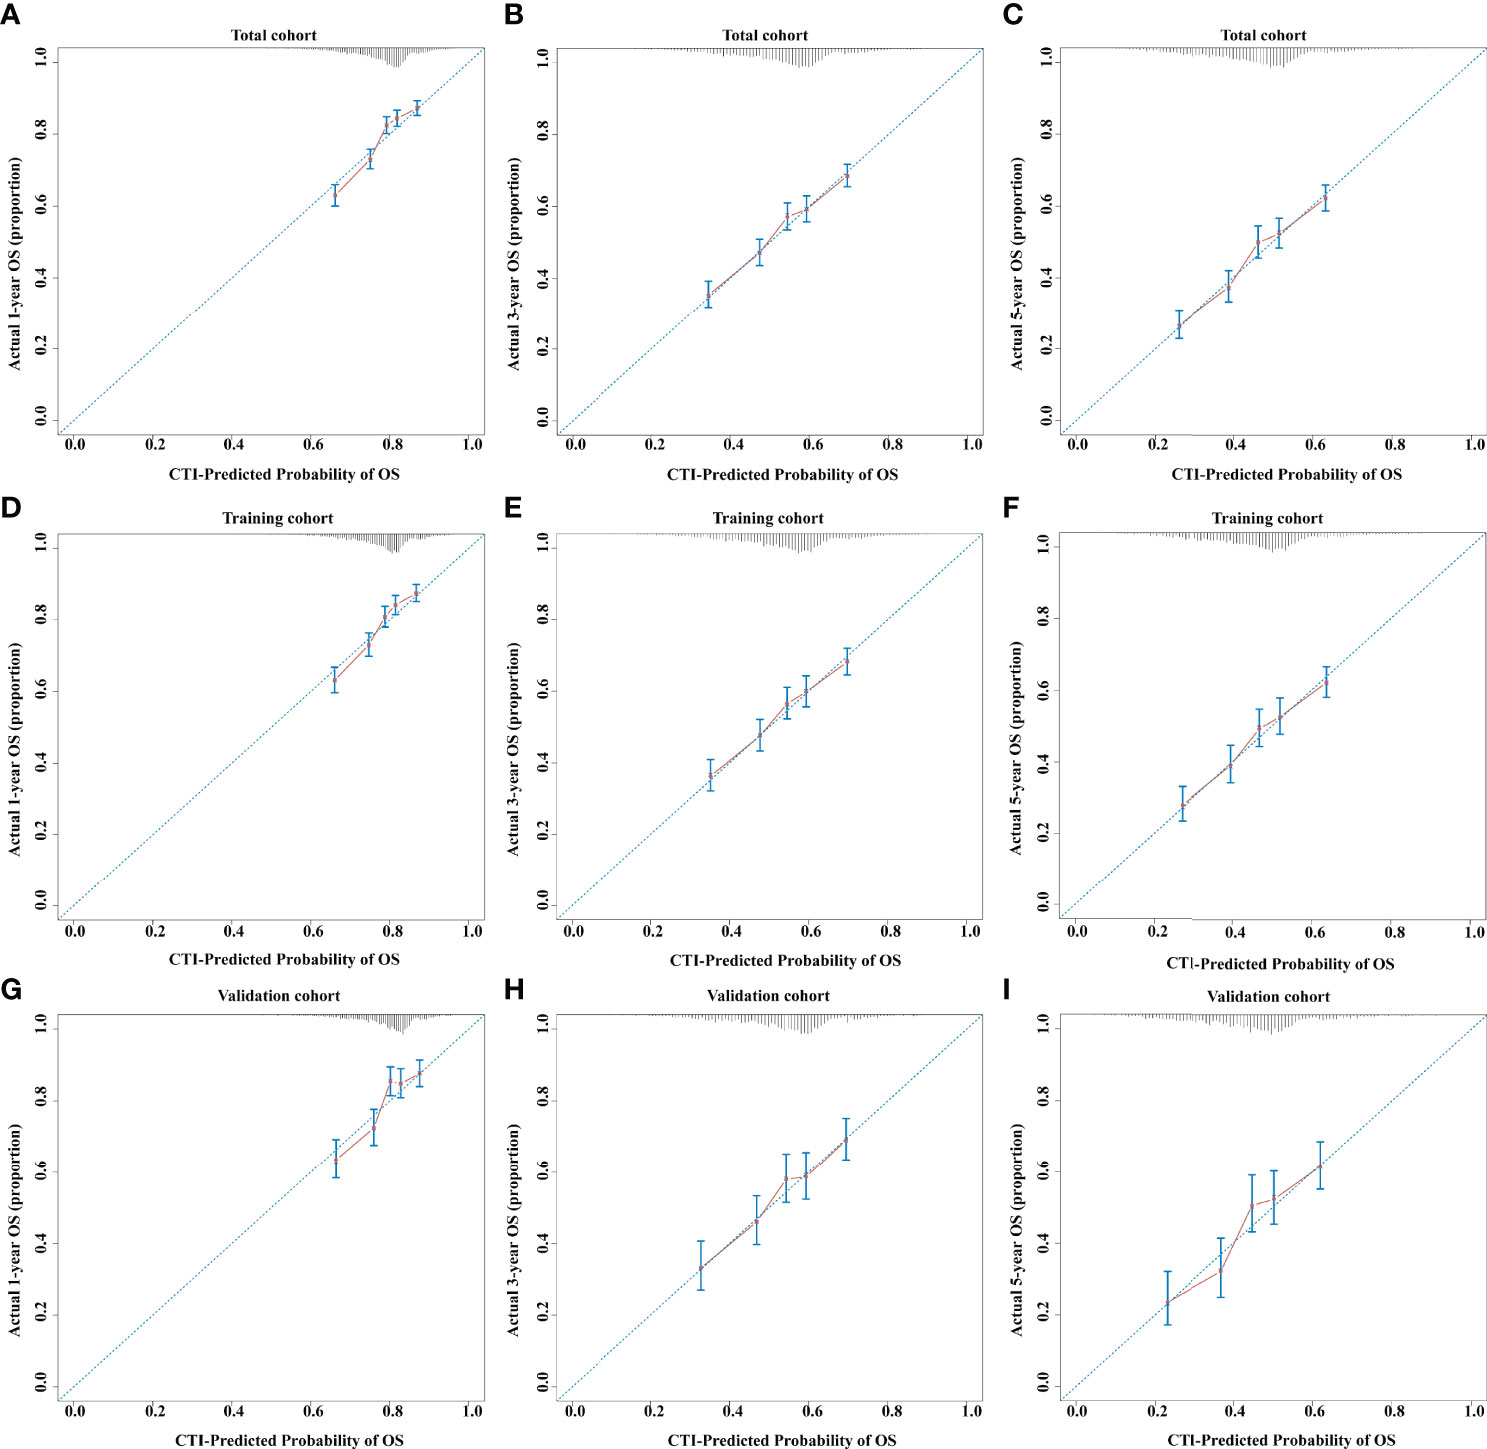
Figure 3 The 1-, 3-, and 5-year calibration curves of CTI in the different cohorts of patients with cancer. (A–C) 1-, 3-, and 5-year calibration curves of CTI in total cohort. (D–F) 1-, 3-, and 5-year calibration curves of CTI in training cohort. (G–) 1-, 3-, and 5-year calibration curves of CTI in validation cohort. CTI, C-reactive protein-triglyceride glucose index.
In the total cohort, the survival curve of CTI showed that patients with high CTI predicted a worse prognosis (P < 0.0001) (Figure 4A). The restricted cubic spline of CTI in the survival of patients with cancer showed tha the risk of death in patients with cancer increased with increasing CTI (Adjusted for model 3) (Figure S7). The multivariate survival showed that each SD increased in CTI was associated with a 22% increase in the risk of death (adjusted for model 3: P < 0.001, HR=1.22, 95% CI = 1.17-1.28). Compared with patients with low CTI, the prognosis of patients with high CTI was worse (adjusted for model 3: P < 0.001, HR = 1.46, 95% CI = 1.33–1.59). Similarly, we divided CTI into four groups, and compared with patients in the Q1 group, patients in the Q3 (adjusted for model 3: P < 0.001, HR = 1.36, 95% CI = 1.20–1.55), and Q4 (adjusted for model 3: P < 0.001, HR = 1.72, 95% CI = 1.51–1.95) groups had worse OS in patients with cancer (Table 3). We performed a sensitivity analysis of the total cohort, and the results remained consistent (Table S1).
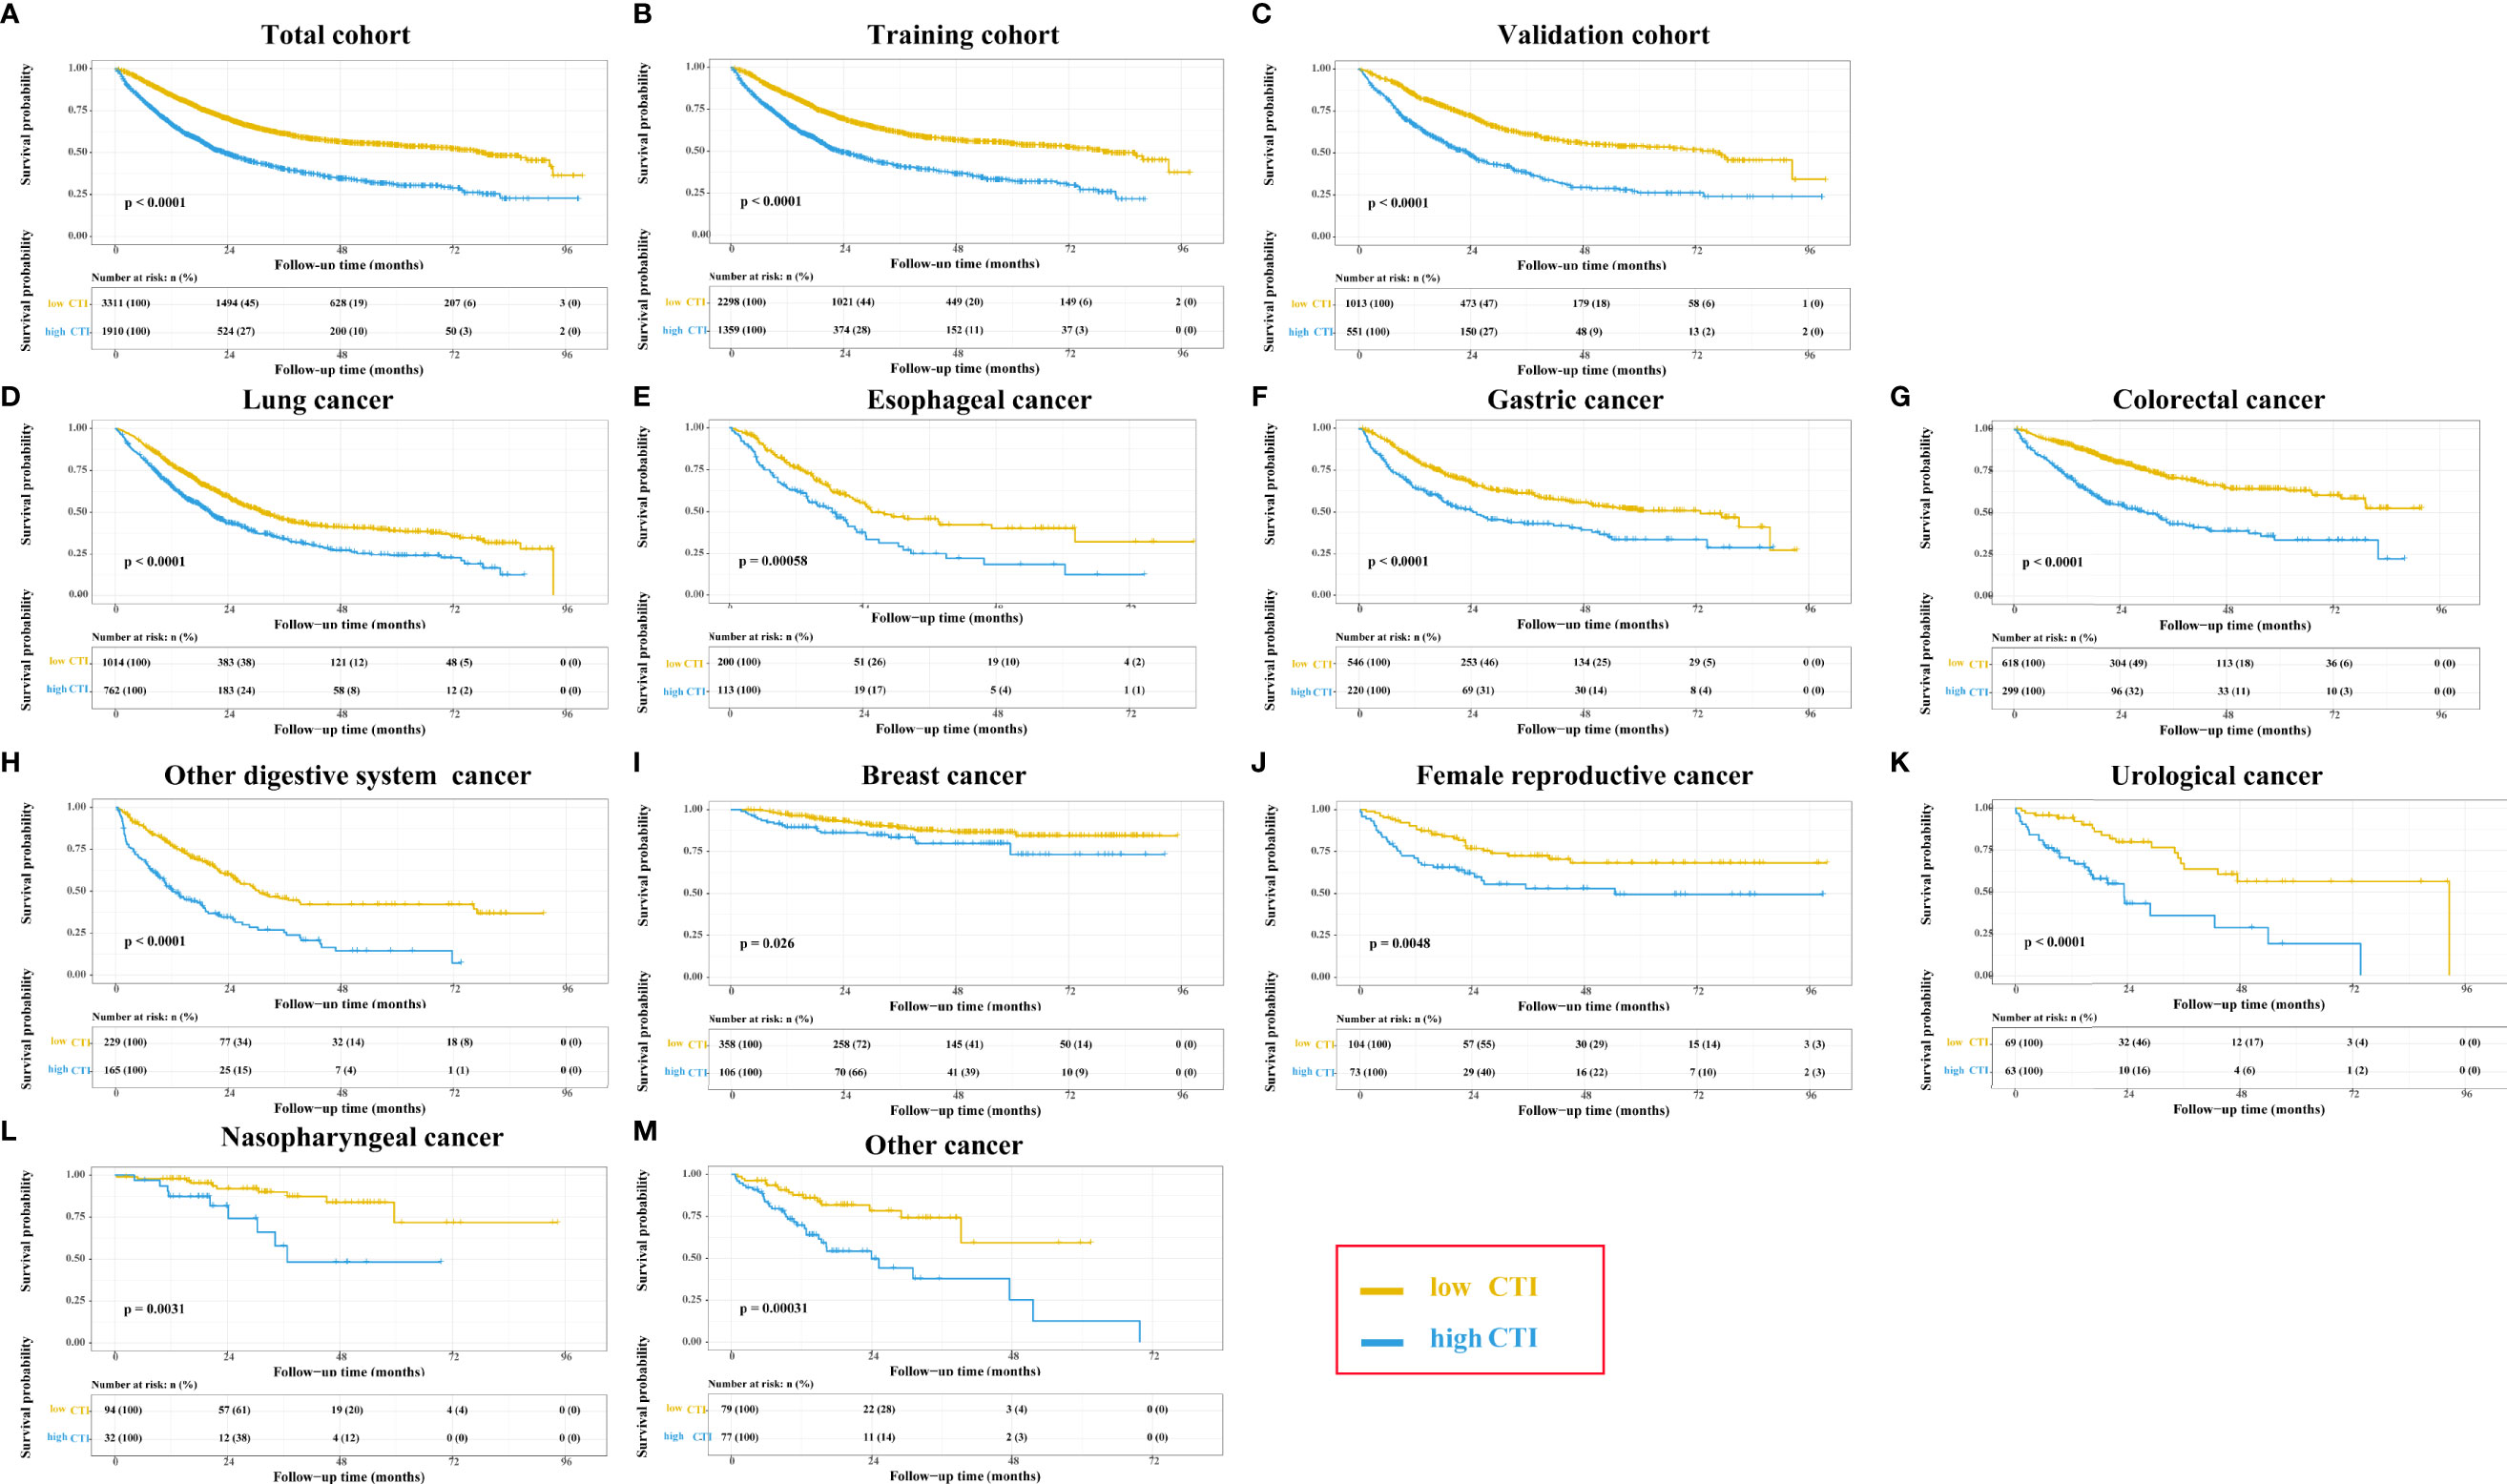
Figure 4 The Kaplan-Meier survival curves of CTI in the different cohorts of patients with cancer. (A) Total cohort; (B) Training cohort; (C) Validation cohort; (D–M) Different tumor types based on total cohort: (D)Lung cancer; (E) Esophageal cancer; (F) Gastric cancer; (G) Colorectal cancer; (H) Other digsestive cancer; (I) Breast cancer; (J) Female reproductive cancer; (K) Urological cancer; (L) Nasopharyngeal cancer; (M) Other cancer; CTI, C-reactive protein-triglyceride glucose index.
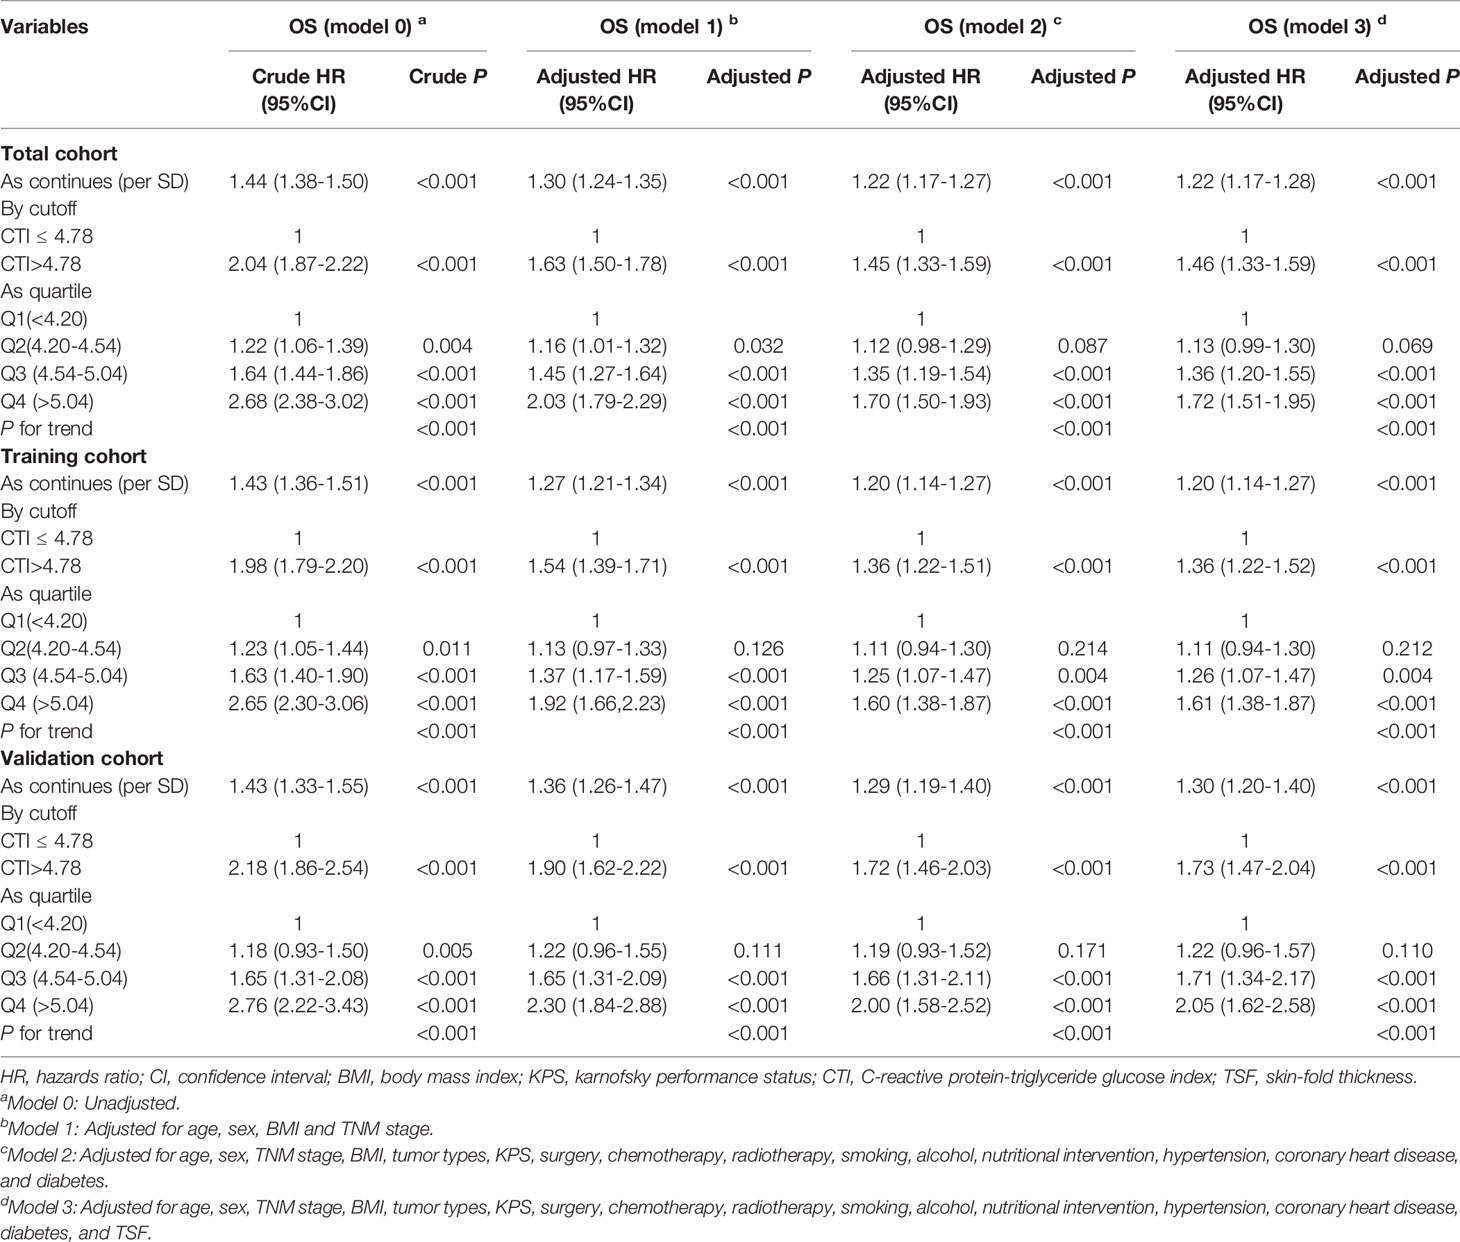
Table 3 Univariate and multivariate analysis of CTI in total, training, and validation cohort.
In the training cohort, the survival curve of CTI showed that patients with high CTI predicted a worse prognosis (P < 0.0001) (Figure 4B). The multivariate survival showed that each SD increased in CTI was associated with a 20% increase in the risk of death (adjusted for model 3: P < 0.001, HR=1.20, 95% CI = 1.14–1.27). Compared with patients with low CTI, the prognosis of patients with high CTI was worse (adjusted for model 3: P < 0.001, HR = 1.36, 95% CI = 1.22–1.52). Similarly, we divided CTI into four groups, and compared with patients in the Q1 group, patients in the Q3 (adjusted for model 3: P < 0.001, HR = 1.26, 95% CI = 1.07–1.47) and Q4 (adjusted for model 3: P < 0.001, HR = 1.61, 95% CI = 1.38–1.87) groups had worse OS in patients with cancer (Table 3).
In the validation cohort, the survival curve of CTI showed that patients with high CTI predicted a worse prognosis (P < 0.0001) (Figure 4C). The multivariate survival showed that each SD increased in CTI was associated with an 30% increase in the risk of death (adjusted for model 3: P < 0.001, HR=1.30, 95% CI = 1.20–1.40). Compared with patients with low CTI, the prognosis of patients with high CTI was worse (adjusted for model 3: P < 0.001, HR = 1.73, 95% CI = 1.47–2.04). Similarly, we divided CTI into four groups, and compared with patients in the Q1 group, patients in the Q3 (adjusted for model 3: P < 0.001, HR = 1.71, 95% CI = 1.34–2.17), and Q4 (adjusted for model 3: P < 0.001, HR = 2.05, 95% CI = 1.62–2.58) groups had worse OS in patients with cancer (Table 3).
Survival Analysis of Different Tumor Types
In the total cohort, patients with cancer in that of lung, esophageal, gastric, colorectal, other digestive system, breast, female reproductive, urological, nasopharyngeal, and other cancers showed that patients with high CTI had significantly worse prognosis than those with low CTI (all P < 0.05) (Figure 4D–M). In the training cohort, patients with high CTI in all cancer types, except for breast cancer, showed significantly poorer survival differences (all P < 0.05) (Figure S8). In the validation cohort, patients with high CTI in all cancer types, except for breast cancer and other cancer, showed significantly poorer survival differences (all P < 0.05) (Figure S9).
Subgroup Analysis
Subgroup analysis showed that CT had a significant interaction with TNM stage (P interaction = 0.030) radiotherapy (P interaction = 0.013), and surgery (P interaction < 0.001). However, no significant interaction was observed for CTI among age, sex, BMI, chemotherapy, radiotherapy, and KPS (Figure 5).
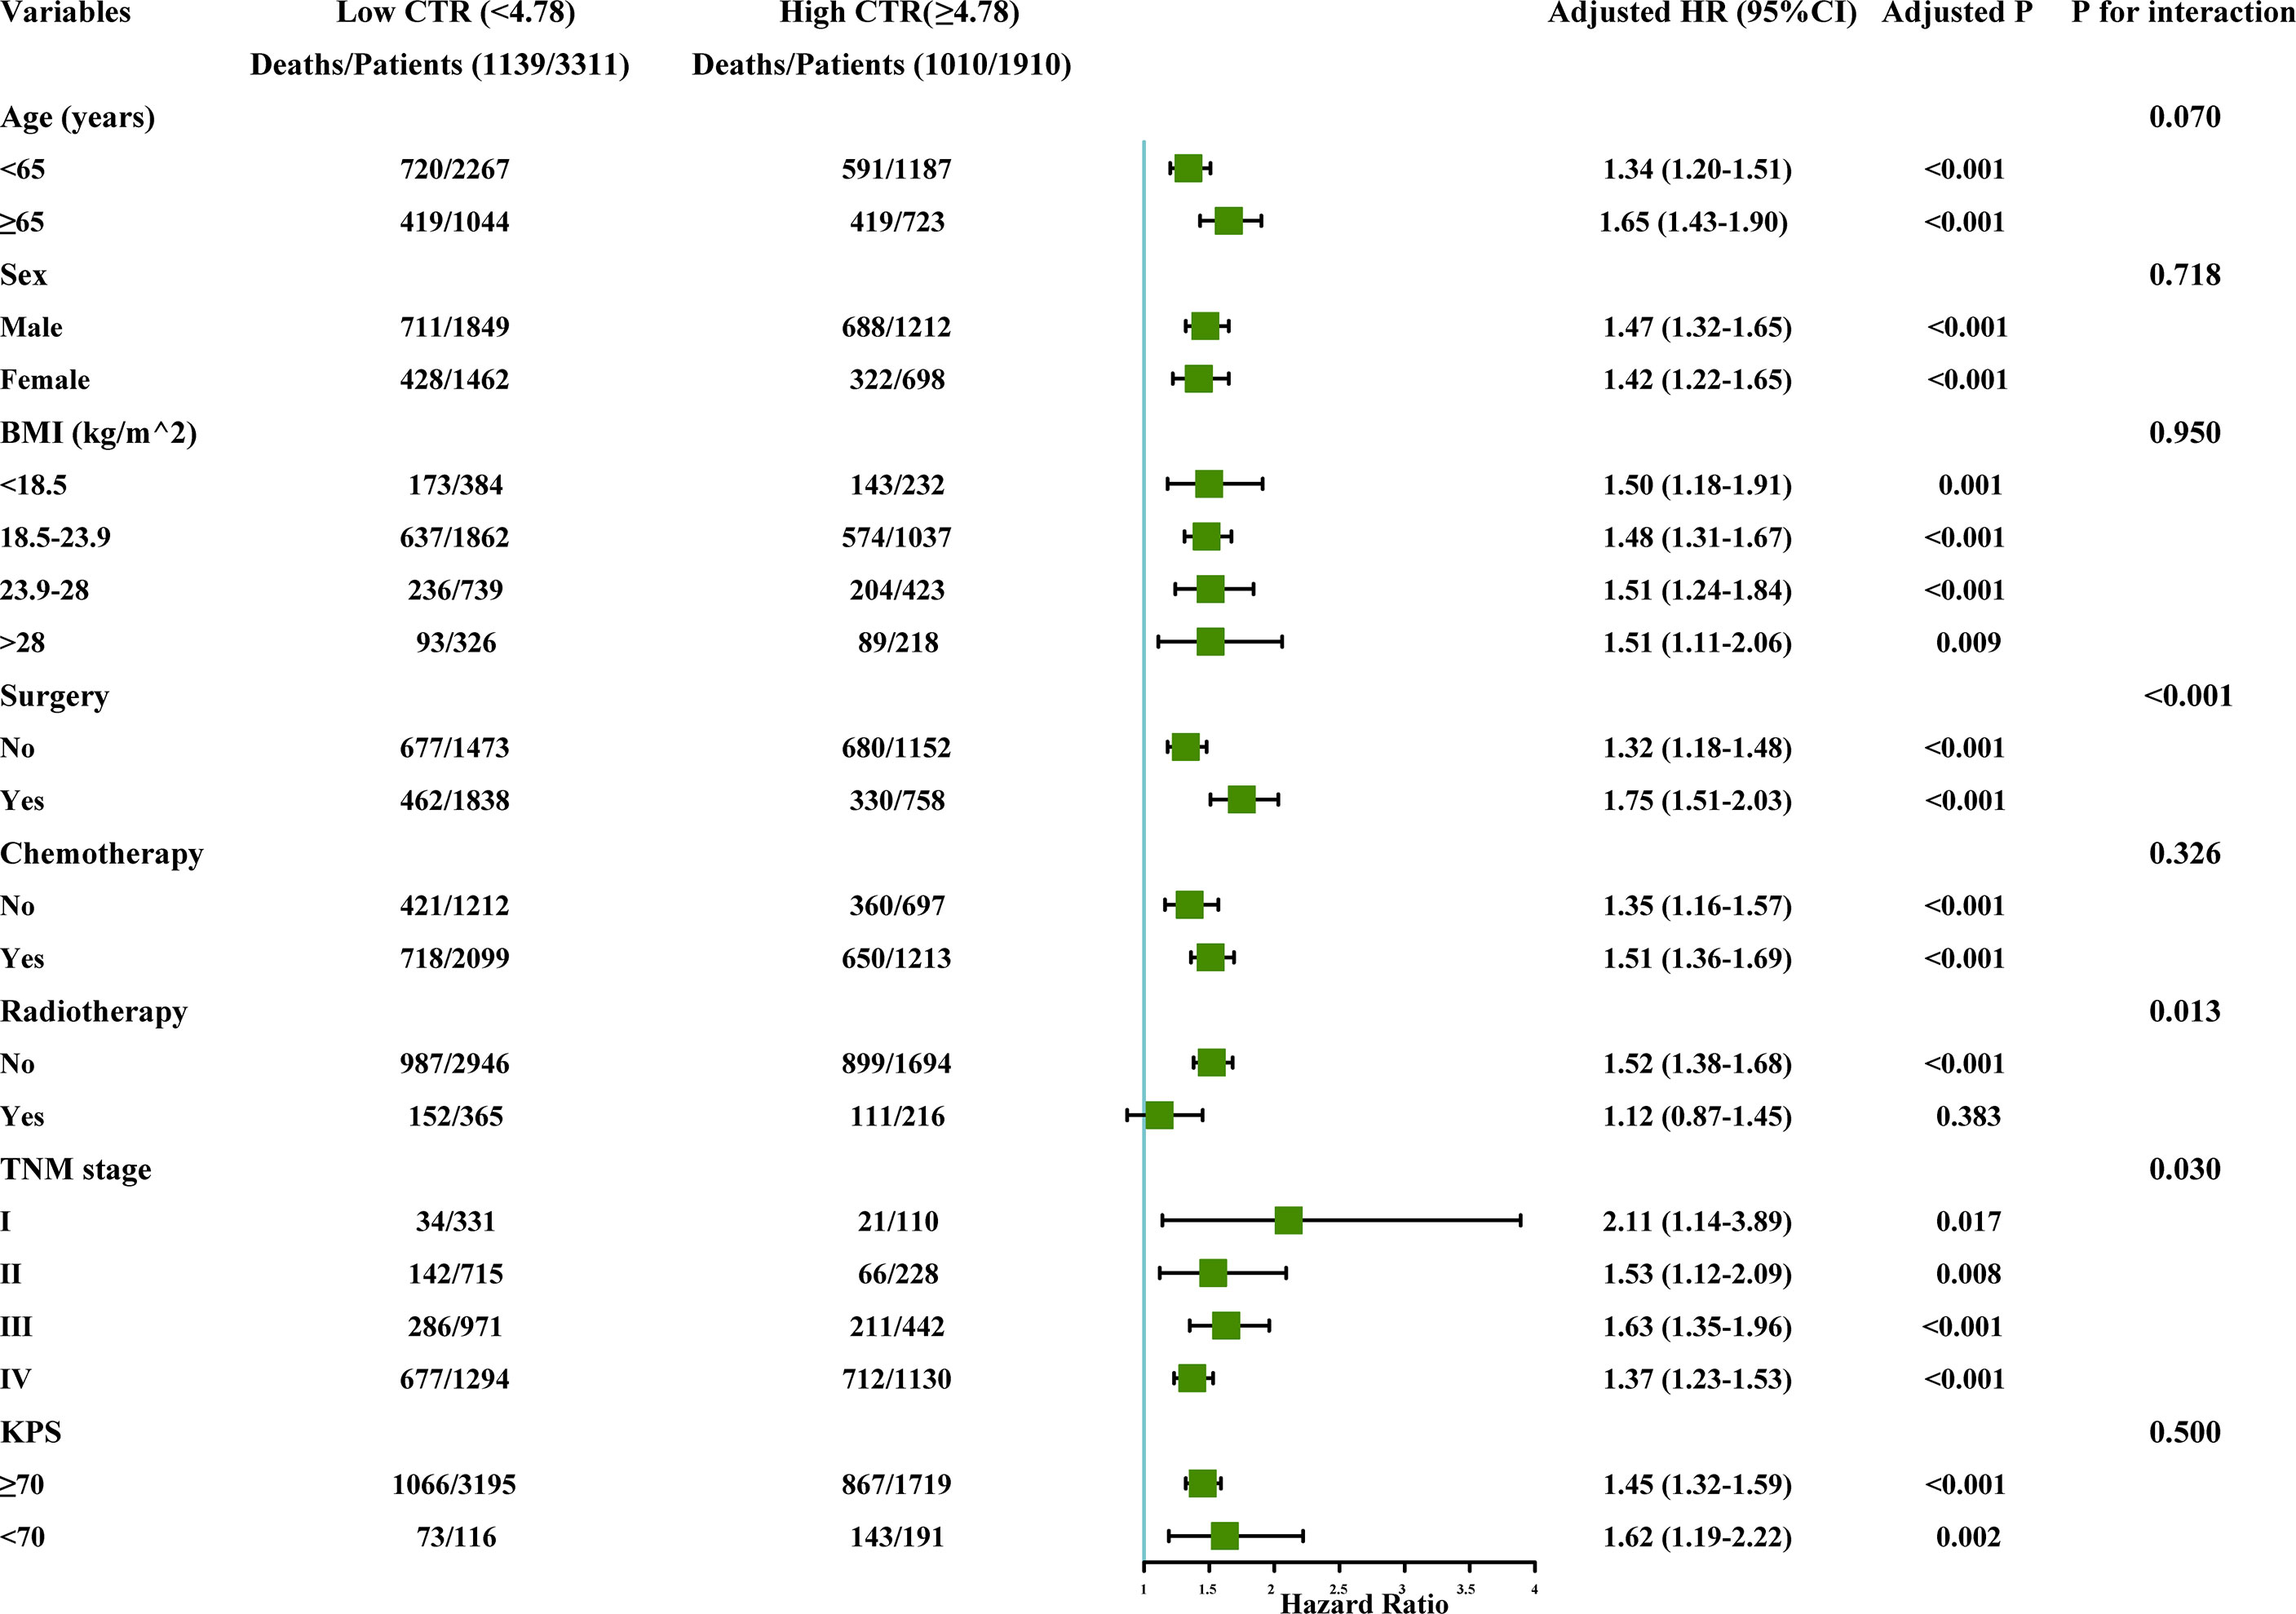
Figure 5 The subgroup analysis of the CTI in the total cohort of patients with cancer. Adjusted for age, sex, TNM stage, BMI, tumor types, KPS, surgery, chemotherapy, radiotherapy, smoking, alcohol, nutritional intervention, hypertension, coronary heart disease, diabetes, and TSF. CTI, C-reactive protein-triglyceride glucose index; BMI, body mass index; KPS, karnofsky performance status; TSF, triceps skin fold.
Discussion
This study was designed to develop and validate an inflammation- and IR-related survival predictor in patients with cancer. We found that patients with advanced stage (III–IV) and low BMI (< 18.5 kg/m2) had higher CTI values, indicating higher levels of inflammation and IR. The risk of cancer progression varies and depends on a variety of factors, such as cancer type and stage, presence of systemic inflammation, low food intake, and lack of response to anticancer therapy (28). Later staging often predicts poor survival, with cachexia in up to 80% of patients with advanced cancer (29). In refractory cachexia, cachexia may be clinically refractory due to the presence of significantly advanced (advanced stage) or rapidly progressive cancer that is not responsive to anticancer therapy (28). A review found that in most clinical studies, cancer cachexia could be defined as BMI <18.5 kg/m2 (13). Thus, patients with low BMI have a high risk of cachexia. Therefore, we hypothesized that high CTI values in patients with advanced stage and patients with low BMI might be associated with a high risk of cancer cachexia. Cachexia-related inflammation is the result of a variety of changes, one of which is the pro-inflammatory factors secreted by the tumor itself. Systemic inflammation is a hallmark of patients with cancer. The inflammatory response is the main driving force behind the metabolic alterations observed in cancer (30). Persistent inflammatory mediators in patients with cancer can promote cancer cachexia, which in turn promotes IR (21, 22). In addition, we also found that with the increase of age, the proportion of high CTI in older patients with cancer also increased. Older patients with cancer experienced a higher level of inflammation and IR.
The survival analysis of CTI in patients with cancer showed that CTI had a good and consistent prognostic value in the total, training, and validation cohorts. Different adjustment models were used in this study, and we found that the risk of death of patients did not significantly change after the adjustment model added TSF. In some patients, inflammation leads to anorexia and fat loss, along with skeletal muscle loss. In other cases, appetite and food intake remain unchanged despite the activation of systemic inflammation, resulting in sarcopenia associated with normal or elevated BMI (31). Interestingly, our BMI distribution diagram showed that CTI was relatively high in patients with low BMI. Recent epidemiological evidence suggests that the deleterious effects of low BMI on outcomes are primarily due to the deleterious effects of muscle loss and dysfunction (32). The systemic inflammatory response involves stimulation of multiple mediators, primarily cortisol and pro-inflammatory cytokines, that can directly activate the ubiquitin-proteasome pathway and autophagy in skeletal muscle and inhibit myofibrillar protein synthesis (31). Skeletal muscle is the primary site of dietary glucose processing; therefore, muscle sensitivity to insulin action is critical for the development of systemic IR and hyperglycemia (33). Deficiencies in muscle mass may also lead to IR. A large epidemiological study showed that skeletal muscle mass and insulin sensitivity were significantly inversely associated with bioimpedance and homeostasis model assessments, respectively (34). Therefore, we hypothesized that it might not be the body fat but the muscle mass that affected the survival of patients with cancer.
In our sensitivity analysis, we performed a survival analysis of CTI in the non-diabetic and diabetic populations and found that CTI predicted a higher HR and a worse prognosis in the diabetic population than in the non-diabetic population. We compared CTI values in diabetic and non-diabetic subjects and found that diabetic subjects had higher CTI than non-diabetic subjects (Figure S10). IR is closely related to T2D. Systemic inflammation can play an important role in the occurrence of IR (23). Inflammatory cytokines, such as IL-1β and interferon-γ, can regulate insulin signaling (23, 35). Interestingly, hyperinsulinemia induces the increase in inflammatory cytokines, IL-6 and TNF-α, thereby promoting IR (4). Although blood glucose is not an indicator for judging the IR status of patients, timely monitoring and regulation of inflammation and IR status of the body are required when patients with cancer are accompanied by diabetes. Subgroup analysis showed a significant interaction between CTI and TNM stage, radiotherapy, and surgical treatment. In addition to paying attention to the CTI of advanced patients with cancer, CTI of early patients with cancer should also be considered. The results showed that patients with high CTI in the early stage had the highest risk of death among patients in other groups. In addition, high CTI in patients receiving radiotherapy and surgical treatment increased the risk of death in patients, suggesting that careful attention should be paid to the inflammation and IR status of patients with cancer when evaluating patients for radiotherapy and surgical treatment in clinical practice. These results still need to be further confirmed.
To the best of our knowledge, this is the first study to develop and validate an inflammation- and IR-related marker in patients with cancer based on CRP and TyG. However, some limitations need to be considered. First, this study only selected TyG as a simple surrogate index for IR, which may have a certain effect on the results. It is worth mentioning that there are many other IR indicators that need to be further collected. Second, this study only used an internal cohort for validation, and an external cohort is required to further validate this result. Third, CTI was composed of CRP and TyG. We found that CTI was highly correlated with CRP, but after the consistency test, the two indices were moderately consistent, and CTI was different from CRP and TyG. Of course, more clinical samples might be needed for validation. Fourth, although this is a large study, the study population is heterogeneous and studies focusing on more homogeneous tumor types are needed to compare the prognostic significance of CTI and prognostic parameters associated with individual tumor types. Finally, this was a cross-sectional study, and it may be necessary to dynamically observe the inflammatory and IR status in patients with cancer, as surgery and chemoradiotherapy may affect the status of patients with cancer.
Conclusion
In conclusion, our study developed and validated the prognostic value of inflammation- and IR-related CTI in patients with cancer. Moreover, patients with cancer with high CTI predicted a worse prognosis. CTI is a simple and well-defined OS indicator for patients with cancer, which will allow clinicians to assess patients’ inflammatory and IR status and tailor treatment.
Data Availability Statement
The raw data supporting the conclusions of this article will be made available by the authors, without undue reservation.
Ethics Statement
This study followed the Declaration of Helsinki. All participants signed an informed consent form, and this study involving human participants was reviewed and approved by the institutional review board of each hospital(registration number: ChiCTR1800020329). The patients/participants provided their written informed consent to participate in this study.
Author Contributions
G-TR wrote the manuscript. G-TR, H-LX, H-YZ and analyzed and interpreted the patient data, G-TR, H-LX, H-YZ, and H-PS made substantial contributions to the conception, design, and intellectual content of the studies. All authors read and approved the final manuscript.
Funding
This work was supported by the National Key Research and Development Program [grant number 2017YFC1309200] and the Beijing Municipal Science and Technology Commission [grant number SCW2018-06].
Conflict of Interest
The authors declare that the research was conducted in the absence of any commercial or financial relationships that could be construed as a potential conflict of interest.
Publisher’s Note
All claims expressed in this article are solely those of the authors and do not necessarily represent those of their affiliated organizations, or those of the publisher, the editors and the reviewers. Any product that may be evaluated in this article, or claim that may be made by its manufacturer, is not guaranteed or endorsed by the publisher.
Acknowledgments
We would like to thank Editage (www.editage.cn) for English language editing. We are grateful to all the participants who have been part of the project and to the many members of the study teams at different study centers who have enabled this study.
Supplementary Material
The Supplementary Material for this article can be found online at: https://www.frontiersin.org/articles/10.3389/fendo.2022.905266/full#supplementary-material
Supplementary Figure 1 | Flowchart of patient selection for this study.
Supplementary Figure 2 | Optimal cut-off value of CTI. CTI, C-reactive protein-triglyceride glucose index.
Supplementary Figure 3 | The Pearson correlation analysis stratified by age. CTI, C-reactive protein-triglyceride glucose index; BMI, body mass index; CRP, C-reactive protein; TyG, triglyceride-glucose index; Tch, triglyceride; KPS, karnofsky performance status; PGSGA, patient-generated subjective global assessment.
Supplementary Figure 4 | The Pearson correlation analysis stratified by sex. CTI, C-reactive protein-triglyceride glucose index; BMI, body mass index; CRP, C-reactive protein; TyG, triglyceride-glucose index; Tch, triglyceride; KPS, karnofsky performance status; PGSGA, patient-generated subjective global assessment.
Supplementary Figure 5 | The distribution of CTI stratified by age in different groups. CTI, C-reactive protein-triglyceride glucose index.
Supplementary Figure 6 | The distribution of CTI in different tumor type groups. CTI, C-reactive protein-triglyceride glucose index.
Supplementary Figure 7 | The restricted cubic spline curves of CTI in patients with cancer. CTI, C-reactive protein-triglyceride glucose index.
Supplementary Figure 8 | The Kaplan-Meier survival curves of CTI in the training cohort of patients with cancer. (A) Lung cancer; (B) Esophageal cancer; (C) Gastric cancer; (D) Colorectal cancer; (E) Other digsestive cancer; (F) Breast cancer; (G) Female reproductive cancer; (H) Urological cancer; (I) Nasopharyngeal cancer; (J) Other cancer; CTI, C-reactive protein-triglyceride glucose index.
Supplementary Figure 9 | The Kaplan-Meier survival curves of CTI in the validation cohort of patients with cancer. (A) Lung cancer; (B) Esophageal cancer; (C) Gastric cancer; (D) Colorectal cancer; (E) Other digsestive cancer; (F) Breast cancer; (G) Female reproductive cancer; (H) Urological cancer; (I) Nasopharyngeal cancer; (J) Other cancer; CTI, C-reactive protein-triglyceride glucose index.
Supplementary Figure 10 | The distribution of CTI in the diabetes and non-diabetes groups. CTI, C-reactive protein-triglyceride glucose index.
References
1. Siegel RL, Miller KD, Fuchs HE, Jemal A. Cancer Statistics, 2022. CA Cancer J Clin (2022) 72(1):7–33. doi: 10.3322/caac.21708
2. Chen W, Zheng R, Baade PD, Zhang S, Zeng H, Bray F, et al. Cancer Statistics in China, 2015. CA Cancer J Clin (2016) 66(2):115–32. doi: 10.3322/caac.21338
3. Bray F, Jemal A, Grey N, Ferlay J, Forman D. Global Cancer Transitions According to the Human Development Index (2008-2030): A Population-Based Study. Lancet Oncol (2012) 13(8):790–801. doi: 10.1016/S1470-2045(12)70211-5
4. Lee DY, Rhee EJ, Chang Y, Sohn CI, Shin HC, Ryu S, et al. Impact of Systemic Inflammation on the Relationship Between Insulin Resistance and All-Cause and Cancer-Related Mortality. Metabolism (2018) 81:52–62. doi: 10.1016/j.metabol.2017.11.014
5. Korniluk A, Koper O, Kemona H, Dymicka-Piekarska V. From Inflammation to Cancer. Ir J Med Sci (2017) 186(1):57–62. doi: 10.1007/s11845-016-1464-0
6. Ruan GT, Ge YZ, Xie HL, Hu CL, Zhang Q, Zhang X, et al. Association Between Systemic Inflammation and Malnutrition With Survival in Patients With Cancer Sarcopenia-A Prospective Multicenter Study. Front Nutr (2021) 8:811288. doi: 10.3389/fnut.2021.811288
7. Colotta F, Allavena P, Sica A, Garlanda C, Mantovani A. Cancer-Related Inflammation, the Seventh Hallmark of Cancer: Links to Genetic Instability. Carcinogenesis (2009) 30(7):1073–81. doi: 10.1093/carcin/bgp127
8. Argiles JM, Lopez-Soriano FJ, Busquets S. Counteracting Inflammation: A Promising Therapy in Cachexia. Crit Rev Oncog (2012) 17(3):253–62. doi: 10.1615/CritRevOncog.v17.i3.30
9. Klein GL, Petschow BW, Shaw AL, Weaver E. Gut Barrier Dysfunction and Microbial Translocation in Cancer Cachexia: A New Therapeutic Target. Curr Opin Support Palliat Care (2013) 7(4):361–7. doi: 10.1097/SPC.0000000000000017
10. Fearon KC, Barber MD, Falconer JS, McMillan DC, Ross JA, Preston T. Pancreatic Cancer as a Model: Inflammatory Mediators, Acute-Phase Response, and Cancer Cachexia. World J Surg (1999) 23(6):584–8. doi: 10.1007/PL00012351
11. Kuroda K, Nakashima J, Kanao K, Kikuchi E, Miyajima A, Horiguchi Y, et al. Interleukin 6 Is Associated With Cachexia in Patients With Prostate Cancer. Urology (2007) 69(1):113–7. doi: 10.1016/j.urology.2006.09.039
12. Baracos VE, Martin L, Korc M, Guttridge DC, Fearon KCH. Cancer-Associated Cachexia. Nat Rev Dis Primers (2018) 4:17105. doi: 10.1038/nrdp.2017.105
13. Dev R, Bruera E, Dalal S. Insulin Resistance and Body Composition in Cancer Patients. Ann Oncol (2018) 29(suppl_2):ii18–26. doi: 10.1093/annonc/mdx815
14. Winter A, MacAdams J, Chevalier S. Normal Protein Anabolic Response to Hyperaminoacidemia in Insulin-Resistant Patients With Lung Cancer Cachexia. Clin Nutr (2012) 31(5):765–73. doi: 10.1016/j.clnu.2012.05.003
15. Resnick HE, Jones K, Ruotolo G, Jain AK, Henderson J, Lu W, et al. Insulin Resistance, the Metabolic Syndrome, and Risk of Incident Cardiovascular Disease in Nondiabetic American Indians: The Strong Heart Study. Diabetes Care (2003) 26(3):861–7. doi: 10.2337/diacare.26.3.861
16. Marott SC, Nordestgaard BG, Tybjaerg-Hansen A, Benn M. Components of the Metabolic Syndrome and Risk of Type 2 Diabetes. J Clin Endocrinol Metab (2016) 101(8):3212–21. doi: 10.1210/jc.2015-3777
17. Cowey S, Hardy RW. The Metabolic Syndrome: A High-Risk State for Cancer? Am J Pathol (2006) 169(5):1505–22. doi: 10.2353/ajpath.2006.051090
18. Fonseca G, Farkas J, Dora E, von Haehling S, Lainscak M. Cancer Cachexia and Related Metabolic Dysfunction. Int J Mol Sci (2020) 21(7):2321. doi: 10.3390/ijms21072321
19. Arcidiacono B, Iiritano S, Nocera A, Possidente K, Nevolo MT, Ventura V, et al. Insulin Resistance and Cancer Risk: An Overview of the Pathogenetic Mechanisms. Exp Diabetes Res (2012) 2012:789174. doi: 10.1155/2012/789174
20. Tsirona S, Tzanela M, Botoula E, Belenis I, Rondogianni D, Tsagarakis S. Clinical Presentation and Long-Term Outcome of Patients With Ectopic Acth Syndrome Due To Bronchial Carcinoid Tumors: A One-Center Experience. Endocr Pract (2015) 21(10):1104–10. doi: 10.4158/EP15647.OR
21. Wagner EF, Petruzzelli M. Cancer Metabolism: A Waste of Insulin Interference. Nature (2015) 521(7553):430–1. doi: 10.1038/521430a
22. Wang H, Ye J. Regulation of Energy Balance by Inflammation: Common Theme in Physiology and Pathology. Rev Endocr Metab Disord (2015) 16(1):47–54. doi: 10.1007/s11154-014-9306-8
23. Xia C, Rao X, Zhong J. Role of T Lymphocytes in Type 2 Diabetes and Diabetes-Associated Inflammation. J Diabetes Res (2017) 2017:6494795. doi: 10.1155/2017/6494795
24. Fritz J, Bjorge T, Nagel G, Manjer J, Engeland A, Haggstrom C, et al. The Triglyceride-Glucose Index as a Measure of Insulin Resistance and Risk of Obesity-Related Cancers. Int J Epidemiol (2020) 49(1):193–204. doi: 10.1093/ije/dyz053
25. Yan X, Gao Y, Tong J, Tian M, Dai J, Zhuang Y. Association Between Triglyceride Glucose Index and Non-Small Cell Lung Cancer Risk in Chinese Population. Front Oncol (2021) 11:585388. doi: 10.3389/fonc.2021.585388
26. Kim YM, Kim JH, Park JS, Baik SJ, Chun J, Youn YH, et al. Association Between Triglyceride-Glucose Index and Gastric Carcinogenesis: A Health Checkup Cohort Study. Gastric Cancer (2022) 25(1):33–41. doi: 10.1007/s10120-021-01222-4
27. Song M, Zhang Q, Tang M, Zhang X, Ruan G, Zhang X, et al. Associations of Low Hand Grip Strength With 1 Year Mortality of Cancer Cachexia: A Multicentre Observational Study. J Cachexia Sarcopenia Muscle (2021) 12(6):1489–500. doi: 10.1002/jcsm.12778
28. Fearon K, Strasser F, Anker SD, Bosaeus I, Bruera E, Fainsinger RL, et al. Definition and Classification of Cancer Cachexia: An International Consensus. Lancet Oncol (2011) 12(5):489–95. doi: 10.1016/S1470-2045(10)70218-7
29. de Matos-Neto EM, Lima JD, de Pereira WO, Figueredo RG, Riccardi DM, Radloff K, et al. Systemic Inflammation in Cachexia - Is Tumor Cytokine Expression Profile the Culprit? Front Immunol (2015) 6:629. doi: 10.3389/fimmu.2015.00629
30. Argiles JM, Busquets S, Stemmler B, Lopez-Soriano FJ. Cancer Cachexia: Understanding the Molecular Basis. Nat Rev Cancer (2014) 14(11):754–62. doi: 10.1038/nrc3829
31. Biolo G, Cederholm T, Muscaritoli M. Muscle Contractile and Metabolic Dysfunction Is a Common Feature of Sarcopenia of Aging and Chronic Diseases: From Sarcopenic Obesity to Cachexia. Clin Nutr (2014) 33(5):737–48. doi: 10.1016/j.clnu.2014.03.007
32. Martin L, Birdsell L, Macdonald N, Reiman T, Clandinin MT, McCargar LJ, et al. Cancer Cachexia in the Age of Obesity: Skeletal Muscle Depletion is a Powerful Prognostic Factor, Independent of Body Mass Index. J Clin Oncol (2013) 31(12):1539–47. doi: 10.1200/JCO.2012.45.2722
33. Samuel VT, Shulman GI. Mechanisms for Insulin Resistance: Common Threads and Missing Links. Cell (2012) 148(5):852–71. doi: 10.1016/j.cell.2012.02.017
34. Srikanthan P, Karlamangla AS. Relative Muscle Mass is Inversely Associated With Insulin Resistance and Prediabetes. Findings From the Third National Health and Nutrition Examination Survey. J Clin Endocrinol Metab (2011) 96(9):2898–903. doi: 10.1210/jc.2011-0435
Keywords: systemic inflammation, CRP, insulin resistance, TyG, overall survival
Citation: Ruan G-T, Xie H-L, Zhang H-Y, Liu C-A, Ge Y-Z, Zhang Q, Wang Z-W, Zhang X, Tang M, Song M-M, Zhang X-W, Yang M, Chen Y-B, Yu K-Y, Deng L, Gong Y-Z, Hu W, Wang K-H, Cong M-H and Shi H-P (2022) A Novel Inflammation and Insulin Resistance Related Indicator to Predict the Survival of Patients With Cancer. Front. Endocrinol. 13:905266. doi: 10.3389/fendo.2022.905266
Received: 26 March 2022; Accepted: 18 May 2022;
Published: 20 June 2022.
Edited by:
Eija K. Laakkonen, University of Jyväskylä, FinlandReviewed by:
Rui Curi, Cruzeiro do Sul University Sao Paulo, BrazilJuha P. Väyrynen, University of Oulu, Finland
Copyright © 2022 Ruan, Xie, Zhang, Liu, Ge, Zhang, Wang, Zhang, Tang, Song, Zhang, Yang, Chen, Yu, Deng, Gong, Hu, Wang, Cong and Shi. This is an open-access article distributed under the terms of the Creative Commons Attribution License (CC BY). The use, distribution or reproduction in other forums is permitted, provided the original author(s) and the copyright owner(s) are credited and that the original publication in this journal is cited, in accordance with accepted academic practice. No use, distribution or reproduction is permitted which does not comply with these terms.
*Correspondence: Han-Ping Shi, c2hpaHBAY2NtdS5lZHUuY24=; Kun-Hua Wang, a3VuaHVhd2FuZzFAMTYzLmNvbQ==; Ming-Hua Cong, ZG9jY29uZ0AxNjMuY29t
†ORCID: Han-Ping Shi, orcid.org/0000-0003-4514-8693
‡These author have contributed equally to this work