 Fangfang Li
 Lingxiao Qiu
 Ping Li
 Guojun Zhang
- Department of Respiratory Medicine, The First Affiliated Hospital of Zhengzhou University, Zhengzhou, China
Purpose: The immunotherapy of lung adenocarcinoma (LUAD) has received much attention in recent years and metabolic reprogramming is linked to immune infiltration in the tumor microenvironment. Therefore, it is indispensable to dissect the role of immune-related metabolic genes in lung adenocarcinoma.
Methods: In this study, we screened immune-related genes by Pearson correlation. The function of these genes was explored by gene ontology (GO) and KEGG (Kyoto Encyclopedia of Genes and Genomes) enrichment analysis. The differently expressed immune-related genes were analyzed by Limma. Furthermore, the LUAD patients were clustered based on immune-related genes through consensus clustering. The Unicox was used to identify survival-immune-related metabolic genes. The Least Absolute Shrinkage and Selection Operator (LASSO) regression analysis was used to optimize the gene sets. A prediction model was constructed and tested. The potential therapeutic target was selected based on two criteria, these immune-related metabolic genes that were highly expressed in tumor tissues and negatively correlated with the survival of patients in LUAD. Quantitative real‐time PCR (qRT‐PCR) was used for in vitro experimental validations.
Results: We identified 346 immune-related genes, mainly involved in arachidonic acid metabolism and peroxisome proliferator-activated receptor (PPAR) signaling. Moreover, a total of 141 immune-related genes were dysregulated between tumor and normal tissues. We clustered three subtypes of LUAD based on immune-related metabolic genes and these subtypes exhibited different survival and immune status. We found Ribonucleotide Reductase Regulatory Subunit M2 (RRM2) as a potential therapeutic target, which is positively correlated with the cyclin-dependent kinase family of genes.
Conclusion: We comprehensively analyzed the immune-related metabolic genes in LUAD. RRM2 was determined as a promising metabolic checkpoint for lung adenocarcinoma.
Introduction
Lung cancer is one of the most common causes of cancer-related mortality. Adenocarcinoma is the most common histological type of lung cancer (1, 2). Lung adenocarcinoma (LUAD) has an unfavorable 5-year survival rate which makes only 15% (3–5). In the past few decades, surgical resection, chemotherapy, radiotherapy, and targeted molecular therapies have been carried out in clinical practices to treat LUAD. However, most LUAD patients are usually diagnosed at advanced and late stages, thus having poor prognosis. In recent years the relationship among cancer immunotherapy, tumor microenvironment, and metabolism has gotten much of attention. Hence, comprehensively understanding the role of immune-related metabolic genes involved in the occurrence and development of LUAD is crucial for the diagnositc and prognositic prospetcs.
The tumor microenvironment (TME) is the cellular environment in which the tumor develops. TME is closely related to the occurrence and development of tumors (6, 7). It included inflammatory and stromal cells that infiltrate the tumors. Lymphocytes infiltrating tumor tissues have been discovered for more than hundred years. After 1960, people began to consider the relationship between immunity and prognosis (8). It has been found that the infiltration of T cells (80%) in the majority of tumors is positively correlated with the tumor metastasis (9). Aberrant cellular metabolism is emerging as a novel therapeutic target, and the interplay between metabolic remodeling and immune regulation in cancer represents a potential area of investigations (10, 11).
Abnormal activation of oncogenic genes, such as Myc and Ras can directly regulate intracellular metabolic pathways (12). Moreover, immune cells can also change metabolic pathways and further affect cellular functions (13). The abnormal metabolism of tumors not only enables tumors to survive in an environment of hypoxia and nutrient deficiency, but the products of metabolism can inhibit immune response, promote the formation of immunosuppressive cells, and help tumors evade host immune killing (14). It has been found that in acute lymphoblastic leukemia, proliferating T and B cells exhibit abnormal metabolic stress (15, 16). Similarly, mounting evidence has confirmed that reprogramming the tumor immune microenvironment is a necessary process that drives LUAD metastasis (17). This suggests that the metabolic disorder of cancer cells may be treated by targeting some genes (18).
In this study, we identified 346 immune-related genes. Among these, 141 genes were found to be dysregulated between normal and tumor tissues. Three clusters of LUAD samples were based on immune-related metabolic genes and different clusters exhibited distinct survival and immune status. Moreover, we constructed and validated a prediction model and identified RRM2 as a potential metabolic target which was positively correlated with the cyclin-dependent kinase (CDK) family of genes.
Materials and Methods
Data Preprocessing
The mRNA sequencing and clinical data of 535 LUAD samples and 59 normal samples were downloaded from the TCGA data portal. The metabolism-related genes were downloaded from published work (19). The immune-related genes were downloaded from an online website (https://www.immport.org/). Low expressed genes were excluded from the study and the data was normalized to log2 (tpm+1) (average expression after normalization <0.5). Finally, 346 immune-related metabolic genes were selected by cor test using the Pearson correlation method (P<0.05, |R|>0.2).
GO and KEGG Enrichment Analysis and PPI Network Construction of Immune-Related Metabolic Genes
We divided 346 differentially expressed genes (DEGs) into up-regulated and down-regulated genes. R was used to perform GO and KEGG enrichment analysis. The “clusterProfiler”, “richplot”, and “ggplot2” packages were used for analysis (20, 21). The GO analysis was performed to annotate genes and classify up-regulated and down-regulated DEGs. The GO terms consisted of 3 parts: Biological Process (BP), Cellular Component (CC), and Molecular Function (MF). The KEGG database included the systematic analysis, annotation, and visualization of gene functions (22). STRING online website was used to construct a protein-protein interaction (PPI) network for the selected DEGs (23). For PPI analysis, the confidence score was set to > 0.9, and only terms with both p- and q-value of <0.05 were considered significantly enriched. Cytoscape software further analyzed the most closely connected modules and identified the top 10 central genes (24).
Identification of Dysregulated Genes Between Tumor and Normal Tissues
The “limma” package (25) in R was used to identify DEGs between Cancer and adjacent tissue samples. Merely genes with | log2fold change | > 1 and P < 0.05 were considered as DEGs. The “pheatmap” package was used to draw heat maps, and “ggplot2” was used to draw volcano maps.
Consistent Clustering of Immune-Related Metabolic Genes
The immune-related metabolic genes were divided into different clusters by the cell consistency clustering method. We used the “ConsensusClusterPlus” package (100 iterations and 80% resampling rate, http://www.bioconductor.org/) to classify patients with LUAD into different subtypes. The heat map and dela diagram established the optimal number of clusters. The cumulative distribution function (CDF) was plotted to identify the number of best clusters. The Progress Free Survival (PFS) between various clusters was compared. The survival analysis was analyzed by the R package “survival”, and the “ggplot2” package was used for plotting.
Immune Characteristics Between Clusters-Expression of Immune-Related Molecules
The expression of immune-related molecules among these clusters with the ESTIMATE algorithm was analyzed by the R “ESTIMATE” package. These immune-related genes regulate four immune functions these included, antigen presentation, chemokine-related genes, cytokines, and immune checkpoints. “ggplot2” package was used to draw box plots.
Immune Characteristics Between Clusters-Expression of Infiltrating Immune Cells and Clinicopathological Characteristics
Four methods were used to assess the infiltration of immune cells in three clusters. These methods were single-sample gene set enrichment analysis (ssGSEA), Microenvironment Cell Populations (MCP)-counter, CIBERSORT, and Xcell (26–29). The three different immune cell infiltrating clusters were also compared and found their immune scores. We compared the pathological classification proportions between different clusters to further distinguish the differences between different clusters, including T, N, M, clinical drug treatment response, and the pathological stage.
Validation of Prognostic Prediction Based on Immune-Related Metabolic Genes Models
The expression matrix of LUAD was randomly divided into training and test sets. The training set was 70% and the test set was 30%. We used single-factor analysis on the two groups of genes. The genes with p<0.05 were selected. The Least Absolute Shrinkage and Selection Operator (LASSO) cox regression method was further optimized through multi-factor COX regression analysis to help us to determine the best number of genes to build a model (30, 31). Moreover, we collected 80 lung cancer samples along with complete survival information and constructed a prognostic model as a control. Finally, the gene’s risk score was screened to get a good predictive ability on the patient’s survival. The area under the ROC curve (AUC) was used to judge the prognostic model’s predictive power. The ten-fold cross-validation based on the “glmnet” package in R was used for lasso penalty Cox regression analysis. The survival analysis was analyzed by R package “survival”, while AUC was analyzed by R package “survivalROC”.
Identification of Potential Metabolic Checkpoints
First we selected the immune metabolism genes that were highly expressed in the tumor site (logFC>1.5, FDR<0.05), and the immune metabolism genes in the training set that were negatively related to survival (p ≤ 0.01). Through pan-cancer analysis (https://cistrome.shinyapps.io/timer/) and the expression level analysis of collected clinical samples, we screened out genes with higher expression abundance in tumors. The signaling pathway was determined with criterion (spearman r>2 or<-2, q value< 0.05) using online website cBioPortal (https://www.cbioportal.org/). The selected genes were used to perform GO and KEGG enrichment analyses.
Cell Culture
The different cell lines used in this study were, Human normal lung epithelial cell line (BEAS-2B) A549, NCI-H292, and Calu-3. BEAS-2B cells were purchased from Procell Life Science and Technology Co., Ltd. (Wuhan, China). A549, NCI-H292, and Calu-3 were purchased from the cell bank of the Chinese Academy of Sciences (Shanghai, China). The BEAS-2B cell line was cultured in Dulbecco’s Modified Eagle’s medium (DMEM; Gibco, Grand Island, NY, USA). The A549 cell line was cultured in Ham’s F-12K medium (Gibco) The NCI-H292 cell line was cultured in Roswell Park Memorial Institute-1640 medium (RPMI-1640; Gibco), and the Calu-3 cell line was maintained in modified eagle medium (MEM; Gibco). All media were supplemented with 10% fetal bovine serum (FBS; Gibco) and antibiotics (100 units/ml penicillin and 100 ug/ml streptomycin; Gibco). All cells were incubated in a humidified atmosphere of 5% CO2 at 37°C.
Quantitative Real‐Time PCR
Total RNA was isolated from tissues and cells using TrIzol reagent (Gibco) according to the manufacturer’s instructions. The extracted RNA was reverse transcribed into complementary DNA using a reverse transcription kit (Takara, Dalian, China). Quantitative real-time PCR (qRT-PCR) was performed using the SYBR-Green PCR kit (Roche Diagnostics, Indianapolis, IN) on a Step One Plus Real-Time PCR system (Applied Biosystems, Foster City, CA). Glyceraldehyde 3-phosphate dehydrogenase (GAPDH) was used as an internal control. The results were analyzed using the 2-ΔΔCt method. Primers were synthesized by Sangon Biotech (Shanghai, China). All the primer sequences were listed (Supplementary Table 1).
Results
Identification and Function Enrichment Analysis of Immune-Related Metabolic Genes
To identify the immune-related metabolic genes, we obtained 1041 immune genes and 1613 metabolic genes. The general research design and flow of the study was shown (Figure 1). The correlation analysis identified 346 immune-related metabolic genes (Figure S1). The GO analysis consisted of three parts: BP, CC, and MF. Our results indicated that the immune-related metabolic genes were significantly enriched in the BP-associated organic acid biosynthetic process, carboxylic acid biosynthetic process, and monocarboxylic acid biosynthetic process. For the CC, the immune-related metabolic genes were mainly enriched in the Golgi, lysosomal, and vacuolar lumens. Furthermore, the MF analysis showed that the immune-related metabolic genes were significantly enriched in cofactor binding, oxidoreductase activity, acting on the CH−OH group of donors, and carboxylic acid-binding. The immune-related metabolic genes were found to be involved in Arachidonic acid metabolism, PPAR signaling pathway, and Biosynthesis of amino acids (Figures 2A, B). PPI network was established to further dissect the potential mechanism of these genes (Figure 2C). Top10 core genes were identified by Cytoscape plug-in cytoHubba: these genes included, SDC2, GPC3, GPC1, HSPG2, AGRN, GPC2, GPC5, GPC4, GPC6, and VCAN (Figure 2C).
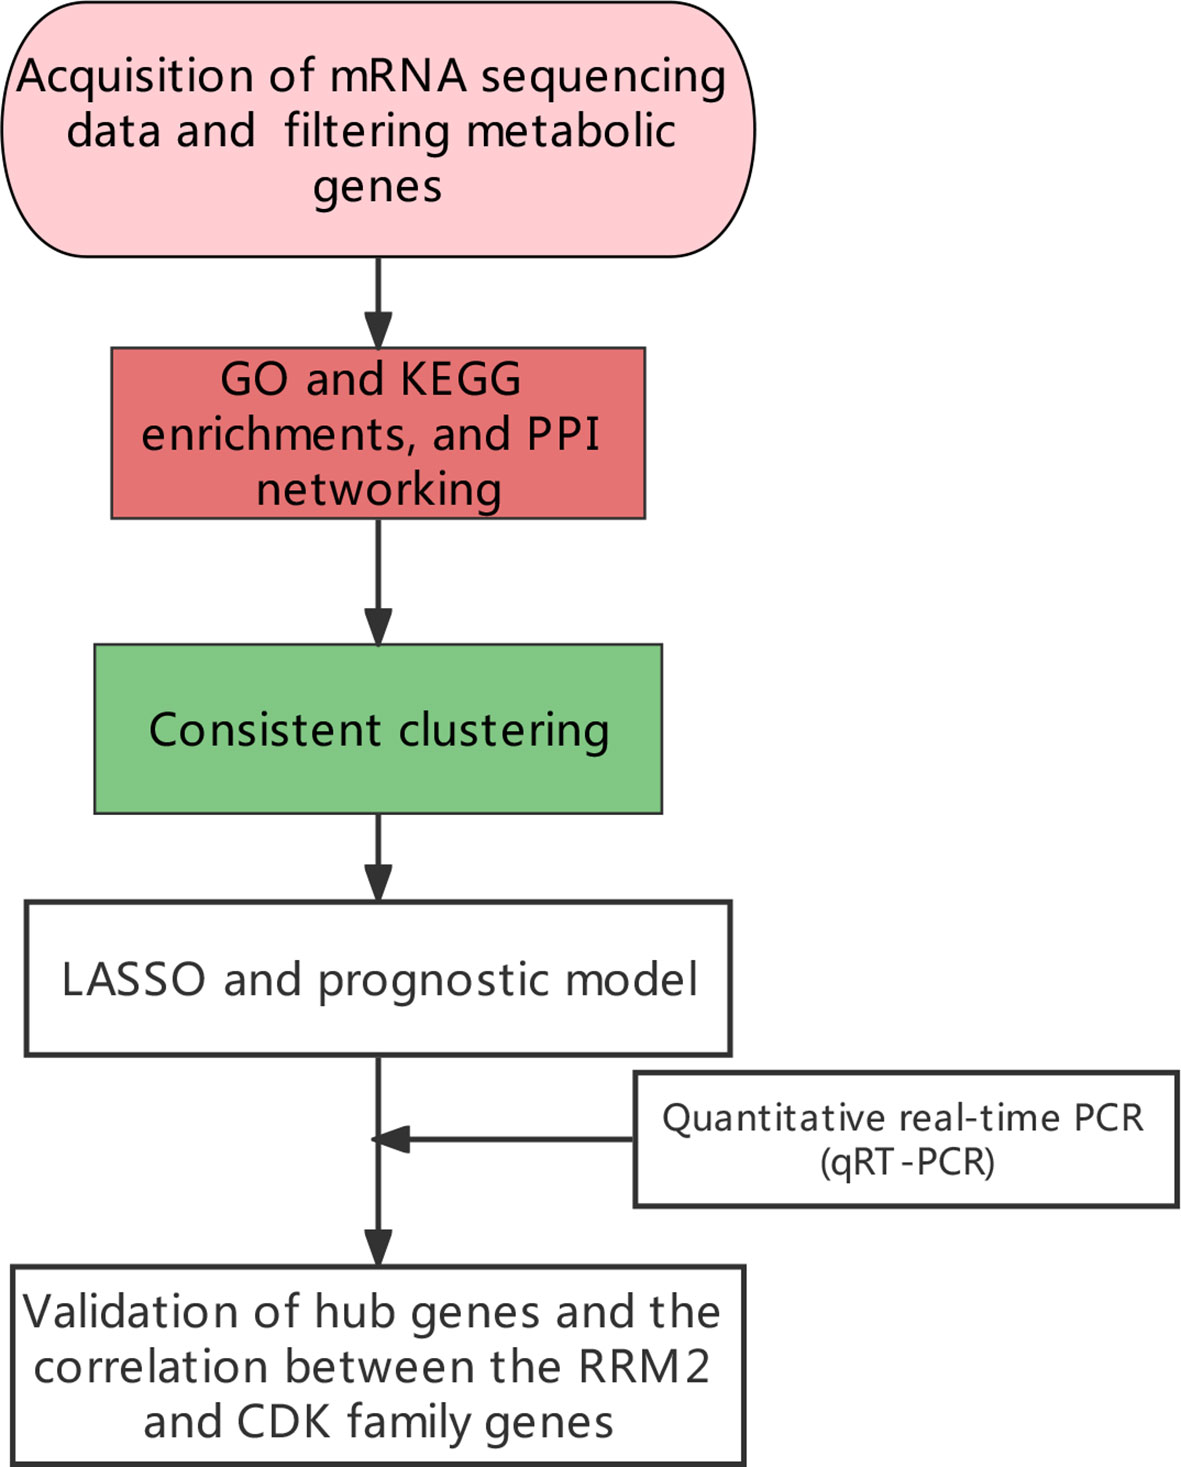
Figure 1 The general research design and flow of the study.
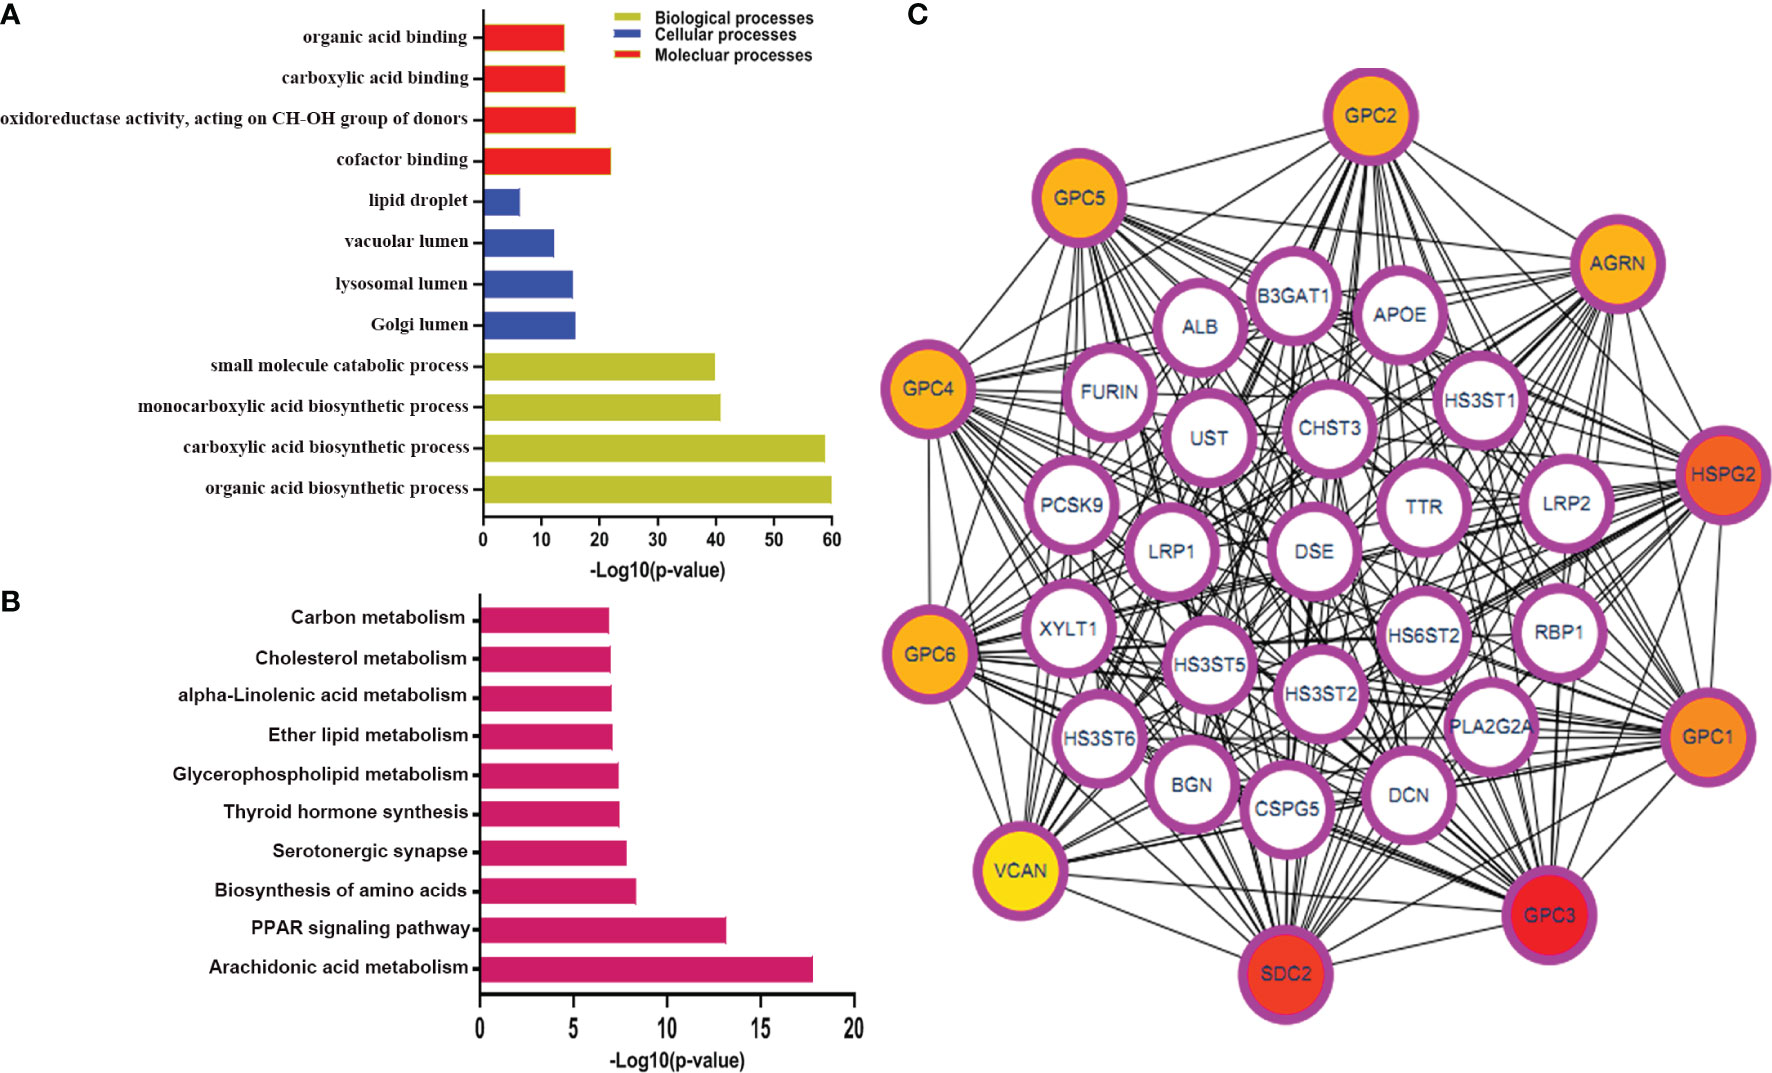
Figure 2 The GO and KEGG pathway analysis for immune-related metabolic genes. (A, B) The GO enrichment and KEGG pathway analyses of immune-related metabolic genes; (C) The top 10 genes were ordered by the number of nodes. BP, biological process; CC, cellular component; MF, molecular function; KEGG, Kyoto Encyclopedia of Genes and Genomes.
The heat map clearly distinguished the immune related metabolic genes in tumor and normal tissues (Figure S2A). A total of 141 DEGs were identified (|log2fold change |> 1, P < 0.05). Among these, 72 genes were up-regulated and 69 genes were down-regulated (Figure S2B). Then, we performed GO and KEGG enrichment analysis on 141 differential genes (Figures S2C–F). It was observed that DEGs were mainly involved in the fatty acid metabolic process; organic hydroxy compound metabolic process and small molecular metabolic process.
Consistent Clustering of Immune-Related Metabolic Genes
Consistent clustering of immune-related genes was performed to unwind metabolic patterns of tumor cells. Tumor samples were divided into different clusters according to the expression patterns of immune-related gens. To determine the optimal cluster number, the cumulative distribution function (CDF) was plotted and three different clusters were identified. Moreover, heat maps were drawn to compare the expression of immune-related metabolic genes among the various clusters (Figures 3A–C). Furthermore, the survival status of the three clusters was evaluated by comparing progression-free survival (PFS) and clinicopathological parameters. Our results showed that cluster 2 have prolonged survival in early times (Figure 3D). Consistent with these findings, patients in the cluster 2 have lower T, N, M, and stage as well as the status of lymph node metastasis (Figures S3A–D). Similarly, a comparatively more proportion of patients had a complete response to treatments in this cluster (Figure S3E).
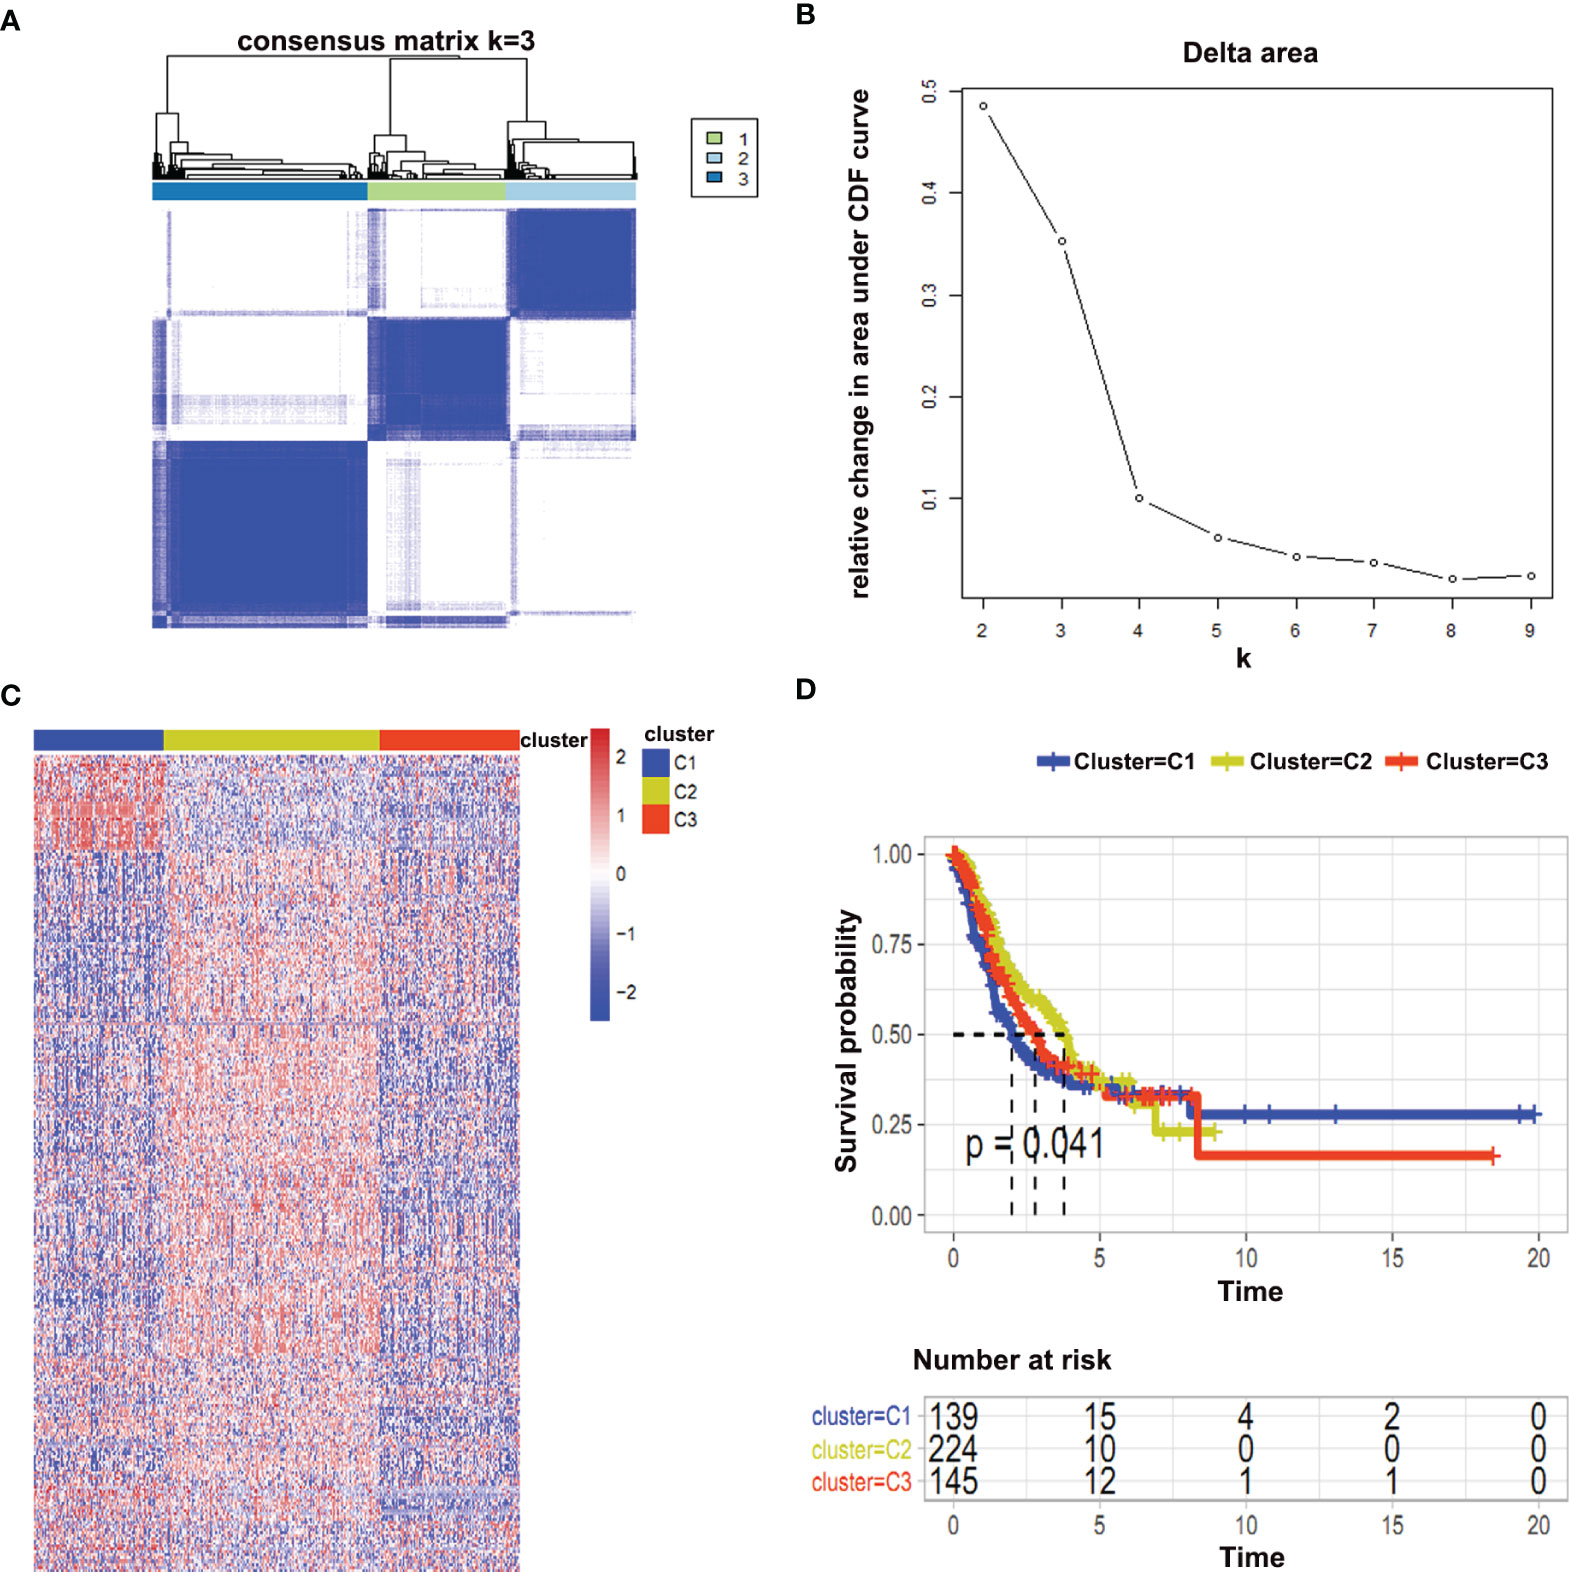
Figure 3 Consistent clustering of immune-related metabolic genes. (A, B) Cumulative distribution function (CDF) represented an optimal number of clusters (k is 3); (C) Heat map represented immune-related metabolic genes in three clusters; (D) Survival analysis between different clusters was shown.
Immune Characteristics of the Three Different Clusters
Furthermore, we were interested to determine immune-related genes in these clusters. We determined those immune-related genes that were involved in antigen‐presentation (B2M, HLA-A, HLA-B, HLA-C, HLA-DPA1, HLA-DQA1, TAP1, TAP2), chemokine-related genes (CCL4, CCL5, CXCL10, CXCL13, CXCL9), immune checkpoint genes (CD226, CD274, CD276, CD40, CTLA4, HAVCR2, LAG3, PDCD1) and genes responsible for the production of cytokines (GZMB, GZMH, IFNG, IL2, PRF1, TNF) expressions. We used a box plot for comparison and found that HLA-DPA1, HLA-DQA1, HLA-B, CXCL13 and CD226 had a high expression within C2 cluster (Figures 4A–D).
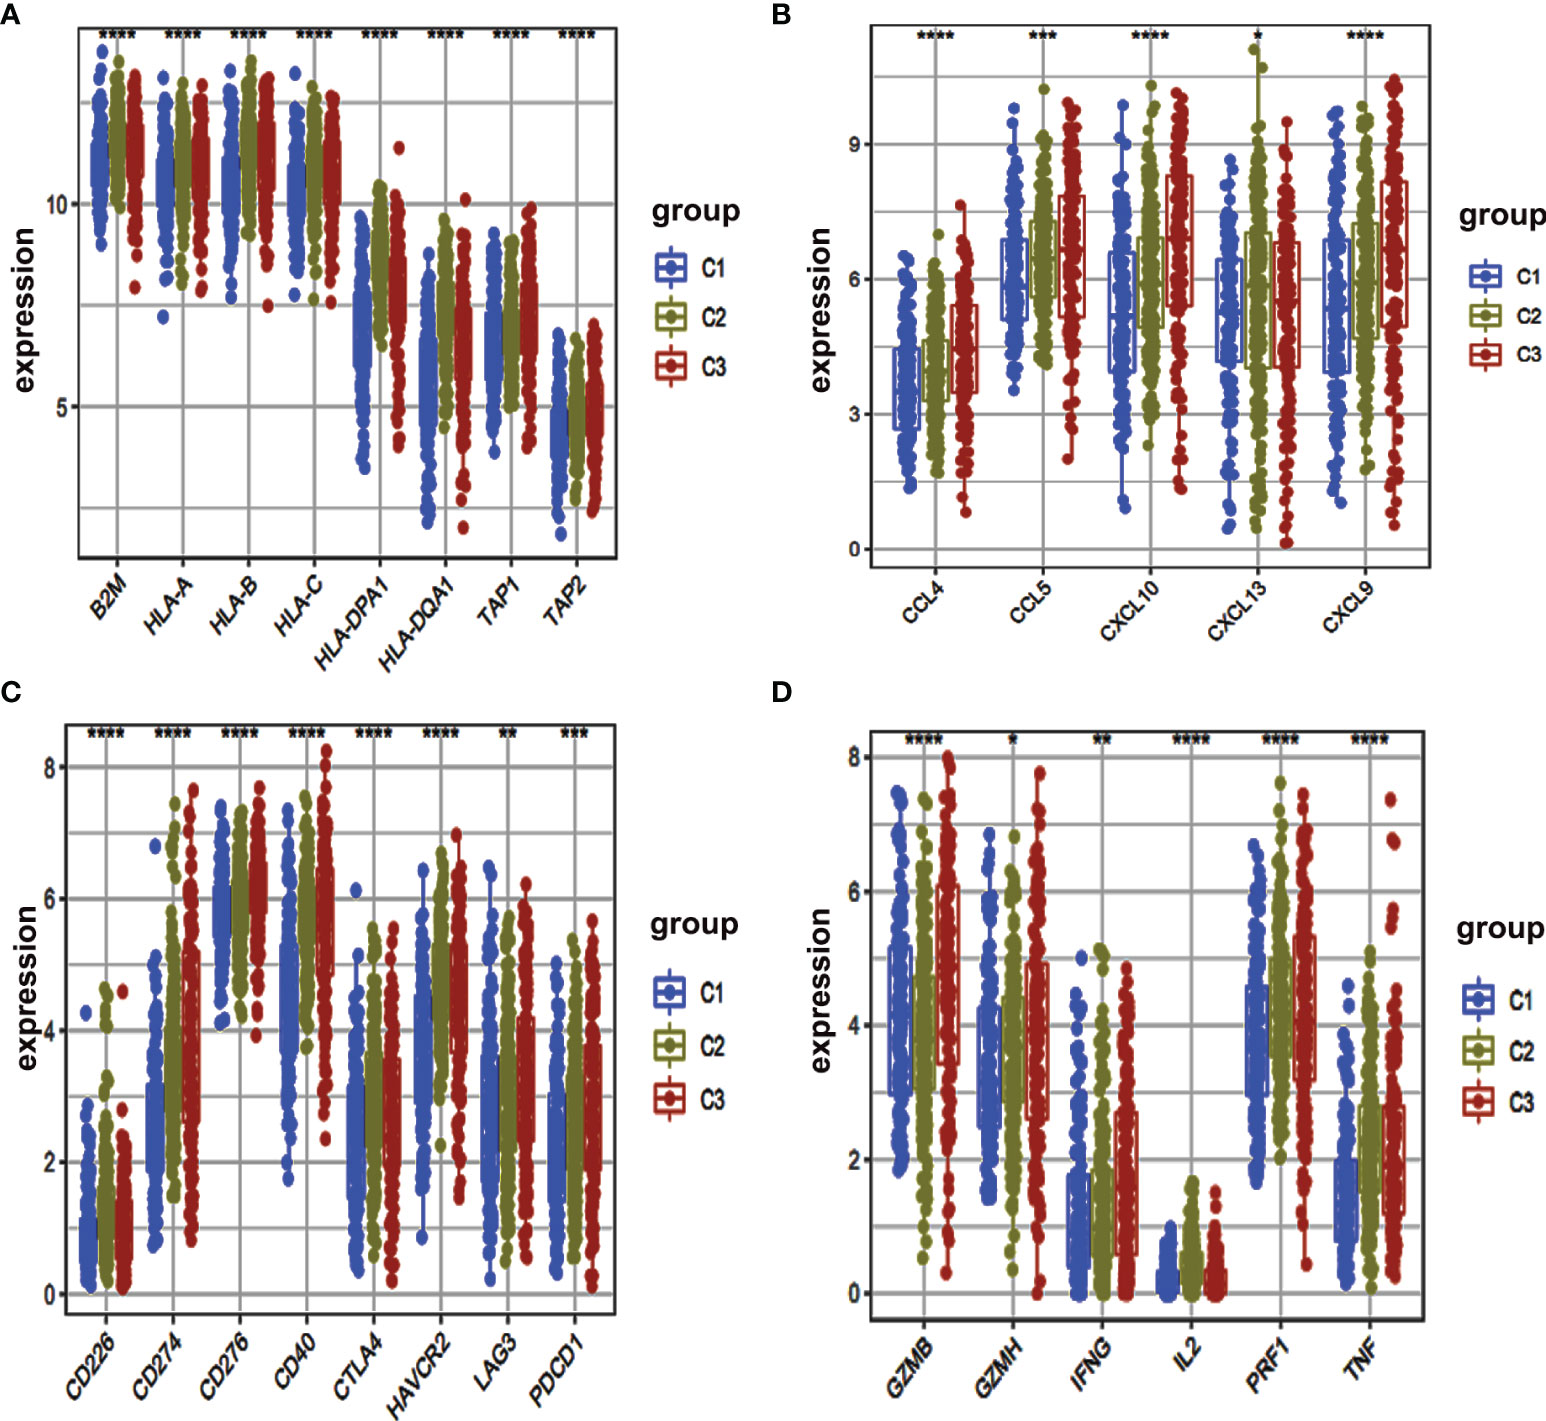
Figure 4 Box plot of immune-related gene expressed among different clusters. (A–D) The expression levels of multiple immune genes were compared in three clusters. *, P < 0.05. **, P < 0.01. ***, P < 0.001. ****, P < 0.0001.
Moreover, we determined infiltration levels of immune cells in these clusters. We used four reported methods (CIBERSORT, MCP-counter, ssGSEA, and Xcell) for this purpose. Two aspects were explored for these clusters i.e. immune effector cells (Figures 5A–D) and immunosuppressive cells (Figures 5E–G). Our analysis delineated that Cluster 1 had the least infiltration of immune effector cells and immunosuppressive cells (Figures 5A–G). This suggests that cluster1 might be the immunologically-cold tumors. Cluster 2 and cluster 3 were found to be enriched in the immunologically-hot tumor immune microenvironment. Both of these clusters were enriched in both immune effector and immunosuppressive cells. Activated B cells, dendritic cells (DC), and monocytes were significantly enriched in cluster 2 (Figures 5A–G). We compared the three different clusters and reached their immune score. The results showed that cluster 2 had higher immune and stromal scores (Figure 5H).
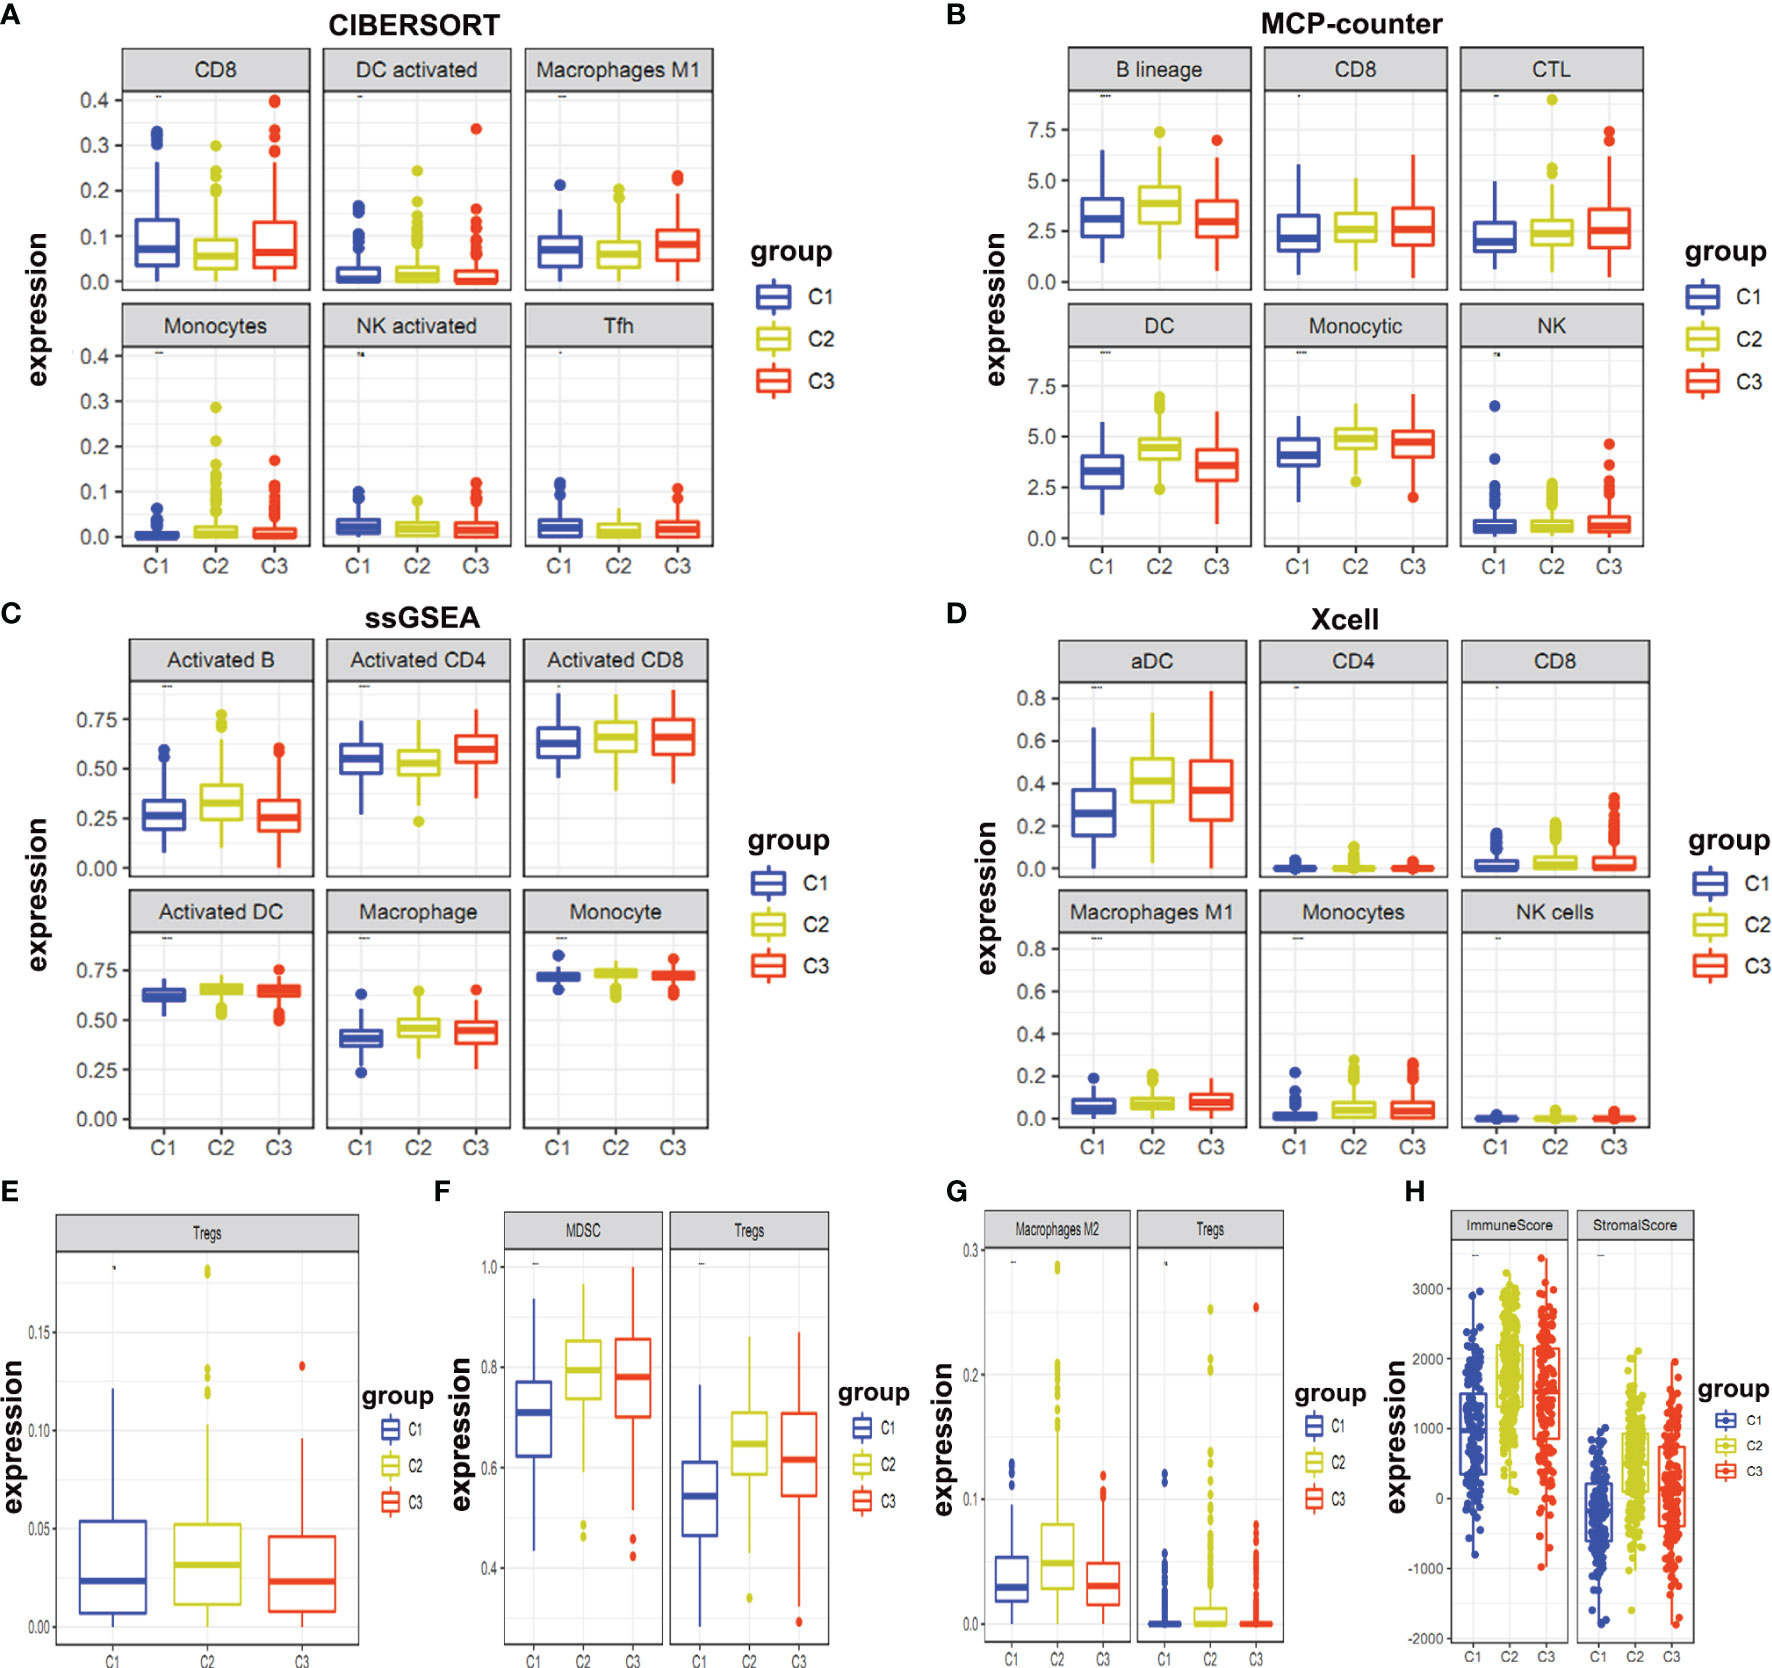
Figure 5 Expression levels of immune infiltration cells. (A–D) Expression levels of immune effector cells between different clusters were shown; (E–G) Immunosuppressive cells in different clusters were shown; (H) Immune and stromal scores in different clusters were shown.
Construction of Prognostic Prediction Models of Immune-Related Metabolic Genes
Next, we were interested in whether these immune-related metabolic genes could be used to predict survival. The LUAD matrix was divided into training (70%) and test (30%) sets. We selected 80 genes having p<0.05 and performed Unicox analysis to compute the regression coefficient (Figures 6A, B). Moreover, multivariate regression was performed to calculate the formula. We identified nine genes that were used to construct a prediction model. These nine genes were, TK1, TCN1, CAV1, ACMSD, HS3ST2, HS3ST5, AMN, ADRA2C, and ACOXL (Figure 6C). Patients were categorized into high and low-risk groups in training and test sets. A survival curve was plotted according to the clinical information of two groups of patients (Figures 6D–F). The results showed that training and test sets with high-risk score patients had a worse Overall Survival (OS) rate than those of low score patients (p <0.0001) (Figures 6D–F). The area under the ROC curves of the predictive model for LUAD has the same performance in the first year, third year, and fifth-year (Training set: AUC at one year: 0.83, AUC at three years: 0.72, AUC at five years: 0.71; Test set: AUC at one year: 0.68, AUC at three years: 0.76, AUC at five years: 0.61) (Figures 6E–G). Moreover, the prediction model was validated using our clinical specimens. The validation results confirmed that the high-risk score group had a worse survival (p <0.0001) (Figures 6H, I). Meanwhile, our prediction model had high accuracy (AUC at one year: 0.74, AUC at three years: 0.83, AUC at four years: 0.78).
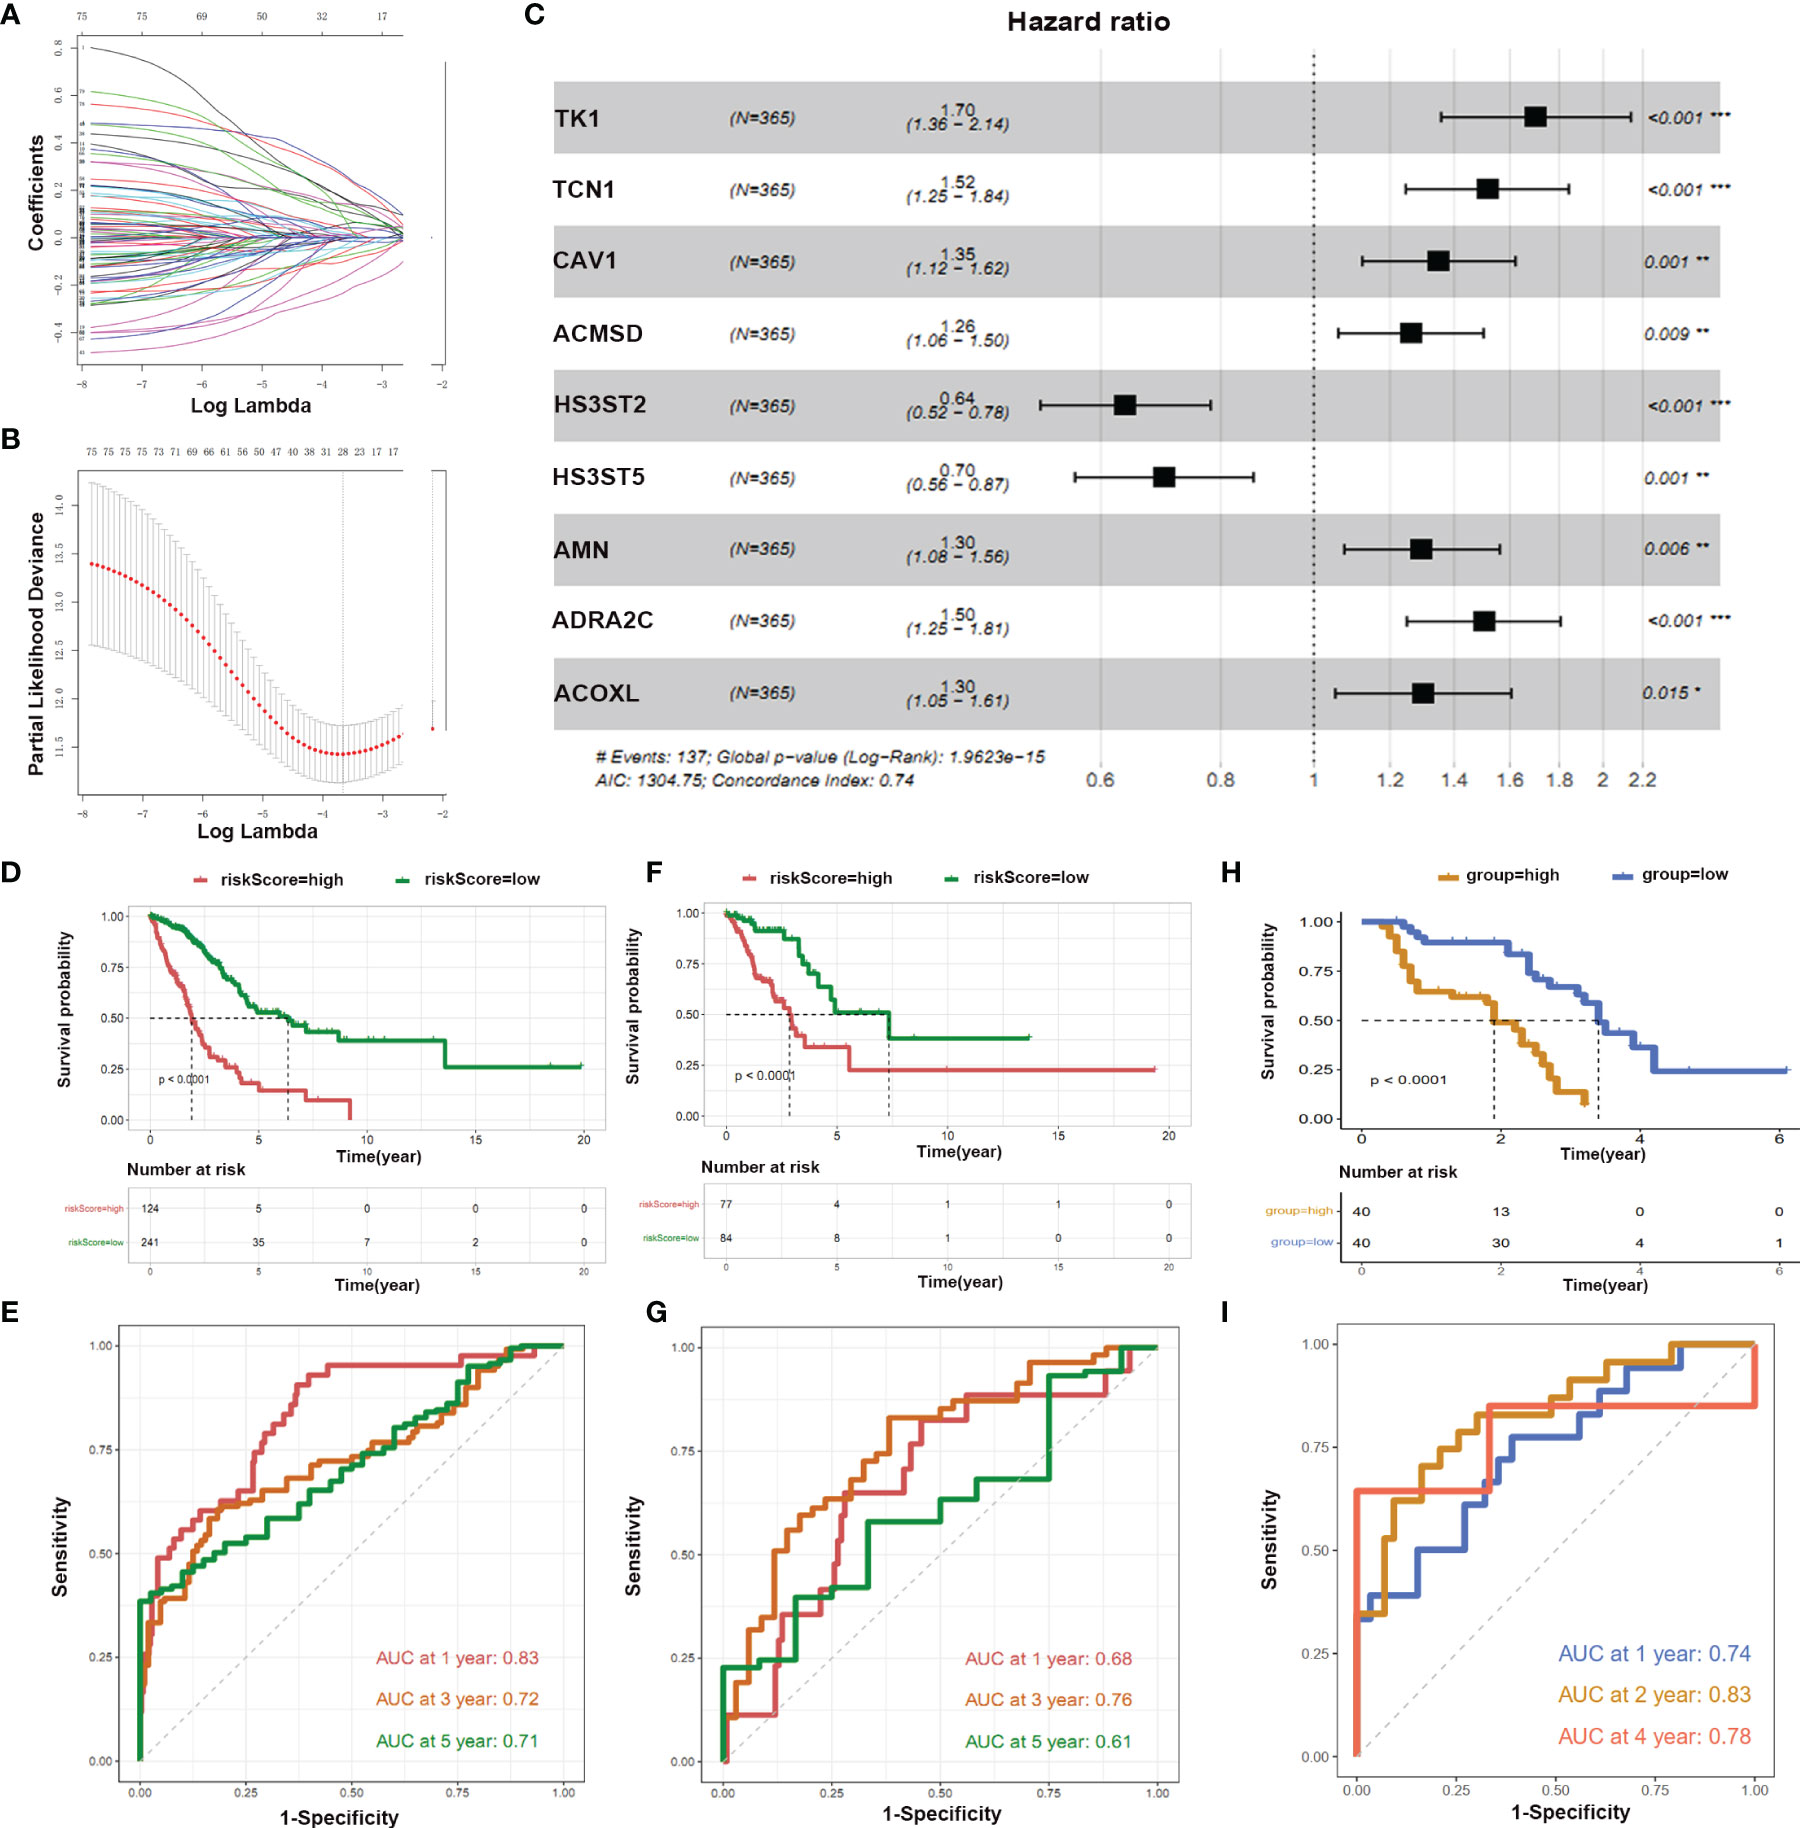
Figure 6 LASSO and hub genes of prognostic model. (A, B) Optimal values of the penalty parameter λ; (C) Multivariate regression analysis of nine genes we shown; (D, F, H) OS in the low score group was significantly higher than in the high score group; (E, G, I) Time-dependent ROC curves analysis of the prediction model.
Identification of Potential Metabolic Targets
As the highly expressed genes in the tumor could be a potential factor to promote tumor growth, therefore, we selected those immune-related metabolic genes whose expression was high in the tumor site (logFC > 1.5, FDR < 0.05). Five potential targets i.e., HMMR, PFKP, RRM2, TCN1, and TK1 were obtained that were negatively correlated with survival rate (Figure S4). The expression of five hub genes in pan-carcinoma was shown (Figure S5). The correlation of the four genes HMMR, PFKP, TCN1, and TK1 with tumor-infiltrating immune cells and the survival curve in lung cancer was shown (Figure S6). Furthermore, we determined the expression levels of five hub genes in our clinical specimens. We found that the expression of RRM2 was higher in tumor tissues (Figures 7A–E). Similarly, the expression level of RRM2 was significantly higher in lung cancer cell lines (A549, NCL-H292, and Calu-3) compared to normal lung epithelial cell line (BEAS-2B) (Figure 7F). The survival curves of RRM2 and immune cell infiltration in lung cancer patients were determined. The overall survival of lung cancer patients showed that low RRM2 expression had a better prognosis (p=0.000015) (Figure 7G), and disease-free survival also suggested that patients with low RRM2 expression had a better prognosis (p=0.019) (Figure 7H). The relationship with immune cells showed that RRM2 was associated with tumor infiltration by B cells and Neutrophils (Figure 7I).
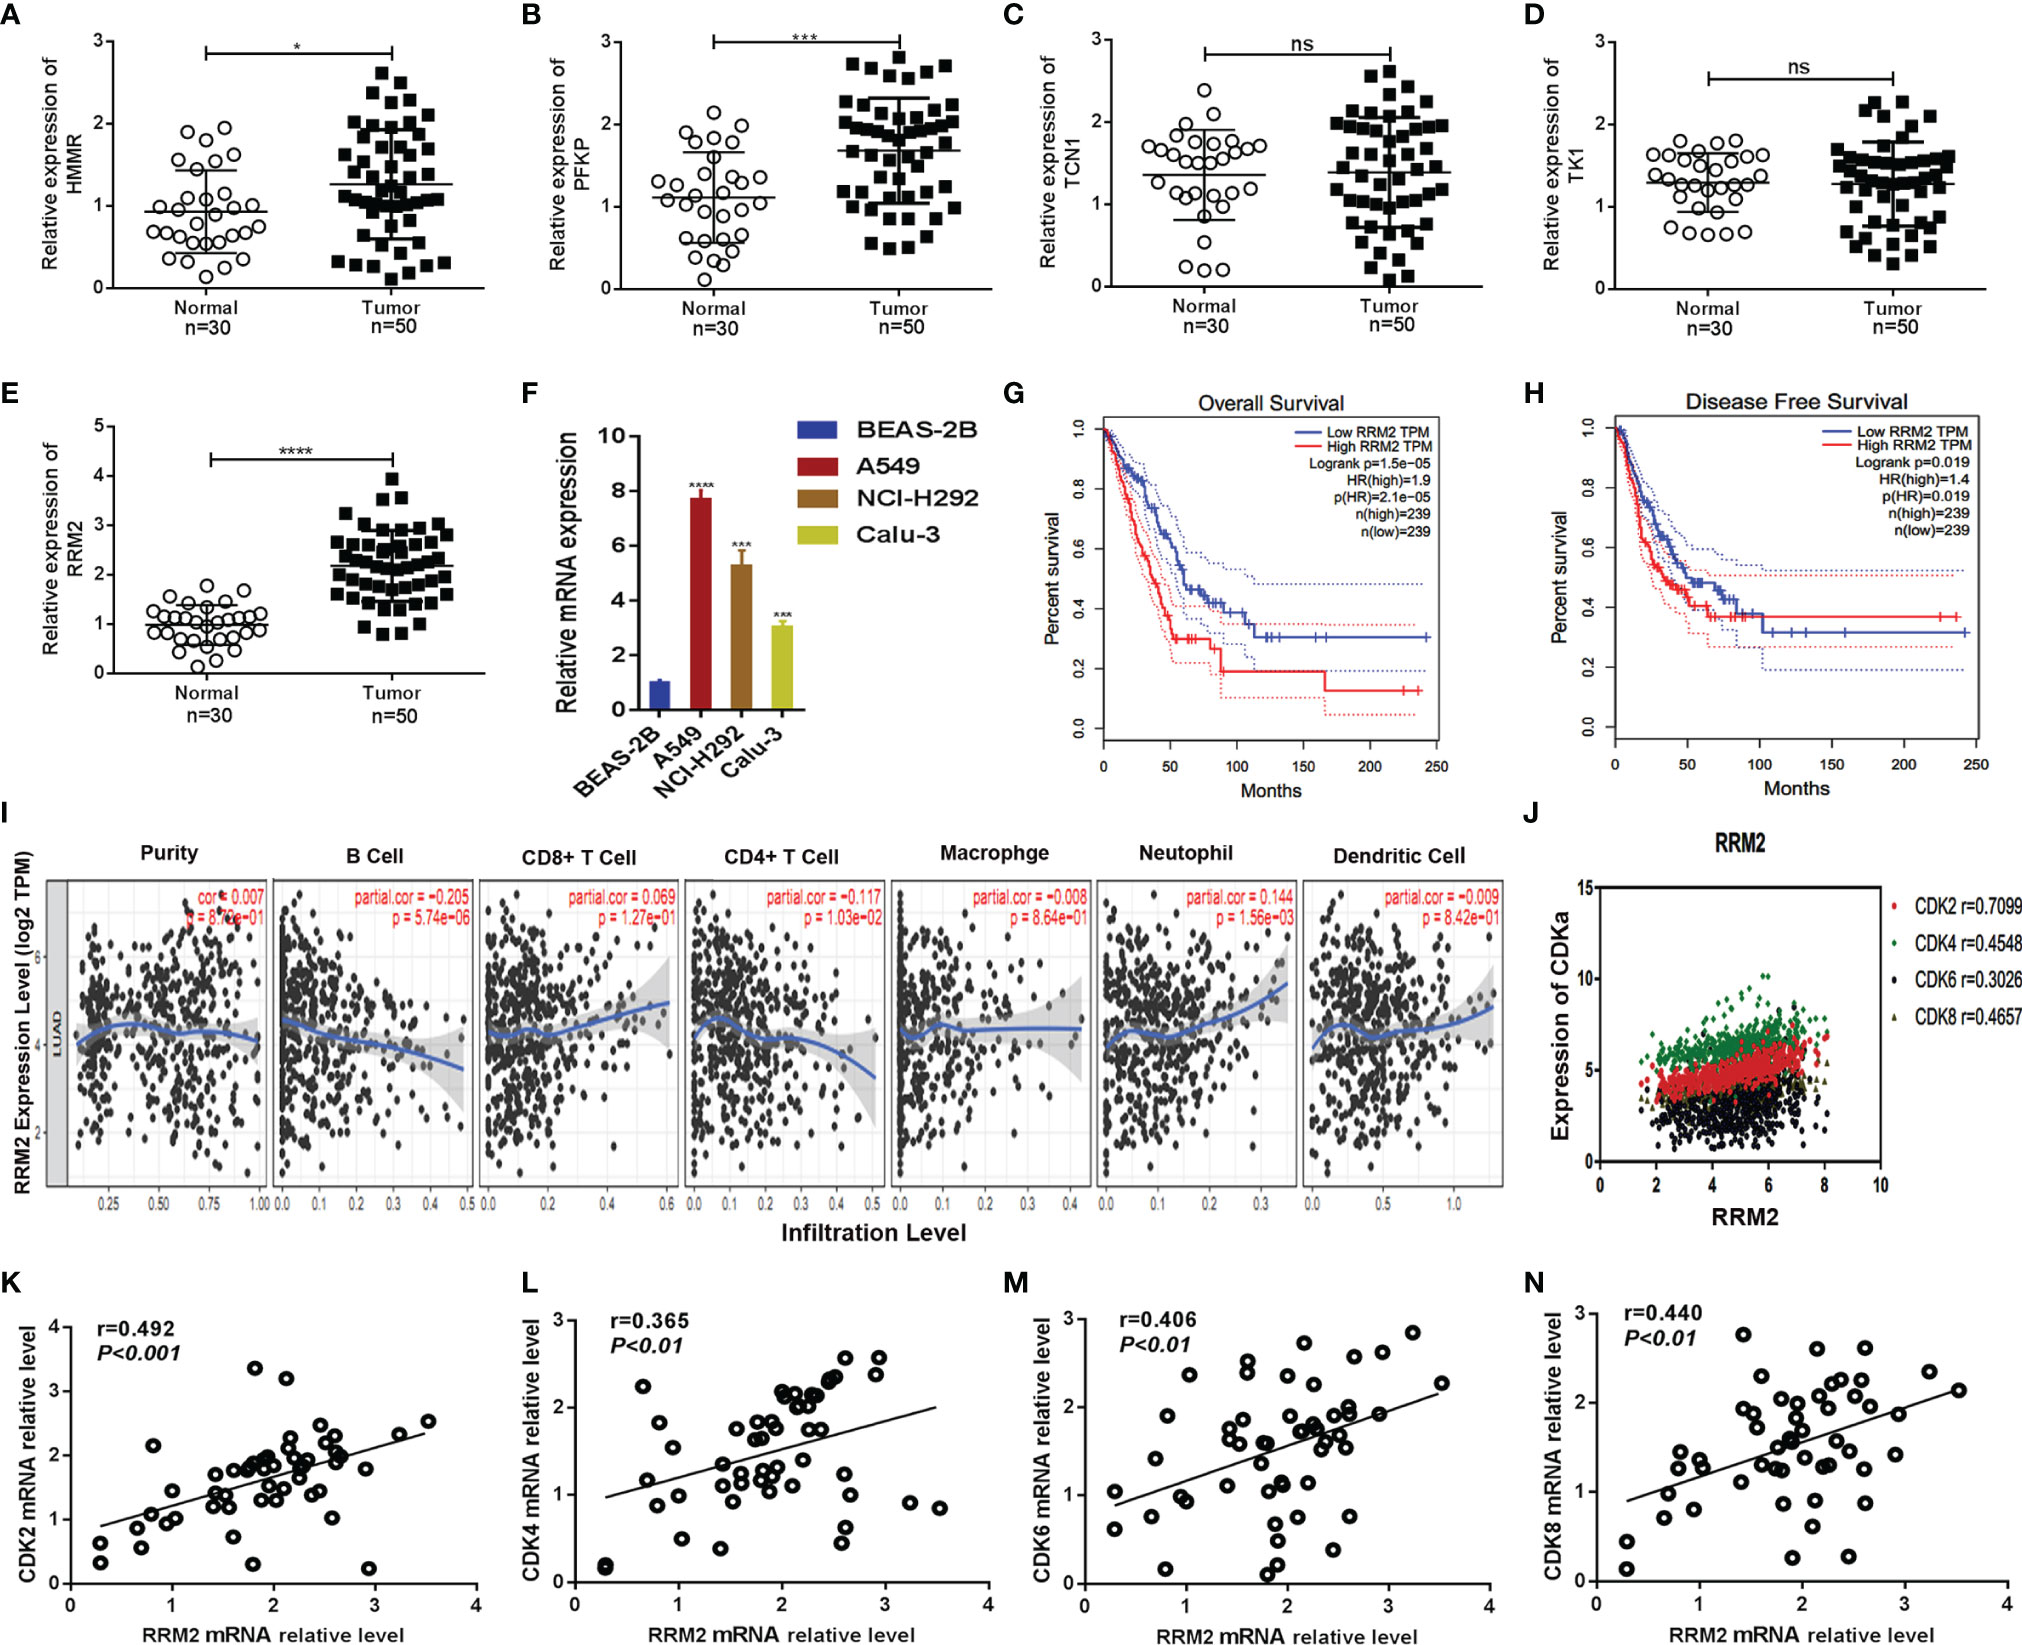
Figure 7 RRM2 was related to survival time and CDK family. (A–E) Expression levels of HMMR, PFKP, TCN1, TK1, and RRM2 in non-cancerous tissues (n = 30)and LUAD tissues (n=50) were detected by qRT-PCR. GAPDH was used as an internal control; (F) RRM2 expression levels in different cell lines were determined by qRT-PCR. GAPDH was used as an internal control; (G, H) Kaplan–Meier analysis was performed to assess the association of RRM2 expression with overall survival and disease-free survival in LUAD patients using the TCGA databases; (I) Correlation of RRM2 with immune cell infiltration in lung cancer; (J–N) Association of RRM2 with the CDK2 family of proteins. *, P < 0.05. **, P < 0.01. ***, P < 0.001. ****, P < 0.0001. ns : Not Statistically Significant.
To determine the function of RRM2, GO and KEGG analyses were performed to find correlated genes with RRM2 (Figure S7). The RRM2-related genes were mainly enriched in catalytic activities, acting on DNA as determined by GO analysis. While KEGG pathway enrichment analysis showed that RRM2-related genes were mainly enriched in cell cycle regulation. Moreover, the correlation between the RRM2 gene and the CDK family of genes was analyzed. This result showed that the RRM2 gene was highly related to the CDK family of proteins (Figure 7J). We also found the same results in tumor samples analyzed by qPCR, showing that this gene was associated with CDK family of proteins. Our results delineated that the expression levels of RRM2, CDK2 (r=0.492, p<0.001), CDK4 (r=0.365, p<0.01), CDK6 (r=0.406, p<0.01) and CDK8 (r=0.440, p<0.01) were positively correlated, which means that RRM2 was significantly correlated with cell cycle signaling (Figures 7K–N).
Discussion
Our study identified five potential metabolic checkpoints of LUAD and RRM2 was chosen for further analyses. The expression of RRM2 was significantly higher in both lung cancer tissues and cell lines. In the current study, we disseminated the possible pathways regulated by RRM2 in lung cancer. We further showed that the cell cycle could be regulated by RRM2.
Tumor microenvironment infiltration is closely related to immunotherapy effectiveness. The critical role of immune-related metabolic genes and immune cells in cancer is gradually being unveiled. Therefore, we were interested to find immune-related genes that play a role in immune infiltration and could produce a better immunotherapy effect. In our study, the immune-related genes were obtained from the website, https://www.immport.org/. The metabolism-related genes were downloaded from work published by Peng, X. We performed different analyses and identified ten immune-related metabolic genes. These genes were, SDC2, GPC3, GPC1, HSPG2, AGRN, GPC2, GPC5, GPC4, GPC6, and VCAN. These genes play important roles in the immune-related mechanisms of several cancers (colorectal (32), cervical (33), liver (34), pancreatic cancer (35), etc). Immune infiltration of tumor microenvironment in glioblastoma multiforme, breast cancer, and lung cancer play a vital role in immunotherapy and the increase in the degree of immune infiltration is related to better immunotherapy effect (36–39).
To explore the specific mechanisms of these immune-related metabolic genes, the samples were divided into three clusters. The levels of immune cell infiltration, immune scores, and clinicopathological information were compared. We found that among all clusters, cluster2 had prolonged survival at the early stages of the disease. HLA-DPA1, CXCL13, activated B cells, DC, and monocytes infiltration were highly expressed in cluster 2. HLA-DPA1 is involved in immune responses and antigenic peptides presentation (40). Previous studies demonstrated that down-regulation of HLA-DPA1 expression is related to the poor prognosis of tumors and may be a potential prognostic biomarker for ESCC (41–43). Therefore, higher expression of HLA-DPA1 in cluster 2 could well represent the prolonged survival of LUAD patients. The CXCL13/CXCR5 signal axis plays a vital role in the occurrence and development of several human cancers (44). The prognosis was found better in cluster 2 compared to cluster1 and cluster3. The pathways related to B cells play important role in tumor immunotherapy (45, 46). Similarly, monocytes also play an important role in antigen presentation in the microenvironment of tumor immune infiltration (47, 48).
Furthermore, nine genes TK1, TCN1, CAV1, ACMSD, HS3ST2, HS3ST5, AMN, ADRA2C, and ACOXL were identified for the construction of prediction model. Our findings are parallel with previous findings. TK1, TCN1, CAV1, and HS3ST2 play indispensable roles in survival predictions and pathogenesis of various cancers (49–55).
Finally, we obtained five potential metabolic checkpoints of LUAD. These were, HMMR, PFKP, RRM2, TCN1 and TK1. By comparing their expression levels and their association with immune cells in pan-cancer and lung cancer clinical samples, we identified a critical role for RRM2 in LUAD. RRM2 is a rate-limiting enzyme which is involved in DNA synthesis and repair. It also plays a vital role in many critical cellular processes, such as cell proliferation, invasiveness, migration, angiogenesis, and aging (56). In breast cancer, RRM2 overexpression in cancer cells promotes the formation and invasion of 3D colonies (57). In liver cancer (58), RRM2 can inhibit hypertrophy by stimulating GSS to synthesize GSH. In LUAD, RRM2 has been determined to have an independent prognostic significance. RRM2 expression levels have significant correlations with B cells, CD4+ T cells, and neutrophil infiltration (59). We also determined that RRM2 was highly related to the CDK family of proteins. As Cyclin-dependent kinases 4 and 6 (CDK4/6) are important regulators of cell cycle and inhibit the proliferation of regulatory T cells (60). Therefore, RRM2 could also be involved in cell cycle regulation. Our findings further confirmed the relationship of RRM2 with immunity and metabolism in LUAD. Moreover, our study provided a base and theoretical support for exploring the immunotherapy of LUAD.
Conclusions
In this study, we first identified the vital role of immune-related metabolic genes in lung adenocarcinoma’s immune and clinicopathological aspects. We clustered three subtypes of LUAD based on immune-related metabolic genes and these subtypes exhibited different survival and immune status. We identified nine genes i.e., TK1、TCN1、CAV1、ACMSD、HS3ST2、HS3ST5、AMN、ADRA2C, and ACOXL that were used to construct a prediction model. Finally, RRM2 was determined as a promising metabolism checkpoint for LUAD and explored its close relationship with the CDK family of proteins. Our results are therefore, helpful for the study of immunotherapy and immune-related metabolic genes in LUAD.
Data Availability Statement
The datasets presented in this study can be found in online repositories. The names of the repository/repositories and accession number(s) can be found in the article/Supplementary Material. All analyses were performed using R version 3.6.3.
Ethics Statement
The studies involving human participants were reviewed and approved by the First Affiliated Hospital of Zhengzhou University approved the study (Ethics number: 2020-KS-HNSR188). The patients/participants provided their written informed consent to participate in this study.
Author Contributions
FL: Conceptualization of the study. CH and LQ: Analyzed the data. PL: Drafted the manuscript. JS: Conducted the experiments and revised manuscript. GZ: Guided on the quality of the research. All authors read and approved the submission of the final manuscript.
Conflict of Interest
The authors declare that the research was conducted in the absence of any commercial or financial relationships that could be construed as a potential conflict of interest.
Publisher’s Note
All claims expressed in this article are solely those of the authors and do not necessarily represent those of their affiliated organizations, or those of the publisher, the editors and the reviewers. Any product that may be evaluated in this article, or claim that may be made by its manufacturer, is not guaranteed or endorsed by the publisher.
Acknowledgments
We thank the TCGA program for the RNA-sequence and clinical data of patients with lung adenocarcinoma.
Supplementary Material
The Supplementary Material for this article can be found online at: https://www.frontiersin.org/articles/10.3389/fendo.2022.894754/full#supplementary-material
Abbreviations
TCGA, The Cancer Genome Atlas; KEGG, Kyoto Encyclopedia of Genes and Genomes; GO, Gene Ontology; DEGs, differentially expressed genes; LUAD, Lung adenocarcinoma; ssGSEA, single sample gene set enrichment analysis; TME, tumor microenvironment; PPI, protein-protein interaction.
References
1. Jordan EJ, Kim HR, Arcila ME, Barron D, Chakravarty D, Gao J, et al. Prospective Comprehensive Molecular Characterization of Lung Adenocarcinomas for Efficient Patient Matching to Approved and Emerging Therapies. Cancer Discovery (2017) 7(6):596–609. doi: 10.1158/2159-8290.CD-16-1337
2. Siegel RL, Miller KD, Jemal A. Cancer Statistics, 2019. CA Cancer J Clin (2019) 69(1):7–34. doi: 10.3322/caac.21551
3. Ferlay J, Colombet M, Soerjomataram I, Mathers C, Parkin DM, Pineros M, et al. Estimating the Global Cancer Incidence and Mortality in 2018: GLOBOCAN Sources and Methods. Int J Cancer (2019) 144(8):1941–53. doi: 10.1002/ijc.31937
4. Cancer Genome Atlas Research N. Author Correction: Comprehensive Molecular Profiling of Lung Adenocarcinoma. Nature (2018) 559(7715):E12. doi: 10.1038/s41586-018-0228-6
5. Cancer Genome Atlas Research N. Comprehensive Molecular Profiling of Lung Adenocarcinoma. Nature (2014) 511(7511):543–50. doi: 10.1038/nature13385
6. Wood SL, Pernemalm M, Crosbie PA, Whetton AD. The Role of the Tumor-Microenvironment in Lung Cancer-Metastasis and its Relationship to Potential Therapeutic Targets. Cancer Treat Rev (2014) 40(4):558–66. doi: 10.1016/j.ctrv.2013.10.001
7. Quail DF, Joyce JA. Microenvironmental Regulation of Tumor Progression and Metastasis. Nat Med (2013) 19(11):1423–37. doi: 10.1038/nm.3394
9. Husby G, Hoagland PM, Strickland RG, Williams RC Jr. Tissue T and B Cell Infiltration of Primary and Metastatic Cancer. J Clin Invest (1976) 57(6):1471–82. doi: 10.1172/JCI108417
10. Buck MD, Sowell RT, Kaech SM, Pearce EL. Metabolic Instruction of Immunity. Cell (2017) 169(4):570–86. doi: 10.1016/j.cell.2017.04.004
11. Kesarwani P, Kant S, Prabhu A, Chinnaiyan P. The Interplay Between Metabolic Remodeling and Immune Regulation in Glioblastoma. Neuro Oncol (2017) 19(10):1308–15. doi: 10.1093/neuonc/nox079
12. Aird KM, Zhang R. Metabolic Alterations Accompanying Oncogene-Induced Senescence. Mol Cell Oncol (2014) 1(3):e963481. doi: 10.4161/23723548.2014.963481
13. Zheng Y, Delgoffe GM, Meyer CF, Chan W, Powell JD. Anergic T Cells are Metabolically Anergic. J Immunol (2009) 183(10):6095–101. doi: 10.4049/jimmunol.0803510
14. Biswas SK. Metabolic Reprogramming of Immune Cells in Cancer Progression. Immunity (2015) 43(3):435–49. doi: 10.1016/j.immuni.2015.09.001
15. Kishton RJ, Barnes CE, Nichols AG, Cohen S, Gerriets VA, Siska PJ, et al. AMPK Is Essential to Balance Glycolysis and Mitochondrial Metabolism to Control T-ALL Cell Stress and Survival. Cell Metab (2016) 23(4):649–62. doi: 10.1016/j.cmet.2016.03.008
16. Chan LN, Chen Z, Braas D, Lee JW, Xiao G, Geng H, et al. Metabolic Gatekeeper Function of B-Lymphoid Transcription Factors. Nature (2017) 542(7642):479–83. doi: 10.1038/nature21076
17. Lou Y, Diao L, Cuentas ER, Denning WL, Chen L, Fan YH, et al. Epithelial-Mesenchymal Transition Is Associated With a Distinct Tumor Microenvironment Including Elevation of Inflammatory Signals and Multiple Immune Checkpoints in Lung Adenocarcinoma. Clin Cancer Res (2016) 22(14):3630–42. doi: 10.1158/1078-0432.CCR-15-1434
18. Luo J, Solimini NL, Elledge SJ. Principles of Cancer Therapy: Oncogene and non-Oncogene Addiction. Cell (2009) 136(5):823–37. doi: 10.1016/j.cell.2009.02.024
19. Peng X, Chen Z, Farshidfar F, Xu X, Lorenzi PL, Wang Y, et al. Molecular Characterization and Clinical Relevance of Metabolic Expression Subtypes in Human Cancers. Cell Rep (2018) 23(1):255–69.e254. doi: 10.1016/j.celrep.2018.03.077
20. Yu G, Wang LG, Han Y, He QY. Clusterprofiler: An R Package for Comparing Biological Themes Among Gene Clusters. OMICS (2012) 16(5):284–7. doi: 10.1089/omi.2011.0118
21. Harris MA, Clark J, Ireland A, Lomax J, Ashburner M, Foulger R, et al. The Gene Ontology (GO) Database and Informatics Resource. Nucleic Acids Res (2004) 32(Database issue):D258–261. doi: 10.1093/nar/gkh036
22. Ogata H, Goto S, Sato K, Fujibuchi W, Bono H, Kanehisa M. KEGG: Kyoto Encyclopedia of Genes and Genomes. Nucleic Acids Res (1999) 27(1):29–34. doi: 10.1093/nar/27.1.29
23. von Mering C, Huynen M, Jaeggi D, Schmidt S, Bork P, Snel B. STRING: A Database of Predicted Functional Associations Between Proteins. Nucleic Acids Res (2003) 31(1):258–61. doi: 10.1093/nar/gkg034
24. Shannon P, Markiel A, Ozier O, Baliga NS, Wang JT, Ramage D, et al. Cytoscape: A Software Environment for Integrated Models of Biomolecular Interaction Networks. Genome Res (2003) 13(11):2498–504. doi: 10.1101/gr.1239303
25. Diboun I, Wernisch L, Orengo CA, Koltzenburg M. Microarray Analysis After RNA Amplification can Detect Pronounced Differences in Gene Expression Using Limma. BMC Genomics (2006) 7:252. doi: 10.1186/1471-2164-7-252
26. Newman AM, Liu CL, Green MR, Gentles AJ, Feng W, Xu Y, et al. Robust Enumeration of Cell Subsets From Tissue Expression Profiles. Nat Methods (2015) 12(5):453–7. doi: 10.1038/nmeth.3337
27. Barbie DA, Tamayo P, Boehm JS, Kim SY, Moody SE, Dunn IF, et al. Systematic RNA Interference Reveals That Oncogenic KRAS-Driven Cancers Require TBK1. Nature (2009) 462(7269):108–12. doi: 10.1038/nature08460
28. Becht E, Giraldo NA, Lacroix L, Buttard B, Elarouci N, Petitprez F, et al. Estimating the Population Abundance of Tissue-Infiltrating Immune and Stromal Cell Populations Using Gene Expression. Genome Biol (2016) 17(1):218. doi: 10.1186/s13059-016-1070-5
29. Aran D, Hu Z, Butte AJ. Xcell: Digitally Portraying the Tissue Cellular Heterogeneity Landscape. Genome Biol (2017) 18(1):220. doi: 10.1186/s13059-017-1349-1
30. Friedman J, Hastie T, Tibshirani R. Regularization Paths for Generalized Linear Models via Coordinate Descent. J Stat Softw (2010) 33(1):1–22. doi: 10.18637/jss.v033.i01
31. Sauerbrei W, Royston P, Binder H. Selection of Important Variables and Determination of Functional Form for Continuous Predictors in Multivariable Model Building. Stat Med (2007) 26(30):5512–28. doi: 10.1002/sim.3148
32. Han YD, Oh TJ, Chung TH, Jang HW, Kim YN, An S, et al. Early Detection of Colorectal Cancer Based on Presence of Methylated Syndecan-2 (SDC2) in Stool DNA. Clin Epigenet (2019) 11(1):51. doi: 10.1186/s13148-019-0642-0
33. Hu R, Zhu Z. ELK1-Activated GPC3-AS1/GPC3 Axis Promotes the Proliferation and Migration of Cervical Cancer Cells. J Gene Med (2019) 21(8):e3099. doi: 10.1002/jgm.3099
34. Fu J, Wang H. Precision Diagnosis and Treatment of Liver Cancer in China. Cancer Lett (2018) 412:283–8. doi: 10.1016/j.canlet.2017.10.008
35. Melo SA, Luecke LB, Kahlert C, Fernandez AF, Gammon ST, Kaye J, et al. Glypican-1 Identifies Cancer Exosomes and Detects Early Pancreatic Cancer. Nature (2015) 523(7559):177–82. doi: 10.1038/nature14581
36. Sokratous G, Polyzoidis S, Ashkan K. Immune Infiltration of Tumor Microenvironment Following Immunotherapy for Glioblastoma Multiforme. Hum Vaccin Immunother (2017) 13(11):2575–82. doi: 10.1080/21645515.2017.1303582
37. Burugu S, Asleh-Aburaya K, Nielsen TO. Immune Infiltrates in the Breast Cancer Microenvironment: Detection, Characterization and Clinical Implication. Breast Cancer (2017) 24(1):3–15. doi: 10.1007/s12282-016-0698-z
38. Liu X, Wu S, Yang Y, Zhao M, Zhu G, Hou Z. The Prognostic Landscape of Tumor-Infiltrating Immune Cell and Immunomodulators in Lung Cancer. BioMed Pharmacother (2017) 95:55–61. doi: 10.1016/j.biopha.2017.08.003
39. Chen DS, Mellman I. Oncology Meets Immunology: The Cancer-Immunity Cycle. Immunity (2013) 39(1):1–10. doi: 10.1016/j.immuni.2013.07.012
40. Diaz G, Amicosante M, Jaraquemada D, Butler RH, Guillen MV, Sanchez M, et al. Functional Analysis of HLA-DP Polymorphism: A Crucial Role for DPbeta Residues 9, 11, 35, 55, 56, 69 and 84-87 in T Cell Allorecognition and Peptide Binding. Int Immunol (2003) 15(5):565–76. doi: 10.1093/intimm/dxg057
41. Rimsza LM, Roberts RA, Miller TP, Unger JM, LeBlanc M, Braziel RM, et al. Loss of MHC Class II Gene and Protein Expression in Diffuse Large B-Cell Lymphoma Is Related to Decreased Tumor Immunosurveillance and Poor Patient Survival Regardless of Other Prognostic Factors: A Follow-Up Study From the Leukemia and Lymphoma Molecular Profiling Project. Blood (2004) 103(11):4251–8. doi: 10.1182/blood-2003-07-2365
42. Meissner M, Konig V, Hrgovic I, Valesky E, Kaufmann R. Human Leucocyte Antigen Class I and Class II Antigen Expression in Malignant Fibrous Histiocytoma, Fibrosarcoma and Dermatofibrosarcoma Protuberans is Significantly Downregulated. J Eur Acad Dermatol Venereol (2010) 24(11):1326–32. doi: 10.1111/j.1468-3083.2010.03644.x
43. Hillman GG, Kallinteris NL, Lu X, Wang Y, Wright JL, Li Y, et al. Turning Tumor Cells in Situ Into T-Helper Cell-Stimulating, MHC Class II Tumor Epitope-Presenters: Immuno-Curing and Immuno-Consolidation. Cancer Treat Rev (2004) 30(3):281–90. doi: 10.1016/j.ctrv.2003.08.002
44. Hussain M, Adah D, Tariq M, Lu Y, Zhang J, Liu J. CXCL13/CXCR5 Signaling Axis in Cancer. Life Sci (2019) 227:175–86. doi: 10.1016/j.lfs.2019.04.053
45. Tokunaga R, Naseem M, Lo JH, Battaglin F, Soni S, Puccini A, et al. B Cell and B Cell-Related Pathways for Novel Cancer Treatments. Cancer Treat Rev (2019) 73:10–9. doi: 10.1016/j.ctrv.2018.12.001
46. Franchina DG, Grusdat M, Brenner D. B-Cell Metabolic Remodeling and Cancer. Trends Cancer (2018) 4(2):138–50. doi: 10.1016/j.trecan.2017.12.006
47. Riemann D, Cwikowski M, Turzer S, Giese T, Grallert M, Schutte W, et al. Blood Immune Cell Biomarkers in Lung Cancer. Clin Exp Immunol (2019) 195(2):179–89. doi: 10.1111/cei.13219
48. Sabado RL, Balan S, Bhardwaj N. Dendritic Cell-Based Immunotherapy. Cell Res (2017) 27(1):74–95. doi: 10.1038/cr.2016.157
49. Wang Y, Jiang X, Wang S, Yu H, Zhang T, Xu S, et al. Serological TK1 Predict Pre-Cancer in Routine Health Screenings of 56,178 People. Cancer biomark (2018) 22(2):237–47. doi: 10.3233/CBM-170846
50. Togar T, Desai S, Mishra R, Terwadkar P, Ramteke M, Ranjan M, et al. Identifying Cancer Driver Genes From Functional Genomics Screens. Swiss Med Wkly (2020) 150:w20195. doi: 10.4414/smw.2020.20195
51. Ketteler J, Klein D. Caveolin-1, Cancer and Therapy Resistance. Int J Cancer (2018) 143(9):2092–104. doi: 10.1002/ijc.31369
52. Vijaya Kumar A, Salem Gassar E, Spillmann D, Stock C, Sen YP, Zhang T, et al. HS3ST2 Modulates Breast Cancer Cell Invasiveness via MAP Kinase- and Tcf4 (Tcf7l2)-Dependent Regulation of Protease and Cadherin Expression. Int J Cancer (2014) 135(11):2579–92. doi: 10.1002/ijc.28921
53. Chen CS, Lin LW, Hsieh CC, Chen GW, Peng WH, Hsieh MT. Differential Gene Expression in Hemodialysis Patients With "Cold" Zheng. Am J Chin Med (2006) 34(3):377–85. doi: 10.1142/S0192415X06003916
54. Nakamura T, Satoh-Nakamura T, Nakajima A, Kawanami T, Sakai T, Fujita Y, et al. Impaired Expression of Innate Immunity-Related Genes in IgG4-Related Disease: A Possible Mechanism in the Pathogenesis of IgG4-Rd. Mod Rheumatol (2020) 30(3):551–7. doi: 10.1080/14397595.2019.1621475
55. Codrici E, Albulescu L, Popescu ID, Mihai S, Enciu AM, Albulescu R, et al. Caveolin-1-Knockout Mouse as a Model of Inflammatory Diseases. J Immunol Res (2018) 2018:2498576. doi: 10.1155/2018/2498576
56. Nordlund P, Reichard P. Ribonucleotide Reductases. Annu Rev Biochem (2006) 75:681–706. doi: 10.1146/annurev.biochem.75.103004.142443
57. Shah KN, Wilson EA, Malla R, Elford HL, Faridi JS. Targeting Ribonucleotide Reductase M2 and NF-kappaB Activation With Didox to Circumvent Tamoxifen Resistance in Breast Cancer. Mol Cancer Ther (2015) 14(11):2411–21. doi: 10.1158/1535-7163.MCT-14-0689
58. Yang Y, Lin J, Guo S, Xue X, Wang Y, Qiu S, et al. RRM2 Protects Against Ferroptosis and is a Tumor Biomarker for Liver Cancer. Cancer Cell Int (2020) 20(1):587. doi: 10.1186/s12935-020-01689-8
59. Ma C, Luo H, Cao J, Gao C, Fa X, Wang G. Independent Prognostic Implications of RRM2 in Lung Adenocarcinoma. J Cancer (2020) 11(23):7009–22. doi: 10.7150/jca.47895
Keywords: lung cancer, immune, metabolic, TCGA, immunotherapy
Citation: Li F, Huang C, Qiu L, Li P, Shi J and Zhang G (2022) Comprehensive Analysis of Immune-Related Metabolic Genes in Lung Adenocarcinoma. Front. Endocrinol. 13:894754. doi: 10.3389/fendo.2022.894754
Received: 12 March 2022; Accepted: 06 June 2022;
Published: 08 July 2022.
Edited by:
Rick Francis Thorne, The University of Newcastle, AustraliaReviewed by:
Niaz Muhammad, Minhaj University Lahore, PakistanRanjha Khan, University of Science and Technology of China, China
Copyright © 2022 Li, Huang, Qiu, Li, Shi and Zhang. This is an open-access article distributed under the terms of the Creative Commons Attribution License (CC BY). The use, distribution or reproduction in other forums is permitted, provided the original author(s) and the copyright owner(s) are credited and that the original publication in this journal is cited, in accordance with accepted academic practice. No use, distribution or reproduction is permitted which does not comply with these terms.
*Correspondence: Guojun Zhang, emdqQHp6dS5lZHUuY24=