
94% of researchers rate our articles as excellent or good
Learn more about the work of our research integrity team to safeguard the quality of each article we publish.
Find out more
ORIGINAL RESEARCH article
Front. Endocrinol., 29 June 2022
Sec. Endocrinology of Aging
Volume 13 - 2022 | https://doi.org/10.3389/fendo.2022.879755
This article is part of the Research TopicA Year in Review: Discussions in Endocrinology of AgingView all 5 articles
 Guo-bao Hong1,2†
 Xiao-fei Shao3†Jia-min Li2Qin Zhou3Xiao-Su Ke4Pei-Chun Gao5Xiao-Lin Li6Jing Ning6Hai-Shan Chen3Hua Xiao3
 Chong-Xiang Xiong7*
 Hequn Zou6*
Background: There are few studies on predictive biomarkers for hyperuricemia, and the predictive value of these biomarkers tends to be poor. Additionally, no reports have described the predictive value of retinol binding protein 4 (RBP4) for hyperuricemia.
Purpose: This study was performed to evaluate the value of RBP4 for predicting the risk of hyperuricemia in a general population, determine whether RBP4 could be used alone or in combination with other factors to predict the risk of hyperuricemia in the general population, and establish an optimum predictive model.
Methods: We conducted a population-based cross-sectional survey in 2018, involving a questionnaire, physical examination, and laboratory testing. We enrolled 2303 individuals by stratified random sampling, and 2075 were included in the data analysis after applying the eligibility criteria.
Results: Serum RBP4 level had a highly significant association with hyperuricemia (P<0.001). After adjusting for potential confounders, logistic regression indicated that the risk of hyperuricemia was highest in the highest RBP4 quartile (odds ratio: 7.9, 95% confidence interval [CI]: 4.18–14.84, compared to the lowest quartile). The area under the receiver operating characteristic (ROC) curve (AUC) for RBP4 was 0.749 (95% CI: 0.725–0.774, P<0.001), which was higher than that for all the other predictors assessed. The optimum model for predicting hyperuricemia in the general population consisted of RBP4, sex (male), body mass index, serum creatinine, high-sensitivity C-reactive protein, fasting blood glucose, insulin, and alcohol consumption. The AUC was 0.804 (95% CI: 0.782–0.826, P<0.001).
Conclusions: RBP4 is strongly associated with hyperuricemia, and its predictive value was higher than that of traditional predictors.
The global prevalence of hyperuricemia has increased rapidly in the past few decades (1–3); it is 14.6–20% in the US (4) and 13.3–18.4% in China, and it is more common (25.5%) in southern China (5–8). Our 2012 epidemiological survey in Zhuhai city showed that the prevalence of hyperuricemia reached a staggering 32.4%, which is the highest for any location assessed in China (9). In addition to causing gout, numerous studies have shown that hyperuricemia increases the risk of metabolic syndrome (MetS) (10, 11), chronic kidney disease (12), acute kidney injury (13), hypertension (14), cardiovascular disease (15), and cerebral infarction (16).
Unfortunately, studies on the risk and predictors of hyperuricemia are rare. Although some groups have reported on factors (age, body mass index [BMI], waist circumference [WC], triglycerides [TG], etc.) (7, 17) that influence hyperuricemia, few studies have focused on individual biomarkers (visceral adiposity index (18), TG-glucose index (19), etc.) or models for predicting hyperuricemia (20–22). Additionally, most reported predictors have poor performance or are not suitable for large-scale clinical use because of issues such as cost and complexity.
Retinol binding protein-4 (RBP4) was recently recognized as a type of adipokine (23). Several small-sample studies have reported an association between RBP4 and hyperuricemia in patients with diabetes, chronic kidney disease, and MetS, but none of them focused on the general adult population (24, 25). To our knowledge, there are no studies on the predictive value of RBP4 for hyperuricemia.
This large-scale study aimed to explore the association between RBP4 and hyperuricemia in the general population, and to evaluate whether RBP4 can predict hyperuricemia. We also hope that in the absence of serum uric acid results, abnormally elevated levels of RBP4 may suggest the importance of further serum uric acid testing.
A cross-sectional survey of the general population in Wanzai town in Zhuhai city, China, was conducted in 2018. Using stratified random sampling, 2303 adults who were permanent residents of Wanzai town were initially enrolled in the study [1054 in the first visit in 2018 and another 1249 later in 2018 (the second visit was the follow-up visit of a similar epidemiological survey that we conducted in 2012 in Wanzai town)]. We followed the same sampling procedures described in previous reports on our 2012 epidemiological survey (26–30).
The exclusion criteria were as follows: (1) treatment with uric acid-lowering drugs or drugs that affect uric acid in the last 6 months, (2) severe liver or kidney damage, (3) acute cardiovascular or cerebrovascular diseases, and (4) pregnancy or breastfeeding.
After applying the eligibility criteria, 2075 individuals were included in the final analysis.
The study was approved by the Ethics Committee of the Third Affiliated Hospital of Southern Medical University and was conducted in accordance with the Declaration of Helsinki. All subjects provided written informed consent at recruitment.
Data on sociodemographic factors (age, sex, and education level), lifestyle (physical inactivity [physical activity <1 time/week], current smoking, and current alcohol consumption [≥1 time/week]), medical history (hypertension, diabetes, coronary heart disease [CHD], and stroke), and medication use were collected using a questionnaire. The detailed design of this study (including the urine specimen collection) was the same as in our previous epidemiological survey conducted in 2012 (26–30).
Physical examinations were performed to collect data on blood pressure (systolic blood pressure [SBP] and diastolic blood pressure [DBP]), weight and height (which were used to calculate BMI), and WC. BMI was used to define obesity according to Chinese obesity criteria. Normal weight was defined as BMI<24 kg/m2. Obesity was defined as BMI >=28 kg/m2, BMI 24-28 kg/m2 was overweight.
Blood specimens were collected after overnight fasting, stored at 2–8°C immediately after collection, and transported to the Central Laboratory of the Third Affiliated Hospital of Southern Medical University within 3 hours (31). RBP4 levels were assessed using an immunoturbidimetric method (Shanghai Beijia Biochemical Reagent Company, Shanghai,China). Hyperuricemia was defined as ≥420 μmol/L (7 mg/dL) in males and ≥360 µmol/L (6 mg/dL) in females (32). The following parameters were also measured(apparatus: Roche Cobas c501, Penzberg, Germany): TG, high-density lipoprotein (HDL), low-density lipoprotein (LDL), fasting blood glucose (FBG), insulin, homeostasis model assessment of insulin resistance (HOMA-IR, defined as: (FBG×insulin)/22.5), serum creatinine (SCr), cystatin C, high-sensitivity C-reactive protein (hsCRP), interleukin (IL)-6, serum uric acid, and estimated glomerular filtration rate (eGFR, defined according to CKD-EPIscr formula). Urinary albumin-to-creatinine ratio (ACR), N-acetyl-β-D-glucosaminidase (NAG), and β2 microglobulin (β2MG) were also assessed.
Continuous variables with a normal distribution are presented as the mean and standard deviation, while those with a non-normal distribution are presented as the median and interquartile range. Categorical variables are presented as frequencies and percentages. Continuous variables were compared between groups using independent-samples t tests or analyses of variance (for normally distributed variables) or Mann-Whitney U tests (for non-normally distributed variables). Categorical variables were compared between groups using χ2 or Fisher’s exact tests.
Six binary logistic regression models (stepwise conditional), with hyperuricemia as the independent variable and RBP4 quartile as the independent variable, were used to calculate odds ratios (ORs) and 95% confidence intervals (CIs). The regression models adjusted for the following covariates: (1) age and sex; (2) model 1 covariates plus hypertension, diabetes, CHD, education of high school or above, physical inactivity, current smoking, and current alcohol consumption; (3) model 2 covariates plus SBP, DBP, log TG, LDL, HDL, BMI, eGFR, FBG, and log insulin; (4) model 2 covariates plus SBP, DBP, LDL, HDL, BMI, eGFR, and log HOMA-IR; (5) model 4 covariates plus log hs-CRP, and log IL-6; and (6) model 5 covariates plus log NAG and log ACR. SCr is strongly correlated with eGFR, so it was not included in the regression models.
The area under the receiver operating characteristic (ROC) curve (AUC) was used to assess the predictive value of RBP4, other predictors, and the following three predictive models for hyperuricemia: (1) RBP4, sex, BMI, SCr, log hs-CRP, log insulin, log HOMA-IR, and current alcohol consumption; (2) RBP4, sex, BMI, SCr, log hs-CRP, and FBG; and (3) RBP4, sex, BMI, SCr, log hs-CRP, FBG, log insulin, and current alcohol consumption. Youden’s index (sensitivity + specificity – 1) was used to select the optimum cutoff value of RBP4. The reciprocals of HDL and eGFR were used due to their negative associations with serum uric acid level.
Statistical analyses were performed in SPSS software version 20.0 (IBM Corp., Armonk, NY, USA). A two-sided P value <0.05 was considered statistically significant.
The baseline characteristics of the participants are shown in Table 1. Those in the hyperuricemia group were more likely to be male and older compared to those in the non-hyperuricemia group, and they had higher rates of hypertension, diabetes, CHD, alcohol consumption, and physical inactivity (P<0.05). In addition, there were higher values of SBP, DBP, WC, BMI, TG, LDL, FBG, insulin, HOMA-IR, SCr, cystatin C, NAG, hs-CRP, IL-6, and RBP4 in the hyperuricemia group compared to the non-hyperuricemia group (P<0.05), but lower values of HDL, eGFR, and serum uric acid (P<0.001).
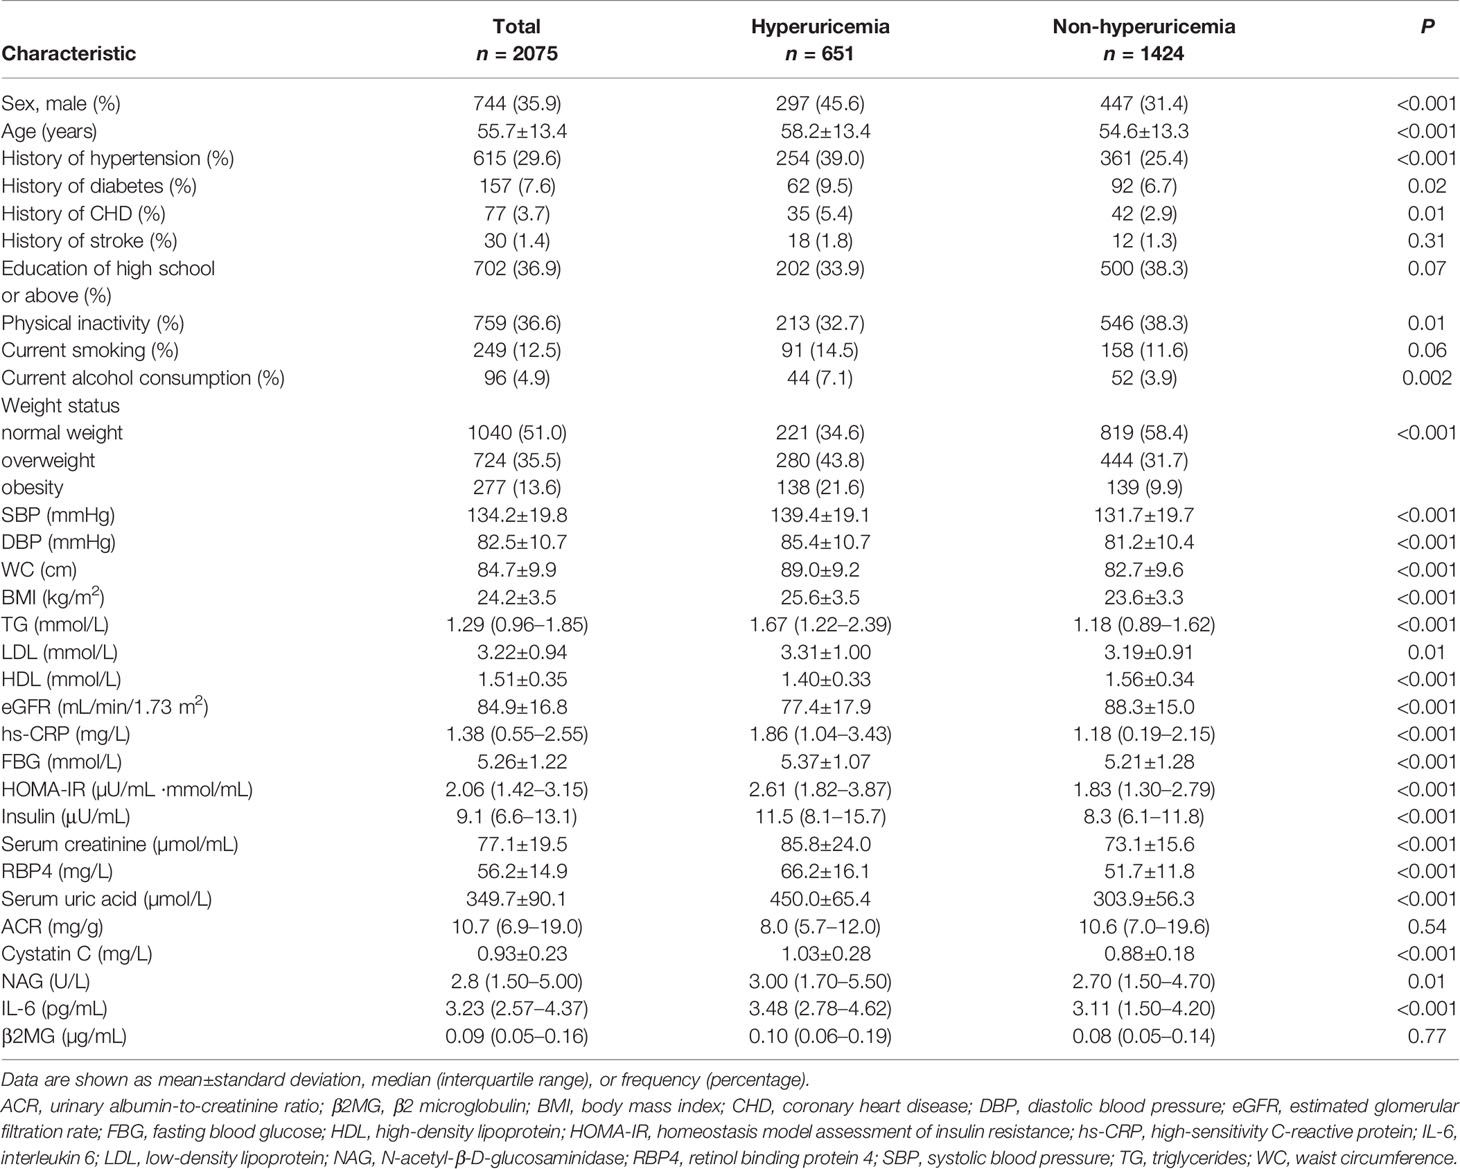
Table 1 Participant baseline characteristics.
The participants were divided into quartiles based on RBP4. Those in the fourth quartile were more likely to be male and older compared to the participants in the first quartile, and they were less educated and had higher rates of hypertension, diabetes, smoking, alcohol consumption, and physical inactivity (P<0.05). The values of SBP, DBP, WC, BMI, TG, LDL, FBG, insulin, HOMA-IR, serum uric acid, SCr, cystatin C, NAG, hs-CRP, IL-6, and ACR were higher and the values of HDL and eGFR were lower in the fourth quartile compared to the first quartile (Table 2).
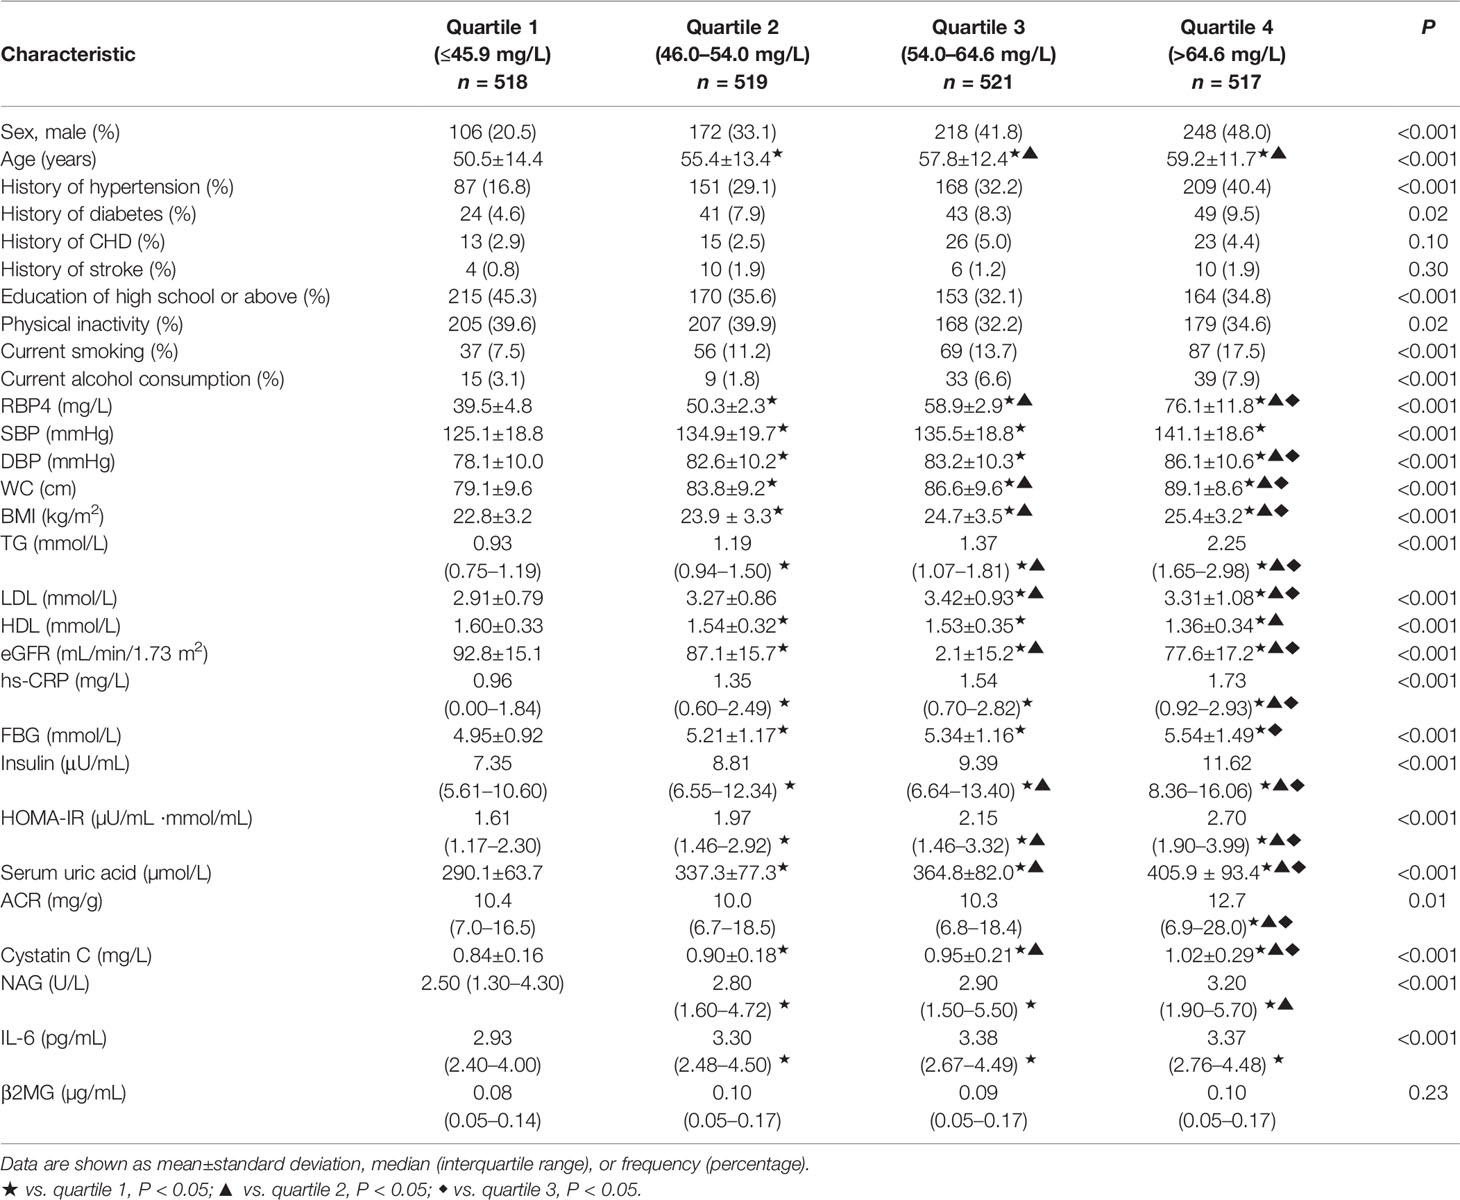
Table 2 Participant baseline characteristics by RBP4 quartile.
The prevalence of hyperuricemia gradually increased from the first to the fourth RBP4 quartile from 5.0% to 58.2% (7.5% to 61.7% in males and 4.4% to 55% in females) (all P<0.001, Table 3).
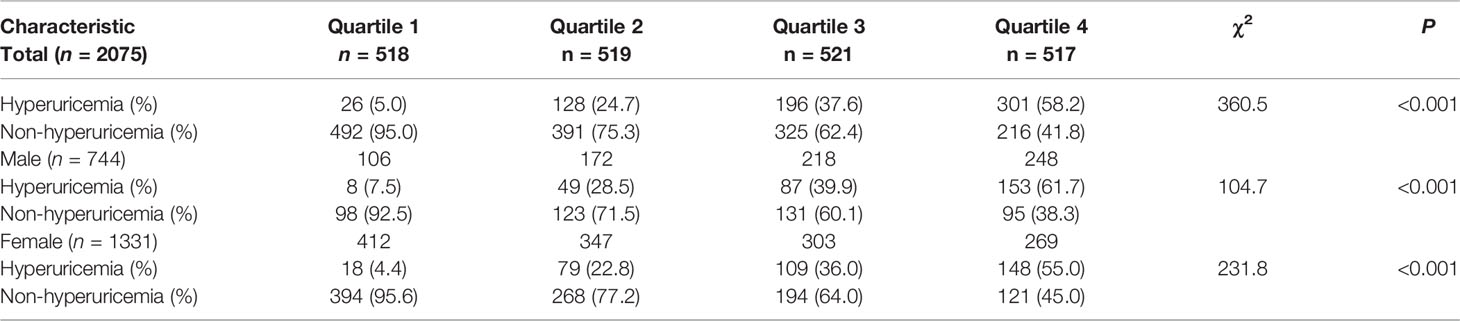
Table 3 Prevalence of hyperuricemia by RBP4 quartile .
The associations between RBP4 and hyperuricemia, according to six multivariate binary logistic regression analyses, are shown in Table 4. RBP4 and hyperuricemia were positively associated in all six models. In the final model (model 6), the OR comparing quartile 4 of RBP4 with quartile 1 was 7.90 (95% CI: 4.18–14.84; P < 0.001).
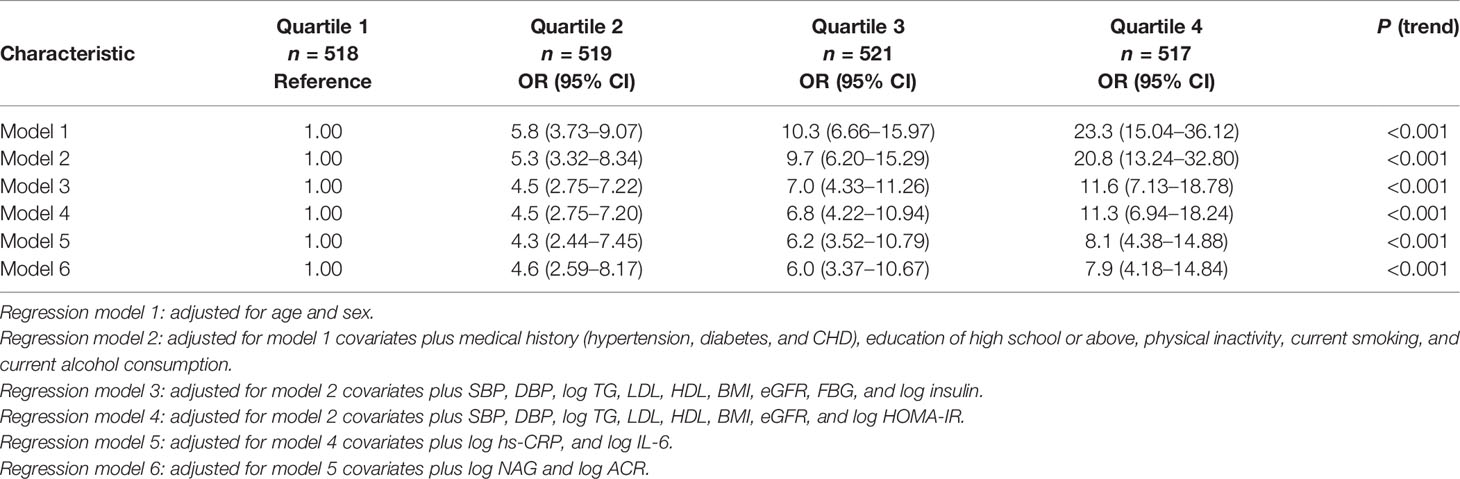
Table 4 Association between RBP4 and hyperuricemia according to logistic regression.
The AUC for RBP4 predicting hyperuricemia was 0.749 (95% CI: 0.725–0.774, P<0.001) and Youden’s index was 0.36, with an optimum cutoff of 54.5 mg/L. Its predictive performance was better than the performances of SCr, cystatin C, eGFR, TG, WC, BMI, insulin, HOMA-IR, HDL, FBG, hs-CRP, and SBP (Figure 1).
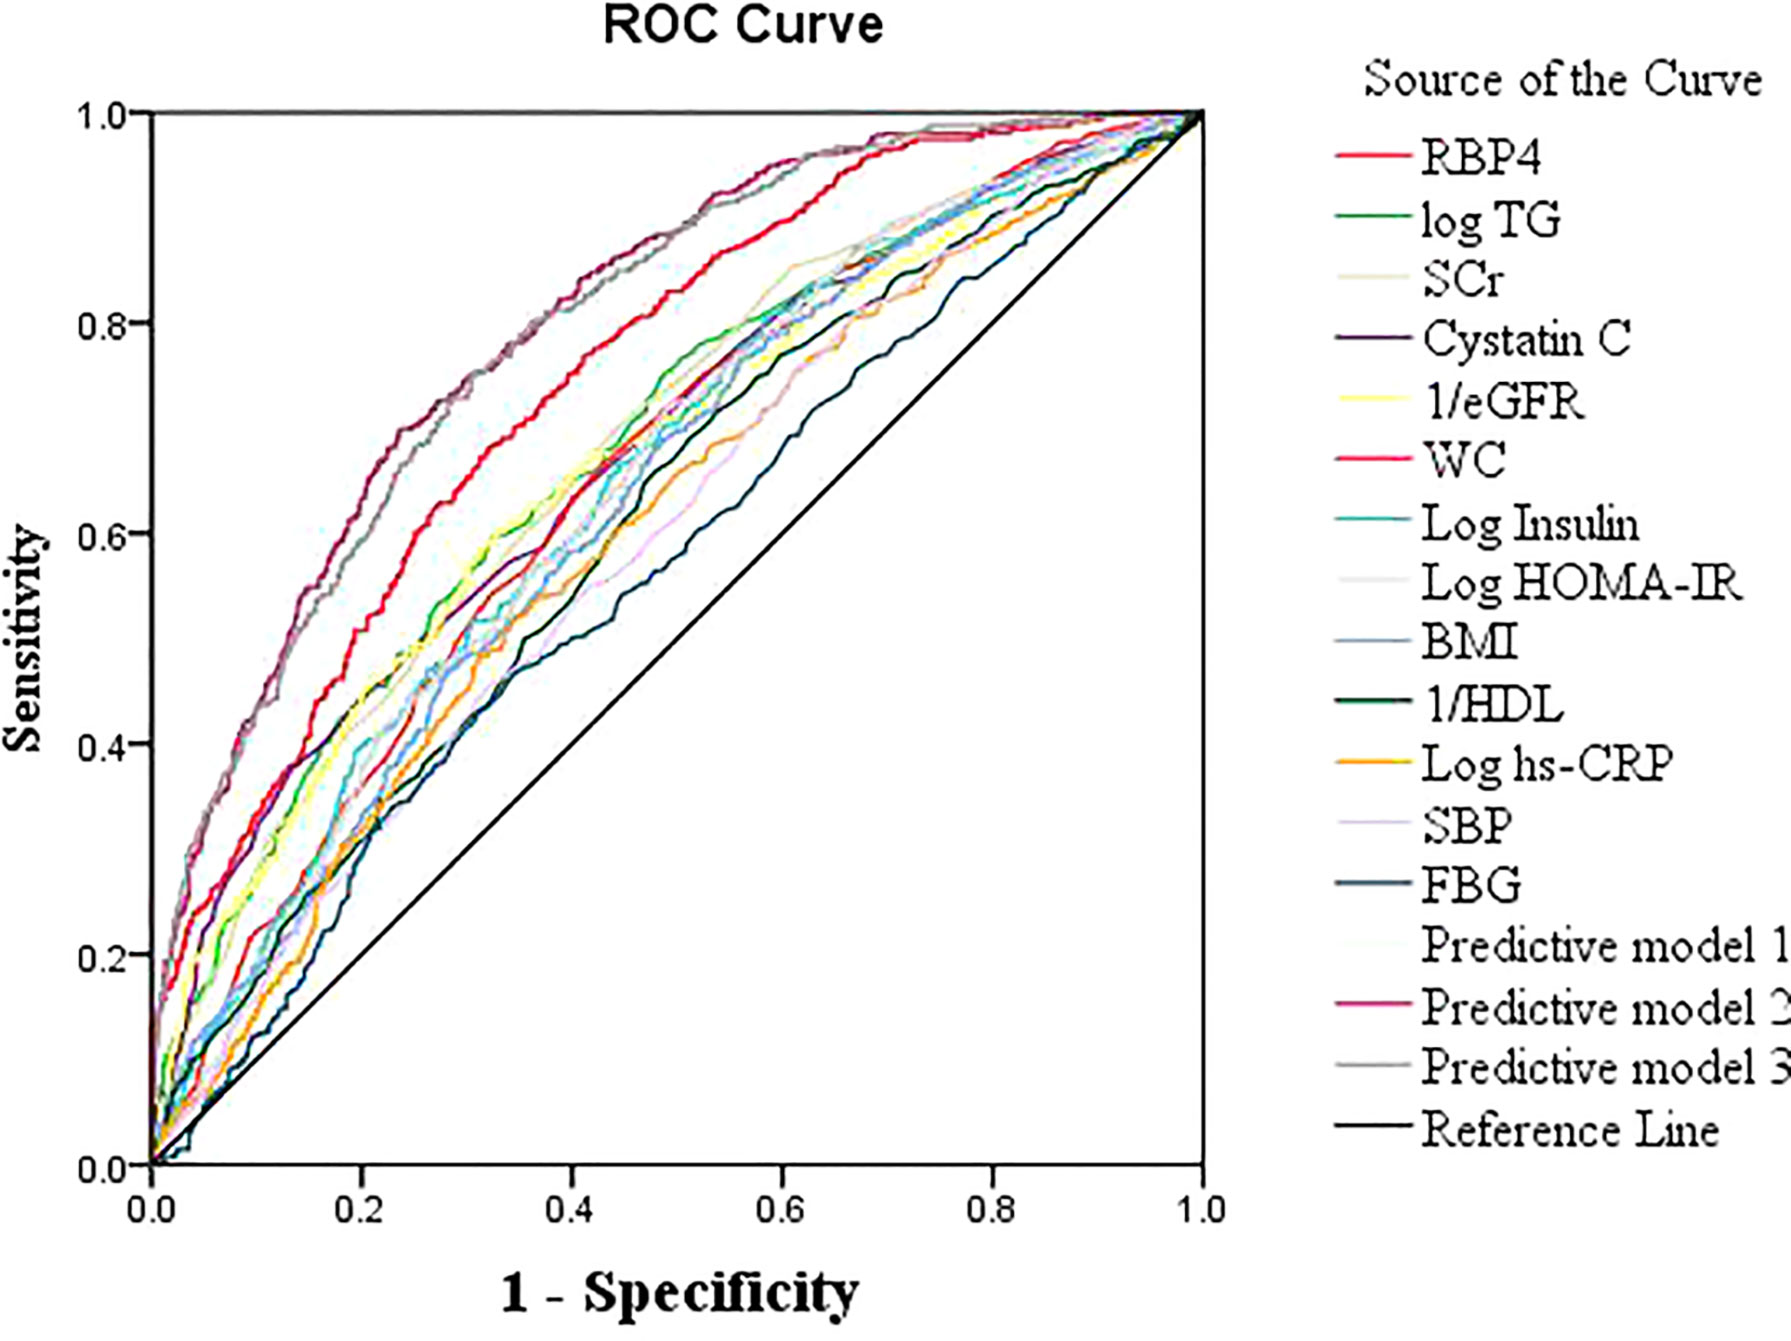
Figure 1 Receiver operating characteristic (ROC) curves of RBP4 and other indicators for predicting hyperuricemia in the general population.
The best prediction model was model 3, which involved RBP4 and other variables related to uric acid (sex, BMI, SCr, hs-CRP, FBG, insulin, and current alcohol consumption) in a binary logistic regression model (AUC: 0.804, 95% CI: 0.782–0.826, Youden’s index: 0.36, P<0.001). The predictive power of model 1 (AUC: 0.803) and model 2 (AUC: 0.797) were close to that of model 3 (Table 5; Figure 1). The best predictive model for males was composed of RBP4, SCr, and BMI (AUC: 0.782, 95% CI: 0.749–0.815, Youden’s index: 0.424, P<0.001). The best predictive model for females was composed of RBP4, SCr, hypertension, log insulin, and log hs-CRP (AUC: 0.824, 95% CI: 0.796–0.852, Youden’s index: 0.510, P<0.001).
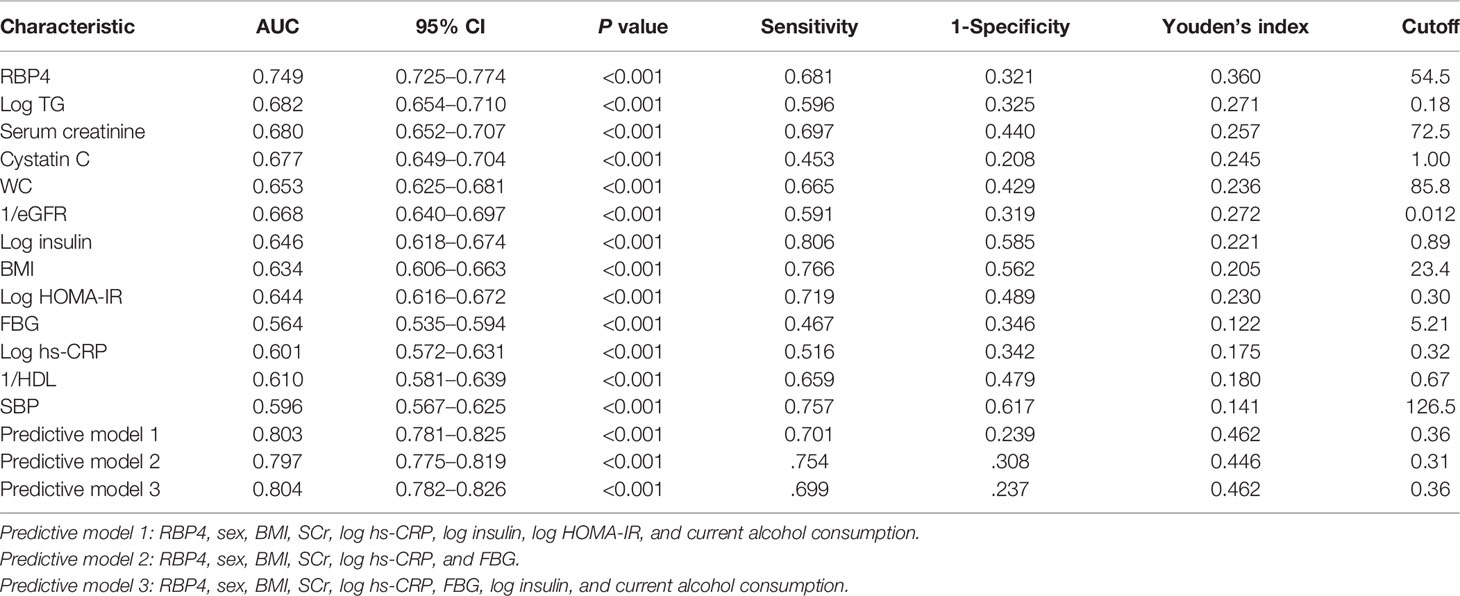
Table 5 Predictive value of RBP4 and other indicators for hyperuricemia in the general population.
Using population-based data on southern Chinese adults collected in a single-center cross-sectional epidemiological survey, we found that RBP4 had a highly significant association with hyperuricemia (P<0.001). More importantly, RBP4 was a good predictor of hyperuricemia; indeed, it performed better than traditional predictors. We also explored the predictive value of RBP4 combined with routinely assessed clinical factors that are related to hyperuricemia. To our knowledge, this is the first study to investigate the predictive value of RBP4 for hyperuricemia.
Several groups have reported individual predictors or predictive models for hyperuricemia (20–22). Lee MF et al. (20) reported that sex, BMI, and peroxisome proliferator-activated receptor (PPAR)-γ polymorphism are good predictors of hyperuricemia. Cao et al. (21) developed sex-specific prediction models (the predictors for males were age, SBP, BMI, and blood uric acid, and the predictors for females were SBP, BMI, TG, and blood uric acid) for hyperuricemia. Lee S et al. (22) developed a machine learning model (involving basic healthcare checkup test results) for predicting hyperuricemia. In addition, various novel blood lipid indicators such as the visceral adiposity index (18, 33), TG-glucose index (19), lipid accumulation products (34), and the cardiometabolic index (35) have been independently associated with hyperuricemia. However, all these studies were limited to specific populations, and the results were not verified in other regions such as the southern China. For example, Lee MF et al. (20) focused on adults aged 20–40 years in a district of Taiwan, China; the machine learning model (22) was based on a Korean population; and the prediction model developed by Cao et al. (21) was based on urban Han Chinese adults in Shandong province. Additionally, the predictive values of most of the above individual predictors (e.g., TG-glucose index, AUC: 0.662) or models (e.g., Cao et al. (21), AUC: 0.783) were relatively poor. Moreover, some of the predictors (e.g., PPAR-γ polymorphism) are not suitable for clinical use or for use in large-scale epidemiological research due to their high cost and complexity.
RBP4, as a single factor, had a good performance in predicting the risk of hyperuricemia. The AUC for RBP4 in the general population was 0.749. This is better than previous traditional individual predictors and similar to the predictive model developed by Lee MF et al. (20), which had an AUC of 0.775. We also obtained a predictive model (model 3), involving RBP4 and traditional predictors, with a good AUC of 0.804. Notably, the predictive value of RBP4 was slightly better in females than males (AUC for RBP4: 0.738 vs. 0.756; AUC for predictive model 3: 0.782 vs. 0.824).
The conclusion of our investigation is consistent with two previous studies (24, 25). Chen et al. were the first to report elevated serum RBP4 levels with increasing serum uric acid among 885 individuals with type 2 diabetes in Taiwan. Thereafter, Chan et al. (25) reported that serum RBP4 was positively associated with uric acid in 26 subjects with hypertension and MetS.
Our study has the following strengths. First, the participants were randomly sampled from the general population and covered all ages of adults, so the sample is widely representative. Second, 2075 people were included in the analysis, far exceeding the sample sizes of previous studies. Third, strict eligibility criteria were adopted. For example, we excluded individuals who were treated with uric acid-lowering drugs and those with a history of diseases or medications that might affect the RBP4 level. Fourth, the association remained significant after adjustment. For example, after adjusting for 21 potential confounders, the final regression model still showed that the risk of hyperuricemia in the highest RBP4 quartile was still 7.9 times higher than that in the lowest quartile, indicating a significant independent association between RBP4 and hyperuricemia. Finally, this is the first study to evaluate the value of RBP4 for predicting the risk of hyperuricemia, and we found that RBP4 alone performed better than traditional predictors. This is also the most important finding of this study, as it indicates that RBP4 might be useful for predicting the risk of hyperuricemia and could be used in epidemiological research on hyperuricemia in general adult populations. Though direct assessment of uric acid should be prefered over measuring a surrogate, the association between RBP4 and uric acid could be diagnostically exploited in case uric acid values are not available.
The mechanisms by which how RBP4 predicts hyperuricemia remain unclear. RBP4 is considered independently related to insulin resistance, which is implicated in the pathogenesis of hyperuricemia (36, 37). A recent study showed that RBP4 might be involved in hyperuricemia-induced insulin resistance by inhibiting IRS/PI3K/Akt phosphorylation (38).
Even after adjusting for insulin level plus FBG, or HOMA-IR, RBP4 remained strongly associated with hyperuricemia. This indicates that RBP4 may be related to hyperuricemia through other mechanisms besides insulin resistance. This study also indicated that the mechanisms may not involve renal function. When we adjusted for all renal function indicators (including glomerular and renal tubular function; i.e., eGFR, ACR, and NAG) in regression model 6, the regression results showed that the independent association between RBP4 and hyperuricemia remained significant. We speculate that besides insulin resistance, RBP4 may have additional unique non-renal function mechanisms such as pro-inflammatory effects and direct effects on vascular smooth muscle and uric acid (23, 39, 40). Further basic research on the mechanisms is needed in the future.
Our results should be considered in the context of several limitations. First, the participants were all Han Chinese adults from Zhuhai city, and the results may not be generalizable to other ethnicities. In addition, this was a single-center study and therefore inevitably limited regarding the sample size; large multicenter studies are needed to verify the conclusions. Furthermore, the study was cross-sectional, and the underlying mechanisms were not explored in depth. Cohort or case-control studies and basic research on the underlying mechanisms should be performed to verify our findings.
This study found that RBP4 is significantly positively associated with hyperuricemia in adults and has good predictive value for the condition. Clinically, it can be used alone or in combination with other traditional indicators to predict the risk of hyperuricemia.
The raw data supporting the conclusions of this article will be made available by the authors, without undue reservation.
The studies involving human participants were reviewed and approved by Ethics Committee of the Third Affiliated Hospital of Southern Medical University. The patients/participants provided their written informed consent to participate in this study. Written informed consent was obtained from the individual(s) for the publication of any potentially identifiable images or data included in this article.
G-BH, HZ, and C-XX participated in the research design, performance of the research, data analysis, and manuscript writing. X-FS, QZ, and X-SK participated in the research design and data analysis. P-CG, X-LL, JN, H-SC, and HX participated in the performance of the research and data analysis. All authors were involved in revising the manuscript and approved the final version.
This study was supported by the following sources, (1) Clinical Research Startup Program of Southern Medical University by High-level University Construction Funding of Guangdong Provincial Department of Education (LC2016PY047, 2016, ChiCTR1800016248), (2) Self-financing Science and Technology Projects of Foshan City (Medical Science and Technology Research; 1920001001357, 2019), (3) Science and Technique Program of Guangzhou (201604020015, 2015), (4) South Wisdom Valley Innovative Research Team Program (CXTD-004, 2014), (5) Guangdong Provincial Science and Technique Program (2011B031800386, 2011), (6) ISN Research Committee grant (2007), and (7) EU FP7 Program (UroSense, 2011).
Author P-CG was employed by Nanjing CR Medicon Pharmaceutical Technology Co., Ltd.
The remaining authors declare that the research was conducted in the absence of any commercial or financial relationships that could be construed as a potential conflict of interest.
All claims expressed in this article are solely those of the authors and do not necessarily represent those of their affiliated organizations, or those of the publisher, the editors and the reviewers. Any product that may be evaluated in this article, or claim that may be made by its manufacturer, is not guaranteed or endorsed by the publisher.
We would like to thank Xu You, Yunyin Chen, Zhicong Xiang, and Xin Wang at our center for their individual contributions to the data collection.
ACR, albumin-to-creatinine ratio; β2MG, β2 microglobulin; BMI, body mass index; CHD, coronary heart disease; DBP, diastolic blood pressure; eGFR, estimated glomerular filtration rate; FBG, fasting blood glucose; HDL, high-density lipoprotein; HOMA-IR, homeostasis model assessment of insulin resistance; hs-CRP, high sensitivity C-reactive protein; IL-6, interleukin 6; LDL, low-density lipoprotein; NAG, N-acetyl-β-D-glucosaminidase; RBP4, retinol binding protein 4; SBP, systolic blood pressure; SCr, serum creatinine; TG, triglycerides; WC, waist circumference.
1. Nielsen SM, Zobbe K, Kristensen LE, Christensen R. Nutritional Recommendations for Gout: An Update From Clinical Epidemiology. Autoimmun Rev (2018) 17(11):1090–6. doi: 10.1016/j.autrev.2018.05.008
2. Gamala M, Jacobs JWG. Gout and Hyperuricaemia: A Worldwide Health Issue of Joints and Beyond. Rheumatol (Oxf Engl) (2019) 58(12):2083–5. doi: 10.1093/rheumatology/kez272
3. Punzi L, Scanu A, Spinella P, Galozzi P, Oliviero F. One Year in Review 2018: Gout. Clin Exp Rheumatol (2019) 37(1):1–11.
4. Singh G, Lingala B, Mithal A. Gout and Hyperuricaemia in the USA: Prevalence and Trends. Rheumatol (Oxf Engl) (2019) 58(12):2177–80. doi: 10.1093/rheumatology/kez196
5. Song P, Wang H, Xia W, Chang X, Wang M, An L. Prevalence and Correlates of Hyperuricemia in the Middle-Aged and Older Adults in China. Sci Rep (2018) 8(1):4314. doi: 10.1038/s41598-018-22570-9
6. Liu Z, Su X, Xiao M, Zhou P, Guo J, Huang Y, et al. Association Between Eating Away From Home and Hyperuricemia: A Population-Based Nationwide Cross-Sectional Study in China. BioMed Res Int (2019) 2019:2792681. doi: 10.1155/2019/2792681
7. Ni Q, Lu X, Chen C, Du H, Zhang R. Risk Factors for the Development of Hyperuricemia: A STROBE-Compliant Cross-Sectional and Longitudinal Study. Medicine (2019) 98(42):e17597. doi: 10.1097/MD.0000000000017597
8. Li Y, Shen Z, Zhu B, Zhang H, Zhang X, Ding X. Demographic, Regional and Temporal Trends of Hyperuricemia Epidemics in Mainland China From 2000 to 2019: A Systematic Review and Meta-Analysis. Glob Health Action (2021) 14(1):1874652. doi: 10.1080/16549716.2021.1874652
9. Shao X. An Epidemiological Study on the Prevalence of Hyperuricemia and its Relationship to Chronic Kidney Disease in the Urban Community Residents of Zhuhai [Thesis]. [Guangzhou China] South Med Univ (2013) 30–31.
10. Kanbay M, Jensen T, Solak Y, Le M, Roncal-Jimenez C, Rivard C, et al. Uric Acid in Metabolic Syndrome: From an Innocent Bystander to a Central Player. Eur J Intern Med (2016) 29:3–8. doi: 10.1016/j.ejim.2015.11.026
11. Kawamoto R, Ninomiya D, Akase T, Kikuchi A, Kasai Y, Kusunoki T, et al. Serum Uric Acid to Creatinine Ratio Independently Predicts Incident Metabolic Syndrome Among Community-Dwelling Persons. Metab Syndr Relat Disord (2019) 17(2):81–9. doi: 10.1089/met.2018.0055
12. Sato Y, Feig DI, Stack AG, Kang DH, Lanaspa MA, Ejaz AA, et al. The Case for Uric Acid-Lowering Treatment in Patients With Hyperuricaemia and CKD. Nat Rev Nephrol (2019) 15(12):767–75. doi: 10.1038/s41581-019-0174-z
13. Zuo T, Jiang L, Mao S, Liu X, Yin X, Guo L. Hyperuricemia and Contrast-Induced Acute Kidney Injury: A Systematic Review and Meta-Analysis. Int J Cardiol (2016) 224:286–94. doi: 10.1016/j.ijcard.2016.09.033
14. Qu LH, Jiang H, Chen JH. Effect of Uric Acid-Lowering Therapy on Blood Pressure: Systematic Review and Meta-Analysis. Ann Med (2017) 49(2):142–56. doi: 10.1080/07853890.2016.1243803
15. Borghi C, Tykarski A, Widecka K, Filipiak KJ, Domienik-Karlowicz J, Kostka-Jeziorny K, et al. Expert Consensus for the Diagnosis and Treatment of Patient With Hyperuricemia and High Cardiovascular Risk. Cardiol J (2018) 25(5):545–63. doi: 10.5603/CJ.2018.0116
16. Du L, Ma J, Zhang X. Higher Serum Uric Acid May Contribute to Cerebral Infarction in Patients With Type 2 Diabetes Mellitus: A Meta-Analysis. J Mol Neurosci MN (2017) 61(1):25–31. doi: 10.1007/s12031-016-0848-y
17. Liu H, Zhang X-M, Wang Y-L, Liu B-C. Prevalence of Hyperuricemia Among Chinese Adults: A National Cross-Sectional Survey Using Multistage, Stratified Sampling. J Nephrol (2014) 27(6):653–8. doi: 10.1007/s40620-014-0082-z
18. Gu D, Ding Y, Zhao Y, Miao S, Qu Q. Positively Increased Visceral Adiposity Index in Hyperuricemia Free of Metabolic Syndrome. Lipids Health Dis (2018) 17(1):101. doi: 10.1186/s12944-018-0761-1
19. Shi W, Xing L, Jing L, Tian Y, Liu S. Usefulness of Triglyceride-Glucose Index for Estimating Hyperuricemia Risk: Insights From a General Population. Postgrad Med (2019) 131(5):348–56. doi: 10.1080/00325481.2019.1624581
20. Lee MF, Liou TH, Wang W, Pan WH, Lee WJ, Hsu CT, et al. Gender, Body Mass Index, and PPARgamma Polymorphism are Good Indicators in Hyperuricemia Prediction for Han Chinese. Genet Test Mol Biomarkers (2013) 17(1):40–6. doi: 10.1089/gtmb.2012.0231
21. Cao J, Wang C, Zhang G, Ji X, Liu Y, Sun X, et al. Incidence and Simple Prediction Model of Hyperuricemia for Urban Han Chinese Adults: A Prospective Cohort Study. Int J Environ Res Public Health (2017) 14(1). doi: 10.3390/ijerph14010067
22. Lee S, Choe EK, Park B. Exploration of Machine Learning for Hyperuricemia Prediction Models Based on Basic Health Checkup Tests. J Clin Med (2019) 8(2). doi: 10.3390/jcm8020172
23. Christou GA, Tselepis AD, Kiortsis DN. The Metabolic Role of Retinol Binding Protein 4: An Update. Horm Metab Res Hormon Und Stoffwechselforschung Horm Metabol (2012) 44(1):6–14. doi: 10.1055/s-0031-1295491
24. Chen CC, Wu JY, Chang CT, Tsai FJ, Wang TY, Liu YM, et al. Levels of Retinol-Binding Protein 4 and Uric Acid in Patients With Type 2 Diabetes Mellitus. Metabol: Clin Exp (2009) 58(12):1812–6. doi: 10.1016/j.metabol.2009.06.013
25. Park CS, Ihm SH, Park HJ, Shin WS, Kim PJ, Chang K, et al. Relationship Between Plasma Adiponectin, Retinol-Binding Protein 4 and Uric Acid in Hypertensive Patients With Metabolic Syndrome. Korean Circ J (2011) 41(4):198–202. doi: 10.4070/kcj.2011.41.4.198
26. Chen S, Chen Y, Liu X, Li M, Wu B, Li Y, et al. Association of Insulin Resistance With Chronic Kidney Disease in non-Diabetic Subjects With Normal Weight. PLoS One (2013) 8(9):e74058. doi: 10.1371/journal.pone.0074058
27. Chen S, Liu H, Liu X, Li Y, Li M, Liang Y, et al. Central Obesity, C-Reactive Protein and Chronic Kidney Disease: A Community-Based Cross-Sectional Study in Southern China. Kidney Blood Pressure Res (2013) 37(4-5):392–401. doi: 10.1159/000355718
28. Chen S, Chen Y, Liu X, Li M, Wu B, Li Y, et al. Insulin Resistance and Metabolic Syndrome in Normal-Weight Individuals. Endocrine (2014) 46(3):496–504. doi: 10.1007/s12020-013-0079-8
29. Li Y, Chen Y, Liu X, Liang Y, Shao X, Zhang Y, et al. Metabolic Syndrome and Chronic Kidney Disease in a Southern Chinese Population. Nephrology (Carlton Vic) (2014) 19(6):325–31. doi: 10.1111/nep.12219
30. Zhang L, Chen S, Deng A, Liu X, Liang Y, Shao X, et al. Association Between Lipid Ratios and Insulin Resistance in a Chinese Population. PLoS One (2015) 10(1):e0116110. doi: 10.1371/journal.pone.0116110
31. Chen T, Chen H, Xiao H, Tang H, Xiang Z, Wang X, et al. Comparison of the Value of Neutrophil to High-Density Lipoprotein Cholesterol Ratio and Lymphocyte to High-Density Lipoprotein Cholesterol Ratio for Predicting Metabolic Syndrome Among a Population in the Southern Coast of China. Diabetes Metab Syndr Obes (2020) 13:597–605. doi: 10.2147/dmso.s238990
32. Zhu Y, Pandya BJ, Choi HK. Prevalence of Gout and Hyperuricemia in the US General Population: The National Health and Nutrition Examination Survey 2007-2008. Arthritis Rheum (2011) 63(10):3136–41. doi: 10.1002/art.30520
33. Dong H, Xu Y, Zhang X, Tian S. Visceral Adiposity Index is Strongly Associated With Hyperuricemia Independently of Metabolic Health and Obesity Phenotypes. Sci Rep (2017) 7(1):8822. doi: 10.1038/s41598-017-09455-z
34. Huang X, Jiang X, Wang L, Chen L, Wu Y, Gao P, et al. Visceral Adipose Accumulation Increased the Risk of Hyperuricemia Among Middle-Aged and Elderly Adults: A Population-Based Study. J Trans Med (2019) 17(1). doi: 10.1186/s12967-019-2074-1
35. Wang H, Sun Y, Wang S, Qian H, Jia P, Chen Y, et al. Body Adiposity Index, Lipid Accumulation Product, and Cardiometabolic Index Reveal the Contribution of Adiposity Phenotypes in the Risk of Hyperuricemia Among Chinese Rural Population. Clin Rheumatol (2018) 37(8):2221–31. doi: 10.1007/s10067-018-4143-x
36. Graham TE, Yang Q, Bluher M, Hammarstedt A, Ciaraldi TP, Henry RR, et al. Retinol-Binding Protein 4 and Insulin Resistance in Lean, Obese, and Diabetic Subjects. New Engl J Med (2006) 354(24):2552–63. doi: 10.1056/NEJMoa054862
37. Wolf G. Serum Retinol-Binding Protein: A Link Between Obesity, Insulin Resistance, and Type 2 Diabetes. Nutr Rev (2007) 65(5):251–6. doi: 10.1111/j.1753-4887.2007.tb00302.x
38. Liu C, Zhou XR, Ye MY, Xu XQ, Zhang YW, Liu H, et al. RBP4 Is Associated With Insulin Resistance in Hyperuricemia-Induced Rats and Patients With Hyperuricemia. Front Endocrinol (2021) 12:653819. doi: 10.3389/fendo.2021.653819
39. Chen X, Shen T, Li Q, Chen X, Li Y, Li D, et al. Retinol Binding Protein-4 Levels and Non-Alcoholic Fatty Liver Disease: A Community-Based Cross-Sectional Study. Sci Rep (2017) 7:45100. doi: 10.1038/srep45100
Keywords: retinol binding protein, hyperuricemia, prediction, cross-sectional survey, risk
Citation: Hong G-b, Shao X-f, Li J-m, Zhou Q, Ke X-S, Gao P-C, Li X-L, Ning J, Chen H-S, Xiao H, Xiong C-X and Zou H (2022) Associaton of Retinol Binding Protein 4 (RBP4) Levels With Hyperuricemia: A Cross-Sectional Study in a Chinese Population. Front. Endocrinol. 13:879755. doi: 10.3389/fendo.2022.879755
Received: 01 March 2022; Accepted: 12 May 2022;
Published: 29 June 2022.
Edited by:
Rodrig Marculescu, Medical University of Vienna, AustriaReviewed by:
Aleksandra Klisic, Primary Health Care Center Podgorica, MontenegroCopyright © 2022 Hong, Shao, Li, Zhou, Ke, Gao, Li, Ning, Chen, Xiao, Xiong and Zou. This is an open-access article distributed under the terms of the Creative Commons Attribution License (CC BY). The use, distribution or reproduction in other forums is permitted, provided the original author(s) and the copyright owner(s) are credited and that the original publication in this journal is cited, in accordance with accepted academic practice. No use, distribution or reproduction is permitted which does not comply with these terms.
*Correspondence: Hequn Zou, aGVxdW56b3VAaG90bWFpbC5jb20=; Chong-Xiang Xiong, Z3JhbmQxMDI3QDE2My5jb20=
†These authors have contributed equally to this work
Disclaimer: All claims expressed in this article are solely those of the authors and do not necessarily represent those of their affiliated organizations, or those of the publisher, the editors and the reviewers. Any product that may be evaluated in this article or claim that may be made by its manufacturer is not guaranteed or endorsed by the publisher.
Research integrity at Frontiers
Learn more about the work of our research integrity team to safeguard the quality of each article we publish.