 Nan Wang
 Linfeng Wei
 Die Liu
 Quyan Zhang1,2
 Xiaobo Xia
 Lexi Ding
 Siqi Xiong
94% of researchers rate our articles as excellent or good
Learn more about the work of our research integrity team to safeguard the quality of each article we publish.
Find out more
ORIGINAL RESEARCH article
Front. Endocrinol., 29 April 2022
Sec. Cellular Endocrinology
Volume 13 - 2022 | https://doi.org/10.3389/fendo.2022.867600
This article is part of the Research TopicAdvances of Endocrine and Metabolic Cardiovascular Outcomes: From Basic to Clinical ScienceView all 15 articles
Background: Diabetic retinopathy (DR) is one of the most common microvascular complications of diabetes, which is associated with damage of blood-retinal barrier and ischemia of retinal vasculature. It devastates visual acuity due to leakage of retinal vessels and aberrant pathological angiogenesis in diabetic patients. The etiology of DR is complex, accumulated studies have shown that autophagy plays an important role in the pathogenesis of DR, but its specific mechanism needs to be further studied.
Methods: This study chose the online Gene Expression Omnibus (GEO) microarray expression profiling dataset GSE146615 to carry on the research. Autophagy-related genes that were potentially differentially expressed in DR were screened by R software. Then, the differentially expressed autophagy-related genes were analyzed by correlation analysis, tissue-specific gene expression, gene-ontology (GO) enrichment analysis, Kyoto Encyclopedia of Genes and Genomes (KEGG) pathway enrichment analysis and protein-protein interaction (PPI) network analysis. Finally, retinal pigment epithelial cell line (ARPE-19) incubated with high glucose (HG) was used to mimic the DR model, and the mRNA level of key genes was verified by quantitative real-time polymerase chain reaction (qRT-PCR) in vitro.
Results: A total of 23 differentially expressed autophagy-related genes (9 up-regulated genes and 14 down-regulated genes) were identified by differential expression analysis. The analysis of tissue-specific gene expression showed that these differentially expressed autophagy-related genes were enriched in the retina. GO and KEGG enrichment analysis showed that differentially expressed autophagy-related genes were significantly enriched in autophagy-related pathways such as regulation of autophagy and macroautophagy. Then 10 hub genes were identified by PPI network analysis and construction of key modules. Finally, qRT-PCR confirmed that the expression of MAPK3 in the DR model was consistent with the results of bioinformatics analysis of mRNA chip.
Conclusion: Through bioinformatics analysis, we identified 23 potential DR autophagy-related genes, among which the down-regulated expression of MAPK3 may affect the occurrence and development of DR by regulating autophagy. It provides a novel insight into the pathogenesis of DR.
• Differentially expressed genes (DEGs) related to autophagy in DR patients were identified.
• Major enrichment pathways of autophagy-related differential genes identified by bioinformatics, and the top 10 hub genes were identified.
• Experimental validation showed that down-regulation of MAPK3 gene might associated with DR by regulating autophagy.
Diabetic retinopathy (DR) is one of the most common and harmful microvascular complications of diabetes, and it is also a common eye disease that causes blindness (1). Most patients progress into DR after 20 years of diabetes (2, 3), and about half of the patients with untreated proliferative retinopathy will go blind within 5 years (4). It imposes a heavy economic burden on the families, health systems and societies. Previous studies have shown that oxidative stress, endoplasmic reticulum stress, apoptosis and autophagy (5–8) can induce mild and chronic retinal inflammation in retinal tissues (9), resulting in retinal vessel hyperpermeability (10), retinal angiogenesis and retinal neuron injury (11).
Autophagy is a process in which autophagy engulfs its own cytoplasmic proteins or organelles and encapsulates them into vesicles, fuses with lysosomes to form autophagy lysosomes, and degrades the contents of autophagy. It meets the demand of cellular metabolic needs and is involved in the renewal of some organelles. It is highly conserved in evolution and crucial for the degradation and circulation of cellular substances (12). Autophagy disorders may have fatal consequences to the cells and result in some ocular diseases (13), such as age-associated macular degeneration (AMD), glaucoma and other eye diseases (14–21). For example, glucosamine (GlcN) can induce autophagy to reduce photoreceptor outer segment (POS)-derived lipofuscin-like autofluorescence (LLAF) in retinal pigment epithelial (RPE) cells through the AMPK-mTOR pathway, which provides a novel insight for AMD (19). In the glaucoma model, the neurosteroid allopregnanolone (AlloP) can reduce the apoptosis of retinal ganglion cells (RGC) by activating autophagy (21).
Recently, the role of autophagy in DR has been gradually uncovered. Damage of outer blood-retina barrier due to diabetes is key to the pathogenesis of diabetic macular edema. It leads to decrease of visual acuity in patients with DR. RPE cells are the main components of the outer blood-retina barrier. It has been demonstrated that the outer blood-retina barrier was destroyed in diabetes by modulation of autophagy in RPE cells. However, the underlying mechanism of autophagy in devastating RPE cells under diabetes stress is still unclear. In this study, we analyzed the previously published dataset containing samples from DR and non-diabetic individuals to identify the differentially expressed genes (DEGs) related to DR. It was further analyzed to figure out the correlation between the differentially expressed autophagy-related genes in DR. Then, functional enrichment and protein-protein interaction (PPI) network analysis were used to clarify the interaction and biological function of these genes. 10 hub genes were identified by PPI network analysis, and it was further verified in the DR model by quantitative real-time polymerase chain reaction (qRT-PCR) in vitro. We found that the expression of MAPK3 was consistent with the results of bioinformatics analysis of mRNA chip in the DR model, suggesting it was involved in the development of DR by regulating autophagy (Figure 1).
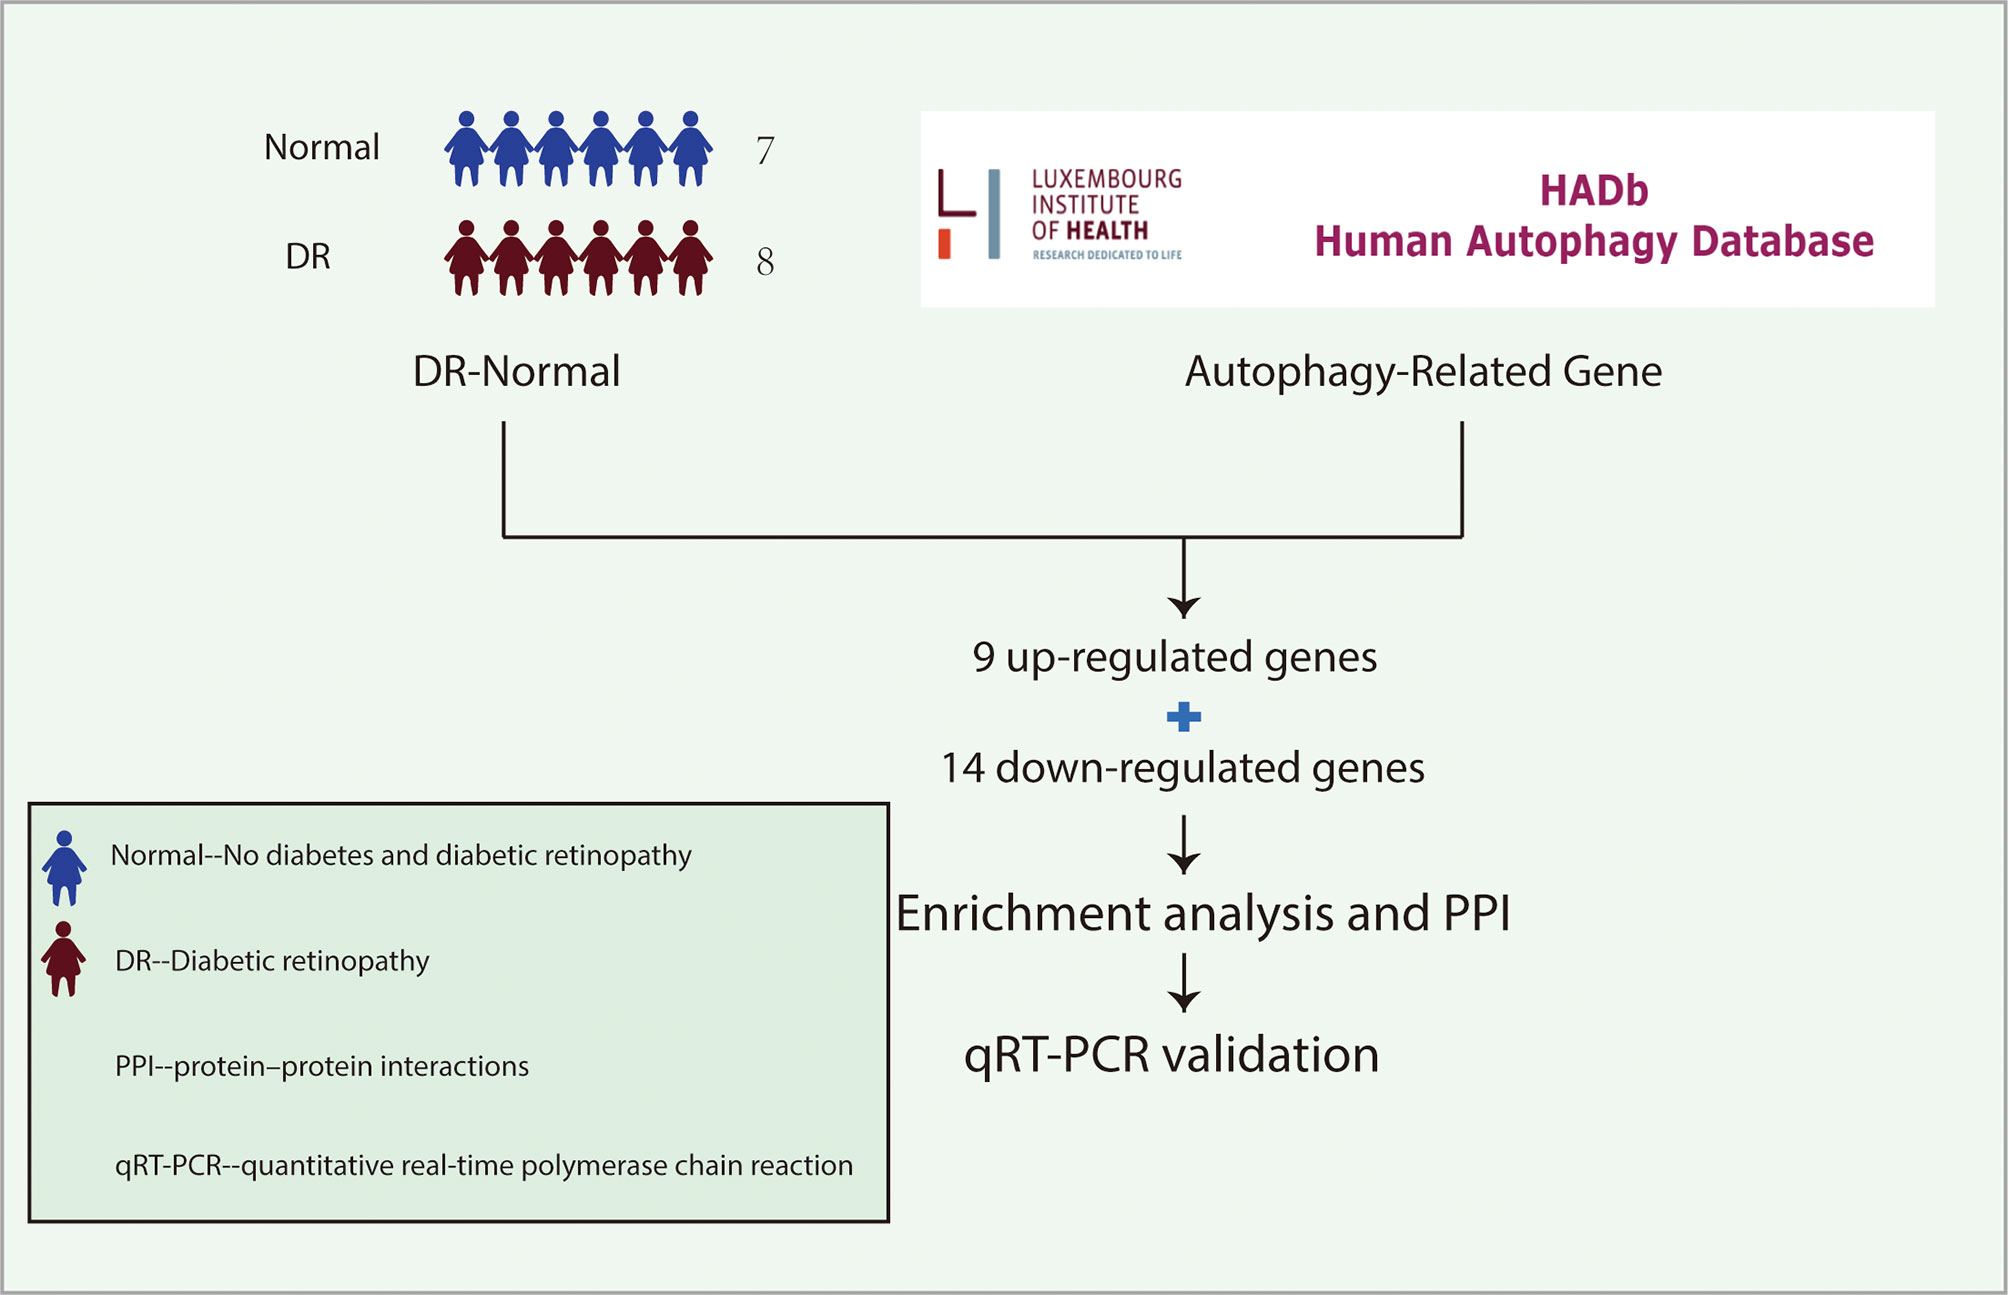
Figure 1 The idea of experimental design. The gene expression profiles of LCLs extracted from the peripheral blood of 7 non-diabetic individuals and 8 patients with DR were cultured under SG and HG conditions respectively in the GSE146615 dataset. 232 autophagy-related genes were collected from The Human Autophagy Database. Then, 9 up-regulated genes and 14 down-regulated genes were screened by differential analysis. After enrichment analysis and PPI network construction, 10 hub genes were identified. Finally, qRT-PCR was used to verify in vitro DR model. LCLs, lymphoblastoid cell lines; DR, diabetic retinopathy; SG, standard glucose; HG, high glucose; PPI, protein-protein interaction; qRT-PCR, quantitative real-time polymerase chain reaction.
The mRNA expression profile dataset GSE146615 was downloaded from the Gene Expression Omnibus (GEO) database (http://www.ncbi.nlm.nih.gov/geo/). 232 autophagy-related genes were obtained from The Human Autophagy Database (http://www.autophagy.lu/index.html). GSE146615 was in GPL10558 platform. The dataset included 7 individuals without diabetes, 7 patients with type 1 diabetes (T1D) without complications from DR and 8 patients with DR. Lymphoblastoid cell lines (LCLs) were extracted from the peripheral blood of 22 individuals and processed with standard glucose (SG) and high glucose (HG), respectively. In this study, the data of LCLs of 7 non-diabetic individuals treated with SG and LCLs of 8 patients with DR treated with HG were extracted for follow-up analysis.
The DEGs related to autophagy were screened by the “limma” package in R software. The genes with P value < 0.05 were considered to be DEGs. Then, the “heatmap” and “ggplot2” packages in R software are used to draw heatmap and volcano plot and box plot respectively to visualize the differential genes.
The correlation analysis of differentially expressed autophagy-related genes was carried out by using Spearman correlation in the “corrplot” package of R software. The tissue-specific expression of differentially expressed autophagy-related genes was analyzed on the BioGPS website (http://biogps.org).
We used the “GO plot” package in R software to analyze the functional enrichment of differentially expressed autophagy-related genes, including Gene Ontology (GO) terms and Kyoto Encyclopedia of Genes and Genomes (KEGG) pathways. In the GO analysis, we evaluated the enriched biological processes (BPs), molecular functions (MFs) and cellular components (CCs).
The STRING database (https://string-db.org/) of known and predicted protein-protein interactions was used to analyze the PPI network of differentially expressed autophagy-related genes, and then the Cytoscape v3.9.0 software was used to visualize and construct the PPI network, and finally 10 hub genes were identified by cytoHubba plugin.
Human retinal pigment epithelial cell line (ARPE-19) was purchased from the Procell Life Science & Technology in China (CL-0026) and cultured in DMEM/F12 medium containing 10% fetal bovine serum (FBS) (Gibco, USA) and 1% Antibiotic-Antimycotic (Gibco, USA) at 37°C with 5% carbon dioxide. When the cell density reached 80%, it was washed with PBS (Gibco, USA) and treated with 0.05% trypsin (Gibco, USA) for passage at the proportion of 1:3.
The logarithmic growth phase cells with good growth condition were inserted into 6-well plates with 1.2×10⁶ cells per well. The cells were divided into two groups: the HG treated group and the normal group. The HG treated group was cultured in the medium containing 30mmol/L D-glucose, and the normal group was cultured in the SG medium. The 2.5mL medium was added to each well and cultured at 37°C for 48 hours.
RNA was extracted from ARPE-19 cells using TRIzol kit (Invitrogen, USA) according to the manufacturer’s plan, and 2 × SYBR Green qPCR Master Mix and UEIris II RT-PCR System using a First-Strand cDNA, as well as Synthesis Kit (Suzhou Yuheng Biological Co., Ltd.) were used for reverse transcription and qRT-PCR. The primers were designed and synthesized by Sangon Biotech Co., Ltd (Shanghai, China), and the sequence was listed in Supplementary Table S1. Configure the reaction mixture according to the system in Supplementary Table S2, gently swirl and centrifuge the reaction mixture, transfer it to the PCR plate, and carry out the experimental reaction according to the procedure in Supplementary Table S3. Finally, the results were analyzed by real-time PCR detection system (ABI). The expression level of mRNA was calculated by 2−ΔΔCt method, and the relative expression level of gene mRNA was normalized by β-actin. Sterilized deionized water was used instead of nucleic acid template as negative control to ensure the quality of primers and no pollution of the system.
All the experimental data were statistically analyzed by GraphpadPrism software (version3.6.2), and 3 independent experiments were carried out. The gene expression level of the sample was compared by Student’s t-test, and the difference was considered to be statistically significant when P < 0.05.
We downloaded the Expression profiling by array dataset GSE146615 from the GEO database, and selected LCLs cultured in SG from 7 non-diabetic individuals (Normal group) and 8 patients with T1D and proliferative diabetic retinopathy (PDR) cultured in HG (DR group). Next, we analyzed the expression of 232 autophagy-related genes in the sample by R software, identified 9 up-regulated genes and 14 down-regulated genes, and then plotted 23 differentially expressed autophagy-related genes between the DR group and the normal group (Figures 2A, B). In addition, the box chart showed the expression patterns of 23 autophagy-related genes differentially expressed between DR patients and normal samples (Figure 2C). The first five up-regulated genes include HGS, BAX, RAF1, TSC1 and ITPR1, and the first five down-regulated genes include CHMP4B, FKBP1A, CDKN1B, GABARAPL2 and RAB33B (Table 1).
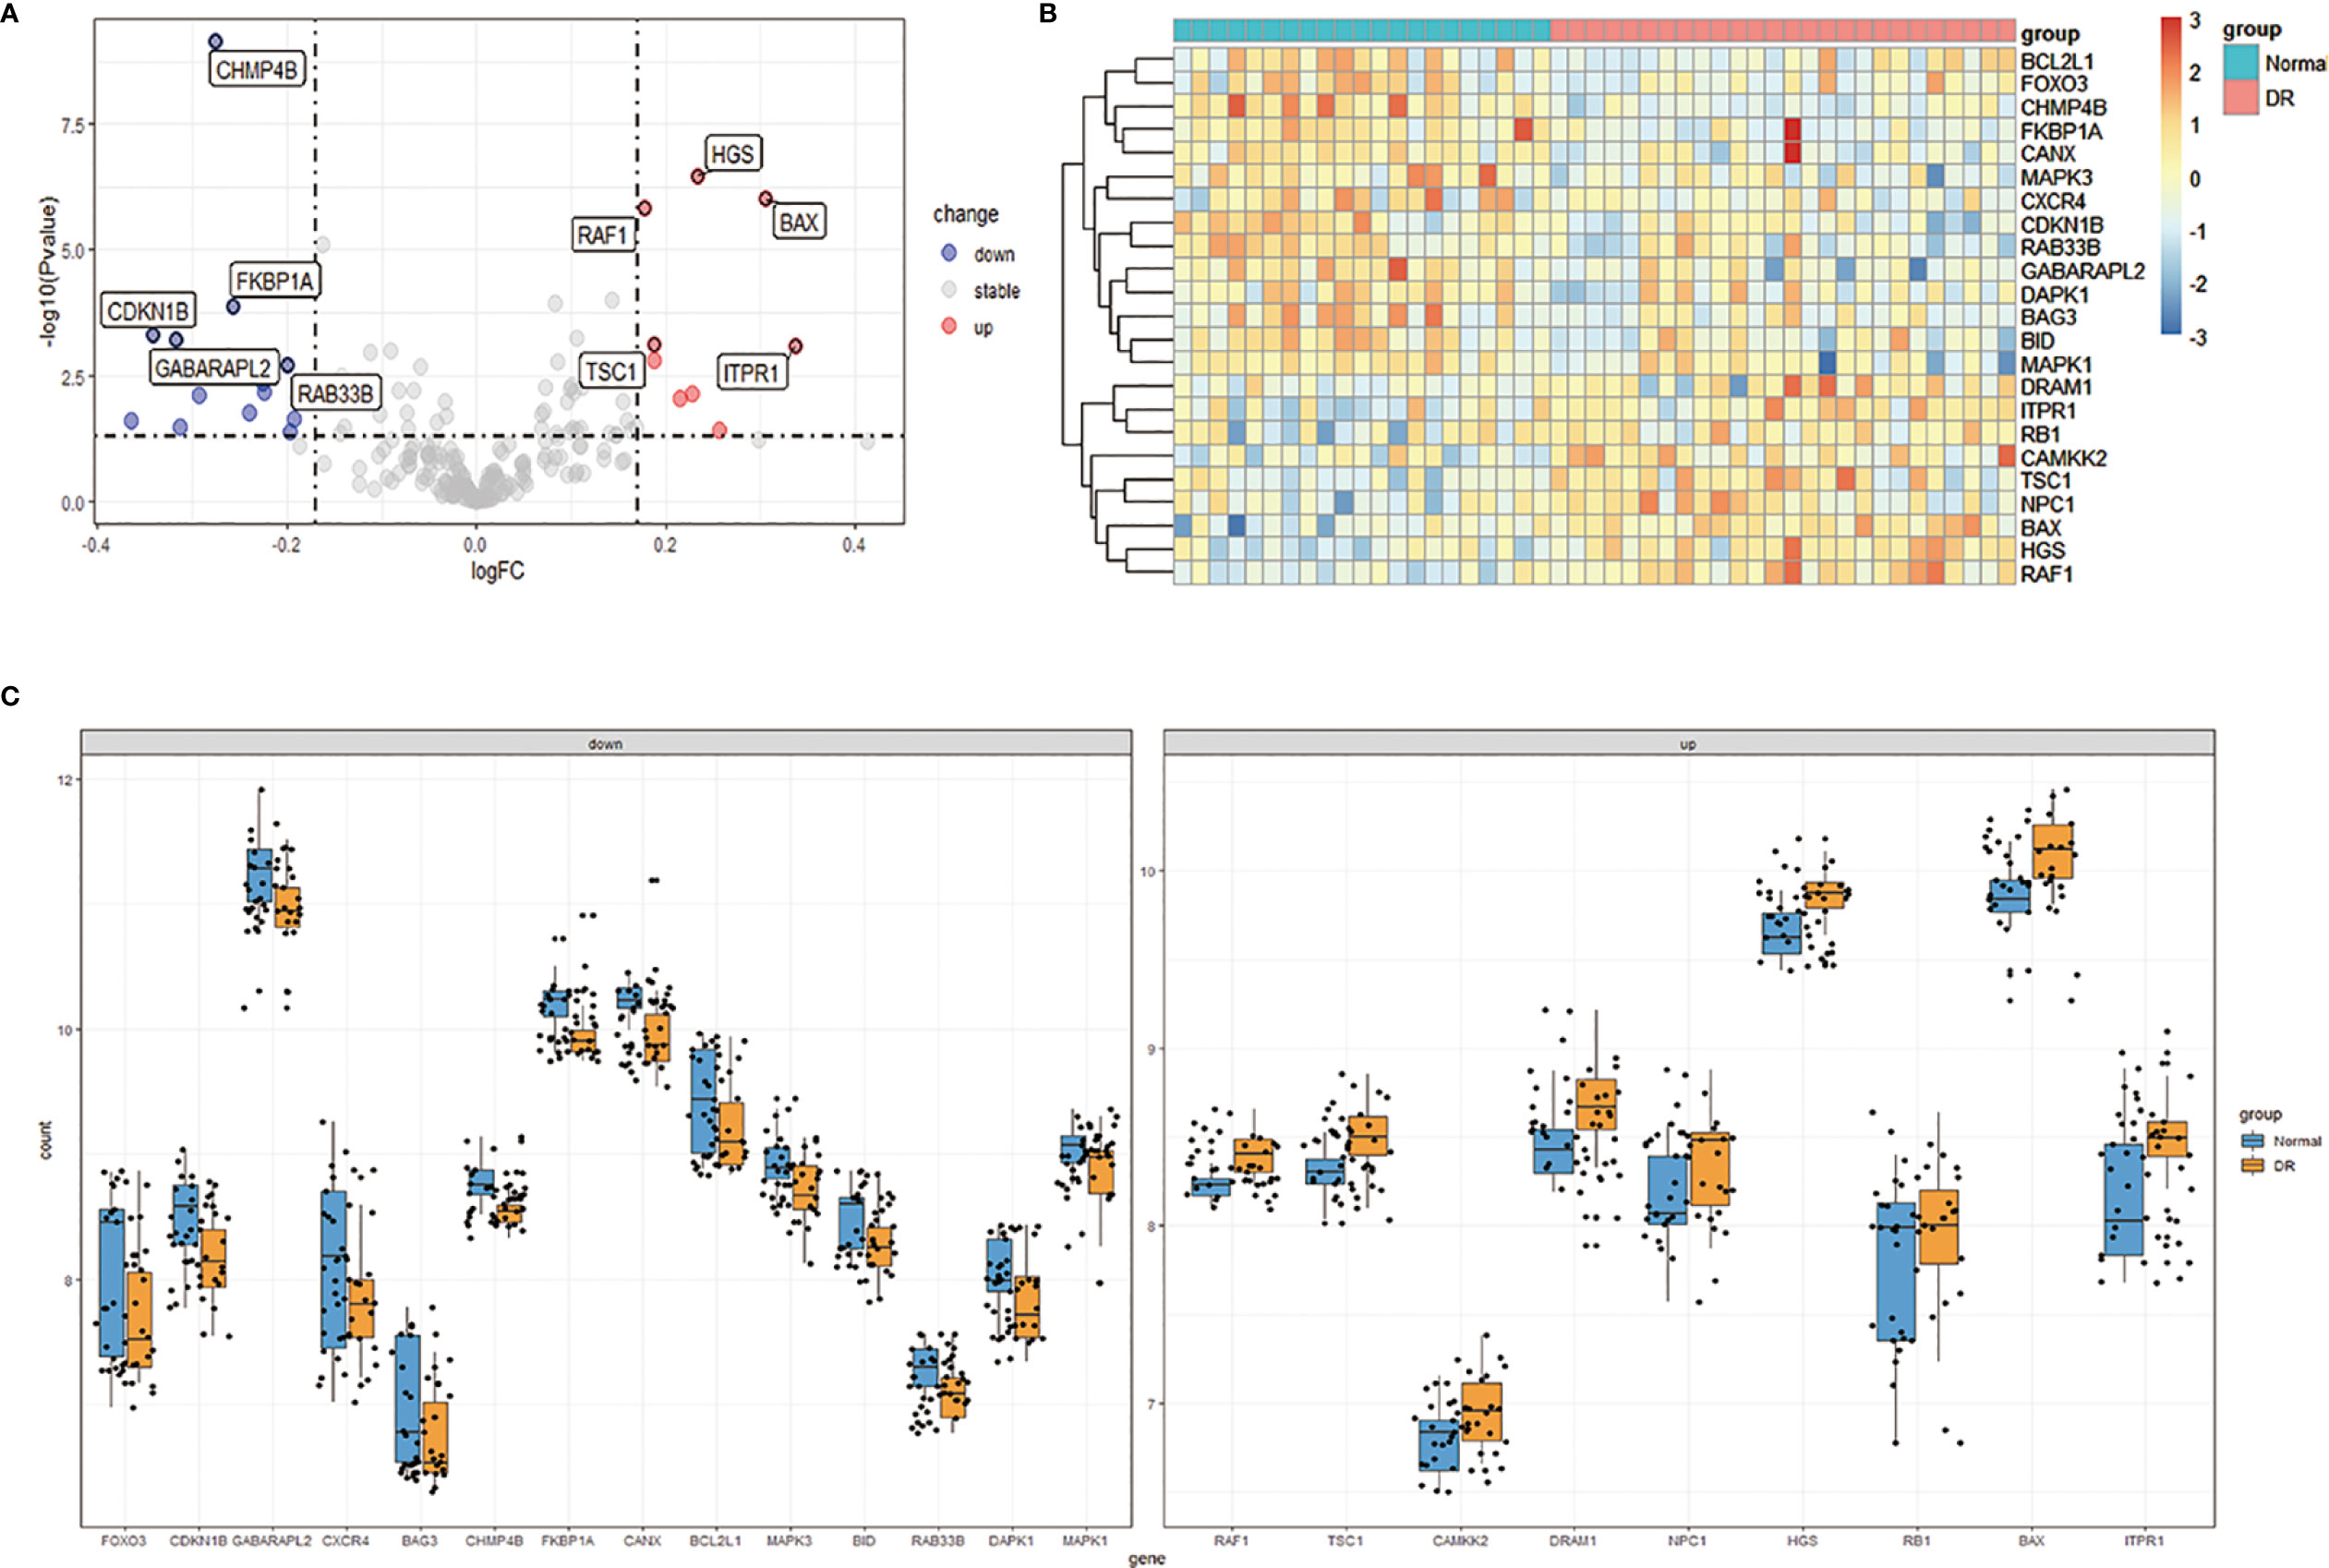
Figure 2 Differentially expressed autophagy-related genes in DR patients (DR group) and non-diabetic individuals (Normal group). (A), Volcano plot of 232 differentially expressed autophagy-related genes. The red dots in the picture represent significantly up-regulated genes, blue dots represent significantly down-regulated genes, black dots represent genes that are not differentially expressed, and the five genes that are most significantly up-regulated or down-regulated are marked. (B), The heatmap of 232 differentially expressed autophagy-related genes. Red represents up-regulated genes and blue represents downregulated genes. (C), The boxplot of 23 differentially expressed autophagy-related genes in DR and normal samples. It includes 9 up-regulated genes and 14 down-regulated genes. DR, diabetic retinopathy.
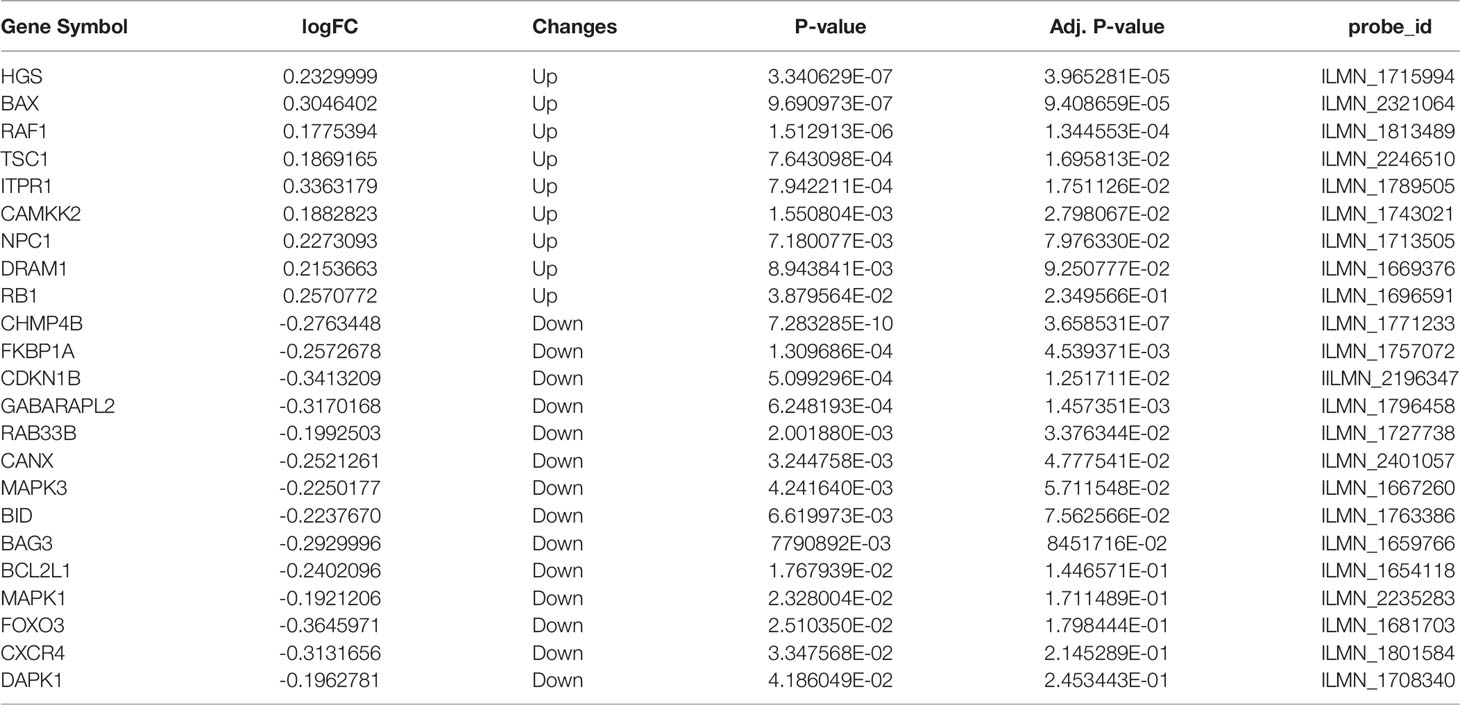
Table 1 The 23 differentially expressed autophagy-related genes in DR samples compared to healthy samples.
In order to explore the expression correlation of these 23 autophagy-related genes, the correlation analysis has been performed by bioinformatics methods. The results showed that there was a high correlation between up-regulated genes and down-regulated genes, respectively (Figures 3A, B). At the same time, we identified the expression of these 23 genes in human retina by BioGPS. Except for CAMKK2, the expression levels of the other 22 genes in the retina were higher than the average levels in the tissues or organ systems of the whole body. Among them, the expression levels of 6 genes such as RAF1 in the human retina were more than three times the median, indicating that these autophagy-related genes were enriched in the human retina (Table 2).
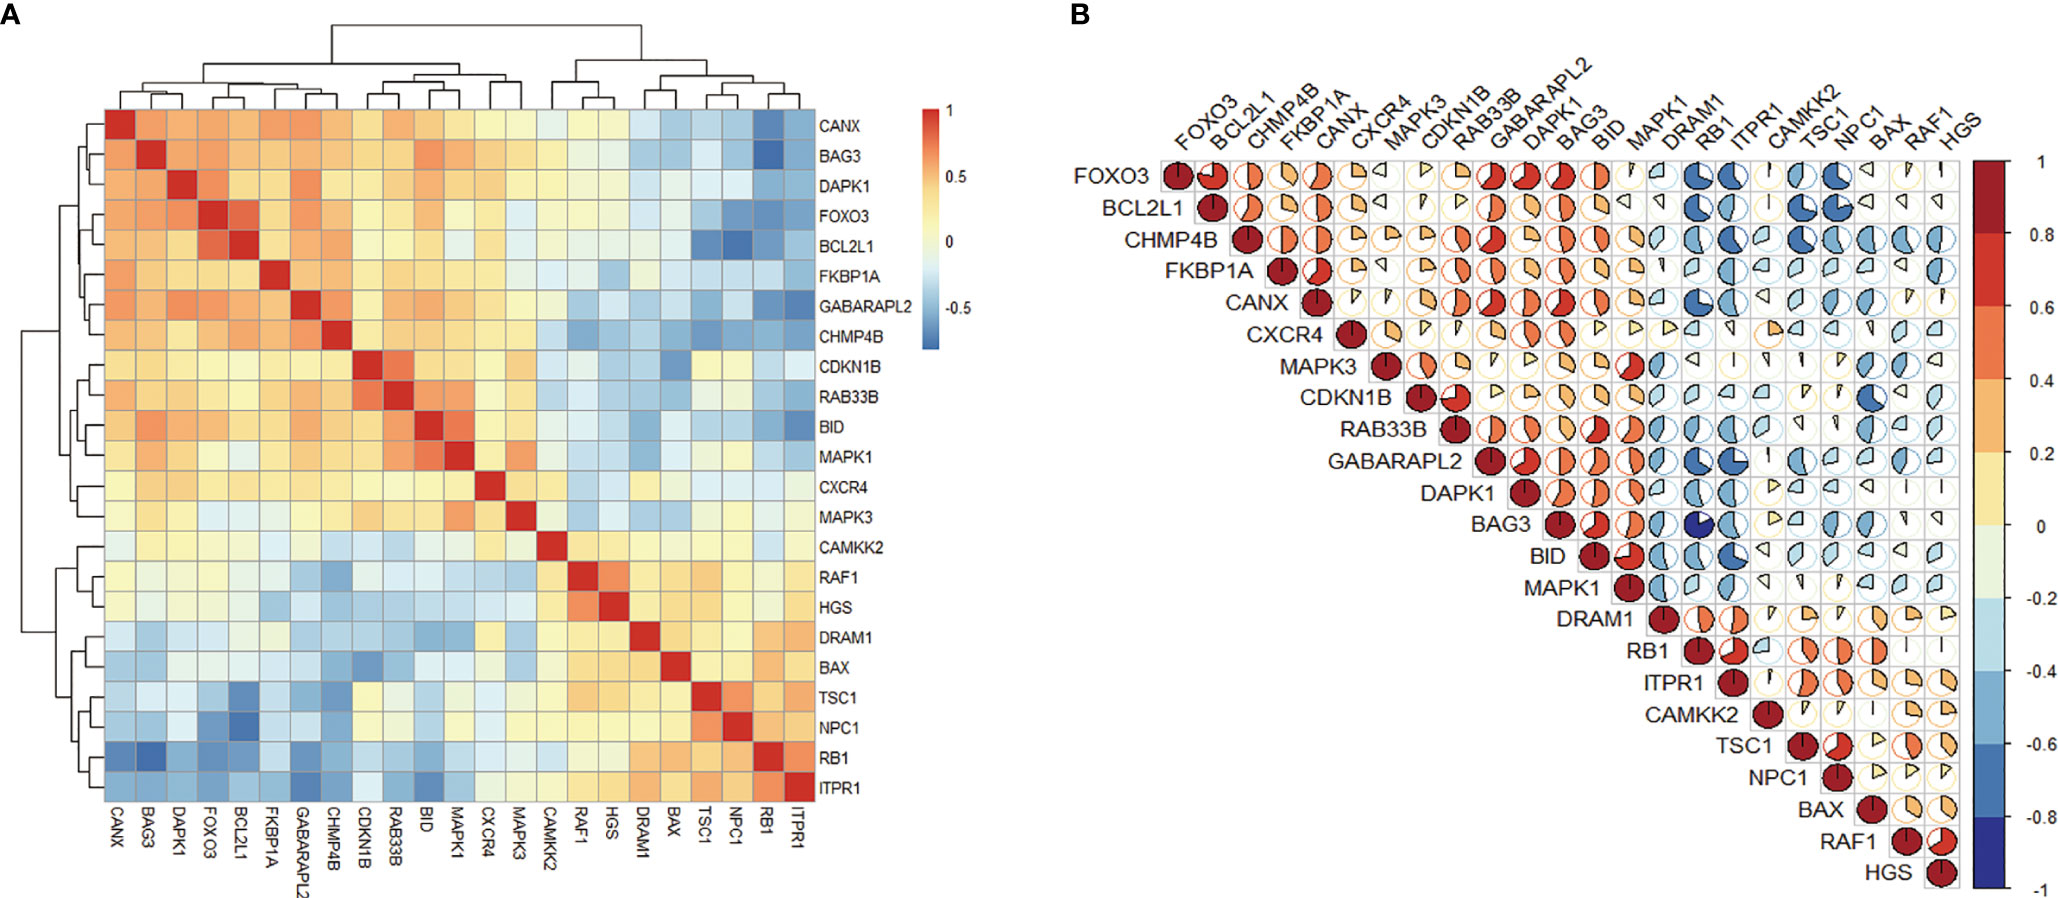
Figure 3 Correlation analysis of 23 differentially expressed autophagy-related genes. (A, B), Correlation heatmap.
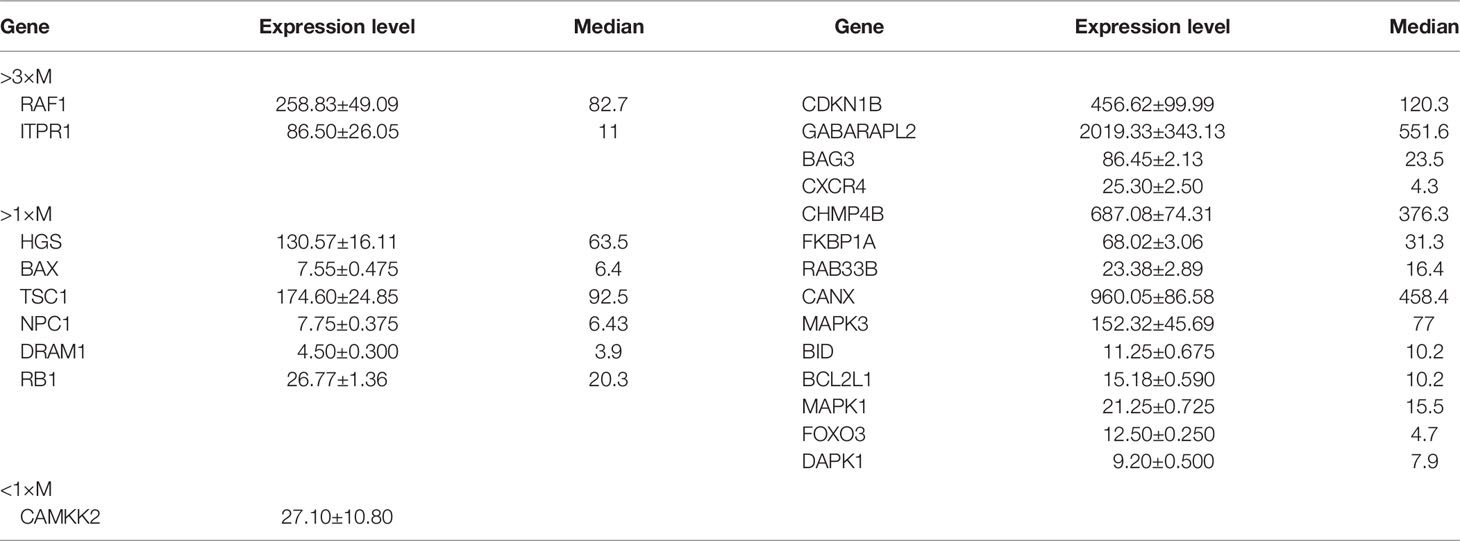
Table 2 Expression levels of dierentially expressed genes identified by BioGPS in retinal tissues.
In order to explore the potential function of differential genes more deeply from the level of biological function, we used R software for GO and KEGG enrichment analysis (Table 3). GO enrichment analysis showed that the differential genes were significantly enriched in 441 BPs, 20 MFs and 19 CCs. Among them, the most prominent projects involved regulation of autophagy, positive regulation of catabolic process, macroautophagy, positive regulation of autophagy (BPs); late endosome, mitochondrial outer membrane, organelle outer membrane (CCs); ubiquitin-like protein ligase binding, chaperone binding, BH domain binding (MFs) (Figures 4A–D). The relationship between these pathways was shown in the (Figure 5A). There were 12 common genes in the three most prominent pathways, namely CDKN1B, BAX, DAPK1, FOXO3, BAG3, MAPK3, CHMP4B, DRAM1, NPC1, CAMKK2, ITPR1 and TSC1 (Figure 5B). Besides, we analyzed the expression of differential genes in the significantly enriched pathway and showed the results in the Heatmap-like functional classification map (Figure 5C). In addition, the KEGG results showed that the enrichment was mainly in the process of autophagy, human cytomegalovirus infection and so on (Figures 6A, B).
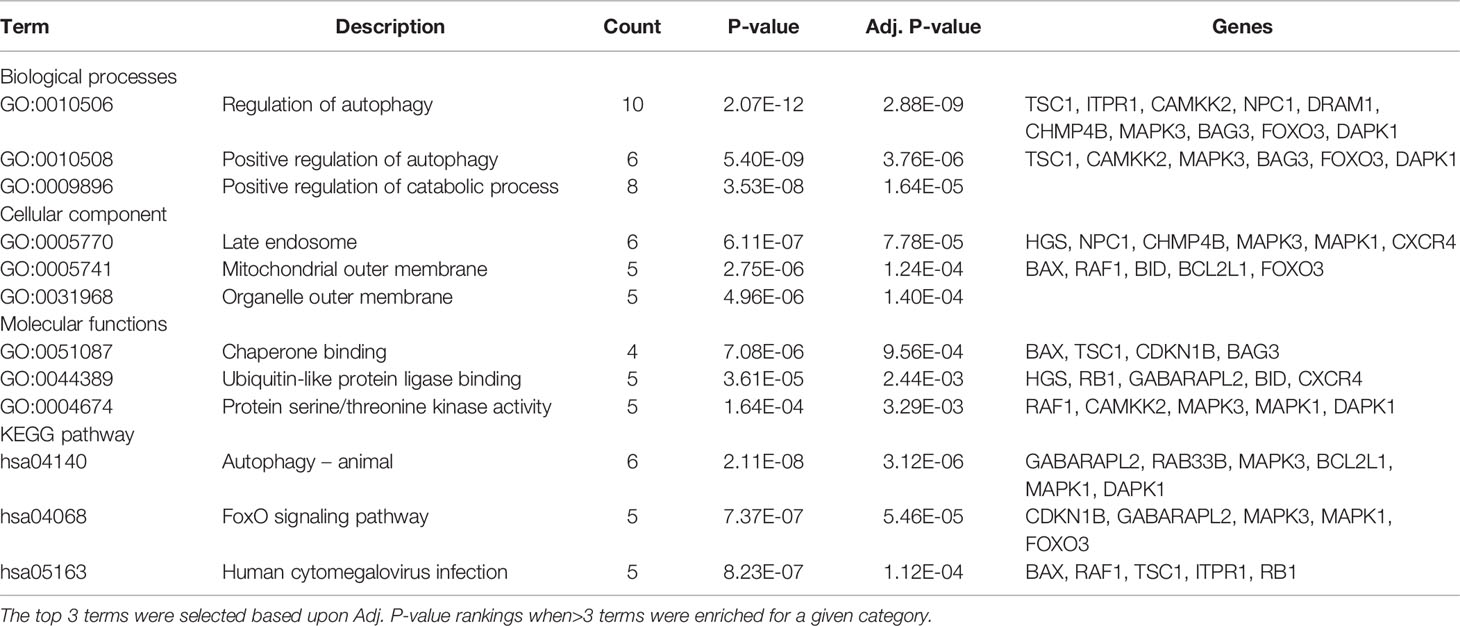
Table 3 Functional and pathway enrichment analyses for module genes.
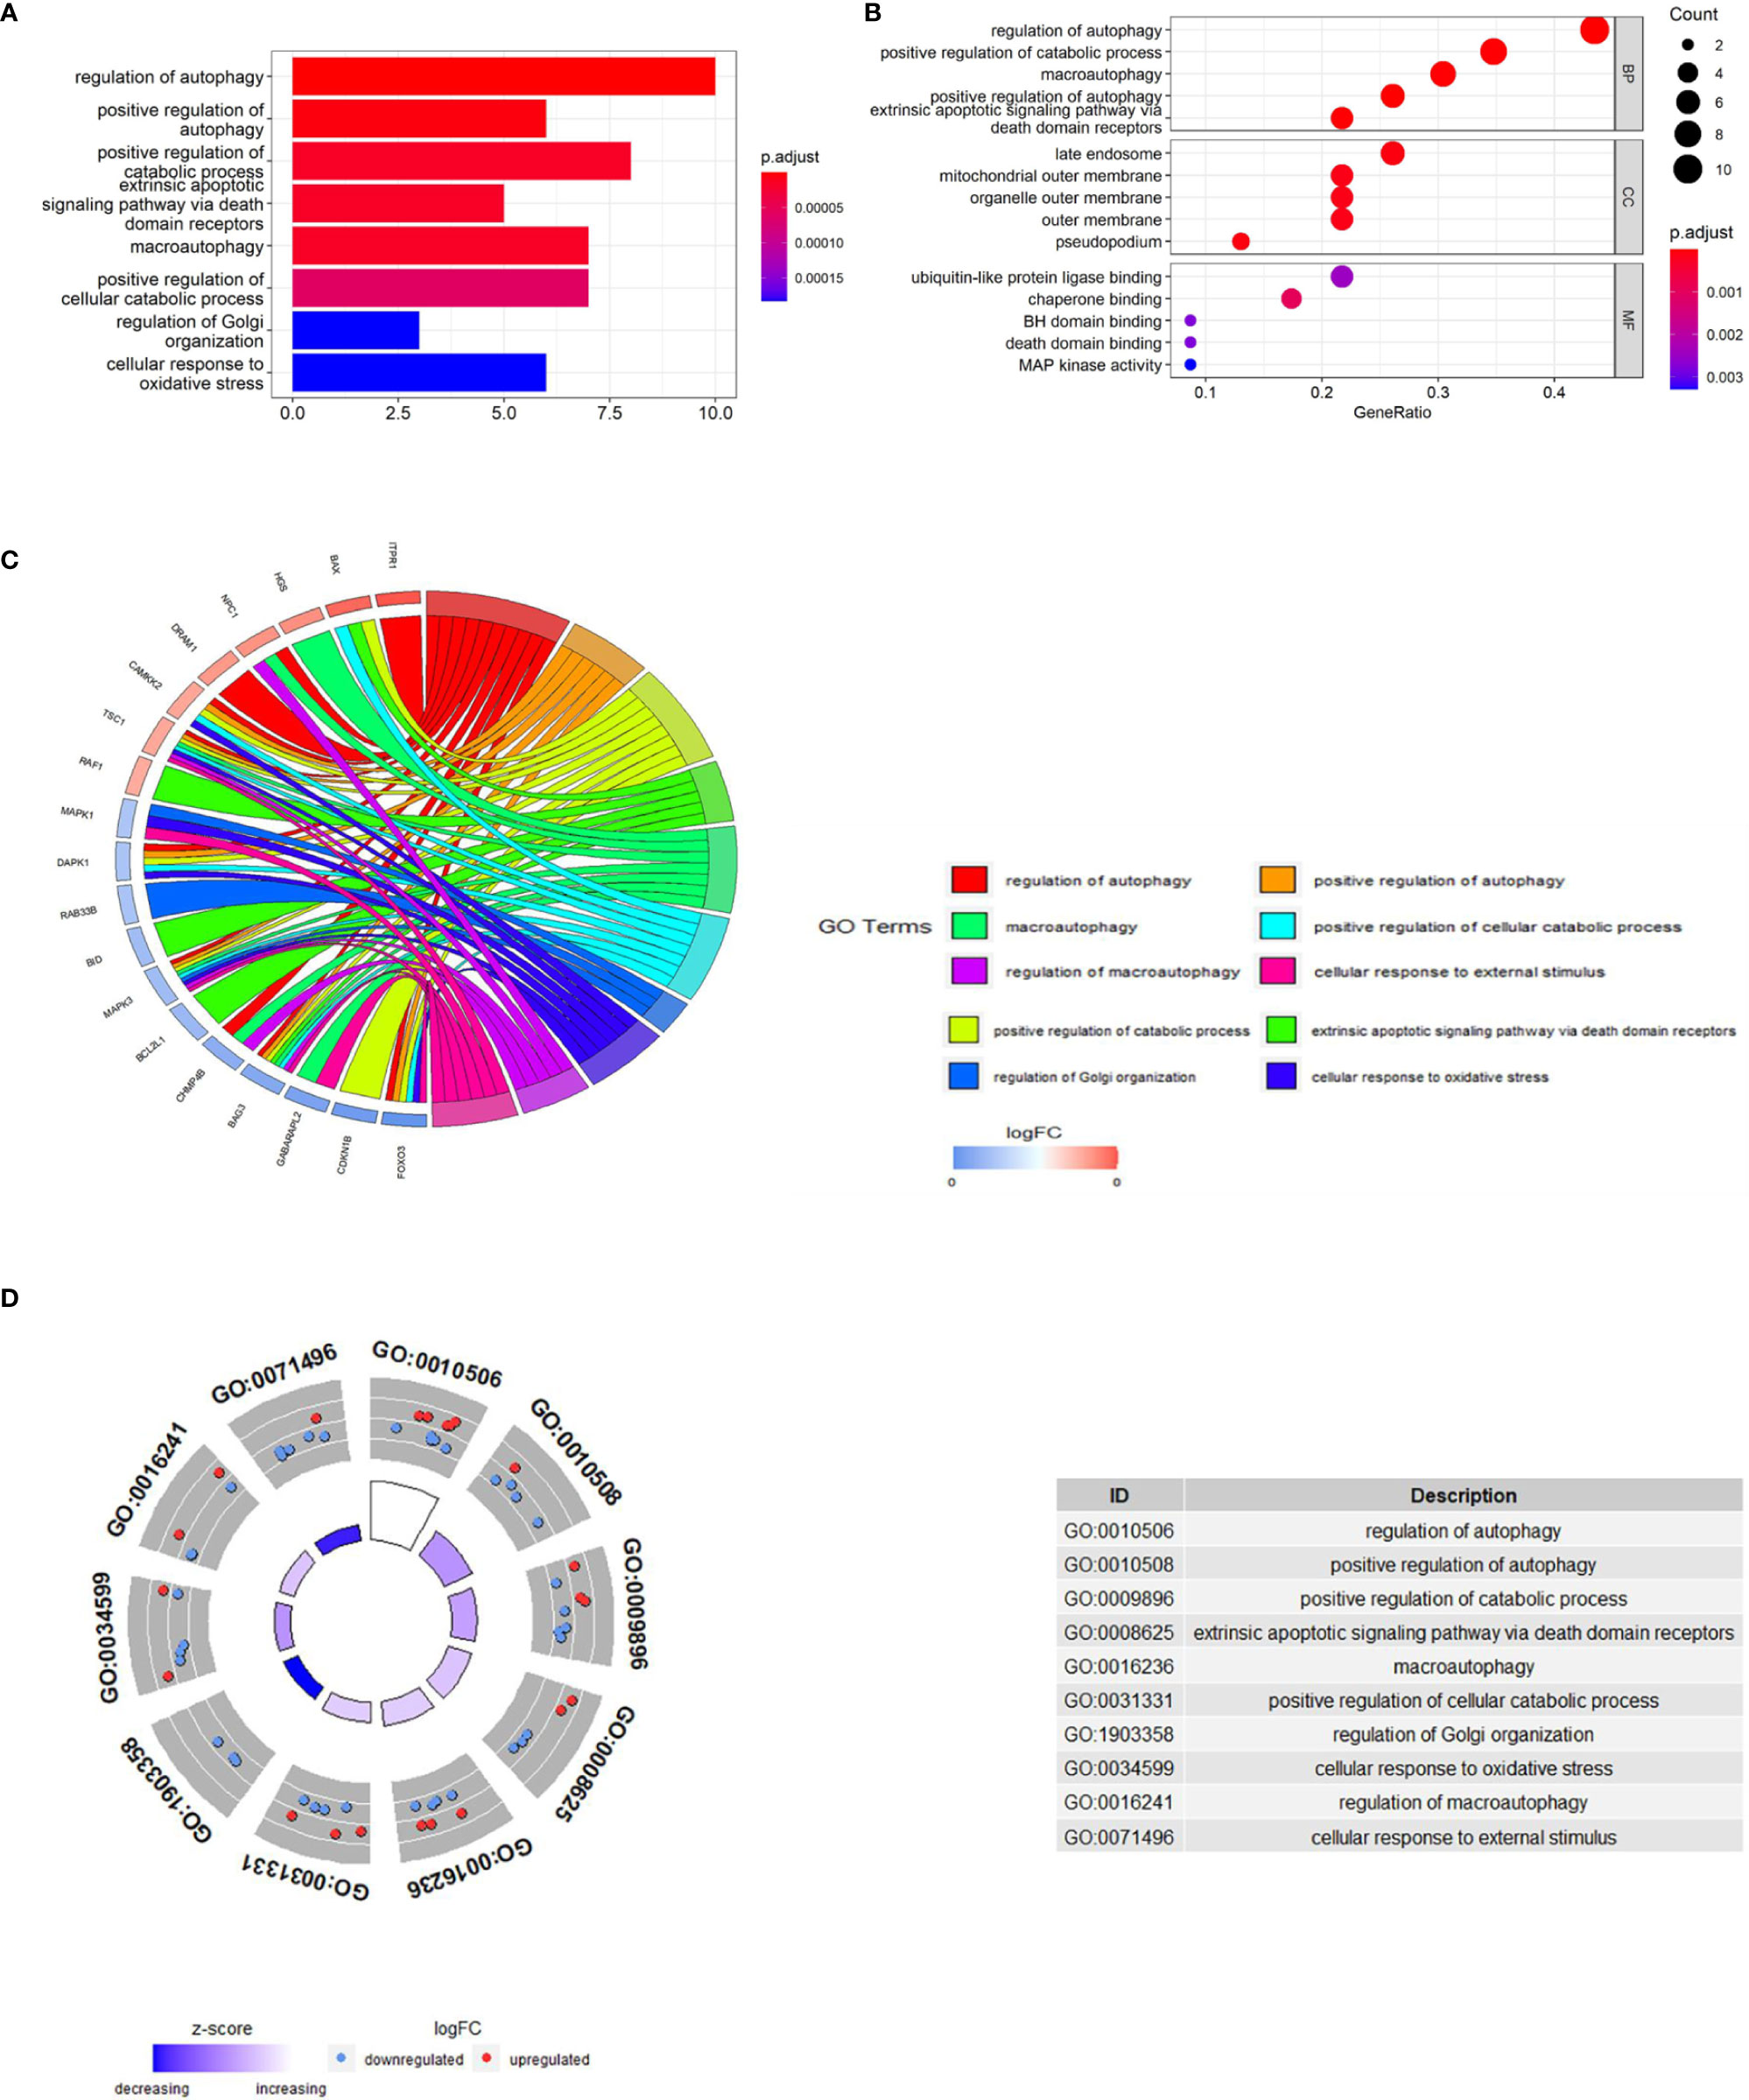
Figure 4 GO enrichment analysis of 23 differentially expressed autophagy-related genes, including BPs, CCs and MFs. (A), Bar plot of enriched GO terms. (B), Bubble plot of enriched GO terms. (C), Chordal graph of enriched GO terms. It shows the relationship between DEGs and the first 10 enriched GO pathways. (D), Eight Diagrams of enriched GO terms. GO, Gene Ontology; BPs, biological processes; CCs, cellular components; MFs, molecular functions; DEGs, differentially expressed genes.
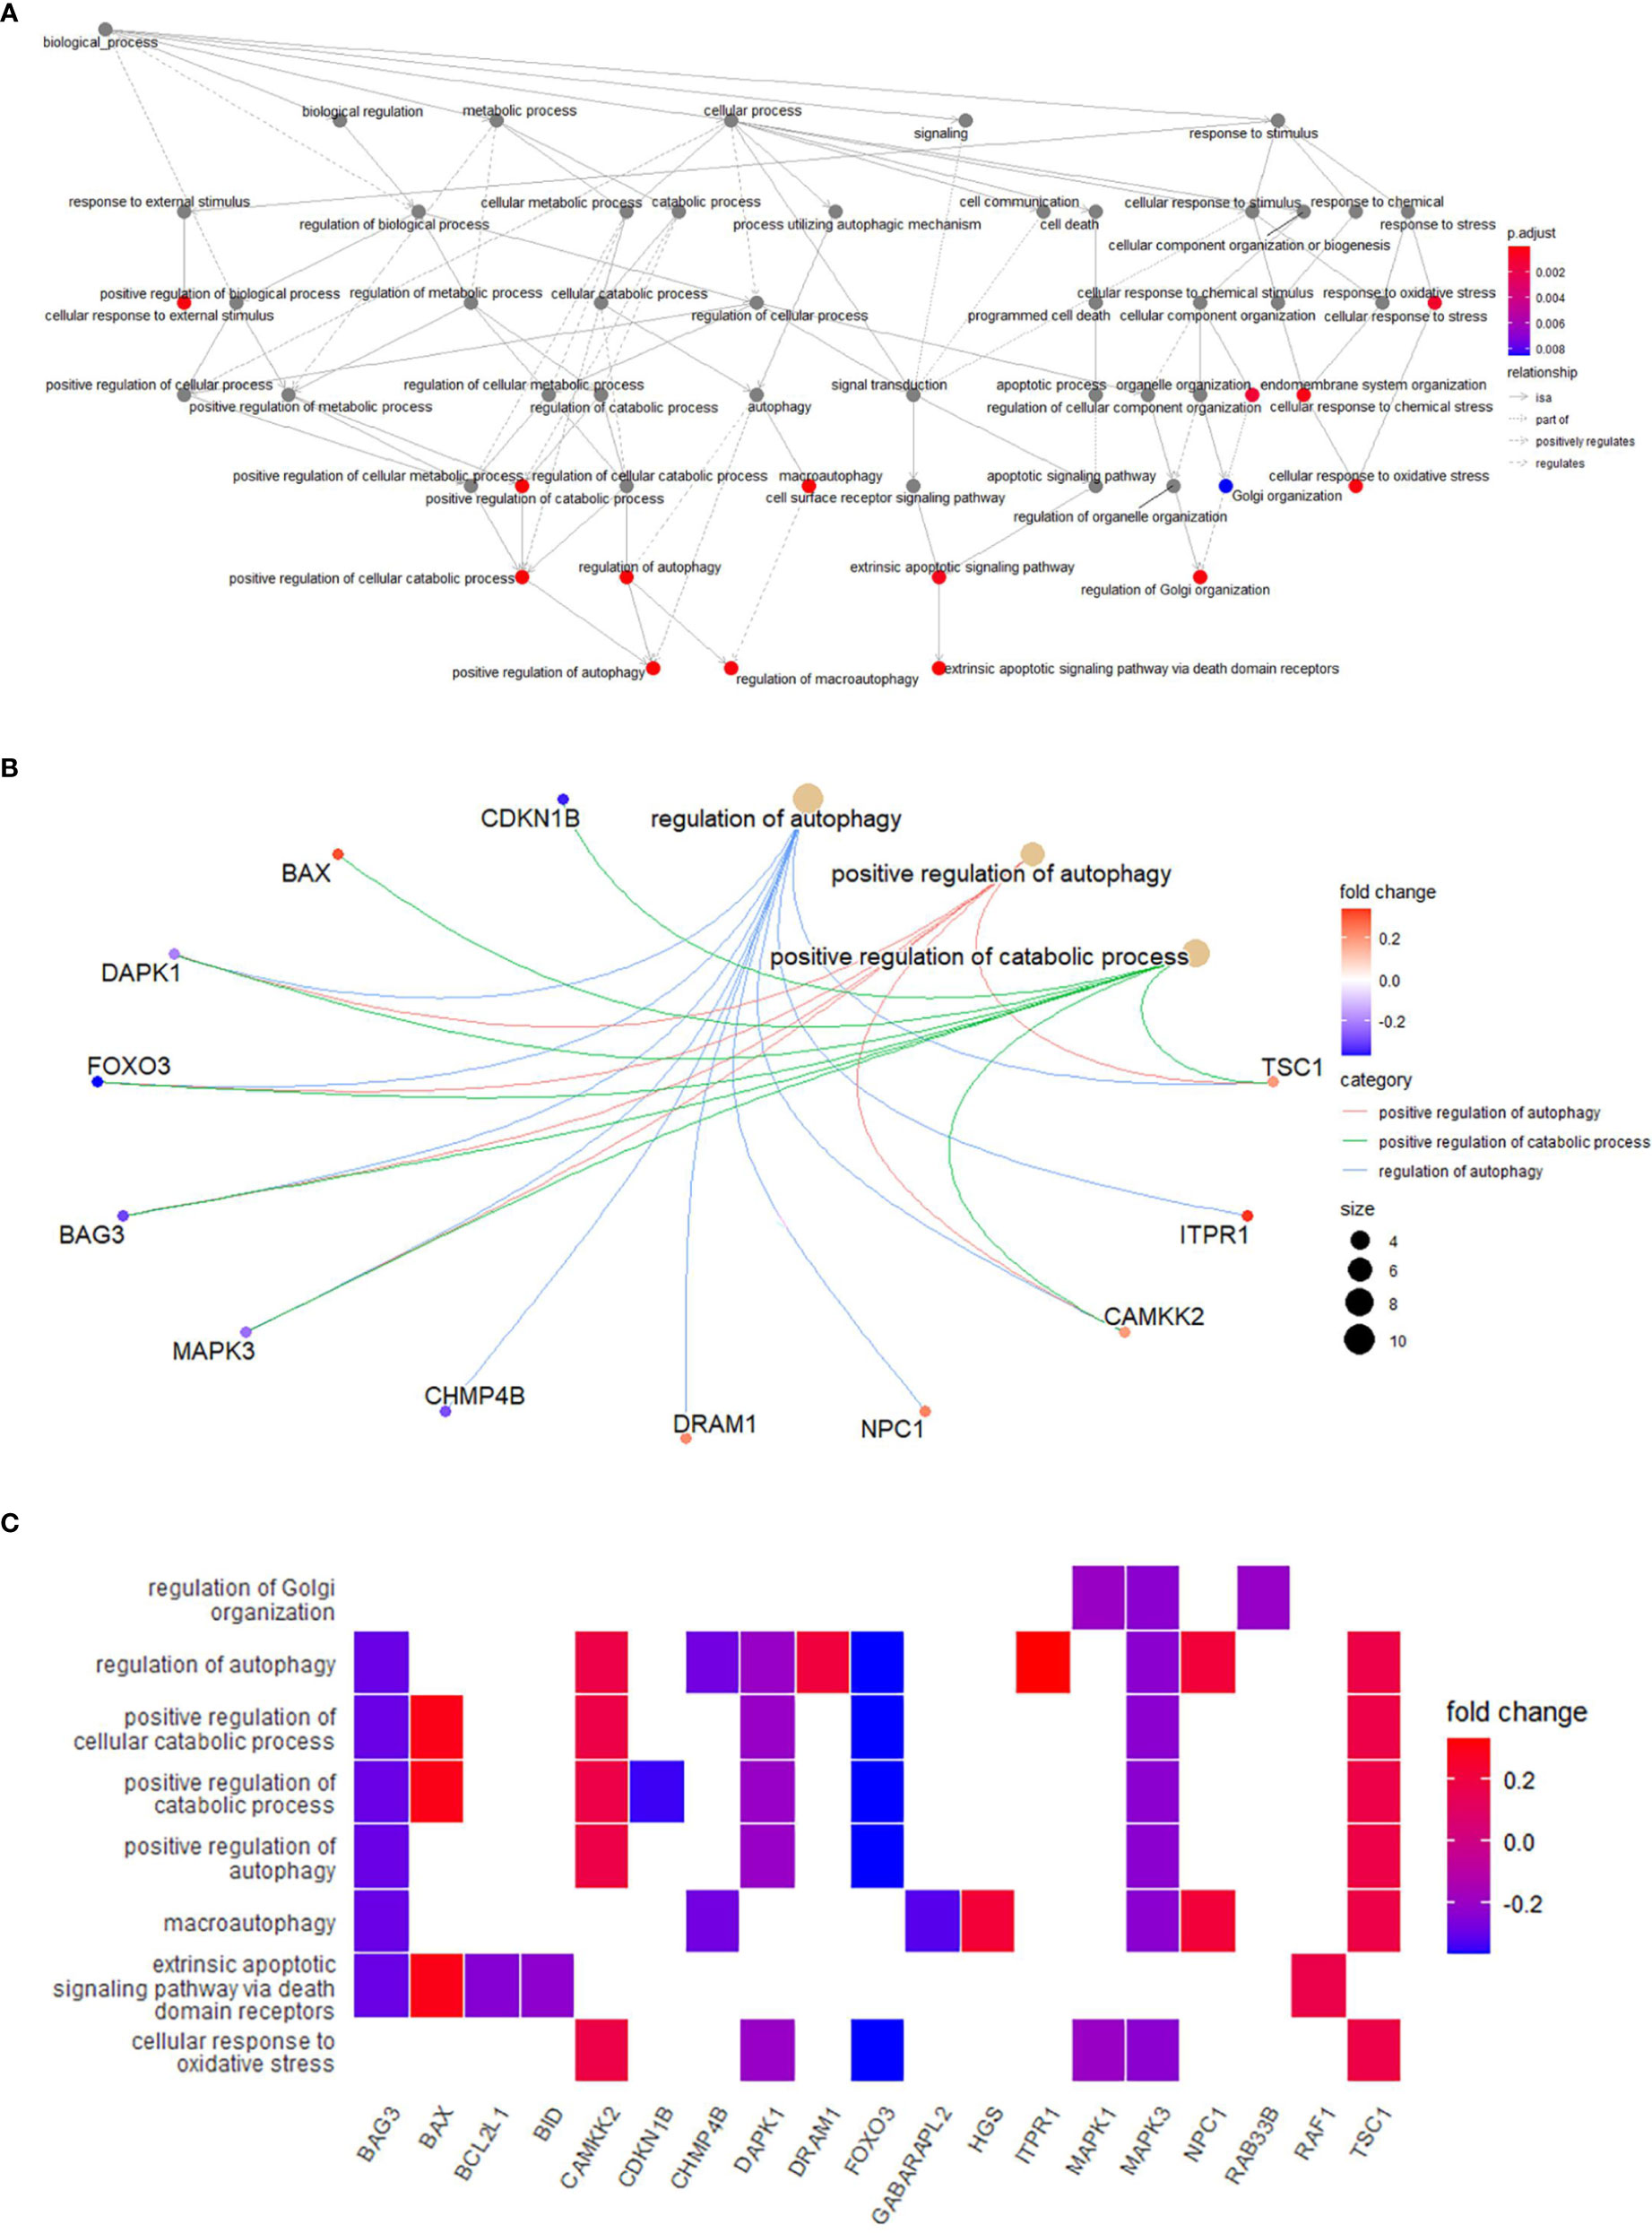
Figure 5 (A), Relationships between enriched pathways. (B), Common genes in the most top pathways. (C), Heatmap-like functional classification.
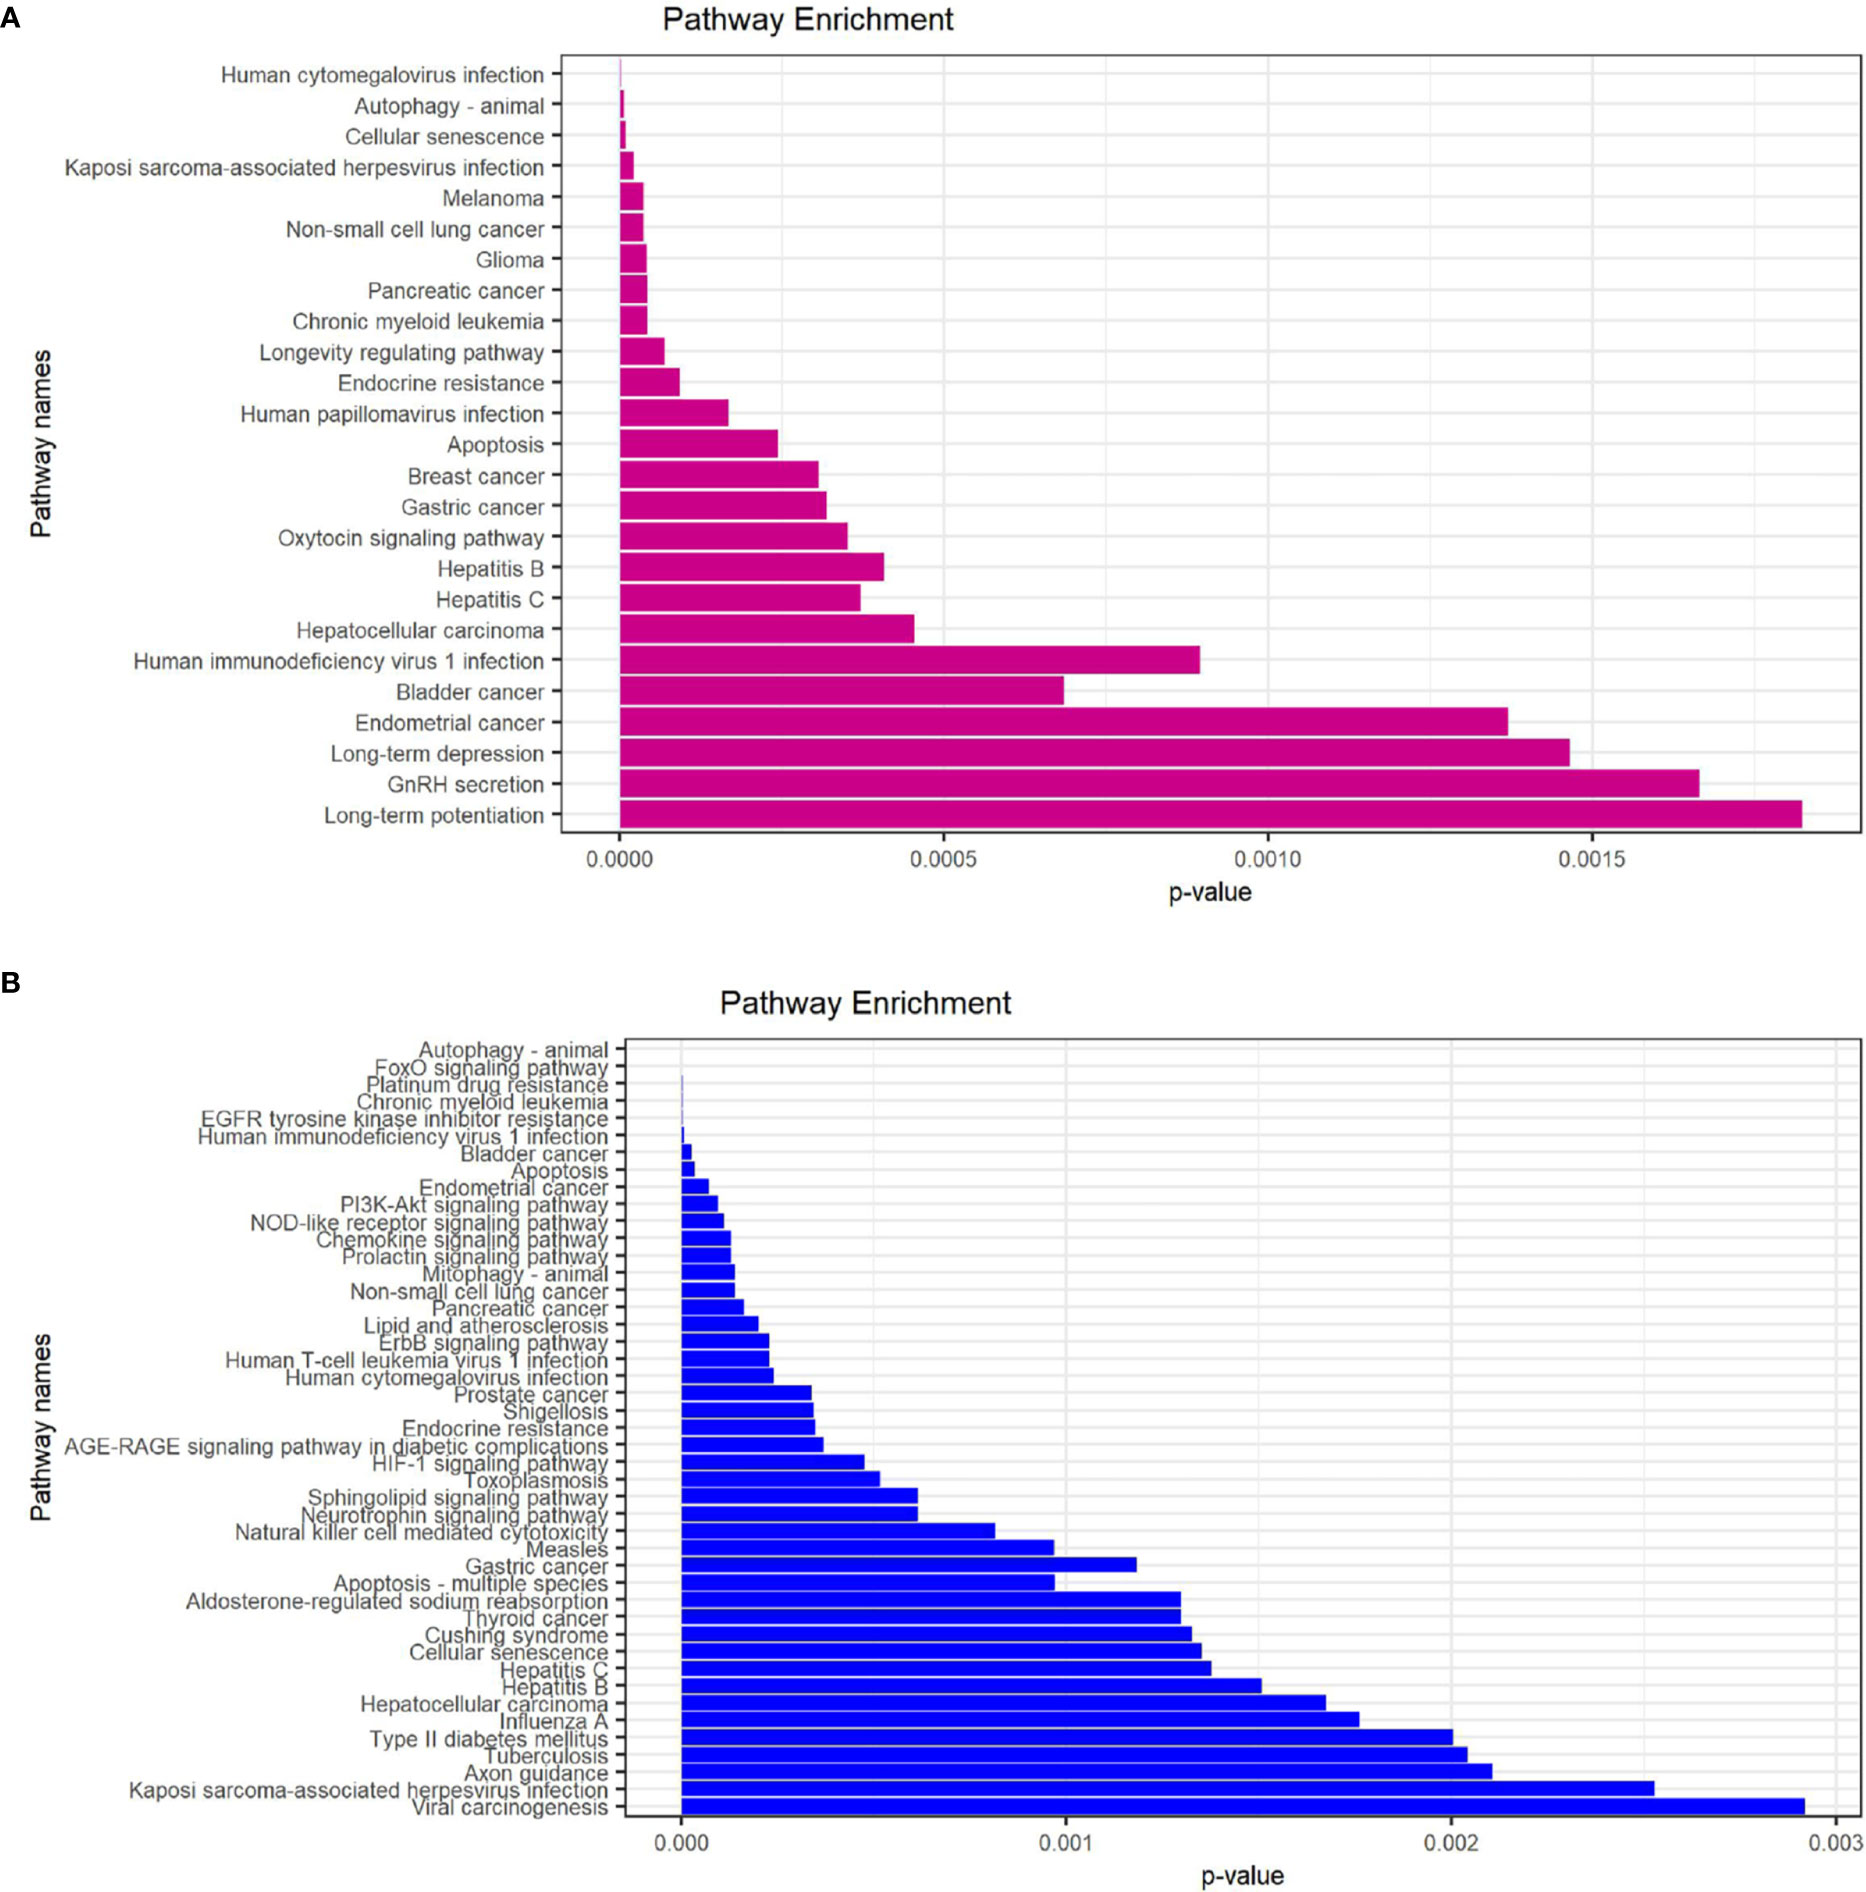
Figure 6 KEGG enrichment analysis of 23 differentially expressed autophagy-related genes. (A), KEGG analysis of 9 up-regulated expressed autophagy-related genes. (B), KEGG analysis of 14 down-regulated expressed autophagy-related genes. KEGG, Kyoto Encyclopedia of Genes and Genomes.
Toward a deeper understanding of the interaction between differentially expressed autophagy-related genes, we introduced these genes into the Search Tool for the Retrieval of Interacting Genes (STRING) to construct a PPI network (Figure 7A). The first 10 hub genes with the highest value were screened by Cytoscape (v3.9.0) (Table 4). Among them, TSC1, RAF1, RB1, ITPR1 is up-regulated and CDKN1B, MAPK1, FOXO3, DAPK1, MAPK3, BCL2L1 was down-regulated. The disorders of these autophagy motifs may be closely related to the occurrence and development of DR (Figure 7B).
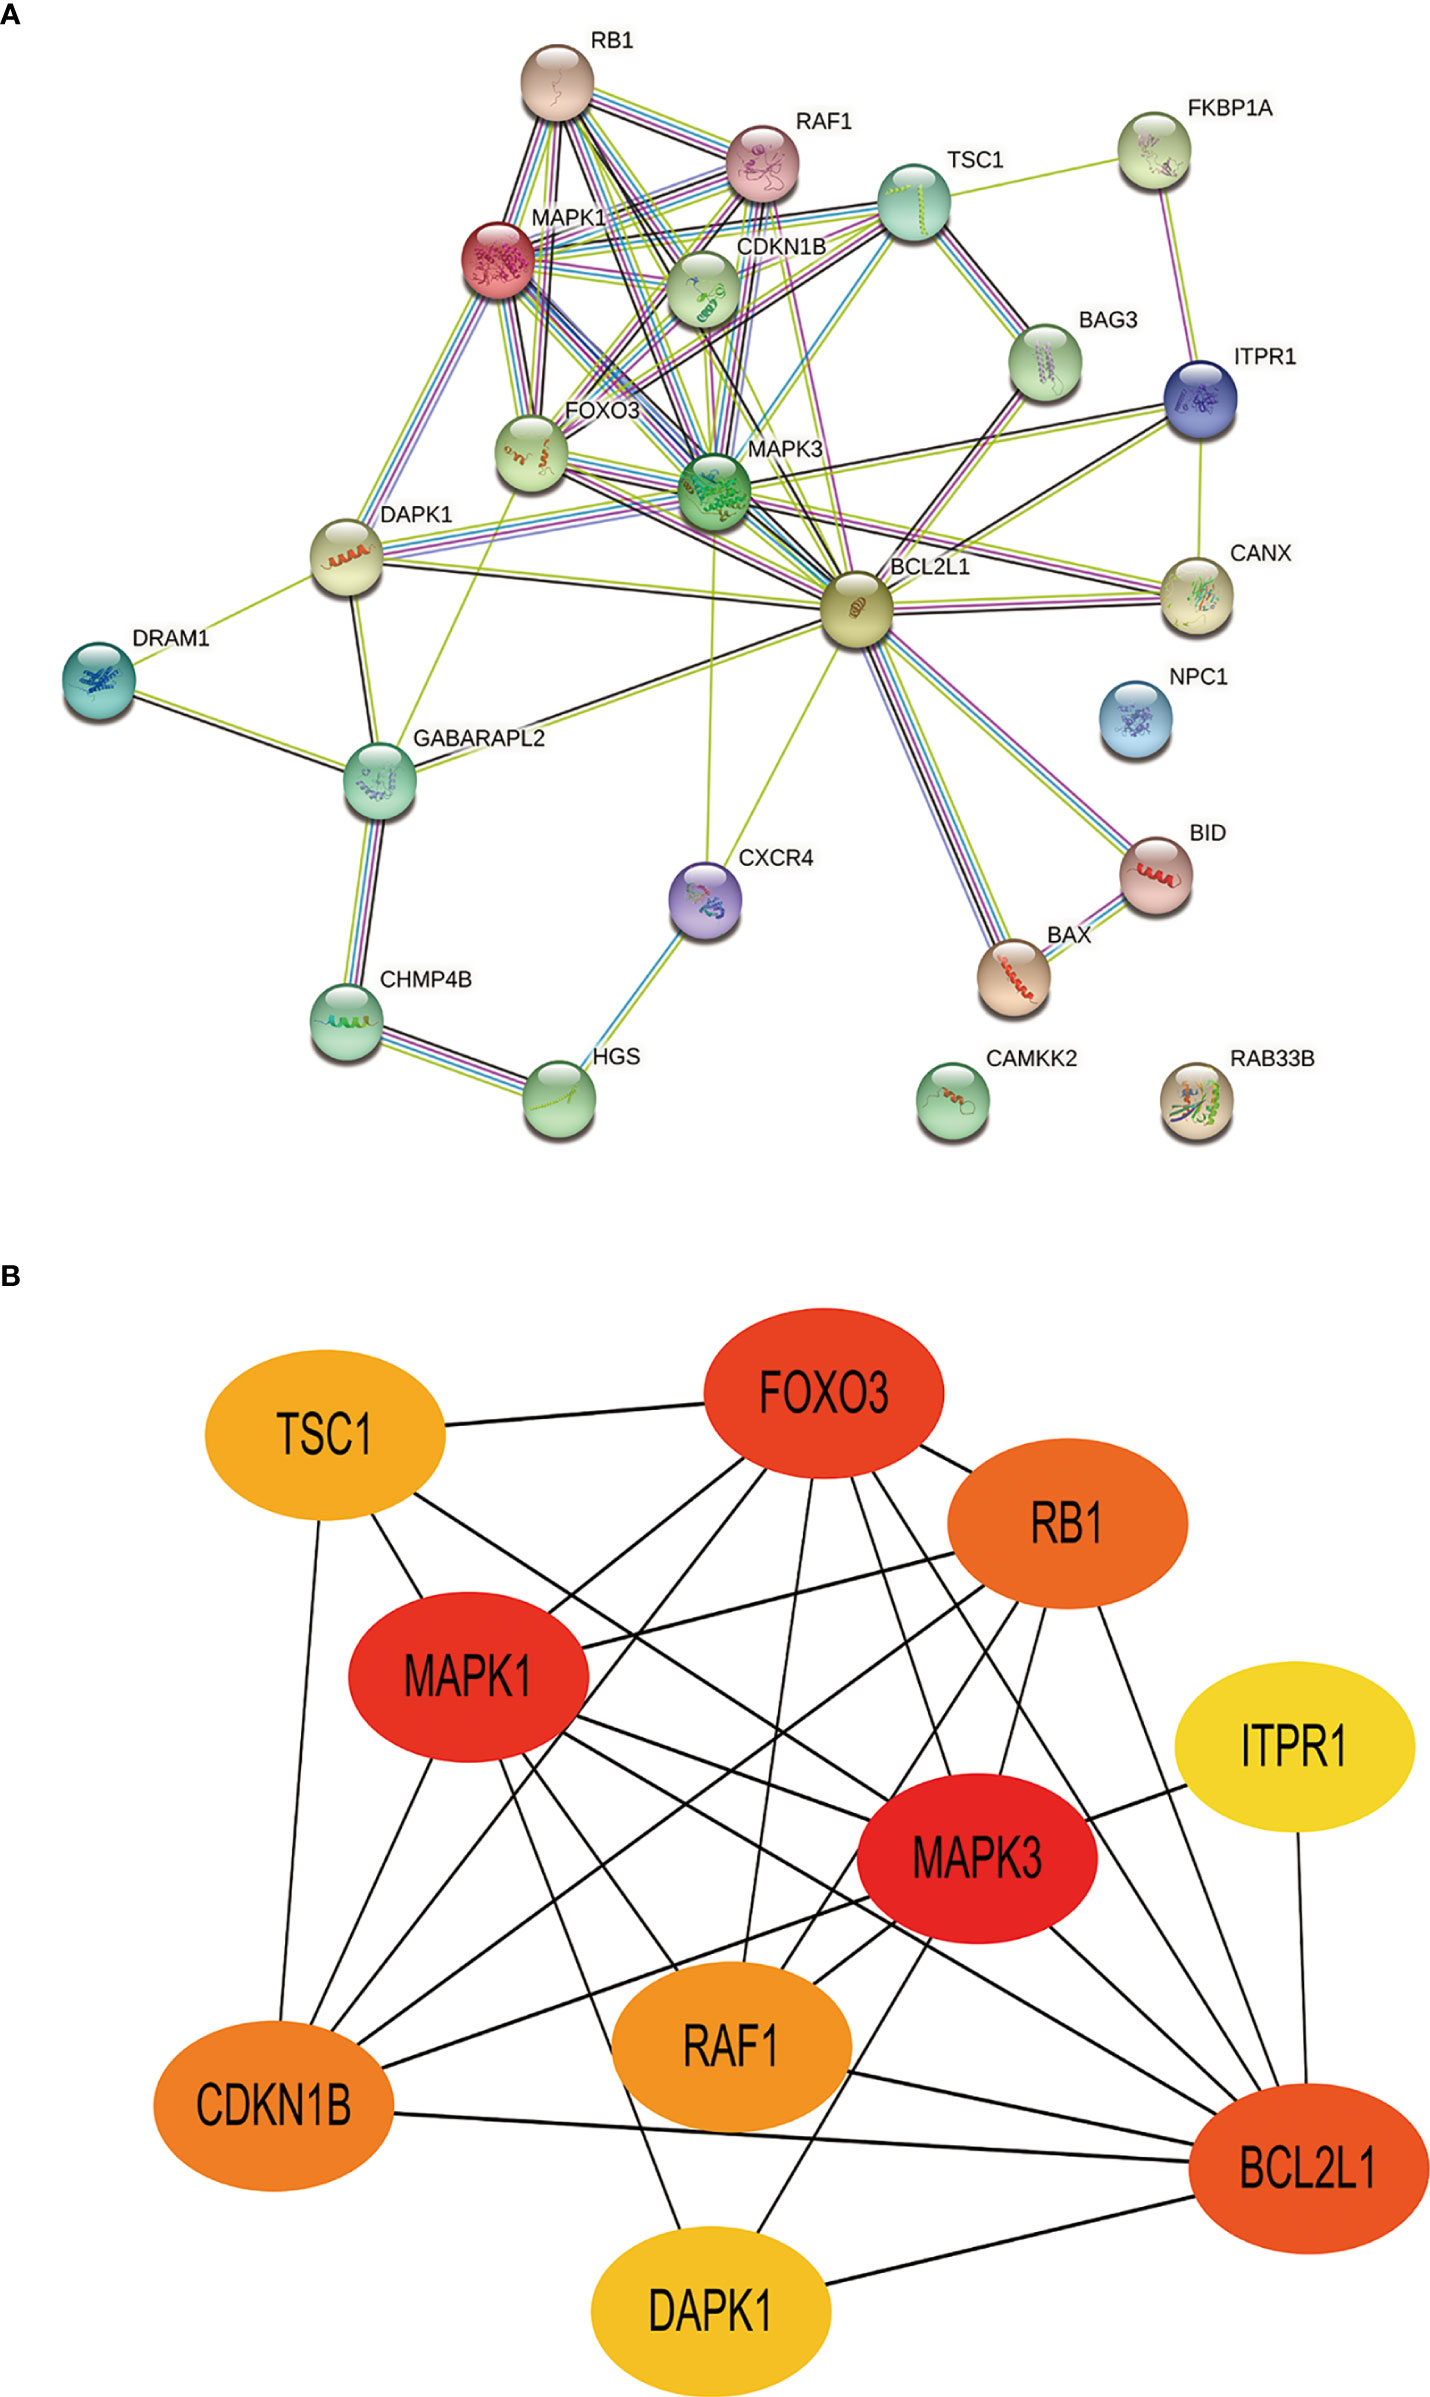
Figure 7 Construction of PPI network and identification of hub genes. (A), The PPI between 23 differentially expressed autophagy-related genes was constructed by using the STRING database. The node represents the gene, and the edge represents the relationship between the genes. (B), The top 10 key genes were screened through the PPI network map. Different colors in the image only represent different genes and have no other substantive meaning. PPI, protein-protein interaction.

Table 4 Top 10 in network ranked by MCC method.
It was found that autophagy in RPE cells was related to damage of outer blood retinal barrier in diabetic retinopathy. Meanwhile, autolysosomes and autophagy associated markers were increased in RPE cells under HG condition (22–24). In this study, we incubated ARPE-19 cells with HG (30mM) to simulate an DR model in vitro. Interestingly, the expression of RAF1, RB1 and TPR1 were decreased and the level of TSC1 remained unchanged in HG treated ARPE-19 cells compared with the normal control cells. These genes were predicted to be upregulated according to aforementioned bioinformatics analysis. The level of CDKN1B, MAPK1, FOXO3, DAPK1 and BCL2L1 expected to be downregulated were found to be similar in both SG and HG treated ARPE-19 cells. The level of MAPK3 was decreased in ARPE-19 cells under HG condition, indicating MAPK3 and downstream signaling pathway might participate in the progression of DR by regulating autophagy in RPE cells (Figure 8).
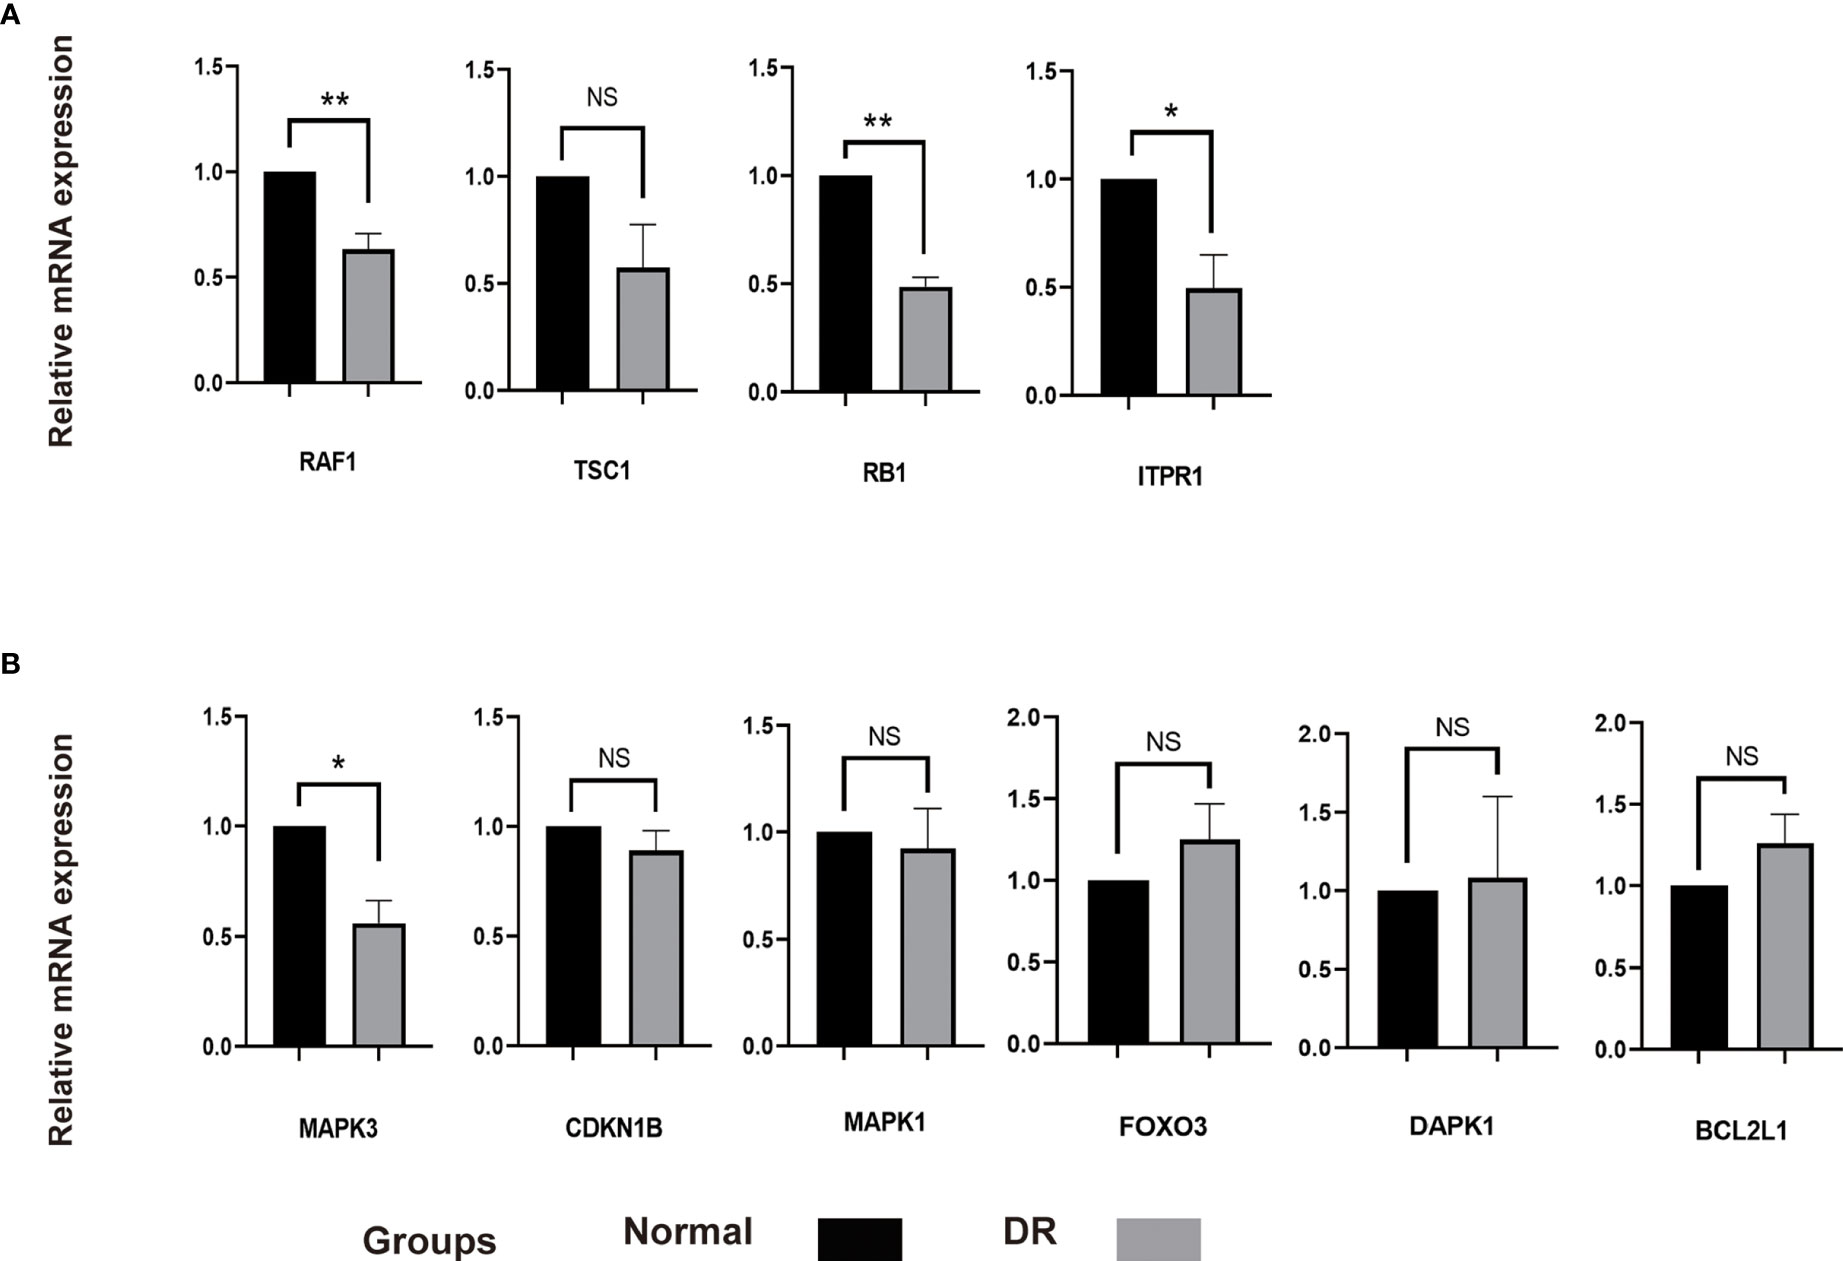
Figure 8 The mRNA level of 10 hub genes were measured in ARPE-19 cells. (A), The mRNA level of RAF1, TSC1, RB1 and ITPR1 were evaluated in cell samples by qRT-PCR. (B), The mRNA level of MAPK3, CDKN1B, MAPK1, FOXO3, DAPK1 and BCL2L1 were measured in cell samples by qRT-PCR. P-values were calculated using a two-sided unpaired Student’s t-test. *P < 0.05; **P < 0.01; ns, non-significant. ARPE-19, retinal pigment epithelial cell line; qRT-PCR, quantitative real-time polymerase chain reaction.
DR is a chronic progressive complication of patients with diabetes, which is an important cause of blindness in patients with diabetes (1, 25, 26). The pathogenesis of DR is complex. Current studies have shown that a variety of metabolic pathways are involved in the formation of DR, such as the increase of polyol pathway, the activation of protein kinase C, oxidative stress and endoplasmic reticulum stress (5, 6). The abnormality of these pathways can not only cause microvascular complications such as the destruction of blood-retinal barrier (27, 28), but also lead to neurodegeneration and neuroinflammation (29). However, the exact pathogenic mechanism of DR has not been fully elucidated. Accumulating evidence show that autophagy, as the main catabolic pathway for the degradation and recycling of damaged proteins or organelles, may be involved in the pathogenesis of DR. Long-term hyperglycemia can cause autophagy disorder by inhibiting mTOR, resulting in the loss of retinal ganglion cells (30). In addition, low glucose (15mM) could induce mitochondrial autophagy in RPE cells, while under the stimulation of HG (50mM) or hydrogen peroxide, ROS could mediate the inactivation of mitochondrial autophagy-related proteins PINK1 and Parkin, and inhibited the occurrence of mitochondrial autophagy, indicating that glucose affected the occurrence of mitochondrial autophagy in RPE cells in a dose-dependent manner (31). Other studies have shown that knockout of high mobility group box1 (HMGB1) gene in RPE cells in the early stage of DR could save lysosome membrane permeabilization (LMP) through cathepsin B (CTSB)-dependent pathway. It restored the degradation ability of autophagy and thus protected RPE cells from apoptosis (32). The above results show that many forms of autophagy participate in the occurrence and development of DR, but its specific mechanism remains unclear. Further studies are required to broaden our knowledge of autophagy in the pathogenesis of DR.
In this study, we identified 23 potential autophagy-related genes in DR for the first time through bioinformatics analysis. GO and KEGG enrichment analysis showed that these genes were closely related to regulation of autophagy, positive regulation of catabolic process, macroautophagy and other signal pathways. Next, we further identified 10 hub genes related to DR, including TSC1, RAF1, RB1, ITPR1, CDKN1B, MAPK1, FOXO3, DAPK1, MAPK3 and BCL2L1 by using PPI network and key module analysis. The function of these genes in the occurrence of DR has been extensively studied. For example, Ras/Raf-1/MEK/ERK signal cascade can promote the activation of MMP9, and Raf kinase can also interact with VEGF to promote the loss of retinal capillary cells, which eventually leads to the development of DR (33–36). Overexpression of Raf-1 Kinase Inhibitory Protein (RKIP) can prevent the occurrence of diabetic retinal neurodegeneration by inhibiting p38-MAPK pathway (37). Hu-zhang-qing-mai-yin (HZQMY) can regulate P38 and NF-κB pathways by targeting MAPK3 and inhibit the release of ROS under HG exposure in a dose-dependent manner, thus inhibiting the proliferation of human retinal capillary endothelial cells (HRCECs) and having a certain effect on DR (38). Studies have shown that these autophagy-related genes regulate autophagy activity in tumor, cerebral ischemic stroke and osteoporosis (39–42). However, the role of these genes in modulating autophagy in DR has not been fully explored.
In current study, HG treated ARPE-19 cells were used as DR model to testify the function of potential autophagy-related genes. It is due to following reasons. Firstly, the dysfunction and loss of RPE cells has been found in diabetic model. It is associated with macular edema arising from diabetes-induced disruption of outer blood-retinal barrier. Therefore, RPE cells have been widely utilized as in vitro model for DR research (22). Secondly, both autophagy associated markers and autolysosomes are obviously detected in HG treated RPE cells, indicating this in vitro DR model is suitable for autophagy investigation (23, 24). Among 10 predicted DR-related hub genes, we showed that only the expression of MAPK3 was consistent with that of bioinformatics analysis of mRNA chip. We speculate that because the bioinformatics results were originated from peripheral blood lymphocytes of DR patients and non-diabetic individuals, the differences in cell type and culture condition may change gene expression and provide contradicting results. MAPK3 has been demonstrated to modulate autophagy by regulating mTOR pathway and Beclin-1 expression (43). Further investigation is required to elucidate the way by which MAPK3 control autophagy in DR models and cells.
To sum up, 23 potential autophagy-related genes in DR were identified by bioinformatics analysis, 10 hub genes TSC1, RAF1, RB1, ITPR1, CDKN1B, MAPK1, FOXO3, DAPK1, MAPK3, BCL2L1 were identified by constructing PPI network and identifying key modules. MAPK3 was preliminarily identified by in vitro experiments, which may affect the occurrence and development of DR by regulating autophagy. In the future, further experiments are needed to investigate the regulatory role of MAPK3 in DR models in order to clarify its value as potential clinical biomarkers or therapeutic targets.
The datasets presented in this study can be found in online repositories. The names of the repository/repositories and accession number(s) can be found in the article/Supplementary Material.
NW analyzed the data. NW and LFW drafted the first draft. DL, QYZ, LXD, and XBX edited and provided comments to improve the manuscript. SQX designed this experiment and reviewed and revised the manuscripts. All authors contributed to the article and approved the final manuscript.
This study was financially supported by The National Natural Science Foundation of China (No.81974137 to SQX), The National Natural Science Foundation of China (No.82070966 to LD), The Natural Science Foundation of Hunan Province (No.2019JJ40507 to XS), and the Science and Technology Innovation Program of Hunan Province (No.2021RC3026 to LD).
The authors declare that the research was conducted in the absence of any commercial or financial relationships that could be construed as a potential conflict of interest.
All claims expressed in this article are solely those of the authors and do not necessarily represent those of their affiliated organizations, or those of the publisher, the editors and the reviewers. Any product that may be evaluated in this article, or claim that may be made by its manufacturer, is not guaranteed or endorsed by the publisher.
The Supplementary Material for this article can be found online at: https://www.frontiersin.org/articles/10.3389/fendo.2022.867600/full#supplementary-material
1. Antonetti DA, Klein R, Gardner TW. Diabetic Retinopathy. N Engl J Med (2012) 366(13):1227–39. doi: 10.1056/NEJMra1005073
2. Altmann C, Schmidt MHH. The Role of Microglia in Diabetic Retinopathy: Inflammation, Microvasculature Defects and Neurodegeneration. Int J Mol Sci (2018) 19(1):110–31. doi: 10.3390/ijms19010110
3. Rossino MG, Dal Monte M, Casini G. Relationships Between Neurodegeneration and Vascular Damage in Diabetic Retinopathy. Front Neurosci (2019) 13:1172. doi: 10.3389/fnins.2019.01172
4. Ferris FL 3rd. Results of 20 Years of Research on the Treatment of Diabetic Retinopathy. Prev Med (1994) 23(5):740–2. doi: 10.1006/pmed.1994.1127
5. Santos JM, Mohammad G, Zhong Q, Kowluru RA. Diabetic Retinopathy, Superoxide Damage and Antioxidants. Curr Pharm Biotechnol (2011) 12(3):352–61. doi: 10.2174/138920111794480507
6. Roy S, Kern TS, Song B, Stuebe C. Mechanistic Insights Into Pathological Changes in the Diabetic Retina: Implications for Targeting Diabetic Retinopathy. Am J Pathol (2017) 187(1):9–19. doi: 10.1016/j.ajpath.2016.08.022
7. Kang Q, Yang C. Oxidative Stress and Diabetic Retinopathy: Molecular Mechanisms, Pathogenetic Role and Therapeutic Implications. Redox Biol (2020) 37:101799. doi: 10.1016/j.redox.2020.101799
8. Rosa MD, Distefano G, Gagliano C, Rusciano D, Malaguarnera L. Autophagy in Diabetic Retinopathy. Curr Neuropharmacol (2016) 14(8):810–25. doi: 10.2174/1570159x14666160321122900
9. Tang J, Kern TS. Inflammation in Diabetic Retinopathy. Prog Retin Eye Res (2011) 30(5):343–58. doi: 10.1016/j.preteyeres.2011.05.002
10. Klaassen I, Van Noorden CJ, Schlingemann RO. Molecular Basis of the Inner Blood-Retinal Barrier and Its Breakdown in Diabetic Macular Edema and Other Pathological Conditions. Prog Retin Eye Res (2013) 34:19–48. doi: 10.1016/j.preteyeres.2013.02.001
11. Duh EJ, Sun JK, Stitt AW. Diabetic Retinopathy: Current Understanding, Mechanisms, and Treatment Strategies. JCI Insight (2017) 2(14):e93751. doi: 10.1172/jci.insight.93751
12. Watada H, Fujitani Y. Minireview: Autophagy in Pancreatic B-Cells and Its Implication in Diabetes. Mol Endocrinol (2015) 29(3):338–48. doi: 10.1210/me.2014-1367
13. Chai P, Ni H, Zhang H, Fan X. The Evolving Functions of Autophagy in Ocular Health: A Double-Edged Sword. Int J Biol Sci (2016) 12(11):1332–40. doi: 10.7150/ijbs.16245
14. Marsh T, Debnath J. Autophagy Suppresses Breast Cancer Metastasis by Degrading Nbr1. Autophagy (2020) 16(6):1164–5. doi: 10.1080/15548627.2020.1753001
15. Su H, Yang F, Fu R, Li X, French R, Mose E, et al. Cancer Cells Escape Autophagy Inhibition Via Nrf2-Induced Macropinocytosis. Cancer Cell (2021) 39(5):678–93.e11. doi: 10.1016/j.ccell.2021.02.016
16. Li X, He S, Ma B. Autophagy and Autophagy-Related Proteins in Cancer. Mol Cancer (2020) 19(1):12. doi: 10.1186/s12943-020-1138-4
17. Gassen NC, Niemeyer D, Muth D, Corman VM, Martinelli S, Gassen A, et al. Skp2 Attenuates Autophagy Through Beclin1-Ubiquitination and Its Inhibition Reduces Mers-Coronavirus Infection. Nat Commun (2019) 10(1):5770. doi: 10.1038/s41467-019-13659-4
18. Kumariya S, Ubba V, Jha RK, Gayen JR. Autophagy in Ovary and Polycystic Ovary Syndrome: Role, Dispute and Future Perspective. Autophagy (2021) 17(10):2706–33. doi: 10.1080/15548627.2021.1938914
19. Chen CL, Chen YH, Liang CM, Tai MC, Lu DW, Chen JT. Glucosamine-Induced Autophagy Through Ampk⁻Mtor Pathway Attenuates Lipofuscin-Like Autofluorescence in Human Retinal Pigment Epithelial Cells in Vitro. Int J Mol Sci (2018) 19(5): 1416–23. doi: 10.3390/ijms19051416
20. Kasetti RB, Maddineni P, Kiehlbauch C, Patil S, Searby CC, Levine B, et al. Autophagy Stimulation Reduces Ocular Hypertension in a Murine Glaucoma Model Via Autophagic Degradation of Mutant Myocilin. JCI Insight (2021) 6(5):e143359. doi: 10.1172/jci.insight.143359
21. Ishikawa M, Takaseki S, Yoshitomi T, Covey DF, Zorumski CF, Izumi Y. The Neurosteroid Allopregnanolone Protects Retinal Neurons by Effects on Autophagy and Gabrs/Gaba(a) Receptors in Rat Glaucoma Models. Autophagy (2021) 17(3):743–60. doi: 10.1080/15548627.2020.1731270
22. Shi H, Zhang Z, Wang X, Li R, Hou W, Bi W, et al. Inhibition of Autophagy Induces Il-1β Release From Arpe-19 Cells Via Ros Mediated Nlrp3 Inflammasome Activation Under High Glucose Stress. Biochem Biophys Res Commun (2015) 463(4):1071–6. doi: 10.1016/j.bbrc.2015.06.060
23. Zhang W, Song J, Zhang Y, Ma Y, Yang J, He G, et al. Intermittent High Glucose-Induced Oxidative Stress Modulates Retinal Pigmented Epithelial Cell Autophagy and Promotes Cell Survival Via Increased Hmgb1. BMC Ophthalmol (2018) 18(1):192. doi: 10.1186/s12886-018-0864-5
24. Kang MK, Lee EJ, Kim YH, Kim DY, Oh H, Kim SI, et al. Chrysin Ameliorates Malfunction of Retinoid Visual Cycle Through Blocking Activation of Age-Rage-Er Stress in Glucose-Stimulated Retinal Pigment Epithelial Cells and Diabetic Eyes. Nutrients (2018) 10(8):1046–16. doi: 10.3390/nu10081046
25. Ting DS, Cheung GC, Wong TY. Diabetic Retinopathy: Global Prevalence, Major Risk Factors, Screening Practices and Public Health Challenges: A Review. Clin Exp Ophthalmol (2016) 44(4):260–77. doi: 10.1111/ceo.12696
26. Simó-Servat O, Hernández C, Simó R. Diabetic Retinopathy in the Context of Patients With Diabetes. Ophthalmic Res (2019) 62(4):211–7. doi: 10.1159/000499541
27. Beltramo E, Porta M. Pericyte Loss in Diabetic Retinopathy: Mechanisms and Consequences. Curr Med Chem (2013) 20(26):3218–25. doi: 10.2174/09298673113209990022
28. Mrugacz M, Bryl A, Zorena K. Retinal Vascular Endothelial Cell Dysfunction and Neuroretinal Degeneration in Diabetic Patients. J Clin Med (2021) 10(3):458–18. doi: 10.3390/jcm10030458
29. Kadłubowska J, Malaguarnera L, Wąż P, Zorena K. Neurodegeneration and Neuroinflammation in Diabetic Retinopathy: Potential Approaches to Delay Neuronal Loss. Curr Neuropharmacol (2016) 14(8):831–9. doi: 10.2174/1570159x14666160614095559
30. Madrakhimov SB, Yang JY, Kim JH, Han JW, Park TK. Mtor-Dependent Dysregulation of Autophagy Contributes to the Retinal Ganglion Cell Loss in Streptozotocin-Induced Diabetic Retinopathy. Cell Commun Signal (2021) 19(1):29. doi: 10.1186/s12964-020-00698-4
31. Zhang Y, Xi X, Mei Y, Zhao X, Zhou L, Ma M, et al. High-Glucose Induces Retinal Pigment Epithelium Mitochondrial Pathways of Apoptosis and Inhibits Mitophagy by Regulating Ros/Pink1/Parkin Signal Pathway. BioMed Pharmacother (2019) 111:1315–25. doi: 10.1016/j.biopha.2019.01.034
32. Feng L, Liang L, Zhang S, Yang J, Yue Y, Zhang X. Hmgb1 Downregulation in Retinal Pigment Epithelial Cells Protects Against Diabetic Retinopathy Through the Autophagy-Lysosome Pathway. Autophagy (2021) 18(2):320–19. doi: 10.1080/15548627.2021.1926655
33. Mohammad G, Kowluru RA. Diabetic Retinopathy and Signaling Mechanism for Activation of Matrix Metalloproteinase-9. J Cell Physiol (2012) 227(3):1052–61. doi: 10.1002/jcp.22822
34. Hnik P, Boyer DS, Grillone LR, Clement JG, Henry SP, Green EA. Antisense Oligonucleotide Therapy in Diabetic Retinopathy. J Diabetes Sci Technol (2009) 3(4):924–30. doi: 10.1177/193229680900300440
35. Kowluru RA, Kowluru A, Chakrabarti S, Khan Z. Potential Contributory Role of H-Ras, a Small G-Protein, in the Development of Retinopathy in Diabetic Rats. Diabetes (2004) 53(3):775–83. doi: 10.2337/diabetes.53.3.775
36. Kowluru RA, Kanwar M. Translocation of H-Ras and Its Implications in the Development of Diabetic Retinopathy. Biochem Biophys Res Commun (2009) 387(3):461–6. doi: 10.1016/j.bbrc.2009.07.038
37. Wu C, Xu K, Liu W, Liu A, Liang H, Li Q, et al. Protective Effect of Raf-1 Kinase Inhibitory Protein on Diabetic Retinal Neurodegeneration Through P38-Mapk Pathway. Curr Eye Res (2022) 47(1):135–42. doi: 10.1080/02713683.2021.1944644
38. Yu YY, Liu QP, Li MT, An P, Chen YY, Luan X, et al. Hu-Zhang-Qing-Mai-Yin Inhibits Proliferation of Human Retinal Capillary Endothelial Cells Exposed to High Glucose. Front Pharmacol (2021) 12:732655. doi: 10.3389/fphar.2021.732655
39. Peng D, Li W, Zhang B, Liu X. Overexpression of Lncrna Slc26a4-As1 Inhibits Papillary Thyroid Carcinoma Progression Through Recruiting Ets1 to Promote Itpr1-Mediated Autophagy. J Cell Mol Med (2021) 25(17):8148–58. doi: 10.1111/jcmm.16545
40. Zhang P, Zheng Z, Ling L, Yang X, Zhang N, Wang X, et al. W09, a Novel Autophagy Enhancer, Induces Autophagy-Dependent Cell Apoptosis Via Activation of the Egfr-Mediated Ras-Raf1-Map2k-Mapk1/3 Pathway. Autophagy (2017) 13(7):1093–112. doi: 10.1080/15548627.2017.1319039
41. Yu S, Yu M, He X, Wen L, Bu Z, Feng J. Kcnq1ot1 Promotes Autophagy by Regulating Mir-200a/Foxo3/Atg7 Pathway in Cerebral Ischemic Stroke. Aging Cell (2019) 18(3):e12940. doi: 10.1111/acel.12940
42. Choi HK, Yuan H, Fang F, Wei X, Liu L, Li Q, et al. Tsc1 Regulates the Balance Between Osteoblast and Adipocyte Differentiation Through Autophagy/Notch1/B-Catenin Cascade. J Bone Miner Res (2018) 33(11):2021–34. doi: 10.1002/jbmr.3530
Keywords: diabetic retinopathy, autophagy, differentially expressed genes, protein-protein interaction network, MAPK3
Citation: Wang N, Wei L, Liu D, Zhang Q, Xia X, Ding L and Xiong S (2022) Identification and Validation of Autophagy-Related Genes in Diabetic Retinopathy. Front. Endocrinol. 13:867600. doi: 10.3389/fendo.2022.867600
Received: 01 February 2022; Accepted: 14 March 2022;
Published: 29 April 2022.
Edited by:
Chengqi Xu, Huazhong University of Science and Technology, ChinaReviewed by:
Jingming Li, The First Affiliated Hospital of Xi’an Jiaotong University, ChinaCopyright © 2022 Wang, Wei, Liu, Zhang, Xia, Ding and Xiong. This is an open-access article distributed under the terms of the Creative Commons Attribution License (CC BY). The use, distribution or reproduction in other forums is permitted, provided the original author(s) and the copyright owner(s) are credited and that the original publication in this journal is cited, in accordance with accepted academic practice. No use, distribution or reproduction is permitted which does not comply with these terms.
*Correspondence: Siqi Xiong, cGV0ZXJzYWdlMTIyMUAxMjYuY29t; Lexi Ding, bGV4aWRpbmdAY3N1LmVkdS5jbg==
Disclaimer: All claims expressed in this article are solely those of the authors and do not necessarily represent those of their affiliated organizations, or those of the publisher, the editors and the reviewers. Any product that may be evaluated in this article or claim that may be made by its manufacturer is not guaranteed or endorsed by the publisher.
Research integrity at Frontiers
Learn more about the work of our research integrity team to safeguard the quality of each article we publish.