
94% of researchers rate our articles as excellent or good
Learn more about the work of our research integrity team to safeguard the quality of each article we publish.
Find out more
ORIGINAL RESEARCH article
Front. Endocrinol., 22 July 2022
Sec. Translational and Clinical Endocrinology
Volume 13 - 2022 | https://doi.org/10.3389/fendo.2022.863224
This article is part of the Research TopicCircadian Rhythms and Exercise in Cardiometabolic HealthView all 8 articles
 Wentao Lin1†
 Nicholas J. Saner2,3†
 Xiquan Weng1
 Nikeisha J. Caruana2,4
 Javier Botella4Jujiao Kuang2
 Matthew J-C. Lee2Nicholas A. Jamnick5
 Nathan W. Pitchford6
 Andrew Garnham2Jonathan D. Bartlett2
 Hao Chen1*
 David J. Bishop2*
Background: Inadequate sleep is associated with many detrimental health effects, including increased risk of developing insulin resistance and type 2 diabetes. These effects have been associated with changes to the skeletal muscle transcriptome, although this has not been characterised in response to a period of sleep restriction. Exercise induces a beneficial transcriptional response within skeletal muscle that may counteract some of the negative effects associated with sleep restriction. We hypothesised that sleep restriction would down-regulate transcriptional pathways associated with glucose metabolism, but that performing exercise would mitigate these effects.
Methods: 20 healthy young males were allocated to one of three experimental groups: a Normal Sleep (NS) group (8 h time in bed per night (TIB), for five nights (11 pm – 7 am)), a Sleep Restriction (SR) group (4 h TIB, for five nights (3 am – 7 am)), and a Sleep Restriction and Exercise group (SR+EX) (4 h TIB, for five nights (3 am – 7 am) and three high-intensity interval exercise (HIIE) sessions (performed at 10 am)). RNA sequencing was performed on muscle samples collected pre- and post-intervention. Our data was then compared to skeletal muscle transcriptomic data previously reported following sleep deprivation (24 h without sleep).
Results: Gene set enrichment analysis (GSEA) indicated there was an increased enrichment of inflammatory and immune response related pathways in the SR group post-intervention. However, in the SR+EX group the direction of enrichment in these same pathways occurred in the opposite directions. Despite this, there were no significant changes at the individual gene level from pre- to post-intervention. A set of genes previously shown to be decreased with sleep deprivation was also decreased in the SR group, but increased in the SR+EX group.
Conclusion: The alterations to inflammatory and immune related pathways in skeletal muscle, following five nights of sleep restriction, provide insight regarding the transcriptional changes that underpin the detrimental effects associated with sleep loss. Performing three sessions of HIIE during sleep restriction attenuated some of these transcriptional changes. Overall, the transcriptional alterations observed with a moderate period of sleep restriction were less evident than previously reported changes following a period of sleep deprivation.
The increased time demands imposed on modern society mean that many adults do not meet nightly sleep recommendations of 7 to 9 h per night (1, 2). Despite the importance of sleep for the maintenance of good health (3), the effects of inadequate sleep are still not completely understood. Nonetheless, the consequences of not obtaining the recommended amounts of sleep on aspects of metabolic health are becoming increasingly apparent. Several epidemiological studies have demonstrated that short sleep duration is associated with a greater risk of developing diabetes, cardiovascular disease, and dementia, as well as an increase in all-cause mortality (4–6).
These epidemiological findings are now supported with evidence from laboratory-controlled studies that have investigated the detrimental physiological effects associated with either one night of sleep deprivation (24 h of sustained wakefulness) or extended periods of recurrent sleep restriction (reductions of time in bed (TIB) per night) (7–15). These studies indicate that sleep loss can have detrimental effects within peripheral tissues, such as skeletal muscle (12, 16–19). Indeed, we have previously reported changes in skeletal muscle mitochondrial function, protein synthesis, the expression of core clock gene expression (that regulate circadian rhythms), and glucose metabolism following five nights of 4 h sleep in young males (14, 15), which are supported by findings from many others too (7, 11, 20, 21). Despite these findings, the skeletal muscle transcriptomic responses that may contribute to these effects require further elucidation.
Transcriptomic approaches allow for the assessment of genome-wide changes in gene expression, with the potential to offer insight into the early transcriptional changes that may regulate the functional consequences of sleep loss. A seminal study by Cedernaes etal. (13) reported changes in the skeletal muscle transcriptome following 24 h of sleep deprivation. Following the intervention, 118 mRNA transcripts were found to have altered expression levels; these were primarily related to increases in inflammatory pathways, decreases in genes associated with oxidative phosphorylation, alterations to core circadian clock genes, and a transcriptional signature suggestive of reductions in protein synthesis pathways. While sleep deprivation can occur, a more common problem is repeated nights of sleep restriction (e.g., 4 h of sleep per night). Further research is required to investigate whether the changes reported by Cedernaes et al. (13) are confined to severe sleep deprivation or also occur in response to less extreme models of sleep restriction.
The identification of the many detrimental responses to the stress of insufficient sleep highlights the need to investigate interventions that are capable of mitigating these effects (18). In fact, bouts of recovery sleep are not always sufficient to mitigate the detrimental effects of sleep loss on metabolic health (22–25). However, exercise improves glucose tolerance (26, 27) and mitochondrial function (28–32), and can alter circadian rhythms (33, 34). Data from our lab (utilising the same design as the present study) has also demonstrated that high-intensity interval (HIIE) exercise is able to mitigate the detrimental effects of sleep restriction (5 nights, 4 h TIB each night) on glucose tolerance, mitochondrial function, circadian rhythms, and both sarcoplasmic and myofibrillar protein synthesis (14, 15, 18). Further studies have also demonstrated a protective effect of HIIE on glucose tolerance if performed in the weeks prior to sleep deprivation (35), or immediately following sleep restriction (36). These exercise-induced adaptations have been attributed to large-scale alterations to the skeletal muscle transcriptome (including oxidative phosphorylation, inflammatory, protein synthesis, and glucose metabolism signalling pathways), which occur in the hours following exercise (29, 37–39). However, the transcriptional response to a period of insufficient sleep combined with exercise has never been investigated.
Accordingly, the overall aim of this study was to investigate the transcriptomic changes that occur in human skeletal muscle following sleep restriction (5 nights, 4 h TIB per night), with or without HIIE. We hypothesised that sleep restriction would down-regulate transcriptional pathways associated with glucose metabolism and mitochondrial function, but that performing exercise would mitigate these effects. This information will improve our understanding of the underlying mechanisms that regulate sleep-loss-induced changes in metabolic health and help to elucidate the mechanisms by which exercise may ameliorate these changes.
All procedures involved in this study conform to the standards set by the latest revision of the Declaration of Helsinki (except for registration in a database) and were approved by the Victoria University Human Research Ethics Committee (HRE15-294).
Twenty healthy, recreationally active males, aged between 18 and 40 years of age, volunteered to participate. Eligible participants 1) were not taking any medications, 2) were not performing shift work (within the previous three months), 3) had regular sleeping habits (6 to 9 hours per night) and no previously diagnosed sleep disorders, 4) had not travelled overseas in the previous two months, and 5) had a body mass index between 19 and 30 (kg/m2).
Eligible participants attended the exercise physiology laboratory for baseline anthropometric measurements (i.e., height and body mass), and aerobic fitness testing (peak oxygen uptake and peak power output [ŴPeak]) that was performed to volitional exhaustion on an electronically braked cycle ergometer (Excalibur, V2.0; Lode, Groningen, Netherlands), using an incremental ramp protocol (30 W/minute). Following baseline testing, participants were allocated via minimisation into one of the three experimental groups, in a counterbalanced order, so as to minimise differences in between-group baseline measures for age, body mass index (BMI), habitual sleep duration, and (Table 1).
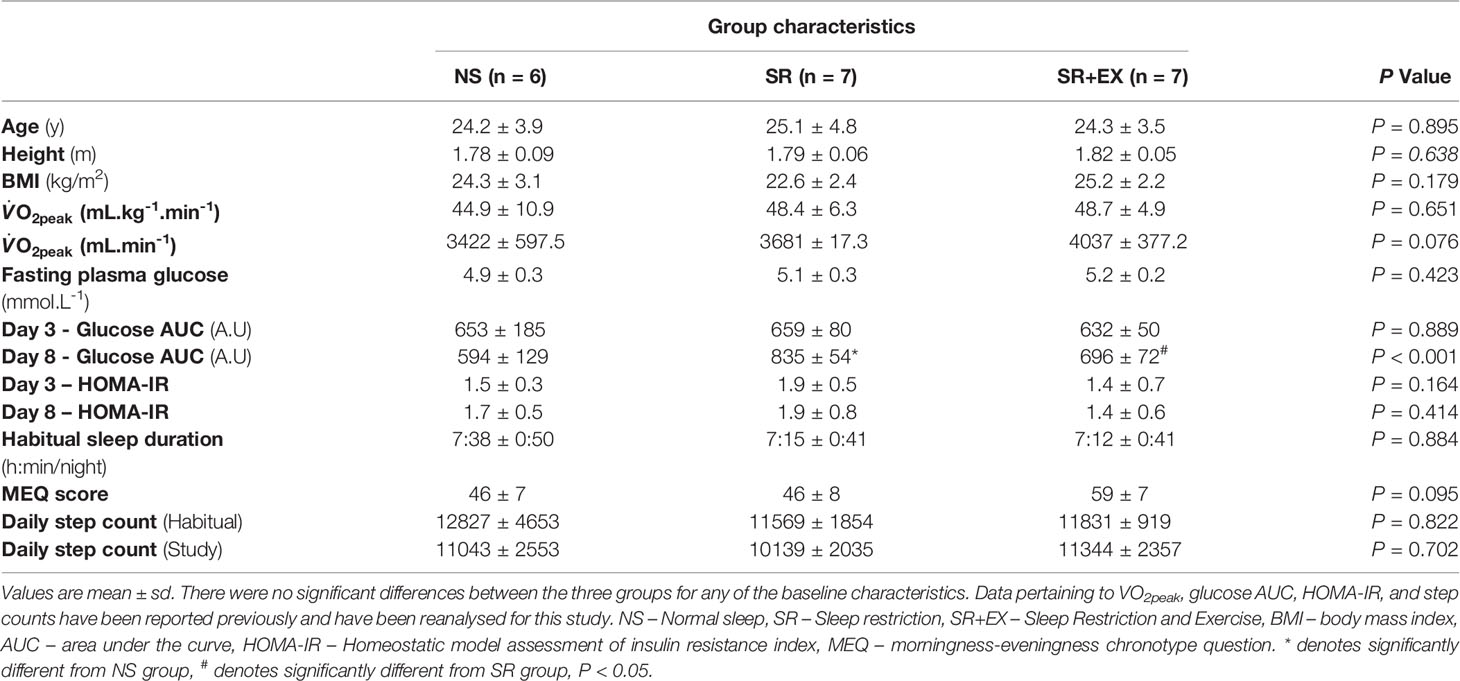
Table 1 Baseline characteristics of participants.
The study consisted of an eight-night stay within a temperature-controlled (22°C) sleep laboratory. All groups completed two initial nights of baseline sleep (8 h TIB from 23:00 h to 07:00 h), followed by a five-night intervention period, during which the Normal Sleep (NS) group spent 8 h TIB (23:00 h to 07:00 h), while both of the Sleep Restriction (SR) and Sleep Restriction and Exercise (SR+EX) groups spent 4 h TIB per night (03:00 h to 07:00 h). Between 23:00 h and 03:00 h, lighting was dimmed to below 15 lux to reduce the effect of lighting on circadian rhythms (40). The SR+EX group also performed three exercise sessions during the intervention period on days 4, 5, and 6 at 10:00 h. Following the intervention period and completion of testing, all participants remained at the sleep facility and completed a final night of ad libitum recovery sleep. Participants were monitored throughout the protocol and provided with a standardised diet consisting of fixed proportions (relative to body mass) of carbohydrates (4.5 g.kg-1.d-1), protein (1.5 g.kg-1.d-1) and fat (1 g.kg-1.d-1). All mealtimes were kept constant each day (breakfast - 08:00 h, snack - 10:30 h, lunch - 12:30 h, snack – 16:30 h, dinner – 19:00 h, and snack – 21:30 h). An overview of the study protocol is shown in Figure 1A.
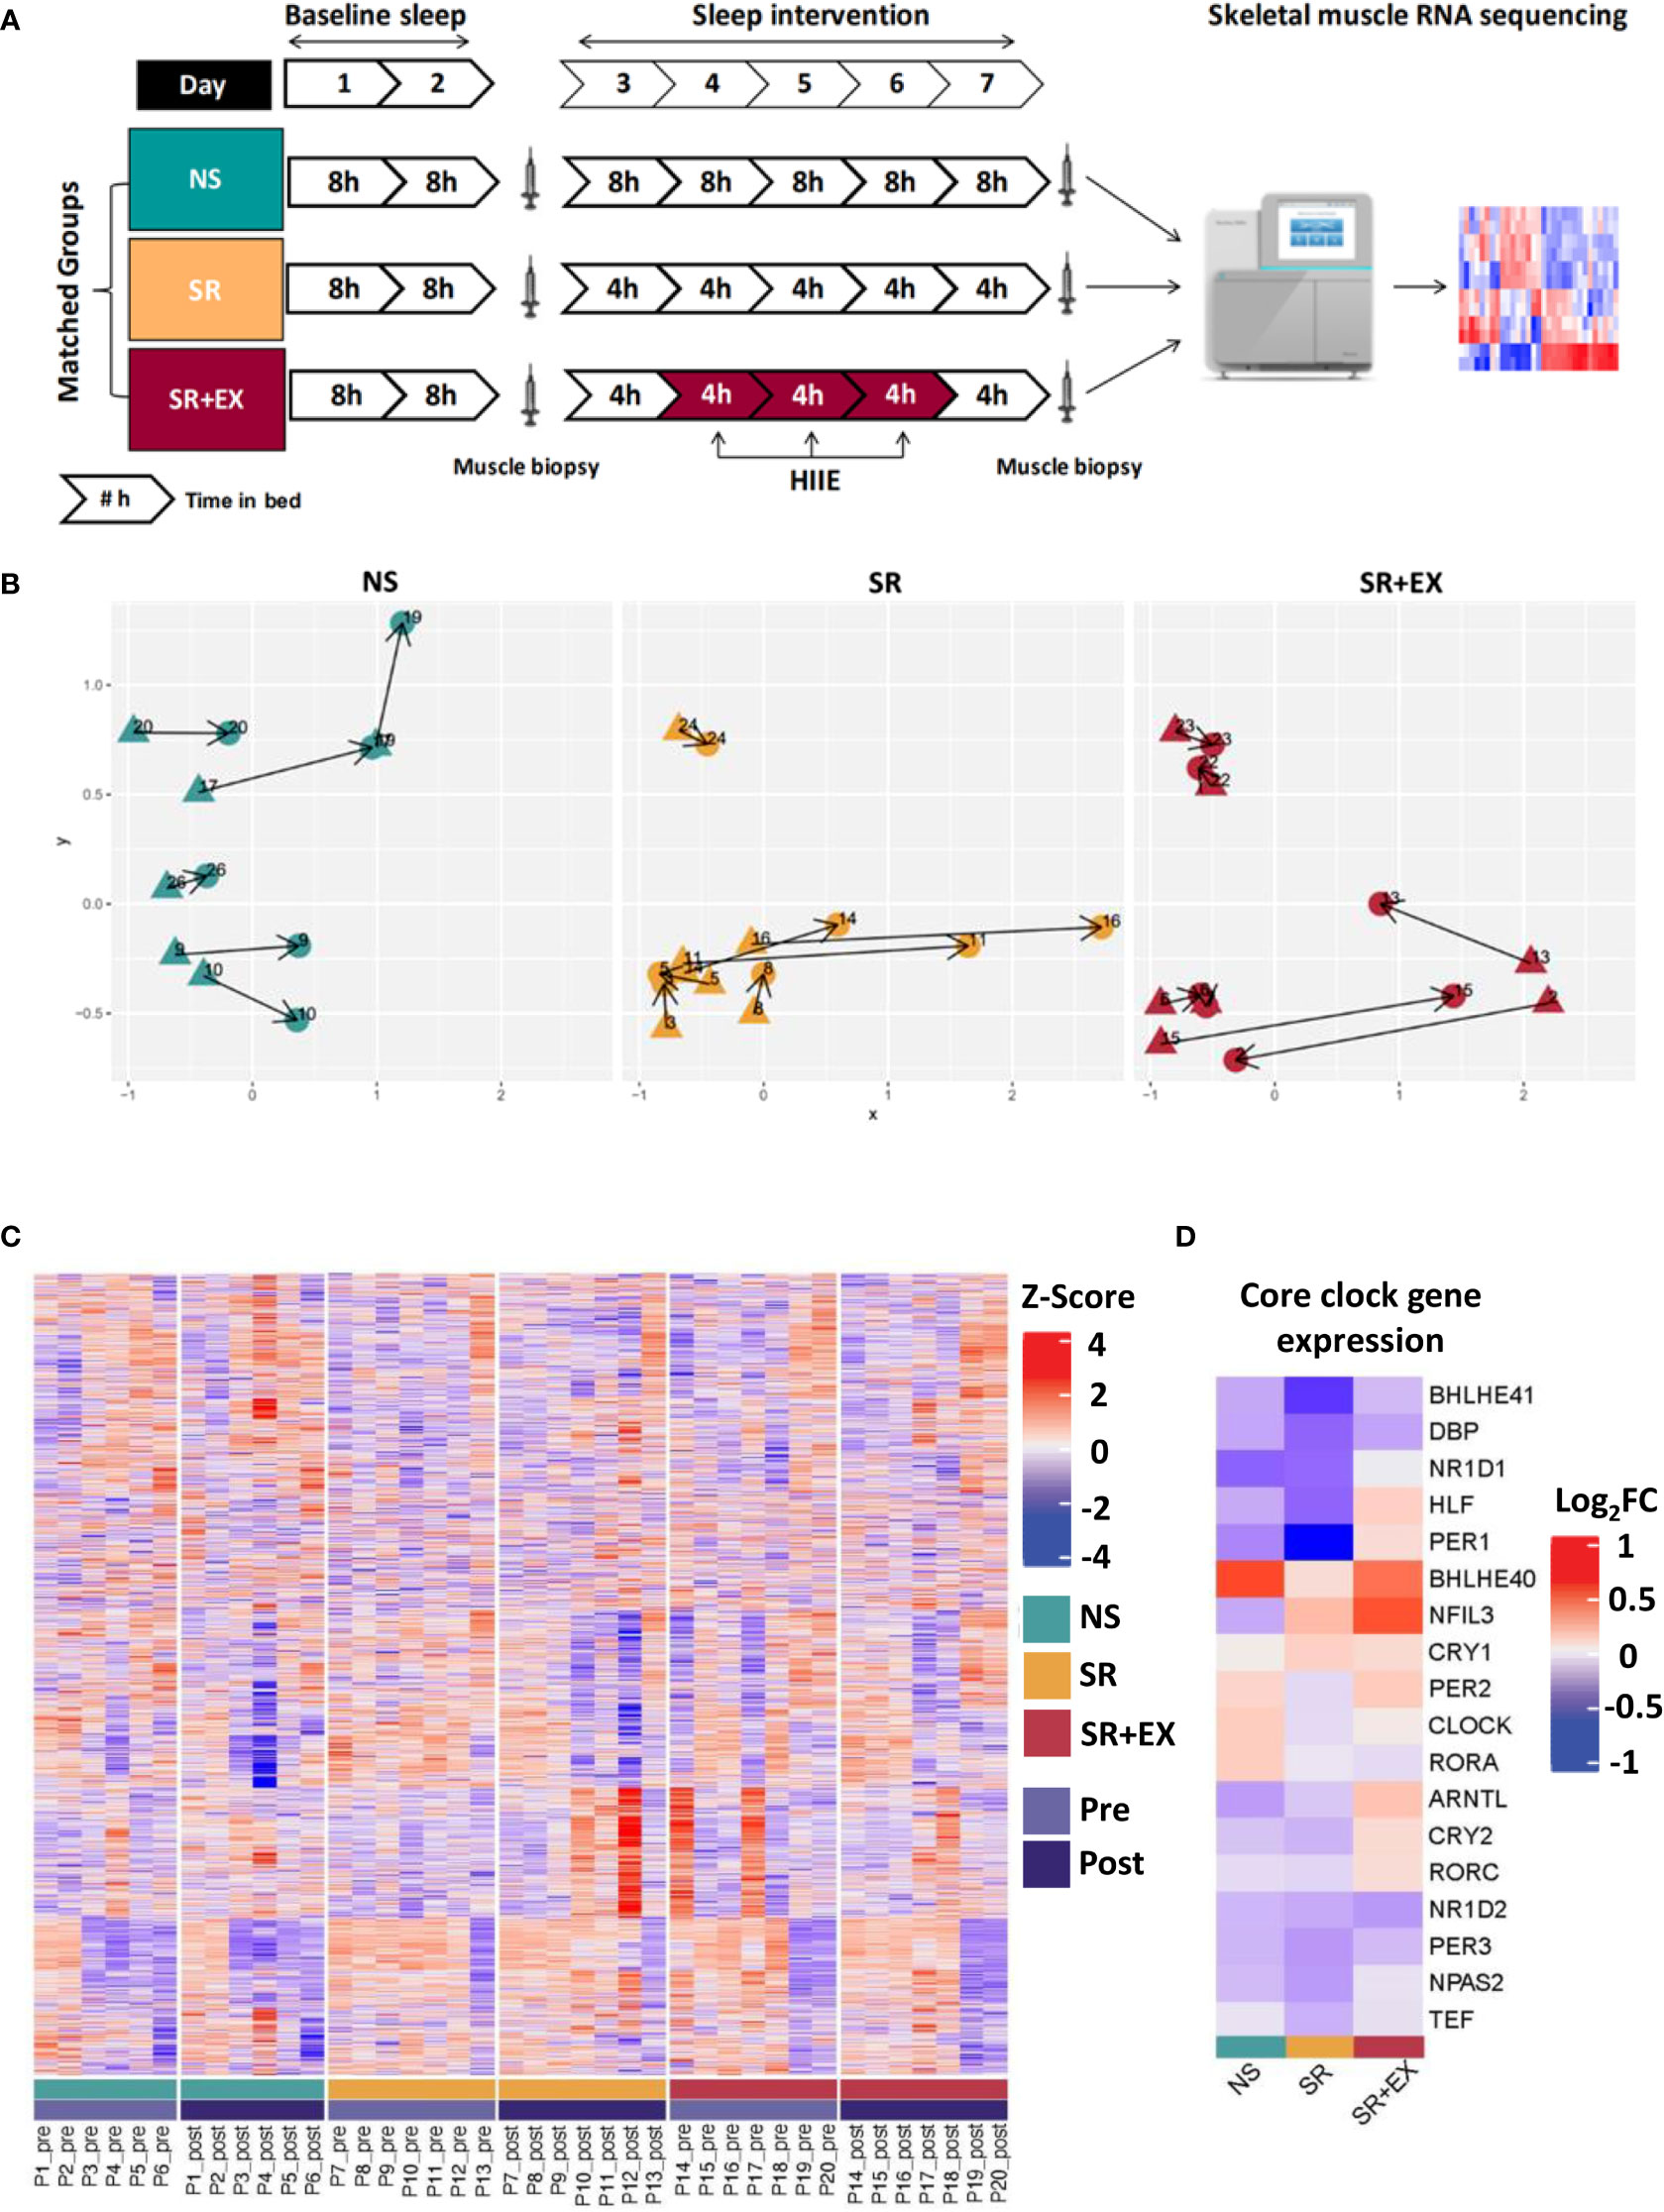
Figure 1 (A) Study protocol and analysis overview. Participants were matched into one of three experimental groups. The study consisted of two nights of baseline sleep (8 h TIB), prior to 5 nights of either 8 h TIB (NS), or 4 h TIB (SR and SR+EX). The SR+EX group performed 3 sessions of HIIE on Day 4, 5 and 6. Skeletal muscle biopsies were collected pre- and post-intervention and underwent transcriptomic analysis. (B) Multidimensional scaling (MDS) plot showing distances between each group (blue = NS, yellow = SR, red = SR+EX), with each biopsy time points (pre- (triangles) or post-intervention (circles)). (C) Heatmap of relative expression levels of transcripts identified within the study. Individuals were grouped according to their intervention and time point (pre or post). (D) Changes in expression of core circadian clock genes for each group (Log2FC from pre- to post-intervention). Groupings include green = normal sleep [NS], yellow = sleep restriction [SR], red = sleep restriction and exercise [SR+EX], with Pre [light purple] and Post [dark purple]. NS – Normal Sleep, SR – Sleep Restriction, SR+EX – Sleep Restriction and Exercise, HIIE – High-intensity interval exercise, TIB – Time in bed.
Sleep was assessed for one week prior to and then throughout the study using wrist-watch actigraphy devices (Actiwatch 2, Philips Respironics, Murrysville, PA, USA) (41). The habitual sleep monitoring occurred within two weeks of the study commencing and participants were instructed to maintain habitual sleep habits in the week preceding the study. Prior to the study, participants completed the Horne-Osteberg morningness-eveningness questionnaire to assess chronotype (42). All participants were classified as having either a moderate evening (n=2), intermediate (n=14), or moderate morning (n=4) chronotype. Habitual daily step counts were monitored using validated step-counting applications on the participants’ personal mobile phone devices (i-Health app, Apple Inc., Cupertino, CA, USA; and Samsung Health, Samsung Electronics Co., Ltd., Suwon, South Korea) and these step counts were replicated throughout the study using the same devices (data reanalysed from (14). During the study, participants were told of their daily step count requirements and prompted to meet these targets each day (Table 1).
A 2-way repeated measures ANOVA (group x time) was used to assess differences in mean nightly sleep duration for the baseline period and sleep intervention period. Differences for between group participant characteristics were assessed with a one-way ANOVA. Where significant differences were observed Tukey, post-hoc analysis was conducted to investigate differences between groups. P values < 0.05 indicate statistical significance. Statistical analysis of these parameters was conducted using the statistical software package Graphpad Prism (V7.03).
The HIIE protocol consisted of 10 × 60-second intervals performed on a cycle ergometer (Velotron, Racer-Mate, Seattle, WA, USA) at 90% of each participant’s Ŵpeak (at ~70 RPM). Each interval was interspersed with 75 seconds of active recovery at 60 W. Each session started with a 3-minute warm up at 60 W. The mean power per interval was 334 ± 29 W and the mean HR throughout the protocol was 157 ± 12 bpm.
On Day 3 and Day 8 of the study, muscle biopsies were sampled from the vastus lateralis muscle using a suction-modified Bergström needle, and under local anaesthesia of the skin and fascia (1% lidocaine). All samples were collected at 10:00 h (three hours after waking up). The post-intervention sample was collected 48-h after the final HIIE session from the participants in the SR+EX group. All samples were collected following the completion of a fasted oral glucose tolerance test (75 g glucose) (Table 1). All samples were immediately frozen in liquid nitrogen and stored at -80°C.
Frozen muscle samples (10 to 20 mg) were removed from -80°C storage and placed on dry ice. RNA extraction was performed using RNeasy Plus Universal Mini Kit (Qiagen, Valencia, USA) as previously described (43). In order to increase RNA yield, kit instructions were modified by replacing ethanol with 2-propanol to precipitate the RNA. A genomic DNA elimination step was included in the kit to remove genomic DNA from the total RNA. Prior to storage, separate aliquots were taken for RNA quantification and RNA integrity testing.
RNA samples were quantified using a Nanodrop spectrophotometer (Thermo Fisher Scientific). 1 μL of each RNA sample was placed onto the spectrophotometer and readings for RNA concentration (ng/μL), the A260/280 ratio and A260/230 ratio was recorded. No further dilution of RNA samples was used.
Assessment of RNA integrity was performed using an automated microcapillary electrophoresis system (Experion, Bio-Rad Laboratories, Hercules, CA). This protocol was performed as per the manufacturer’s instructions and generated an RNA quality Indicator score (RQI) from 1 to 10. Any sample with an RQI greater than 7 was considered to be of good integrity and the RNA intact (43).
The library construction and RNA sequencing was performed by Beijing Genomics Institute (Shenzhen, China) as described previously (44). In total, approximately 1 μg total RNA was used for library construction. For library preparation, the poly(A) + mRNA molecules were purified using oligo (dT) magnetic beads. The mRNA was fragmented into small pieces and the double-strand cDNA was synthesized using N6 random primers. These cDNA fragments were added with a single ‘A’ base and subsequently ligated to the adapter. The ligation product was purified and enriched with PCR amplification to yield the final cDNA library. The cDNA library was sequenced using BGISEQ-500 system with a paired-end sequencing length of 100 bp. Raw RNAseq counts for each sample are available in Supplementary Table 1.
Cleaned sequence reads were aligned against the Homo sapiens genome (Build version HG38). Salmon (1.4.0) was used to map reads to the genomic sequences. Counts of read mapping to each known gene were summarised to provide the matrix used for further analysis. Genes lowly expressed were discarded from downstream analysis resulting in 14,917 genes across samples. Count data was normalised using calcNormFactors with trimmed value of means (TMM) in the edgeR package in R. For downstream RNA-seq analysis the R package limma (45) was used to conduct the differential expression analysis from count data. Differential expression analysis was attempted between the pre- and post-intervention biopsy for each group (Supplementary Table 2). The transcriptomic data has been deposited in the NCBI and can be found under the BioProject PRJNA807098.
Differential expression analysis was performed between each subsequent biopsy to show comparative changes between pre- and post-intervention for each group, though all comparisons were accounted for within the analysis. The resulting differential expression values were filtered for an adjusted P value < 0.05 using the Benjamini-Hochberg method. Heatmaps were visualised using hierarchical clustering for the rows using the “ward.D” method and supervised grouping for the columns into each of the three conditions.
To gain further insight into the different effects of the intervention we performed a multi-contrast gene set enrichment analysis (GSEA) using the R package mitch (v.1.4.0) (46). This package allows the detection of gene set enrichments that show similar or divergent responses across contrasts (groups). The input data provided was the log2FC obtained from pre- to post-intervention in each group using the normalised RNA-seq data from edgeR. Multi-contrast analysis was performed using the statistical test of Multiple Analysis of Variance (MANOVA) incorporated in the mitch package. The top 30 pathways based on this MANOVA analysis are displayed in Figure 2. The analysis was performed on the REACTOME gene sets (version 2021-06-08) and an adjusted P value < 0.05 was deemed significant. Enrichment score (ES) was also obtained and ranged from -1 to 1. REACTOME pathway analysis and GSEA data is available in Supplementary Table 3.
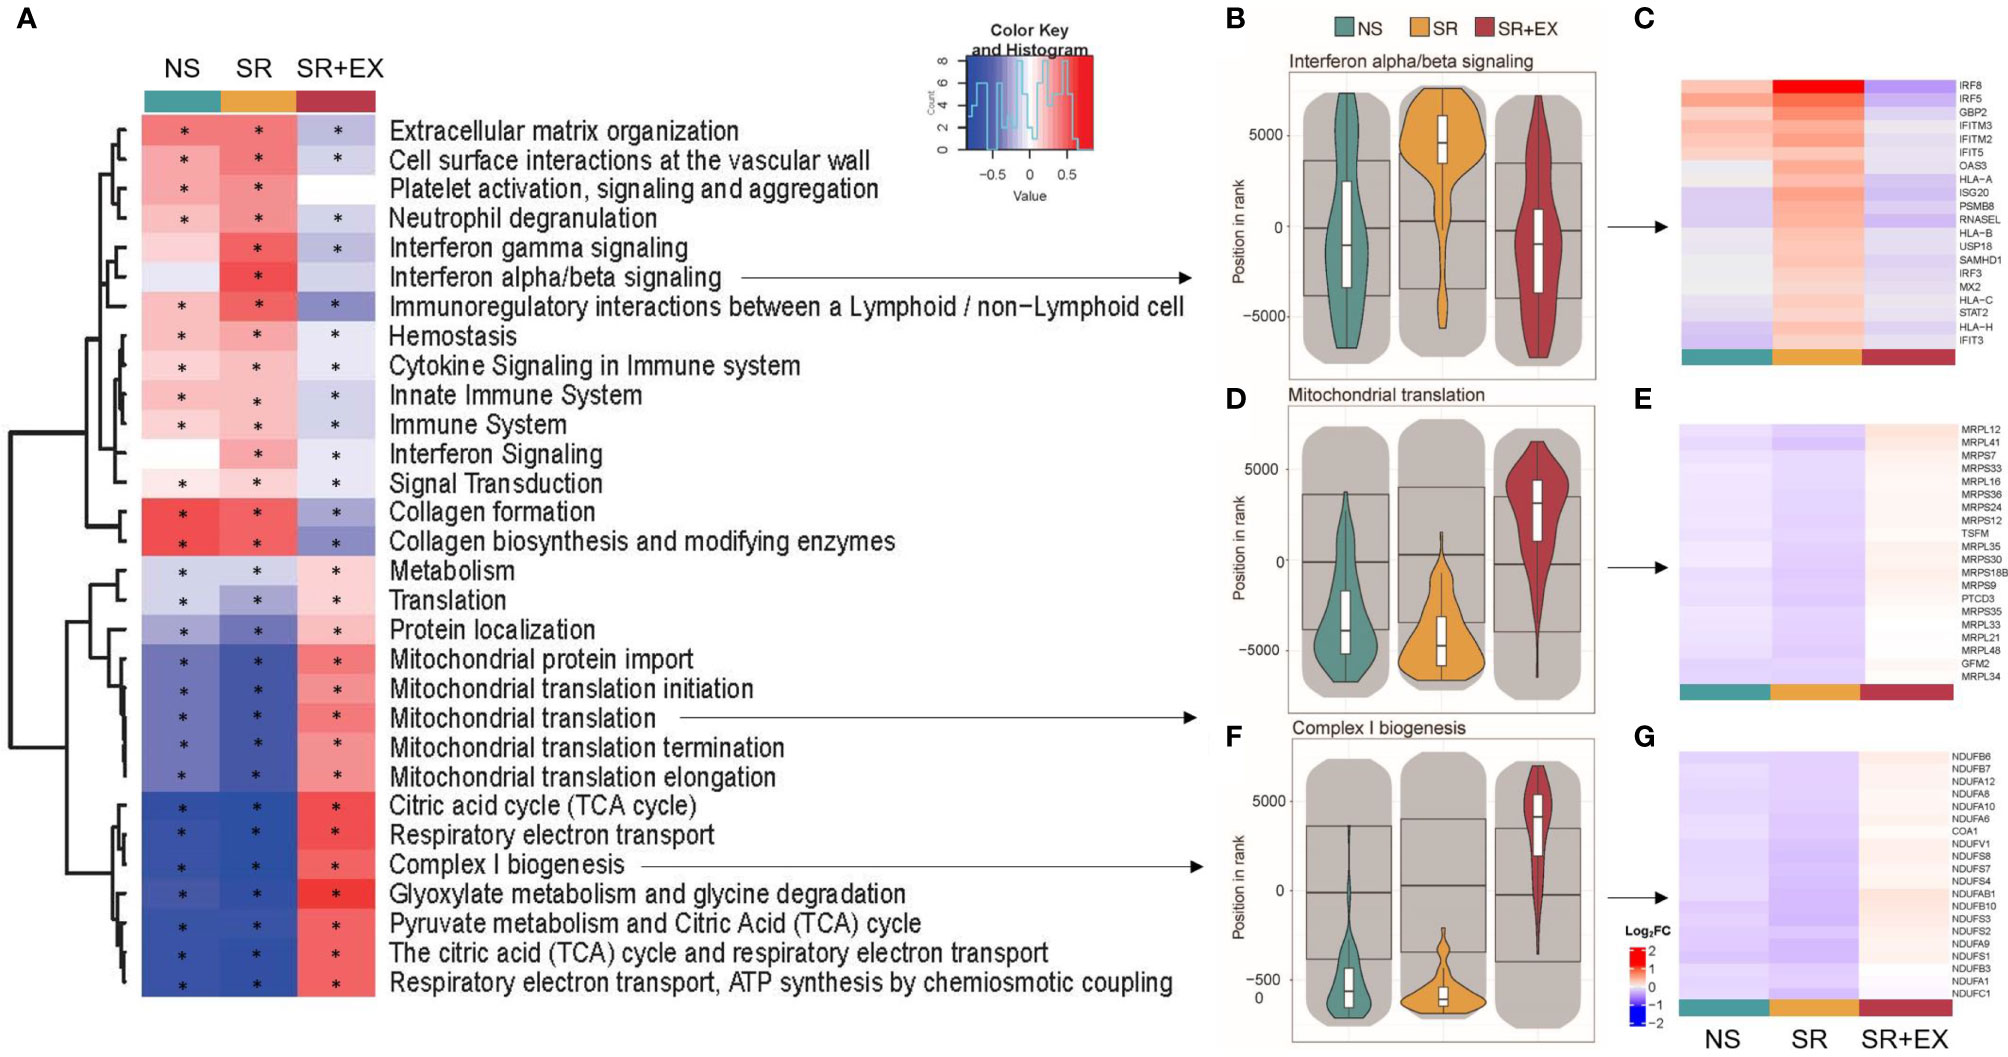
Figure 2 Gene set enrichment analysis (GSEA). (A) Heat map representing the top 30 significantly altered gene sets from the ‘REACTOME’ gene ontology (based on MANOVA analysis using the mitch R package (46). (B, D, F) Violin plots representing the direction of expression in each group for b) Interferon alpha/beta signalling, (D) Mitochondrial translation, and (F) Complex I biogenesis. (C, E, G) heat maps for the 20 leading-edge genes for the corresponding violin plots (Log2FC from pre- to post-intervention). Normal Sleep (NS), Sleep Restriction (SR), and Sleep Restriction and Exercise (SR+EX). * Denotes significant within group difference from pre-intervention, adjusted P<0.05.
To further compare our data set to previously reported changes in skeletal muscle transcripts following 24 h of sleep deprivation (SD) (13), we created two gene sets from that study’s differentially expressed genes. Their down-regulated gene set comprised of 98 genes and their up-regulated gene set contained 20 genes (Supplementary Table 4), and we named them as ‘SD – Down’ and ‘SD – Up’, respectively. We performed GSEA, on the newly created gene sets, using pre-ranked genes based on their Pre to Post log2FC using the fgsea (v.1.18.0) R package (47). Pre-ranked samples were permuted 1 million times for GSEA, and a Benjamini-Hochberg adjusted P < 0.05 was considered significant. The participant cohort for the Cedernaes etal. (13) study was very similar to the present study and included a young healthy male cohort (n = 15, age; 22.3 ± 0.5 years, BMI; 22.6 ± 0.5 kg/m2), with regular self-reported sleep habits (7 – 9 hours per night), no extreme morning/evening chronotypes, and no self-reported chronic medical conditions. The sleep condition in the study was also similar to the present study and consisted of an 8.5 h sleep opportunity and the average sleep duration on this night was 8.0 h ± 3 min. As in the present study, the muscle biopsies were collected during the morning (between 8 am and 10 am).
The total sleep time (TST) of all participants was assessed using wristwatch sleep actigraphy. There were no differences between groups for mean nightly TST during the baseline sleep period (TST ± sd, NS; 446 ± 26 min, SR; 450 ± 17 min, SR+EX; 457 ± 8 min, P>0.05). There was a significant interaction effect for TST (P<0.001) when comparing the baseline period to the sleep intervention period. During the intervention phase of the study, there was a significant difference between groups for nightly TST (NS; 450 ± 26 min, SR; 230 ± 6 min, and SR+EX; 234 ± 3 min, P<0.001). Compared to the NS group, there was a significant decrease in TST in the SR group (mean difference ± sd, [95% CI], P value, 220 ± 11 min, [197, 244 min], P<0.001) and SR+EX group (216 ± 11 min, [193, 239 min], P<0.001) during the intervention phase. There was no significant difference in TST between the SR and SR+EX groups (-4 ± 3 min, [-27, 18 min], P=0.950).
The changes in glucose tolerance (Table 1), myofibrillar protein synthesis, and skeletal muscle mitochondrial function reported in this cohort previously (14, 15), may be underpinned by changes within the skeletal muscle transcriptome. Therefore, to assess potential changes in gene expression in skeletal muscle that occur in response to a period of sleep restriction, with or without exercise, we performed transcriptomic RNA sequencing (RNAseq) on muscle samples collected pre- and post-intervention. In total, there were 14,917 genes detected with our analysis. Plotting each of the three groups within a multidimensional scaling (MDS) plot failed to separate out any discernible groups (Figure 1B). These results were further enforced by a lack of differentially expressed individual genes (adjusted P values < 0.05; Benjamini-Hochberg method) for any of the groups after the intervention had taken place (Figure 1C). Indeed, there were no significant changes in key circadian clock genes either (Figure 1D).
We then tested for gene sets of functional and biological importance that might be systematically altered in a coordinated manner in the skeletal muscle following our intervention using GSEA (as previously described; (48, 49). Similar approaches have been used where no discernible changes are observed at an individual gene level, but increased insight regarding alterations of underlying biological pathways can be obtained when changes across predefined gene sets are aggregated, (50, 51). We first used a multi-contrast analysis comparing the transcriptomic changes across groups using the REACTOME gene ontology (Figure 2A). This unbiased analysis revealed that pathways significantly enriched, and with the greatest enrichment score, were related to processes associated with the regulation of mitochondrial function and inflammation (Figure 2B–G). Among the pathways significantly upregulated in the SR group, were multiple inflammatory and immune system pathways (Figure 2A), including the interferon alpha/beta signalling (R-HSA-909733) pathway (IFNα/β) (enrichment score (ES), adjusted P value, IFNα/β ES=0.509, P<0.001), interferon gamma signaling (R-HSA-877300) pathway (IFNƴ) (ES=0.480, P<0.001), and the interferon signaling (R-HSA-913531) pathway (IFN) (ES=0.281, P <0.001). These same pathways were unchanged in the NS group (IFNα/β; ES=-0.042, P=0.598, IFNƴ; ES=0.112, P =0.093, and IFN; ES=0.002, P =0.951). However, in the SR+EX group there was no change in IFNα/β (ES=-0.109, P=0.175), but the IFNƴ (ES=-0.177, P =0.007) and IFN (ES=-0.100, P=0.026) pathways were negatively enriched. There was a significant up-regulation of mitochondrial-related pathways within the SR+EX group, including the tricarboxylic acid (TCA) cycle (R-HSA-71403) (TCA ES =0.576, P<0.001), Mitochondrial translation (MT) (R-HSA-5368287) (ES=0.373, P=<0.001), and Complex I biogenesis (CI) (R-HAS-6799198) (CI; ES=0.507, P<0.001). The tricarboxylic acid (TCA) cycle, Mitochondrial translation, and Complex 1 biogenesis gene sets were significantly down-regulated in both the SR (TCA; ES=-0.848, P<0.001, MT; ES=-0.625, P<0.001, and CI; ES=-0.812, P<0.001) and NS (TCA; ES=-0.-0.771, P<0.001, MT; ES=-0.419, P<0.001, and CI; ES=-0.676, P<0.001) groups. There was also a significant decrease in the Translation (R-HSA-72766) pathway in the SR (ES=-0.283, P<0.001) and the NS group (ES=-0.124, P<0.001), but there was an increase in this pathway in the SR+EX group (ES=0.114, P=0.001). In the top 30 significantly altered gene sets (Figure 2A), the enrichment score was larger in the SR group compared to the NS group in 28 of the pathways (other than the collagen formation (R-HSA-1474290) and collagen biosynthesis and modifying enzymes (R-HSA-1650814) pathways) (Supplementary Table 3); however, many pathways in the NS group were also significantly enriched in the same direction as the SR group.
Our multi-contrast analysis demonstrated that similar pathways were altered in the SR and SR+EX groups (Supplementary Table 3) compared to the previously reported changes in skeletal muscle transcripts with total sleep deprivation, which included the upregulation of KEGG pathways such as leukocyte transendothelial migration (hsa04670) and the downregulation of pathways such as oxidative phosphorylation (hsa00190) and ribosomes (hsa03010) (13). However, while the direction of enrichment in these pathways was similar in the SR group compared to the total sleep deprivation condition, the SR+EX group was enriched in the opposite direction. Next, we probed our data set to compare the enrichment, magnitude, and direction of change using the gene sets that were significantly up- and down-regulated following 24 h of sleep deprivation (referred to as, gene sets SD – Up and SD – Down) (Figure 3). In the SR group, there was a significant negative enrichment in the SD - Down gene set (Normalised Enrichment Score (NES), adjusted P value, NES=-2.041 P<0.001). However, there was no significant change in the SD - Up gene set in the SR group (NES=1.370, P=0.106). In the SR+EX group, there was a significant enrichment in the SD - Down gene set, but in the opposite direction (i.e., an increase) (NES=1.540, P=0.016). There was no significant change in the SR+EX group in the SD - Up gene set (NES=-0.818, P=0.706). There were no significant changes in either gene set in the NS group (Down; NES=-1.136, P=0.321, Up; NES=1.125, P=0.321).
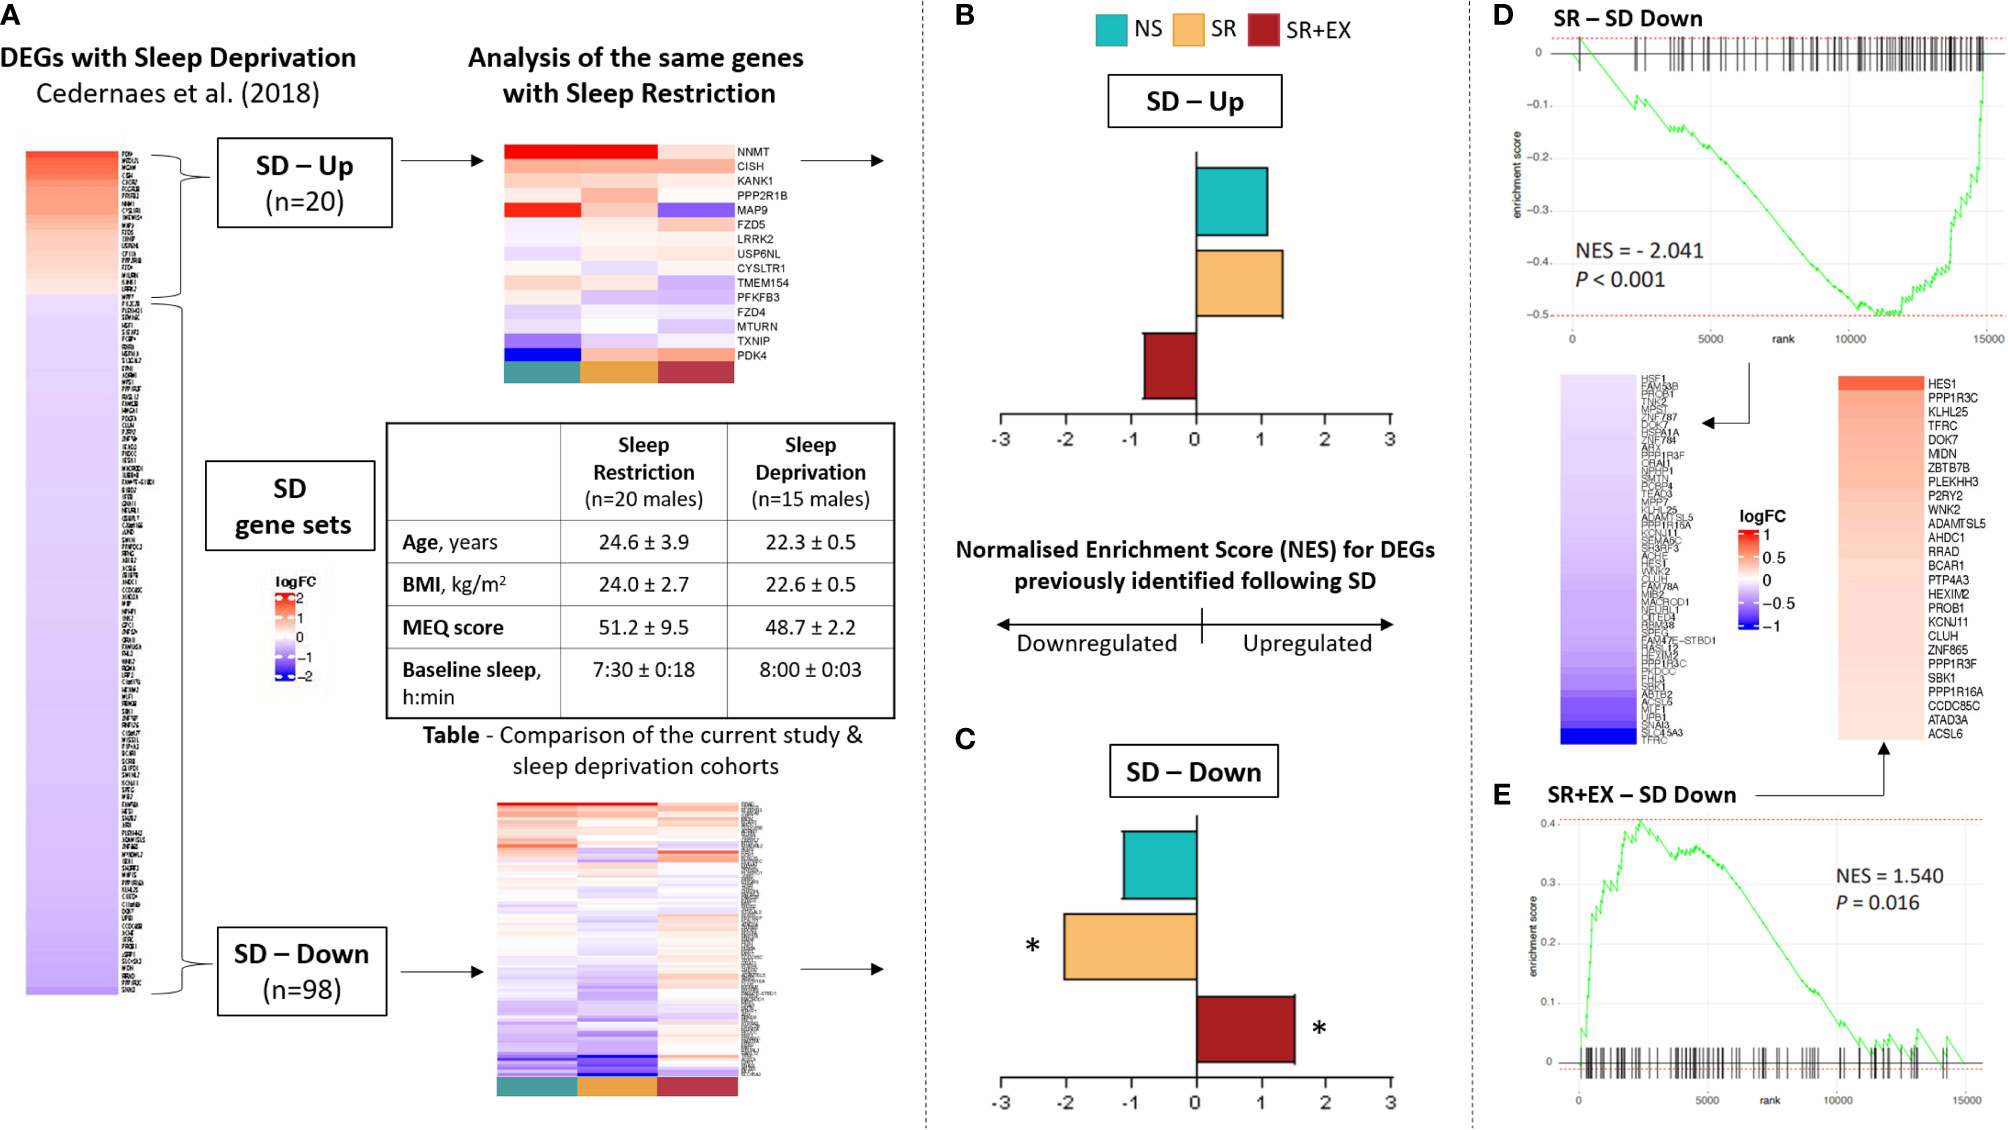
Figure 3 Comparison of our data set with previously reported transcriptional changes following 24 hours of sleep deprivation (13). (A) Overview of analysis workflow: two gene sets were created based on 1) Up-regulated and 2) Down-regulated genes in skeletal muscle following 24 h of sleep deprivation (SD) (created gene sets labelled as SD – Up and SD – Down, respectively). The enrichment of genes comprising SD-Up and SD-Down were then assessed in the current study cohort. Normalised enrichment score (NES) of our data set compared to the (B) SD – Up and (C) SD - Down gene sets. Rank and enrichment score of the SD - Down gene set in the (D) SR group and (E) SR+EX group, as well as heatmaps of leading-edge genes. Normal Sleep (NS), Sleep Restriction (SR), Sleep Restriction and Exercise (SR+EX), morningness-eveningness questionnaire score (MEQ score), differentially expressed genes (DEGs). *Denotes significant enrichment (adjusted P value <0.05).
We assessed changes in the skeletal muscle transcriptome in response to a period of sleep restriction (five nights, 4 h TIB per night), with or without HIIE in healthy males. We did not detect any significant changes in individual genes from pre- to post-intervention, which contrasts with previous reports of skeletal muscle transcriptional changes in response to one night of total sleep deprivation (13). These results suggest a period of moderate sleep restriction may not cause the same magnitude of changes to the skeletal muscle transcriptome as 24 h of total sleep deprivation. However, utilising GSEA, we provide evidence of small but significant changes in important transcriptional pathways. These pathways were specifically related to the regulation of interferon signalling and inflammatory/immune responses pathways following SR. However, these changes were absent or occurred in the opposite direction in the SR+EX group.
The transcriptional responses of skeletal muscle, a key metabolic organ, to a period of moderate sleep restriction have not been characterised previously. In the present study, we report no differentially expressed individual genes in the skeletal muscle samples of those with an 8-h sleep opportunity (NS group) or those with a 4-h sleep opportunity (SR group). This result contrasts with a previous study that investigated the skeletal muscle transcriptional response to one night of total sleep deprivation (13). Cedernaes et al. (13) reported that 118 skeletal muscle mRNA transcripts were altered (20 up-regulated and 98 down-regulated), including genes associated with inflammatory processes, protein degradation, mitochondrial function, and glucose metabolism. While there were no differentially expressed individual genes in our study, the gene set composed of the down-regulated genes from Cedernaes et al. (13) (e.g., SD – Down) was also significantly decreased in our SR group; this suggests that our sleep intervention may have had some similar but smaller effects on the transcriptome.
Like Cedernaes et al. (13), we report an increased enrichment of inflammatory and immune-related pathways, and a negative enrichment of pathways associated with mitochondrial regulation (including oxidative phosphorylation-related pathways) in the SR group. The changes in these mitochondrial and inflammatory-related pathways may contribute to reductions in glucose tolerance and mitochondrial function previously reported following sleep loss (7, 11, 13, 15, 16). Of note, changes in glucose tolerance (7, 11), blood pressure and vascular endothelial function (52), inflammatory markers (e.g., IL-6 and TNF-α) (53), and neuro-behavioural assessments (54) significantly differ depending on the dose and extent of sleep loss. Therefore, the differences in the magnitude of the transcriptomic response in this study compared to previous reports may be explained by the use of different sleep loss interventions and the severity of the sleep loss.
The duration of our intervention may also have contributed to differences observed between this study and that of Cedernaes et al. (13). There is evidence to suggest the short-term effects of a period of sleep loss, such as one night of sleep deprivation (11, 13), an extended period of sleep restriction (7), or even a single night of sleep restriction (9), reduces glucose tolerance; however, the longer-term effects may not be as pronounced (55, 56). For example, Robertson et al. (55) reported that insulin sensitivity (determined via a hyperinsulinaemic–euglycaemic clamp) was decreased following one week of sleep restriction (habitual sleep reduced by 1.5 h each night), but this effect was no longer evident after two or three weeks of the same intervention. Furthermore, Sweeney et al. (56) assessed glucose tolerance after each night of sleep restriction (4 h TIB for 4 nights) and observed that although glucose tolerance was reduced with SR, this impairment did not occur in a cumulative manner. Similarly, sleep-loss-induced changes in blood pressure and endothelial function are highest after one night of sleep restriction (4 h TIB) and gradually decrease over multiple nights (57), and increased energy intake is reported in the early phases of sleep restriction protocols before returning to baseline levels on subsequent nights (58, 59). These findings suggest an adaptive physiological response to the stress of sleep restriction that occurs over extended periods; this same phenomenon may help to explain the results in this study. In the same way that there appears to be a diminished transcriptional response to the stress of exercise when the same exercise session is repeated (37, 60, 61), the transcriptional response to the stress of sleep restriction may decrease over time. Similar models of this phenomenon, termed allostasis, have been proposed in this field previously (62, 63). How this hypothesis fits with epidemiological evidence of long-term deleterious effects of inadequate sleep requires further investigation.
A curious aspect of our findings was the similar direction of change in enrichment of many GSEA pathways for both the SR and NS groups. Noticeably, there was a significant change in enrichment in 27 of the top 30 pathways for the NS group. While the change in enrichment score was higher in the SR group compared to the NS group in 28 of the 30 pathways (Supplementary Table 3), and only the SR group had significant changes in a sleep deprivation gene set (i.e., SD-Down), the similar responses of the NS and SR groups raise the possibility that alterations to these pathways may have been influenced by factors other than sleep restriction. For example, changes in a participant’s environment, diet, and physical activity patterns (although habitual step counts were maintained in our study) have been reported to influence skeletal muscle transcriptomic responses (64, 65). Although habitual step counts were maintained throughout the study, the negative enrichment in a number of mitochondrial-related pathways may reflect changes to regular additional habitual physical activity.
Exercise has been proposed as a potential intervention to mitigate the detrimental metabolic effects associated with inadequate sleep (18). In this study, the GSEA indicated that several pathways associated with mitochondrial regulation had increased their enrichment post-intervention in the SR+EX group, compared to the SR and NS groups. HIIE is well known to induce increases in mitochondrial content and respiratory function (29, 66), which may explain why these pathways were positively enriched in our study. Furthermore, despite the increased enrichment of inflammatory and immune pathways [i.e., Interferon alpha/beta signalling (R-HSA-909733)] in the SR group, this change was not evident in the SR+EX group. It has been proposed that exercise can induce a protective, anti-inflammatory environment (67), which may explain why the increases in these pathways observed in the SR group were not observed in the SR+EX group. Furthermore, there was a significant positive enrichment in the SR+EX group for the SD – Down gene set, suggesting that the transcriptional response of these genes was in the opposite direction to both the observed change in the SR group and previously reported following sleep deprivation. Collectively, these results suggest that the transcriptional response to HIIE during a period of SR prevented the increases in interferon signalling pathway enrichment that were reported with SR alone.
The timing of the collection of muscle samples may influence the interpretation of transcriptional responses within skeletal muscle that have been reported in both sleep loss and exercise studies. In the present study, muscle samples were collected three hours after waking from the final night of sleep restriction (4 h TIB). Considering that the homeostatic drive for sleep increases throughout the day, it is plausible that despite experiencing significant sleep debt throughout the study the transcriptional changes with this type of intervention may occur later in the day or have been diminished following four hours of sleep (68). The timing of muscle sample collection may also explain why no differentially expressed individual genes were observed in the SR+EX group. High-intensity exercise protocols like that used in this study can elicit significant transient, transcriptional changes within skeletal muscle that typically return to resting values within 24 to 48 h (38, 69). Muscle samples in our study were purposely collected 48 h following the final HIIE session to avoid capturing the acute effects of exercise, but this also means it is likely our analysis did not detect skeletal muscle transcriptional changes that occurred in the time immediately post exercise. Indeed, Mahoney et al. (70) assessed global mRNA expression in skeletal muscle via cDNA microarray following an exhaustive 75-minute bout of HIIE. It was reported that 181 genes were differentially expressed 3 h post exercise, but this number had reduced to 41 genes by the 48-h time point (which corresponds to the timing of the sample collection following the final HIIE session in the present study). Therefore, the timing of sample collection in this study may not have captured the transient nature of all the transcriptional changes induced by our interventions.
One previous study has investigated the influence of sleep restriction on changes to the transcriptome of peripheral blood cells (71). In this study, participants underwent a sleep restriction protocol of seven nights, with 6 h TIB each night (average sleep duration of 5.7 h). It was reported that 711 gene transcripts were altered following the intervention (267 up-regulated and 444 down-regulated). While the intervention used is of a similar nature to the present study, it is difficult to compare the transcriptional results between different tissues. While Moller-Levet et al. (71) and others (72) have suggested that changes to the blood transcriptome may be reflective of the changes within other tissue, this may not necessarily be the case in skeletal muscle. Recently, a meta-analysis on transcriptomic responses to a single session of exercise in skeletal muscle compared to blood was performed (39). The gene set enrichment analysis (GSEA) found overlap of just one enriched pathway between muscle and blood. Furthermore, in Cedernaes etal. (13), the transcriptomic response of skeletal muscle and adipose tissue to sleep deprivation was compared. There was no overlap between the two tissues for differentially expressed transcripts, highlighting the tissue-specific effects induced by sleep loss. As such, it is not necessarily surprising that the present study’s findings are different to previously reported transcriptional responses from whole blood.
In comparison to other studies investigating the skeletal muscle transcriptional responses to sleep deprivation (13) and the whole-blood transcriptome response to sleep restriction (71), the current study has a smaller sample size and a parallel group design (rather than a cross-over design). Furthermore, the inter-individual coefficient of variation for whole-blood transcripts at baseline and in response to exercise has previously been reported to be approximately 27% (73). Therefore, the smaller sample size of this study, coupled with the heterogeneity of transcripts at baseline and in response to the sleep intervention, would have limited the ability to detect meaningful changes in the samples. Another caveat of the study design is that muscle samples were collected following a standardised (75 g) 2 h OGTT. Considering that insulin has a known influence on the skeletal muscle transcriptome (74) and that participants in the SR group had an altered glycaemic response (15), this may have impacted the results. There is a need for follow-up studies with larger sample sizes (that also contain females and older participants) to confirm these findings and increase their application within the wider community. Future studies may also consider including additional muscle sampling time-points. Samples collected after each night of sleep restriction, immediately prior to sleep, and in the hours following exercise may help to elucidate the transcriptional effects of similar interventions and provide insight into the mechanisms underlying the detrimental health effects of inadequate sleep. Furthermore, to improve our understanding of the effect of exercise on the skeletal muscle transcriptome in the context of sleep restriction, an additional group that performed exercise with normal sleep conditions (i.e., NS+EX) would have been valuable. Meal timing and sleep schedules were tightly controlled in our study, however, under free-living conditions periods of sleep restriction are often accompanied by inconsistent schedules and varied eating habits (75). This should be considered when assessing the generalisability of our findings.
In summary, five nights of sleep restriction (4 h TIB, each night) decreased the enrichment of gene pathways associated with mitochondrial function and increased the enrichment of inflammatory-related pathways. In contrast, performing three sessions of HIIE counteracted the pattern of gene set enrichment observed in the SR group, suggesting that exercise may help mitigate the previously reported detrimental effects associated with inadequate sleep. The alterations to the transcriptome in this study were less apparent than that previously reported following 24 h of sleep deprivation (13), suggesting that periods of repeated moderate sleep restriction may not cause the same magnitude of transcriptional response in skeletal muscle compared to more severe interventions.
The original contributions presented in the study are publicly available. The transcriptomic data has been deposited in the NCBI and can be found under the BioProject PRJNA807098.
The studies involving human participants were reviewed and approved by Victoria University Human Research Ethics Committee. The patients/participants provided their written informed consent to participate in this study.
NS, DB and JB were involved in the conception and design of the work, NS, ML, NP, AG, JK, NC, JB, NJ, WL, XW, HC, DB and JB were involved in the acquisition, analysis or interpretation of the data for the work. NS, ML, NP, AG, NC, JB, NJ, JK, DB and JB were involved in drafting the work and revising it critically for important intellectual content. All authors approved the final version of the manuscript. All authors agree to be accountable for all aspects of the work in ensuring that questions related to the accuracy or integrity of any part of the work are appropriately investigated and resolved. All persons designated as authors qualify for authorship, and all those who qualify for authorship are listed.
This publication was supported in part by a Sports Medicine Australia (SMA) Research Foundation Grant and Australian Postgraduate Award PhD Scholarship to NS. In addition, support was provided by Overseas Outstanding Tutor Project (2021-2023), Department of Science and Technology of Guangdong Province to WL, XW and HC.
The authors declare that the research was conducted in the absence of any commercial or financial relationships that could be construed as a potential conflict of interest.
All claims expressed in this article are solely those of the authors and do not necessarily represent those of their affiliated organizations, or those of the publisher, the editors and the reviewers. Any product that may be evaluated in this article, or claim that may be made by its manufacturer, is not guaranteed or endorsed by the publisher.
We would like to thank all participants for their willingness to be involved with this study. We acknowledge the assistance of Dwight Marinkovic during data collection and Conor Verbruggen throughout the analysis process.
The Supplementary Material for this article can be found online at: https://www.frontiersin.org/articles/10.3389/fendo.2022.863224/full#supplementary-material
1. Ford ES, Cunningham TJ, Croft JB. Trends in Self-Reported Sleep Duration Among US Adults From 1985 to 2012. Sleep (2015) 38(5):829–32. doi: 10.5665/sleep.4684
2. Hirshkowitz M, Whiton K, Albert SM, Alessi C, Bruni O, DonCarlos L, et al. National Sleep Foundation's Updated Sleep Duration Recommendations: Final Report. Sleep Health (2015) 1(4):233–43. doi: 10.1016/j.sleh.2015.10.004
3. Schmid SM, Hallschmid M, Schultes B. The Metabolic Burden of Sleep Loss. Lancet Diabetes Endocrinol (2015) 3(1):52–62. doi: 10.1016/S2213-8587(14)70012-9
4. Tamakoshi A, Ohno Y, J. S. Group. Self-Reported Sleep Duration as a Predictor of All-Cause Mortality: Results From the JACC Study, Japan. Sleep (2004) 27(1):51–4. doi: 10.1093/sleep/27.1.51
5. Cappuccio FP, D'Elia L, Strazzullo P, Miller MA. Quantity and Quality of Sleep and Incidence of Type 2 Diabetes: A Systematic Review and Meta-Analysis. Diabetes Care (2010) 33(2):414–20. doi: 10.2337/dc09-1124
6. Cappuccio FP, Cooper D, D'Elia L, Strazzullo P, Miller MA. Sleep Duration Predicts Cardiovascular Outcomes: A Systematic Review and Meta-Analysis of Prospective Studies. Eur Heart J (2011) 32(12):1484–92. doi: 10.1093/eurheartj/ehr007
7. Spiegel K, Leproult R, Van Cauter E. Impact of Sleep Debt on Metabolic and Endocrine Function. Lancet (1999) 354(9188):1435–9. doi: 10.1016/S0140-6736(99)01376-8
8. Buxton OM, Pavlova M, Reid EW, Wang W, Simonson DC, Adler GK. Sleep Restriction for 1 Week Reduces Insulin Sensitivity in Healthy Men. Diabetes (2010) 59(9):2126–33. doi: 10.2337/db09-0699
9. Donga E, van Dijk M, van Dijk JG, Biermasz NR, Lammers GJ, van Kralingen KW, et al. A Single Night of Partial Sleep Deprivation Induces Insulin Resistance in Multiple Metabolic Pathways in Healthy Subjects. J Clin Endocrinol Metab (2010) 95(6):2963–8. doi: 10.1210/jc.2009-2430
10. Reynolds AC, Dorrian J, Liu PY, Van Dongen HP, Wittert GA, Harmer LJ, et al. Impact of Five Nights of Sleep Restriction on Glucose Metabolism, Leptin and Testosterone in Young Adult Men. PloS One (2012) 7(7):e41218. doi: 10.1371/journal.pone.0041218
11. Cedernaes J, Osler ME, Voisin S, Broman JE, Vogel H, Dickson SL, et al. Acute Sleep Loss Induces Tissue-Specific Epigenetic and Transcriptional Alterations to Circadian Clock Genes in Men. J Clin Endocrinol Metab (2015), JC20152284. doi: 10.1210/JC.2015-2284
12. Rao MN, Neylan TC, Grunfeld C, Mulligan K, Schambelan M, Schwarz JM. Subchronic Sleep Restriction Causes Tissue-Specific Insulin Resistance. J Clin Endocrinol Metab (2015) 100(4):1664–71. doi: 10.1210/jc.2014-3911
13. Cedernaes J, Schonke M, Westholm JO, Mi J, Chibalin A, Voisin S, et al. Acute Sleep Loss Results in Tissue-Specific Alterations in Genome-Wide DNA Methylation State and Metabolic Fuel Utilization in Humans. Sci Adv (2018) 4(8):eaar8590. doi: 10.1126/sciadv.aar8590
14. Saner NJ, Lee MJ, Pitchford NW, Kuang J, Roach GD, Garnham A, et al. The Effect of Sleep Restriction, With or Without High-Intensity Interval Exercise, on Myofibrillar Protein Synthesis in Healthy Young Men. J Physiol (2020) 598(8):1523–36. doi: 10.1113/JP278828
15. Saner NJ, Lee MJ, Kuang J, Pitchford NW, Roach GD, Garnham A, et al. Exercise Mitigates Sleep-Loss-Induced Changes in Glucose Tolerance, Mitochondrial Function, Sarcoplasmic Protein Synthesis, and Diurnal Rhythms. Mol Metab (2021) 43:101110. doi: 10.1016/j.molmet.2020.101110
16. Broussard JL, Ehrmann DA, Van Cauter E, Tasali E, Brady MJ. Impaired Insulin Signaling in Human Adipocytes After Experimental Sleep Restriction: A Randomized, Crossover Study. Ann Intern Med (2012) 157(8):549–57. doi: 10.7326/0003-4819-157-8-201210160-00005
17. Sweeney EL, Jeromson S, Hamilton DL, Brooks NE, Walshe IH. Skeletal Muscle Insulin Signaling and Whole-Body Glucose Metabolism Following Acute Sleep Restriction in Healthy Males. Physiol Rep (2017) 5(23):1–8. doi: 10.14814/phy2.13498
18. Saner NJ, Bishop DJ, Bartlett JD. Is Exercise a Viable Therapeutic Intervention to Mitigate Mitochondrial Dysfunction and Insulin Resistance Induced by Sleep Loss? Sleep Med Rev (2018) 37:60–8. doi: 10.1016/j.smrv.2017.01.001
19. Lamon S, Morabito A, Arentson-Lantz E, Knowles O, Vincent GE, Condo D, et al. The Effect of Acute Sleep Deprivation on Skeletal Muscle Protein Synthesis and the Hormonal Environment. Physiol Rep (2021) 9(1):e14660. doi: 10.14814/phy2.14660
20. Van Cauter E, Blackman JD, Roland D, Spire JP, Refetoff S, Polonsky KS. Modulation of Glucose Regulation and Insulin Secretion by Circadian Rhythmicity and Sleep. J Clin Invest (1991) 88(3):934–42. doi: 10.1172/JCI115396
21. van den Berg R, Mook-Kanamori DO, Donga E, van Dijk M, van Dijk JG, Lammers GJ, et al. A Single Night of Sleep Curtailment Increases Plasma Acylcarnitines: Novel Insights in the Relationship Between Sleep and Insulin Resistance. Arch Biochem Biophys (2016) 589:145–51. doi: 10.1016/j.abb.2015.09.017
22. Eckel RH, Depner CM, Perreault L, Markwald RR, Smith MR, McHill AW, et al. Morning Circadian Misalignment During Short Sleep Duration Impacts Insulin Sensitivity. Curr Biol (2015) 25(22):3004–10. doi: 10.1016/j.cub.2015.10.011
23. Broussard JL, Wroblewski K, Kilkus JM, Tasali E. Two Nights of Recovery Sleep Reverses the Effects of Short-Term Sleep Restriction on Diabetes Risk. Diabetes Care (2016) 39(3):e40–41. doi: 10.2337/dc15-2214
24. Depner CM, Melanson EL, Eckel RH, Snell-Bergeon JK, Perreault L, Bergman BC, et al. Ad Libitum Weekend Recovery Sleep Fails to Prevent Metabolic Dysregulation During a Repeating Pattern of Insufficient Sleep and Weekend Recovery Sleep. Curr Biol (2019) 29(6):957–967.e954. doi: 10.1016/j.cub.2019.01.069
25. Ness KM, Strayer SM, Nahmod NG, Chang AM, Buxton OM, Shearer GC. Two Nights of Recovery Sleep Restores the Dynamic Lipemic Response, But Not the Reduction of Insulin Sensitivity, Induced by Five Nights of Sleep Restriction. Am J Physiol Regul Integr Comp Physiol (2019) 316(6):R697–703. doi: 10.1152/ajpregu.00336.2018
26. Little JP, Gillen JB, Percival ME, Safdar A, Tarnopolsky MA, Punthakee Z, et al. Low-Volume High-Intensity Interval Training Reduces Hyperglycemia and Increases Muscle Mitochondrial Capacity in Patients With Type 2 Diabetes. J Appl Physiol (1985) (2011) 111(6):1554–60. doi: 10.1152/japplphysiol.00921.2011
27. Richter EA, Hargreaves M. Exercise, GLUT4, and Skeletal Muscle Glucose Uptake. Physiol Rev (2013) 93(3):993–1017. doi: 10.1152/physrev.00038.2012
28. Holloszy JO. Biochemical Adaptations in Muscle. Effects of Exercise on Mitochondrial Oxygen Uptake and Respiratory Enzyme Activity in Skeletal Muscle. J Biol Chem (1967) 242(9):2278–82. doi: 10.1016/S0021-9258(18)96046-1
29. Robinson MM, Dasari S, Konopka AR, Johnson ML, Manjunatha S, Esponda RR, et al. Enhanced Protein Translation Underlies Improved Metabolic and Physical Adaptations to Different Exercise Training Modes in Young and Old Humans. Cell Metab (2017) 25(3):581–92. doi: 10.1016/j.cmet.2017.02.009
30. Bishop DJ, Botella J, Genders AJ, Lee MJ, Saner NJ, Kuang J, et al. High-Intensity Exercise and Mitochondrial Biogenesis: Current Controversies and Future Research Directions. Physiol (Bethesda) (2019) 34(1):56–70. doi: 10.1152/physiol.00038.2018
31. Philp AM, Saner NJ, Lazarou M, Ganley IG, Philp A. The Influence of Aerobic Exercise on Mitochondrial Quality Control in Skeletal Muscle. J Physiol (2020) 599:3663–476. doi: 10.1113/JP279411
32. Granata C, Caruana NJ, Botella J, Jamnick NA, Huynh K, Kuang J, et al. High-Intensity Training Induces non-Stoichiometric Changes in the Mitochondrial Proteome of Human Skeletal Muscle Without Reorganisation of Respiratory Chain Content. Nat Commun (2021) 12(1):7056. doi: 10.1038/s41467-021-27153-3
33. Kemler D, Wolff CA, Esser KA. Time of Day Dependent Effects of Contractile Activity on the Phase of the Skeletal Muscle Clock. J Physiol (2020) 598:3631–44. doi: 10.1101/2020.03.05.978759
34. Saner NJ, Lee MJ. Exercise: It's Only a Matter of Time. J Physiol (2020) 598(21):4755–7. doi: 10.1113/JP280366
35. de Souza JFT, Dattilo M, de Mello MT, Tufik S, Antunes HKM. High-Intensity Interval Training Attenuates Insulin Resistance Induced by Sleep Deprivation in Healthy Males. Front Physiol (2017) 8:992. doi: 10.3389/fphys.2017.00992
36. Sweeney EL, Peart DJ, Kyza I, Harkes T, Ellis JG, Walshe IH. Impaired Insulin Profiles Following a Single Night of Sleep Restriction: The Impact of Acute Sprint Interval Exercise. Int J Sport Nutr Exerc Metab (2020) 30(2):139–44. doi: 10.1123/ijsnem.2019-0235
37. Perry CGR, Lally J, Holloway GP, Heigenhauser GJF, Bonen A, Spriet LL. Repeated Transient mRNA Bursts Precede Increases in Transcriptional and Mitochondrial Proteins During Training in Human Skeletal Muscle. J Physiol-Lond (2010) 588(23):4795–810. doi: 10.1113/jphysiol.2010.199448
38. Pillon NJ, Gabriel BM, Dollet L, Smith JAB, Sardon Puig L, Botella J, et al. Transcriptomic Profiling of Skeletal Muscle Adaptations to Exercise and Inactivity. Nat Commun (2020) 11(1):470. doi: 10.1038/s41467-019-13869-w
39. Amar D, Lindholm ME, Norrbom J, Wheeler MT, Rivas MA, Ashley EA. Time Trajectories in the Transcriptomic Response to Exercise - A Meta-Analysis. Nat Commun (2021) 12(1):3471. doi: 10.1038/s41467-021-23579-x
40. Boivin DB, Duffy JF, Kronauer RE, Czeisler CA. Dose-response relationships for resetting of human circadian clock by light. Nature (1996) 379:540–2.
41. Stone KL, Ancoli-Israel S. Actigraphy. In Principles and practice of sleep medicine. 6th edition Kryger MH, Roth T, Dement WC. ed. Elsevier (2016), 1671–8.
42. Horne JA, Ostberg O. A Self-Assessment Questionnaire to Determine Morningness-Eveningness in Human Circadian Rhythms. Int J Chronobiol (1976) 4(2):97–110.
43. Kuang J, Yan X, Genders AJ, Granata C, Bishop DJ. An Overview of Technical Considerations When Using Quantitative Real-Time PCR Analysis of Gene Expression in Human Exercise Research. PloS One (2018) 13(5):e0196438. doi: 10.1371/journal.pone.0196438
44. Xanthopoulou A, Montero-Pau J, Pico B, Boumpas P, Tsaliki E, Paris HS, et al. A Comprehensive RNA-Seq-Based Gene Expression Atlas of the Summer Squash (Cucurbita Pepo) Provides Insights Into Fruit Morphology and Ripening Mechanisms. BMC Genomics (2021) 22(1):341. doi: 10.1186/s12864-021-07683-2
45. Ritchie ME, Phipson B, Wu D, Hu Y, Law CW, Shi W, et al. Limma Powers Differential Expression Analyses for RNA-Sequencing and Microarray Studies. Nucleic Acids Res (2015) 43(7):e47. doi: 10.1093/nar/gkv007
46. Kaspi A, Ziemann M. Mitch: Multi-Contrast Pathway Enrichment for Multi-Omics and Single-Cell Profiling Data. BMC Genomics (2020) 21(1):447. doi: 10.1186/s12864-020-06856-9
47. Korotkevich G, Sukhov V, Budin N, Shpak B, Artyomov MN, Sergushichev A. Fast Gene Set Enrichment Analysis. bioRxiv (2021), 060012. doi: 10.1101/060012
48. Mootha VK, Lindgren CM, Eriksson KF, Subramanian A, Sihag S, Lehar J, et al. PGC-1alpha-Responsive Genes Involved in Oxidative Phosphorylation are Coordinately Downregulated in Human Diabetes. Nat Genet (2003) 34(3):267–73. doi: 10.1038/ng1180
49. Subramanian A, Tamayo P, Mootha VK, Mukherjee S, Ebert BL, Gillette MA, et al. Gene Set Enrichment Analysis: A Knowledge-Based Approach for Interpreting Genome-Wide Expression Profiles. Proc Natl Acad Sci USA (2005) 102(43):15545–50. doi: 10.1073/pnas.0506580102
50. Abraham G, Kowalczyk A, Loi S, Haviv I, Zobel J. Prediction of Breast Cancer Prognosis Using Gene Set Statistics Provides Signature Stability and Biological Context. BMC Bioinf (2010) 11:277. doi: 10.1186/1471-2105-11-277
51. Reimand J, Isserlin R, Voisin V, Kucera M, Tannus-Lopes C, Rostamianfar A, et al. Pathway Enrichment Analysis and Visualization of Omics Data Using G:Profiler, GSEA, Cytoscape and EnrichmentMap. Nat Protoc (2019) 14(2):482–517. doi: 10.1038/s41596-018-0103-9
52. Holmer BJ, Lapierre SS, Jake-Schoffman DE, Christou DD. Effects of Sleep Deprivation on Endothelial Function in Adult Humans: A Systematic Review. Geroscience (2021) 43(1):137–58. doi: 10.1007/s11357-020-00312-y
53. Faraut B, Boudjeltia KZ, Vanhamme L, Kerkhofs M. Immune, Inflammatory and Cardiovascular Consequences of Sleep Restriction and Recovery. Sleep Med Rev (2012) 16(2):137–49. doi: 10.1016/j.smrv.2011.05.001
54. Van Dongen HP, Maislin G, Mullington JM, Dinges DF. The Cumulative Cost of Additional Wakefulness: Dose-Response Effects on Neurobehavioral Functions and Sleep Physiology From Chronic Sleep Restriction and Total Sleep Deprivation. Sleep (2003) 26(2):117–26. doi: 10.1093/sleep/26.2.117
55. Robertson MD, Russell-Jones D, Umpleby AM, Dijk DJ. Effects of Three Weeks of Mild Sleep Restriction Implemented in the Home Environment on Multiple Metabolic and Endocrine Markers in Healthy Young Men. Metabolism (2013) 62(2):204–11. doi: 10.1016/j.metabol.2012.07.016
56. Sweeney EL, Peart DJ, Ellis JG, Walshe IH. Impairments in Glycaemic Control do Not Increase Linearly With Repeated Nights of Sleep Restriction in Healthy Adults: A Randomised Controlled Trial. Appl Physiol Nutr Metab (2021), 1–6. doi: 10.1139/apnm-2020-1025
57. Covassin N, Bukartyk J, Singh P, Calvin AD, St Louis EK, Somers VK. Effects of Experimental Sleep Restriction on Ambulatory and Sleep Blood Pressure in Healthy Young Adults: A Randomized Crossover Study. Hypertension (2021) 78(3):859–70. doi: 10.1161/HYPERTENSIONAHA.121.17622
58. Markwald RR, Melanson EL, Smith MR, Higgins J, Perreault L, Eckel RH, et al. Impact of Insufficient Sleep on Total Daily Energy Expenditure, Food Intake, and Weight Gain. Proc Natl Acad Sci USA (2013) 110(14):5695–700. doi: 10.1073/pnas.1216951110
59. Covassin N, Singh P, McCrady-Spitzer SK, St Louis EK, Calvin AD, Levine JA, et al. Effects of Experimental Sleep Restriction on Energy Intake, Energy Expenditure, and Visceral Obesity. J Am Coll Cardiol (2022) 79(13):1254–65. doi: 10.1016/j.jacc.2022.01.038
60. Stepto NK, Benziane B, Wadley GD, Chibalin AV, Canny BJ, Eynon N, et al. Short-Term Intensified Cycle Training Alters Acute and Chronic Responses of PGC1alpha and Cytochrome C Oxidase IV to Exercise in Human Skeletal Muscle. PloS One (2012) 7(12):e53080. doi: 10.1371/journal.pone.0053080
61. Granata C, Oliveira RSF, Little JP, Bishop DJ. Forty High-Intensity Interval Training Sessions Blunt Exercise-Induced Changes in the Nuclear Protein Content of PGC-1alpha and P53 in Human Skeletal Muscle. Am J Physiol Endocrinol Metab (2020) 318(2):E224–36. doi: 10.1152/ajpendo.00233.2019
62. Kim Y, Laposky AD, Bergmann BM, Turek FW. Repeated Sleep Restriction in Rats Leads to Homeostatic and Allostatic Responses During Recovery Sleep. Proc Natl Acad Sci USA (2007) 104(25):10697–702. doi: 10.1073/pnas.0610351104
63. McEwen BS, Karatsoreos IN. Sleep Deprivation and Circadian Disruption: Stress, Allostasis, and Allostatic Load. Sleep Med Clin (2015) 10(1):1–10. doi: 10.1016/j.jsmc.2014.11.007
64. Makhnovskii PA, Bokov RO, Kolpakov FA, Popov DV. Transcriptomic Signatures and Upstream Regulation in Human Skeletal Muscle Adapted to Disuse and Aerobic Exercise. Int J Mol Sci (2021) 22(3):1208. doi: 10.3390/ijms22031208
65. McFarland AJ, Ray PR, Bhai S, Levine BD, Price TJ. RNA Sequencing on Muscle Biopsy From a 5-Week Bed Rest Study Reveals the Effect of Exercise and Potential Interactions With Dorsal Root Ganglion Neurons. Physiol Rep (2022) 10(3):e15176. doi: 10.14814/phy2.15176
66. Granata C, Jamnick NA, Bishop DJ. Training-Induced Changes in Mitochondrial Content and Respiratory Function in Human Skeletal Muscle. Sport Med (2018) 48(8):1809–28. doi: 10.1007/s40279-018-0936-y
67. Gleeson M, Bishop NC, Stensel DJ, Lindley MR, Mastana SS, Nimmo MA. The Anti-Inflammatory Effects of Exercise: Mechanisms and Implications for the Prevention and Treatment of Disease. Nat Rev Immunol (2011) 11(9):607–15. doi: 10.1038/nri3041
68. Van Dongen H, Rogers NL, Dinges DF. Sleep Debt: Theoretical and Empirical Issues. Sleep Biol Rhyth (2003) 1(1):5–13. doi: 10.1046/j.1446-9235.2003.00006.x
69. Kuang J, McGinley C, Lee MJ-C, Saner NJ, Garnham A, Bishop DJ. Interpretation of Exercise-Induced Changes in Human Skeletal Muscle mRNA Expression Depends on the Timing of the Post-Exercise Biopsies. bioRxiv (2020) 10:e12856. doi: 10.1101/2020.08.05.239038
70. Mahoney DJ, Parise G, Melov S, Safdar A, Tarnopolsky MA. Analysis of Global mRNA Expression in Human Skeletal Muscle During Recovery From Endurance Exercise. FASEB J (2005) 19(11):1498–500. doi: 10.1096/fj.04-3149fje
71. Moller-Levet CS, Archer SN, Bucca G, Laing EE, Slak A, Kabiljo R, et al. Effects of Insufficient Sleep on Circadian Rhythmicity and Expression Amplitude of the Human Blood Transcriptome. Proc Natl Acad Sci USA (2013) 110(12):E1132–1141. doi: 10.1073/pnas.1217154110
72. Liew CC, Ma J, Tang HC, Zheng R, Dempsey AA. The Peripheral Blood Transcriptome Dynamically Reflects System Wide Biology: A Potential Diagnostic Tool. J Lab Clin Med (2006) 147(3):126–32. doi: 10.1016/j.lab.2005.10.005
73. Contrepois K, Wu S, Moneghetti KJ, Hornburg D, Ahadi S, Tsai MS, et al. Molecular Choreography of Acute Exercise. Cell (2020) 181(5):1112–1130.e1116. doi: 10.1016/j.cell.2020.04.043
74. Rome S, Clement K, Rabasa-Lhoret R, Loizon E, Poitou C, Barsh GS, et al. Microarray Profiling of Human Skeletal Muscle Reveals That Insulin Regulates Approximately 800 Genes During a Hyperinsulinemic Clamp. J Biol Chem (2003) 278(20):18063–8. doi: 10.1074/jbc.M300293200
Keywords: high-intensity interval exercise (HIE), transcriptomics, sleep loss, skeletal muscle, mitochondria, circadian rhythm, sleep restriction, inflammation
Citation: Lin W, Saner NJ, Weng X, Caruana NJ, Botella J, Kuang J, Lee MJ-C, Jamnick NA, Pitchford NW, Garnham A, Bartlett JD, Chen H and Bishop DJ (2022) The Effect of Sleep Restriction, With or Without Exercise, on Skeletal Muscle Transcriptomic Profiles in Healthy Young Males. Front. Endocrinol. 13:863224. doi: 10.3389/fendo.2022.863224
Received: 26 January 2022; Accepted: 22 June 2022;
Published: 22 July 2022.
Edited by:
Brendan Gabriel, University of Aberdeen, United KingdomReviewed by:
Naomi Elisabeth Brooks, University of Stirling, United KingdomCopyright © 2022 Lin, Saner, Weng, Caruana, Botella, Kuang, Lee, Jamnick, Pitchford, Garnham, Bartlett, Chen and Bishop. This is an open-access article distributed under the terms of the Creative Commons Attribution License (CC BY). The use, distribution or reproduction in other forums is permitted, provided the original author(s) and the copyright owner(s) are credited and that the original publication in this journal is cited, in accordance with accepted academic practice. No use, distribution or reproduction is permitted which does not comply with these terms.
*Correspondence: Hao Chen, Y2hlbmhAZ3pzcG9ydC5lZHUuY24=; David J. Bishop, ZGF2aWQuYmlzaG9wQHZ1LmVkdS5hdQ==
†These authors share first authorship
Disclaimer: All claims expressed in this article are solely those of the authors and do not necessarily represent those of their affiliated organizations, or those of the publisher, the editors and the reviewers. Any product that may be evaluated in this article or claim that may be made by its manufacturer is not guaranteed or endorsed by the publisher.
Research integrity at Frontiers
Learn more about the work of our research integrity team to safeguard the quality of each article we publish.