
94% of researchers rate our articles as excellent or good
Learn more about the work of our research integrity team to safeguard the quality of each article we publish.
Find out more
ORIGINAL RESEARCH article
Front. Endocrinol. , 14 July 2022
Sec. Diabetes: Molecular Mechanisms
Volume 13 - 2022 | https://doi.org/10.3389/fendo.2022.836152
This article is part of the Research Topic Diabetic Wound: Multifaceted Mechanisms and Future of Diabetic Wound Healing View all 9 articles
 Lin Zeng1,2
 Pengxiang Zhang1,2
 Zebin Fang1,2
 Deliang Liu2*
 Huilin Li2*
 Xin Qu2
 Shufang Chu2
 Hengxia Zhao2
 Xuemei Liu2
 Maosheng Lee2
Background: Diabetic foot ulcer (DFU) is a severe complication characterized by low-grade infectious inflammation and probably associated with specific competitive endogenous RNAs (ceRNAs) and infiltrating immune cells. Nonetheless, no reliable biomarkers are used for detecting infectious inflammation in DFU. Therefore, it is essential to explore potential biomarkers for the accurate diagnosis and treatment of DFU.
Methods: The gene expression profile was retrieved from Gene Expression Omnibus (GEO) database and divided into two groups, namely, standard samples and DFU samples. To establish the ceRNA networks, Gene Ontology (GO) and Kyoto Encyclopedia of Genes and Genomes (KEGG) pathway enrichment analyses were utilized to analyze differential expression genes (DEGs). The cell type identification was achieved by estimating relative subsets of RNA transcripts (CIBERSORT) algorithm to screen-specific immune-infiltrating cells associated with DFU.
Results: A ceRNA network was constructed with 20 differential expression circRNA (DEcircRNAs), 11 differential expression microRNAs (DEmiRNAs), and 9 differential expression mRNAs (DEmRNAs). Functional enrichment analysis demonstrated that DFU was mainly enriched in vascular endothelial growth factor (VEGF) and T-cell receptor signaling. In addition, CIBERSORT estimation indicated that CD8+ T cells and Monocytes were significantly related to the expression of IL-6, a DFU-specific infectious inflammation factor.
Conclusion: This study identified that some significant ceRNAs (JUNB, GATA3, hsa-circ-0049271 and hsa-circ-0074559) and infiltrating immune cells (CD8+ T cells and monocytes) might be related to DFU infectious inflammation.
It is estimated that, every 20 s, a case of diabetic amputation has been witnessed (1). Although the annual mortality rate of diabetic foot ulcers (DFUs) is 11% (2), several studies have demonstrated that DFU treatment accounts for about one-third of the total cost of diabetes (3). Thus, DFU is not only one of the leading causes of disability and death in diabetic patients but also a significant public health problem, placing a heavy burden on the social and economic development. Furthermore, despite the progress in biological and engineering technologies, functional recovery remains poor due to the limited understanding of DFU pathogenesis. Therefore, exploring the molecular mechanisms of DFU is crucial for developing a therapeutic approach.
Circular RNAs (circRNAs) have a closed ring-like structure that resists the function of RNA extrinsic enzymes (4). Through research and development, circRNAs have gradually become star molecules in non-coding RNA in recent years. Rich in microRNA (miRNA) binding sites, circRNAs entirely relieve the inhibition of miRNA on targeted genes acting as miRNA sponges at the transcription level (5). Furthermore, evidence has demonstrated that circRNAs functioning as competitive endogenous RNA (ceRNAs) are significantly associated with the onset and development of DFU. Wang et al. found that hsa_circ_0084443 is upregulated in DF U and modulates keratinocyte migration and proliferation (6). Liao et al. constructed the ceRNA network of DFU consisting of 8 circRNAs, 11 miRNAs, and 91 mRNAs (7). In addition, immune cell infiltration plays critical role in occurrence and development of DFU. Sawaya et al. found FOMI1 and STAT3, the transcription factors which promote survival of immune cells were inhibited in DFU, which eventually impaired human diabetic wound healing (8). However, few studies focus on the regulatory mechanism of ceRNA and the infiltrating immune cells in DFU.
This study aimed to set up a ceRNA network based on DFU-related ceRNAs to investigate the effect of circRNAs on pathogenesis and treatment of DFU. At first, the sequencing data of mRNA, miRNA, and circRNA from Gene Expression Omnibus (GEO) database were extracted to retrieve differentially expressed mRNAs (DEmRNAs), differentially expressed miRNAs (DEmiRNAs), and differentially expressed circRNAs (DEcircRNAs). Then, a circRNAs–miRNAs–mRNAs network was constructed to explore the roles of circRNAs in DFU. Finally, the immune cell ratios associated with DFU of RNA transcripts (CIBERSORT) algorithm were calculated to elevate the prognosis of DFU depending on the immune cells and ceRNAs types.
The microarray data were retrieved from the GEO database. The circRNA, miRNA, and mRNA expression profiles were obtained from GSE114248 (GPL21825 074301 Arraystar Human CircRNA microarray V2, five DFU and five non-DFU samples) (6), GSE84971 (GPL17537 nCounter Human miRNA Expression Assay, V2, three DFU and three non-DFU samples) and GSE68185 (four DFU and four non-DFU samples) (9), GSE80178 (GPL16686 [HuGene-2_0-st] Affymetrix Human Gene 2.0 ST Array [transcript (gene) version], six DFU and three non-DFU tissues) (10), and GSE143735 (11), respectively. The species were Homo sapiens.
The analysis of DEcircRNAs in GSE114248, DEmiRNAs in GSE68185 and GSE84971, and DEmRNAs in GSE80178 and GSE143735 was screened using the limma package in R (12). P-value < 0.05 and |log2(fold change, FC)| >1.0 were set as the thresholds of differential genes.
Gene Ontology (GO) analysis is extensively incorporated to identify the characteristic gene attributes, gene products, and sequences, including biological processes (BP), cell components (CC), and molecular functions (MF) (13). Kyoto Encyclopedia of Genes and Genomes (KEGG) enrichment analysis provides a comprehensive biointerpretation of genomic sequences and information on protein interaction networks (14). This study completed and visualized the GO terms and KEGG pathway enrichment analysis of DEGs using the clusterProfiler V3.14.0 in the R software (15).
Gene set enrichment analysis (GSEA) identified genes with statistically significant differences between standard and DFU samples (16). Through referring to gene sets “c5.go.v7.4.entrez.gmt” and “c2.cp.kegg.v7.4.entrez.gmt”, GSE80187 and GSE143735 were enriched by using the R package.
Gene set variation analysis (GSVA) estimates the unsupervised variation of pathway activity population (17). For example, based on gene set “c2.cp.kegg.v7.4.entrez.gmt”, GSVA screened significantly different pathways between standard and DFU samples with P-value < 5% and a false discovery rate < 25%.
The protein-protein interaction (PPI) network of the DEmRNAs was developed with the STRING database (http://string-db.org/) (18) on the basis of starBase (19), miRwalk (20), and CirnBank (21) databases. Based on TRRUST (22) and CTD (23) databases, a transcription factors-DEmRNAs-drugs network was constructed. It was then visualized by Cytoscape 3.7.1 software (24).
CIBERSORT is a deconvolution algorithm validated on gene expression profiles provided by RNA-sequencing (25). CIBERSORT calculates a P-value for the deconvolution of each sample, which increases confidence in the results. To analyze immune cell proportion in DFU samples, CIBERSORT was employed to evaluate the abundance of 22 human hematopoietic cell phenotypes in GSE80187 and GSE143735. The Wilcoxon test was taken to calculate the difference, and a P-value of less than 0.05 indicated a statistically significant difference.
The expression of circRNA, miRNA, and mRNA in DFU samples was determined by microarray analysis (Supplementary Table 1). The methods and results of our study are shown in Figure 1.
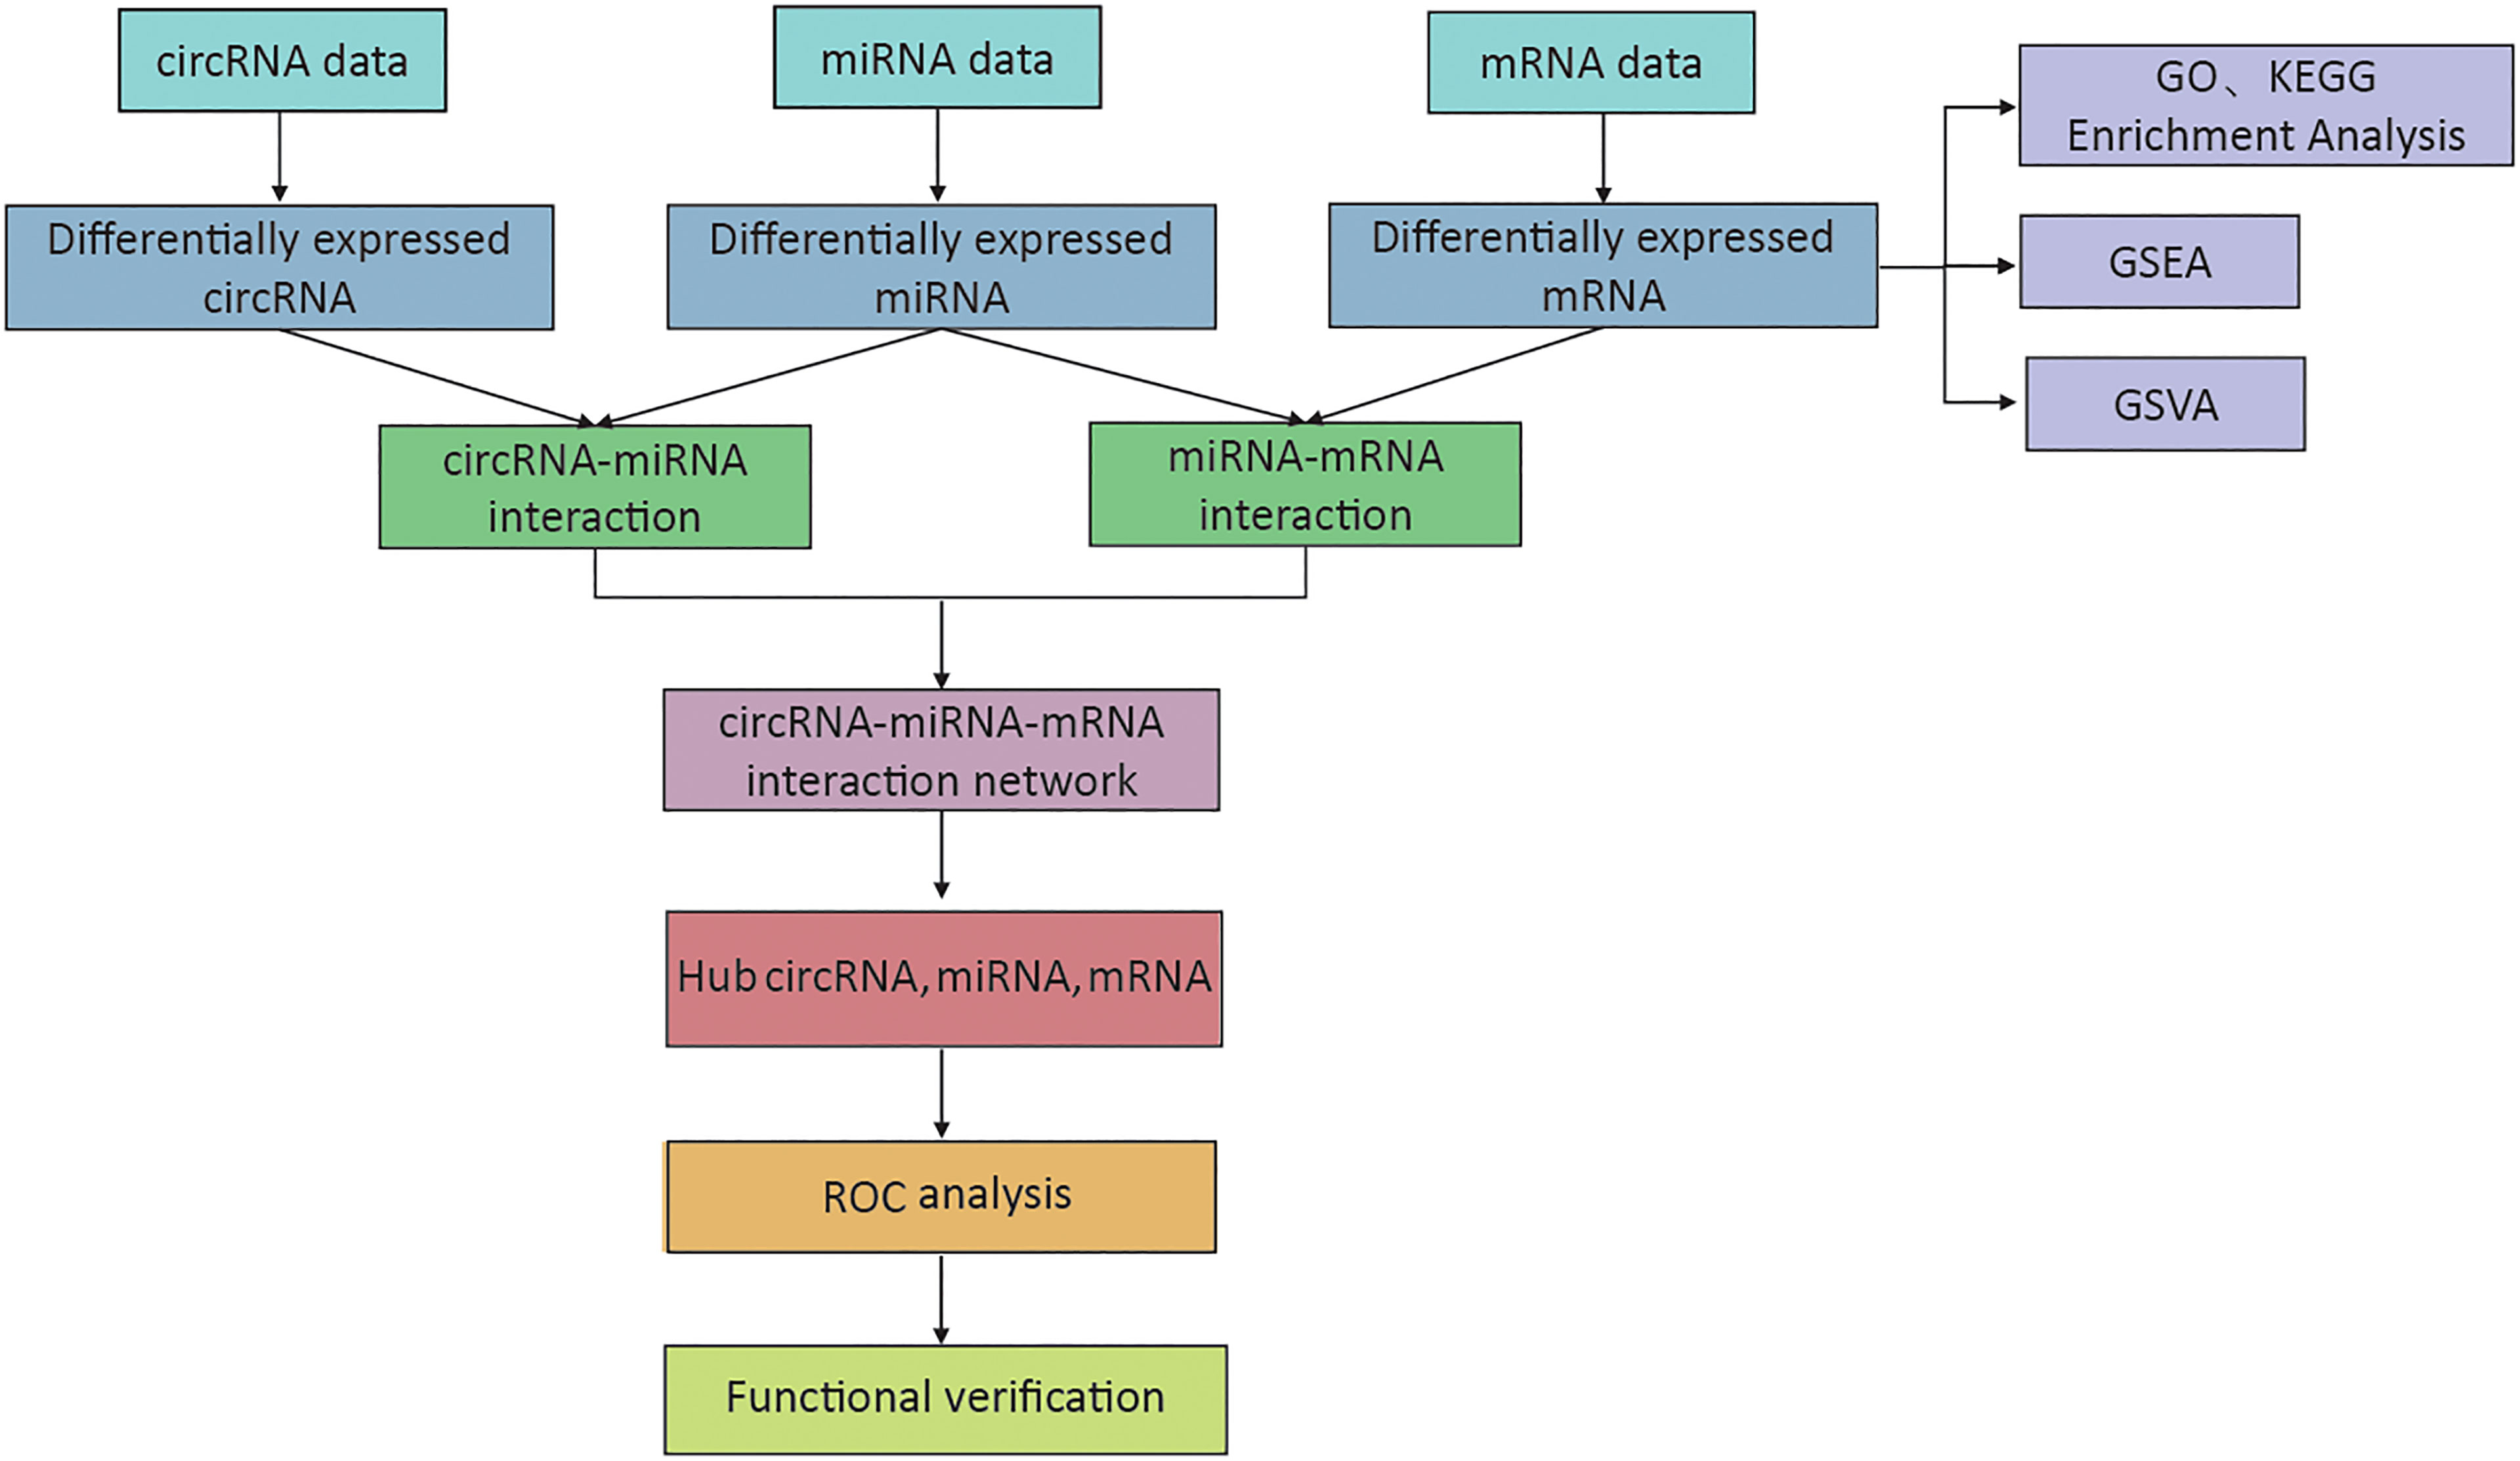
Figure 1 The flowchart of the whole research process.
Based on the predetermined threshold (|log2FC| > 1.0 and adjusted P < 0.05), 718 DEmRNAs were identified (241 upregulated and 477 downregulated) in GSE80187, 1,070 DEmRNAs (370 upregulated and 700 downregulated) in GSE143735, 52 DEmiRNAs (52 upregulated) in GSE68185, 37 DEmiRNAs (36 upregulated and one downregulated) in GSE84971, and 67 DEcircRNAs (32 upregulated and 35 downregulated) in GSE114248. Subsequently, the heatmap and volcano plot of DEmRNAs in GSE80187, DEmiRNAs in GSE68185, and DEcircRNAs in GSE114248 are shown in Figure 2. Meanwhile, DEmRNAs in GSE143735 and DEmiRNAs in GSE84971 are depicted in Figure 3.
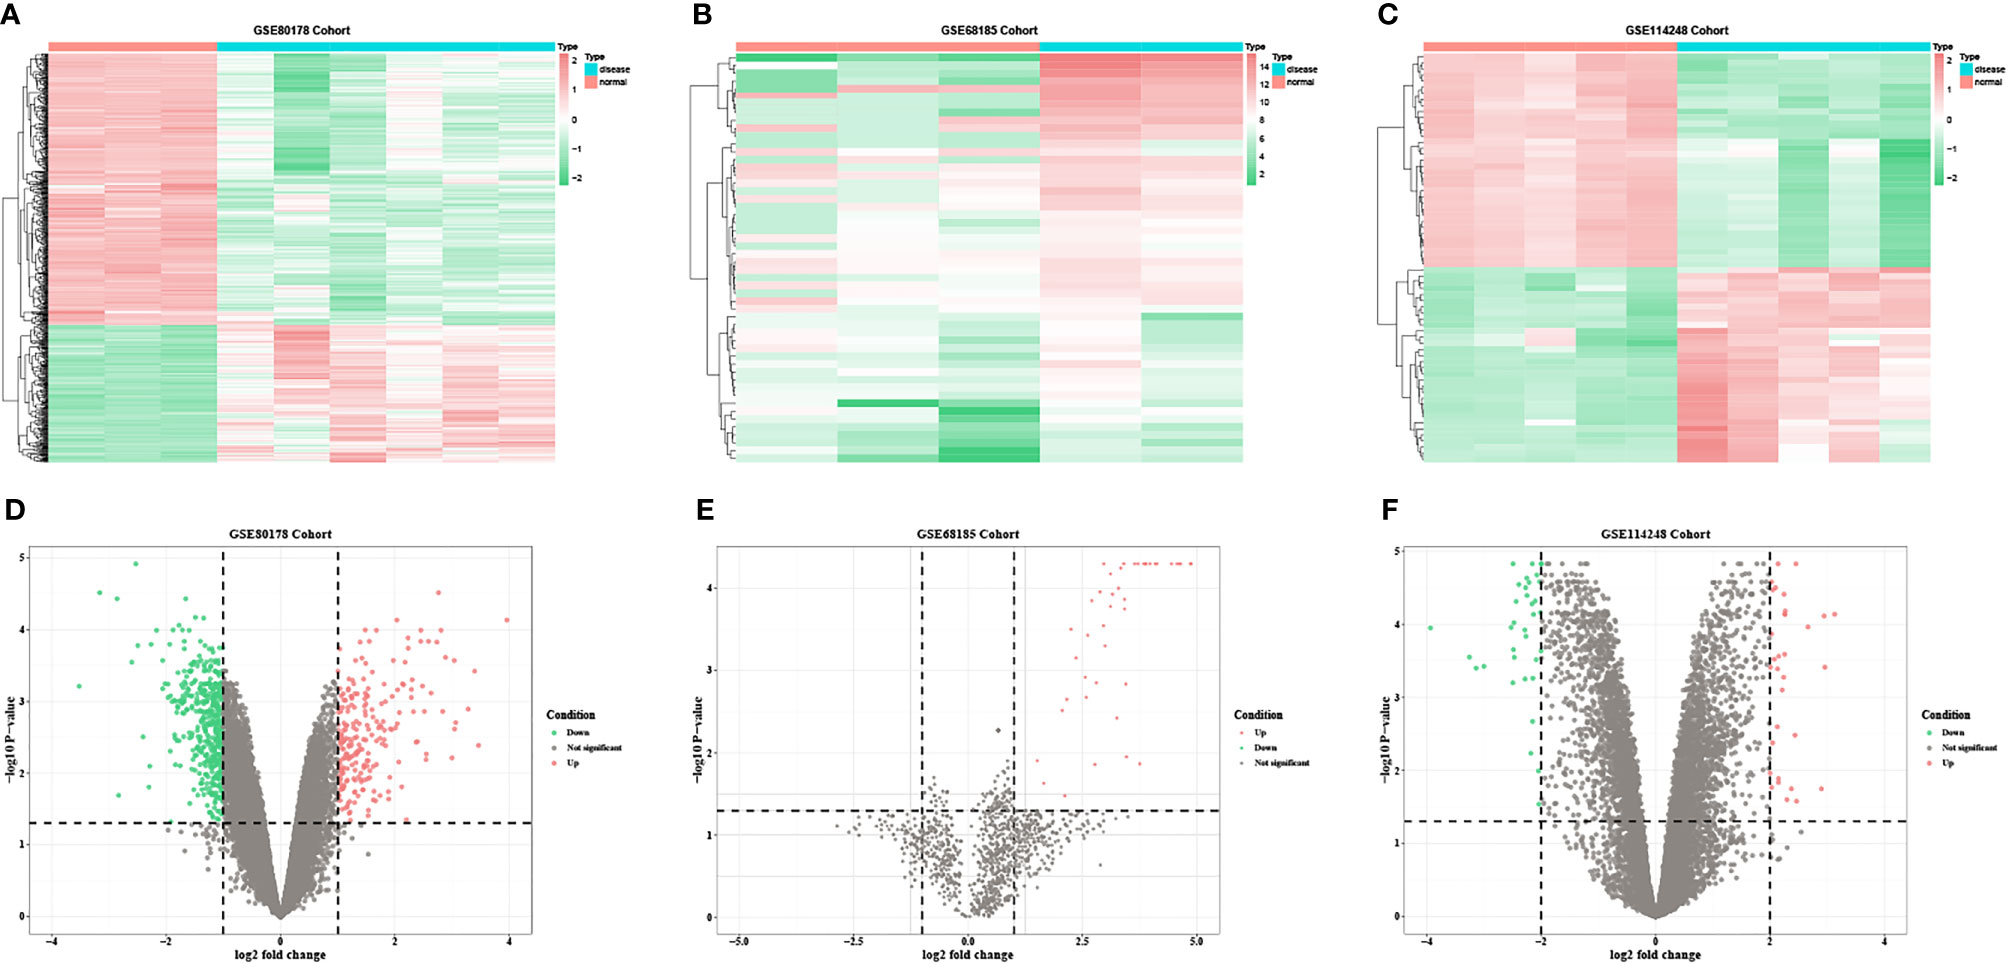
Figure 2 The heatmap and volcano plots of DEmRNAs in GSE80178, DEmiRNAs in GSE68185, and DEcircRNAs in GSE114248. (A) Heatmap of DEmRNAs in GSE80178. (B) Heatmap of DEmiRNAs in GSE68185. (C) Heatmap of DEcircRNAs in GSE114248. (D) Volcano plot of DEmRNAs in GSE80178. (E) Volcano plot of DEmiRNAs in GSE68185. (F) Volcano plot of DEcircRNAs in GSE114248. Data points in red and green represent upregulated and downregulated, respectively.
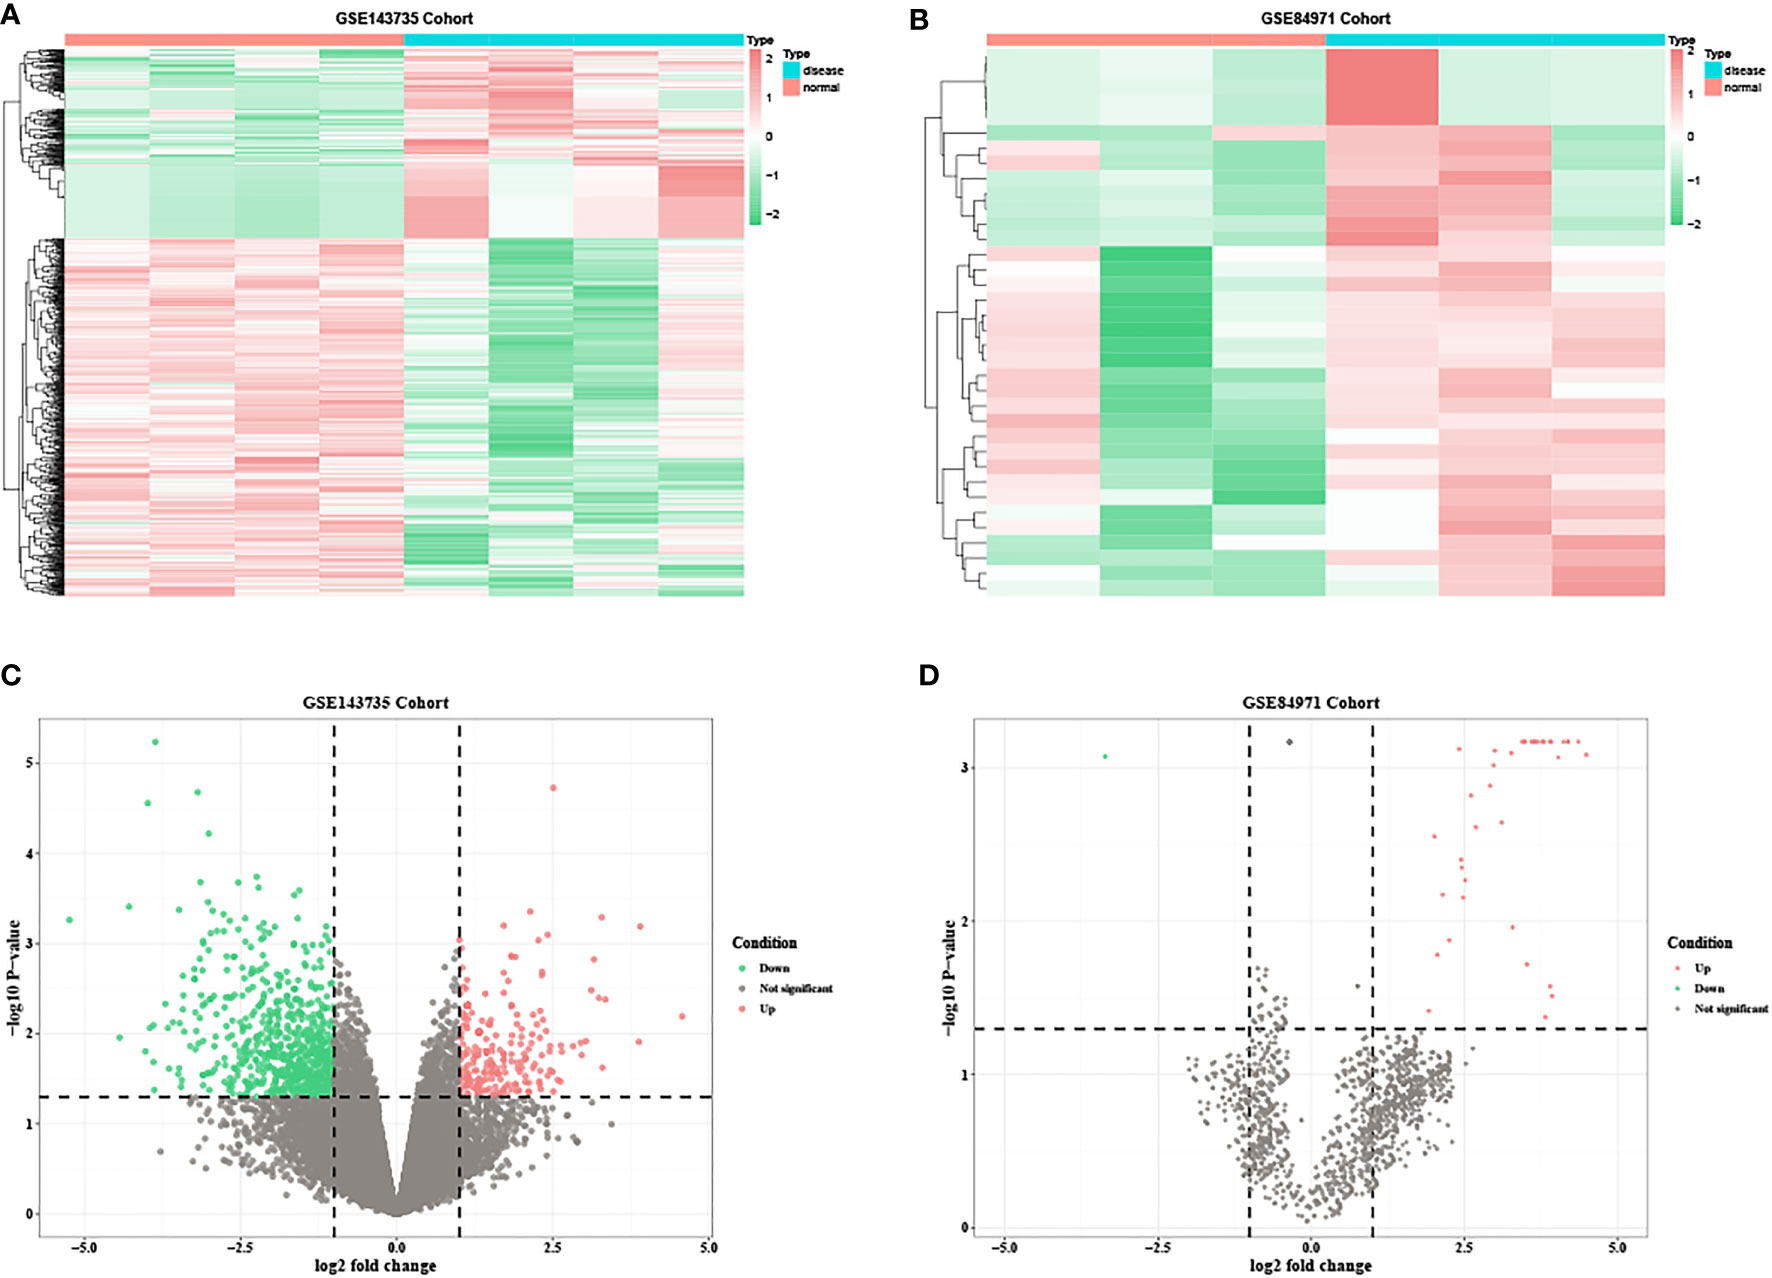
Figure 3 The heatmap and volcano plots of DEmRNAs in GSE143735 and DEmiRNAs in GSE84971. (A) Heatmap of DEmRNAs in GSE143735. (B) Heatmap of DEmiRNAs in GSE84971. (C) Volcano plot of DEmRNAs in GSE143735. (D) Volcano plot of DEmiRNAs in GSE84971.
Based on the DAVID database, GO enrichment analysis revealed the top 21 enriched GO terms of the DEmRNAs in GSE80178 (Supplementary Table 2). In BP, DEmRNAs were significantly enriched in skin development, keratinocyte differentiation, cornification, epidermis development, and epidermal cell differentiation. MF also possessed some related enriched terms such as extracellular matrix structural constituent and conferring compression resistance. In CC, DEmRNAs were mainly enriched in the cornified envelope and extracellular matrix (Figure 4A). KEGG pathway analysis indicated that DEmRNAs were primarily enriched in the interleukin-17 (IL-17) signaling pathway, herpes simplex virus-1 infection, Staphylococcus aureus infection, peroxisome proliferator-activated receptor (PPAR) signaling pathway, and arachidonic acid metabolism (Figure 4B and Supplementary Table 3).
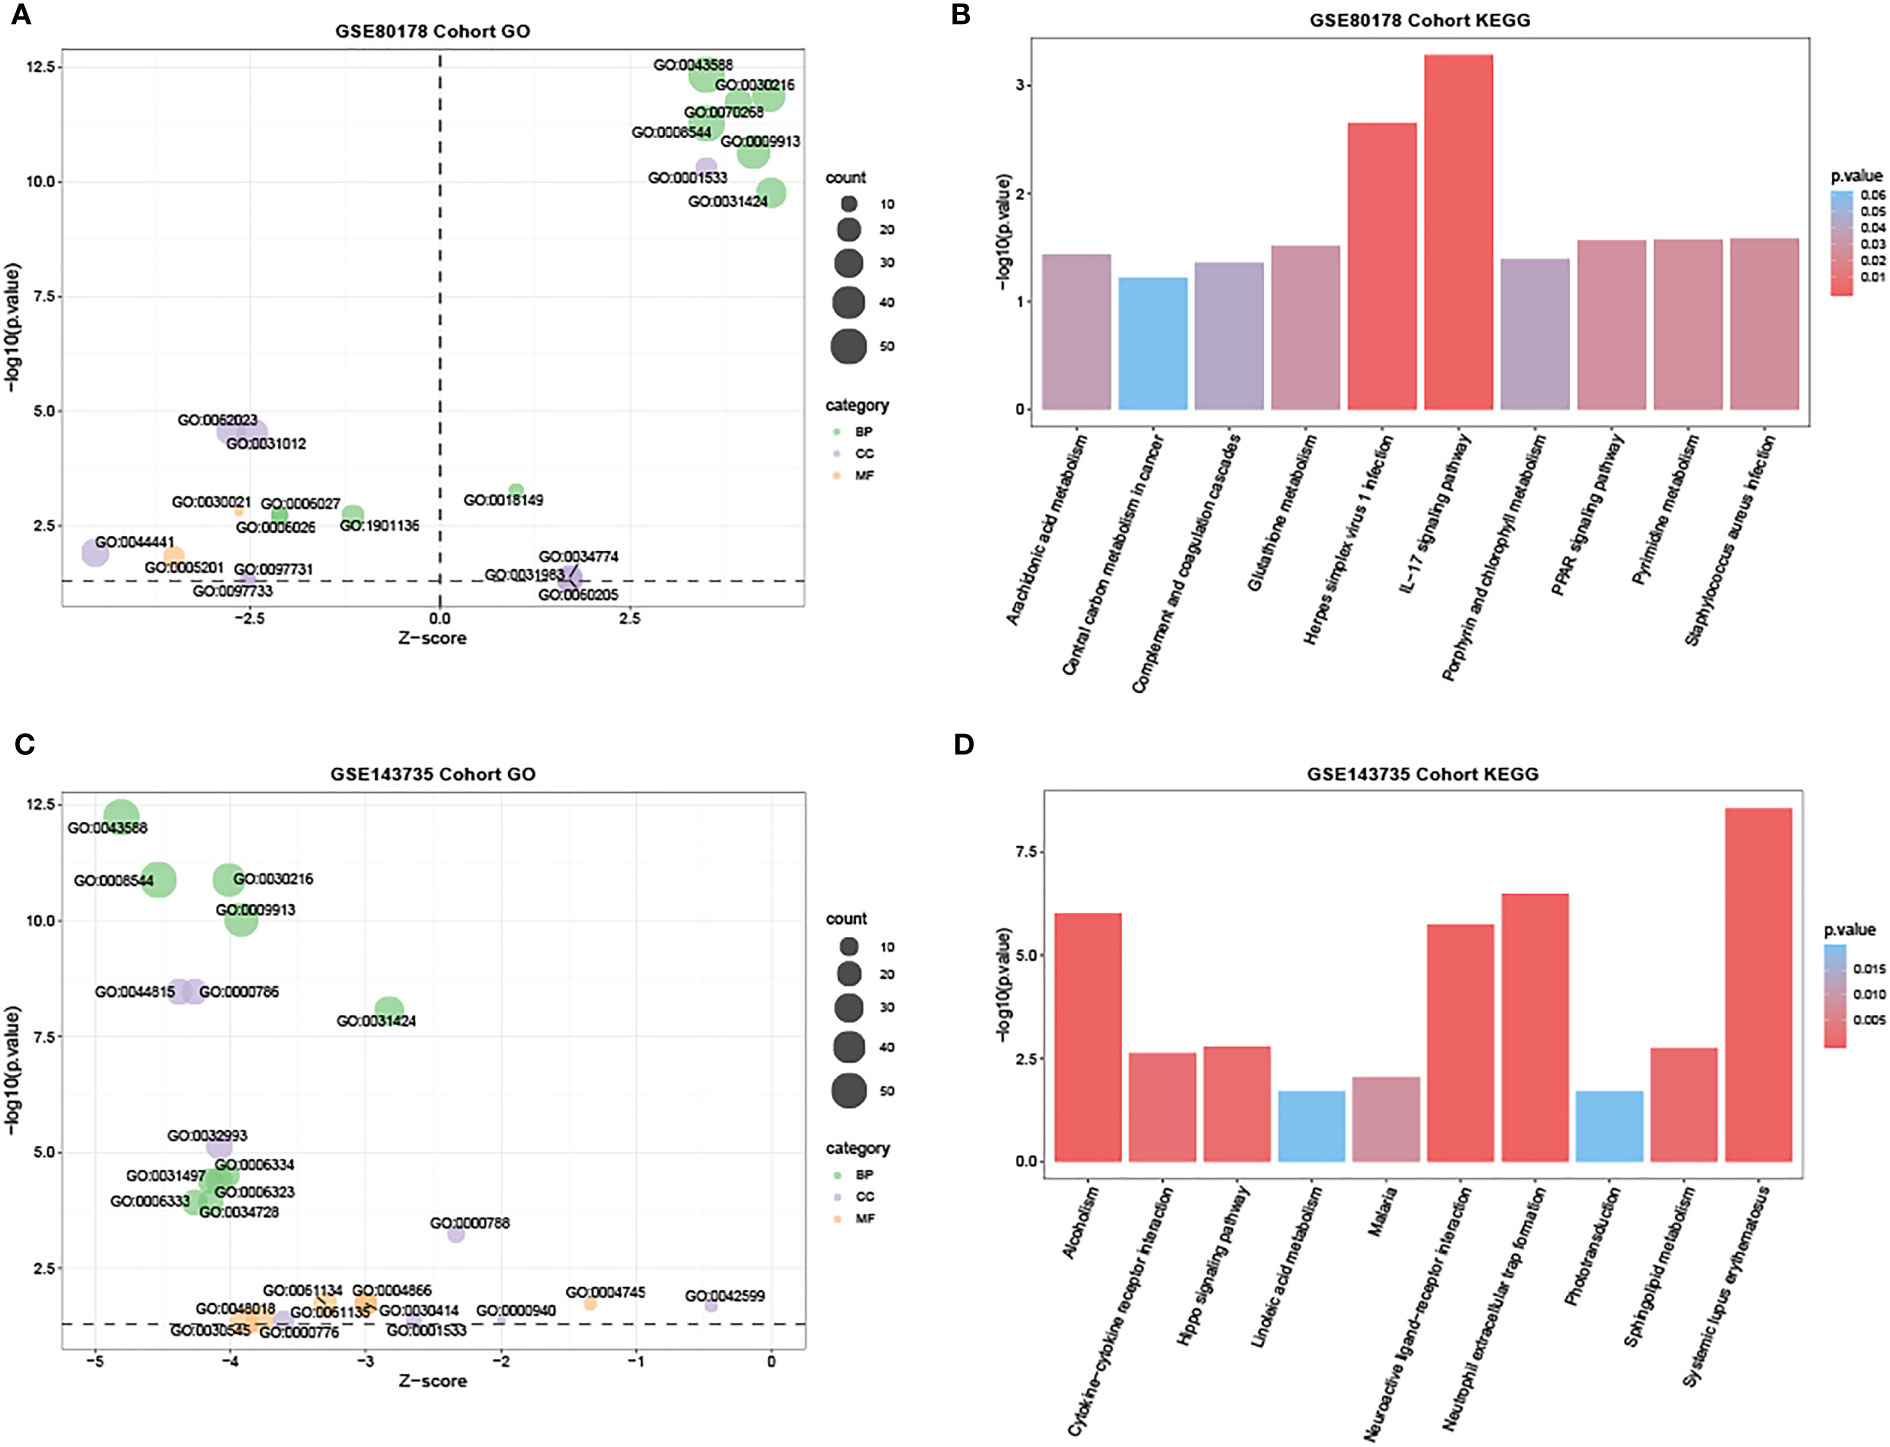
Figure 4 GO and KEGG functional enrichment analysis in GSE80178 and GSE143735. (A) The bubble chart of the GO terms, including BP, MF, and CC, was significantly enriched in GSE80178. Green bubbles represent BP; purple bubbles represent MF; orange bubbles represent CC. (B) Histogram of the top 10 KEGG pathway enrichment in GSE80178. (C) Bubble chart of the GO terms, including BP, MF, and CC, was significantly enriched in GSE143735. The green bubble represents BP; the purple bubble represents MF; the orange bubble represents CC. (D) Histogram of the top 10 KEGG pathway enrichment in GSE143735.
Meanwhile, in GSE143735, GO analysis enrichment revealed the top 25 enriched GO terms of the DEmRNAs (Supplementary Table 4). In BP, DEmRNAs were significantly enriched in skin and epidermis development and keratinocyte and epidermal cell differentiation. Specific enriched terms like activities of endopeptidase inhibitor, retinol dehydrogenase, endopeptidase regulator, and peptidase inhibitor were related to MF (Figure 4C). In CC, DEmRNAs were primarily enriched in DNA packaging, protein-DNA complexes, and nucleosome. KEGG pathway analysis revealed that DEmRNAs were mainly enriched in neutrophil extracellular trap formation, neuroactive ligand-receptor and cytokine-cytokine receptor interactions, and hippo signaling pathway (Figure 4D and Supplementary Table 5).
GSEA depicted that the most enriched gene sets in GSE80187 were positively correlated with BP, such as cell division, regulation of mitotic cell cycle and phase transition, and signaling pathways in herpes simplex virus-1 infection, nucleocytoplasmic transport, and RNA degradation (Figures 5A, C and Supplementary Table 6). Moreover, enriched gene sets were positively correlated with BP in GSE143735, such as cytokine production in immune response, positive regulation of smooth muscle cell proliferation, and signaling pathways in neuroactive ligand-receptor interaction, axon guidance, and viral carcinogenesis (Figures 5B, D and Supplementary Table 7).
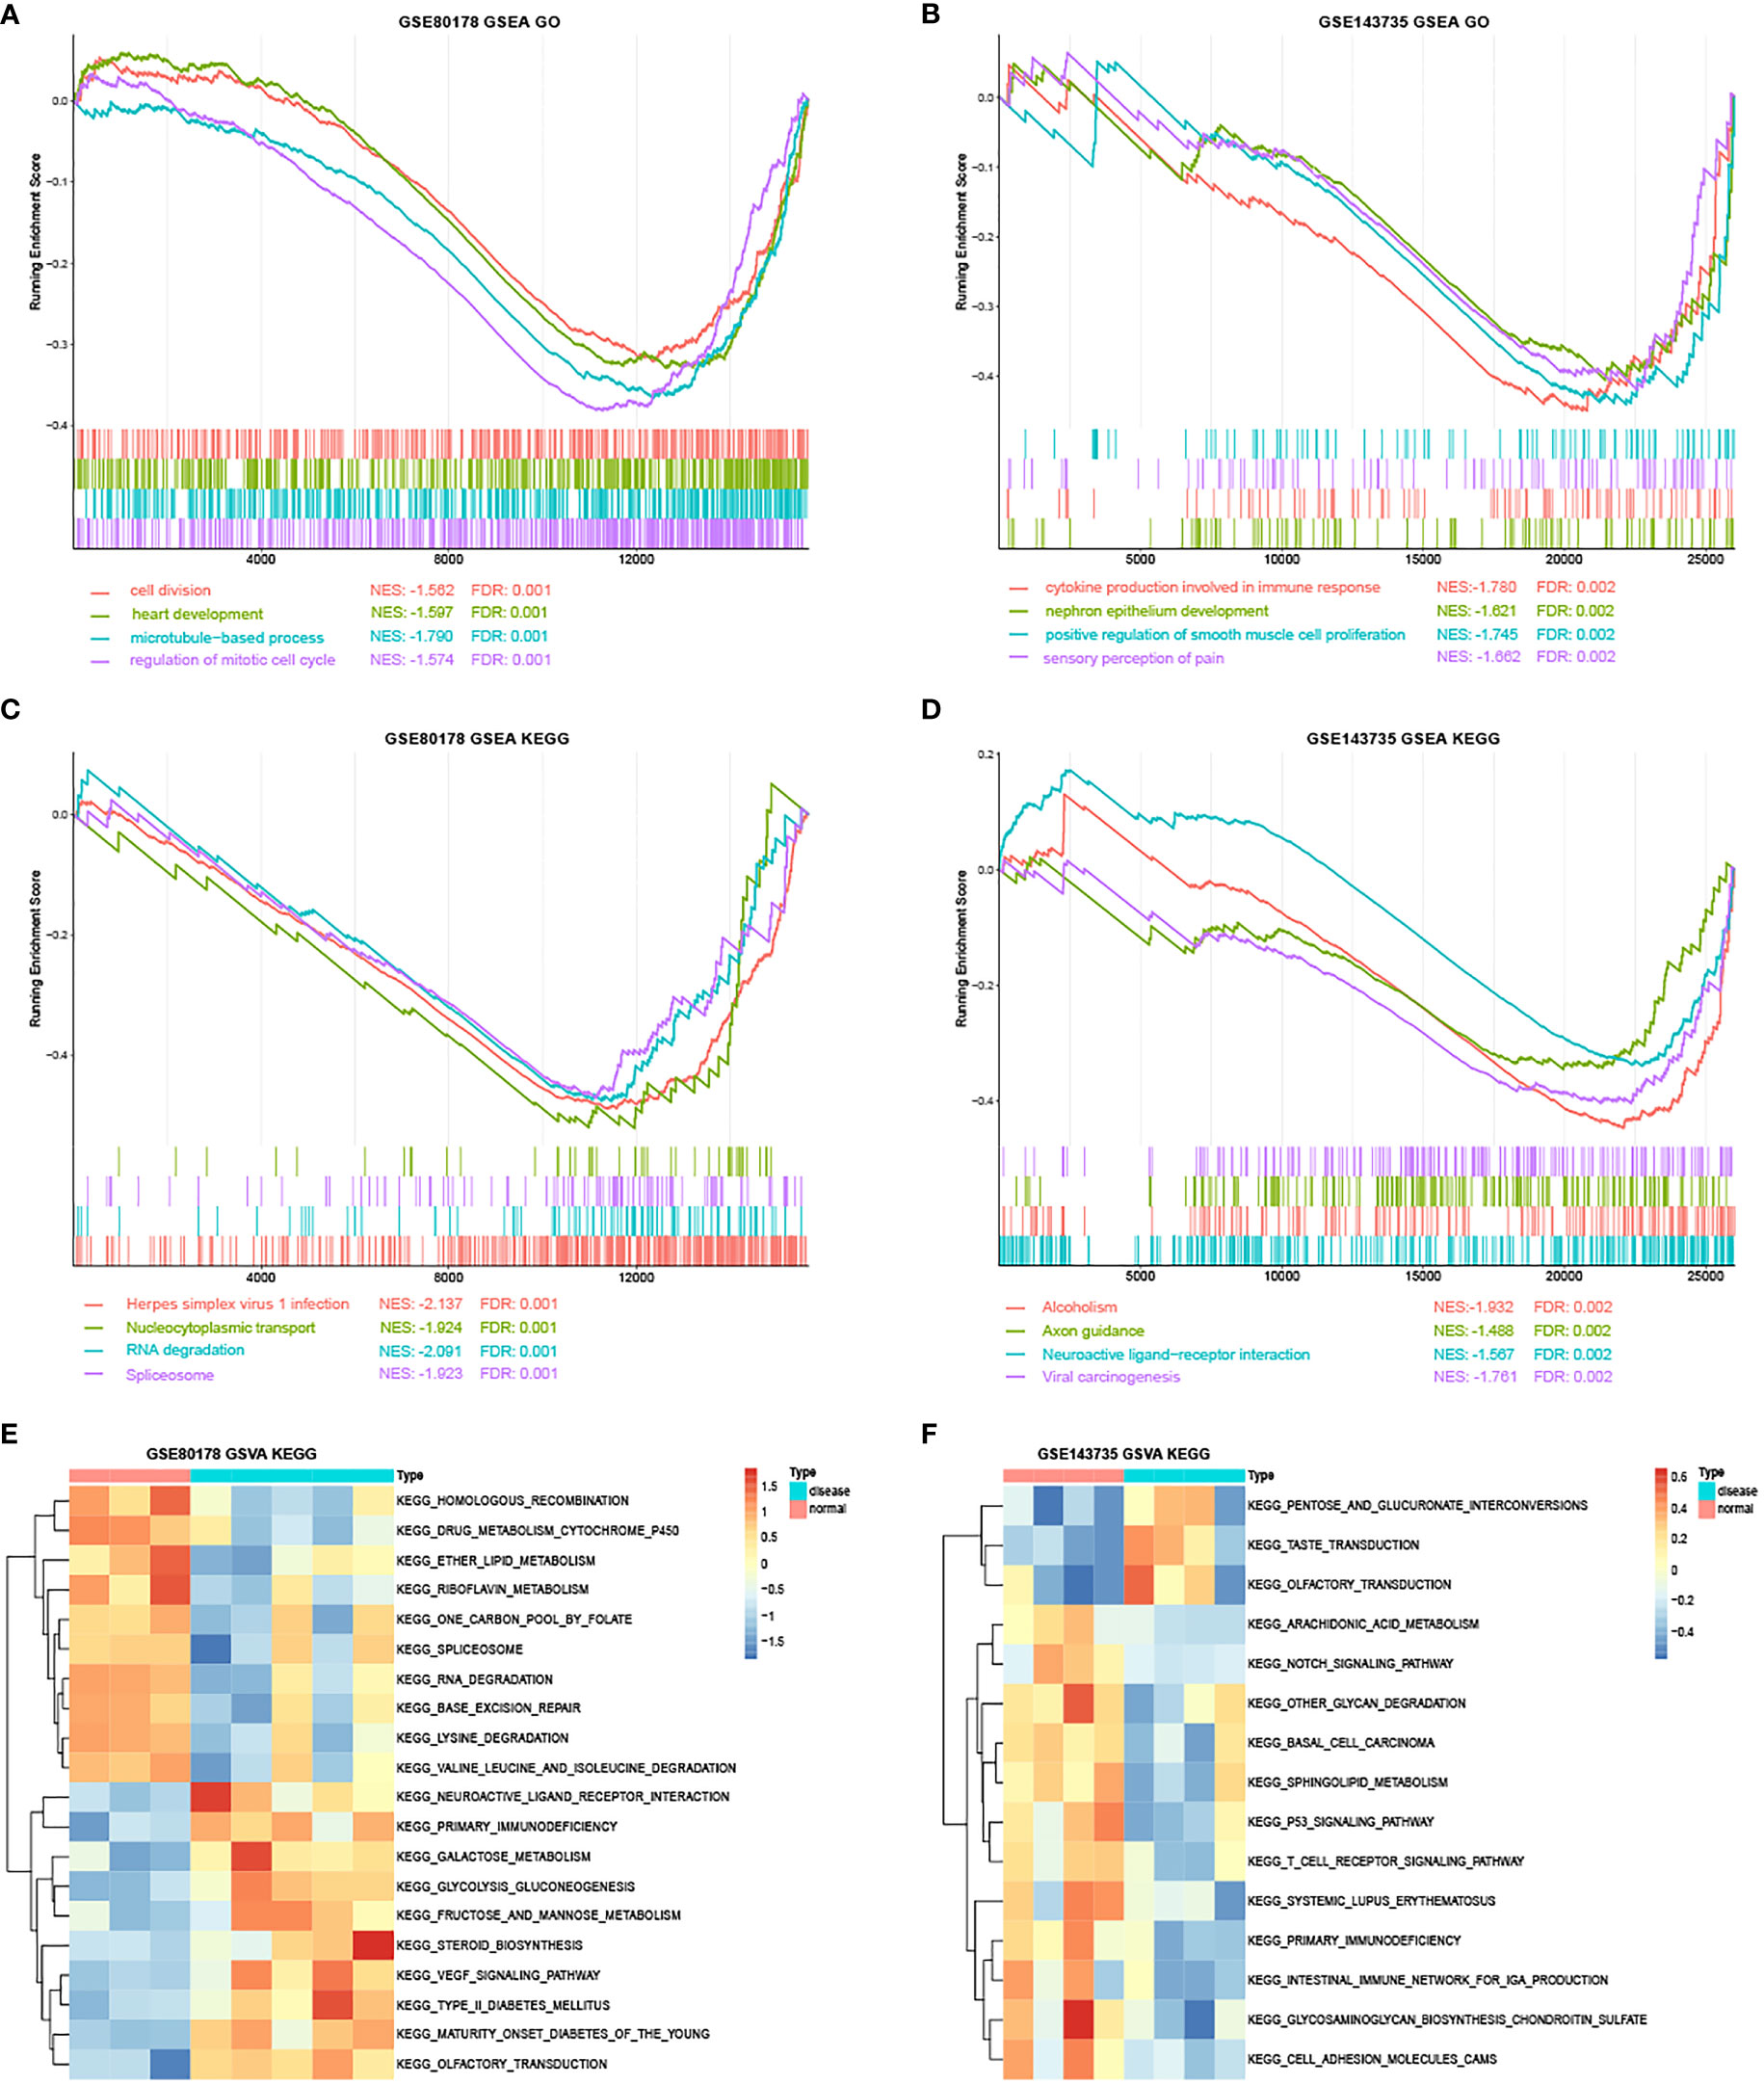
Figure 5 The GSEA and GSVA analysis in GSE80178 and GSE143735. (A) Top four GO annotations with a P-value in GSE80178 through GSEA analysis. (B) Top four GO annotations with a P-value in GSE143735 through GSEA analysis. (C) Top four KEGG pathway with a P-value in GSE80178 through GSEA analysis. (D) Top four KEGG pathway with a P-value in GSE143735 through GSEA analysis. (E) Top 20 KEGG pathway with a P-value in GSE80178 through GSVA analysis. (F) Top 20 KEGG pathway with a P-value in GSE143735 through GSVA analysis.
GSVA indicated that signaling pathways, such as RNA degradation, vascular endothelial growth factor (VEGF), homologous recombination, glycosaminoglycan biosynthesizes chondroitin sulfate, and T-cell receptors were significantly more enriched in DFU samples than standard samples (Figures 5E, F and Supplementary Tables 8, 9).
A total of 43 common DEGs from GSE80187 and GSE143735 (Figure 6A) and 19 common DEMs from GSE68185 and GSE84971 were screened (Figure 6B). First, based on the miRWalk and starBase databases, 10 overlapping DEGs were screened, including EREG, JUNB, OASL, FGFBP1, BLMH, USP2, CDON, AMPD3, CNTNAP3, and GATA3 (Figure 6C). Then, the ideogram function was used to draw the location of 10 overlapping DEGs, 19 overlapping DEMs, and 67 overlapping DECs on the chromosomes (Figure 7) (26).
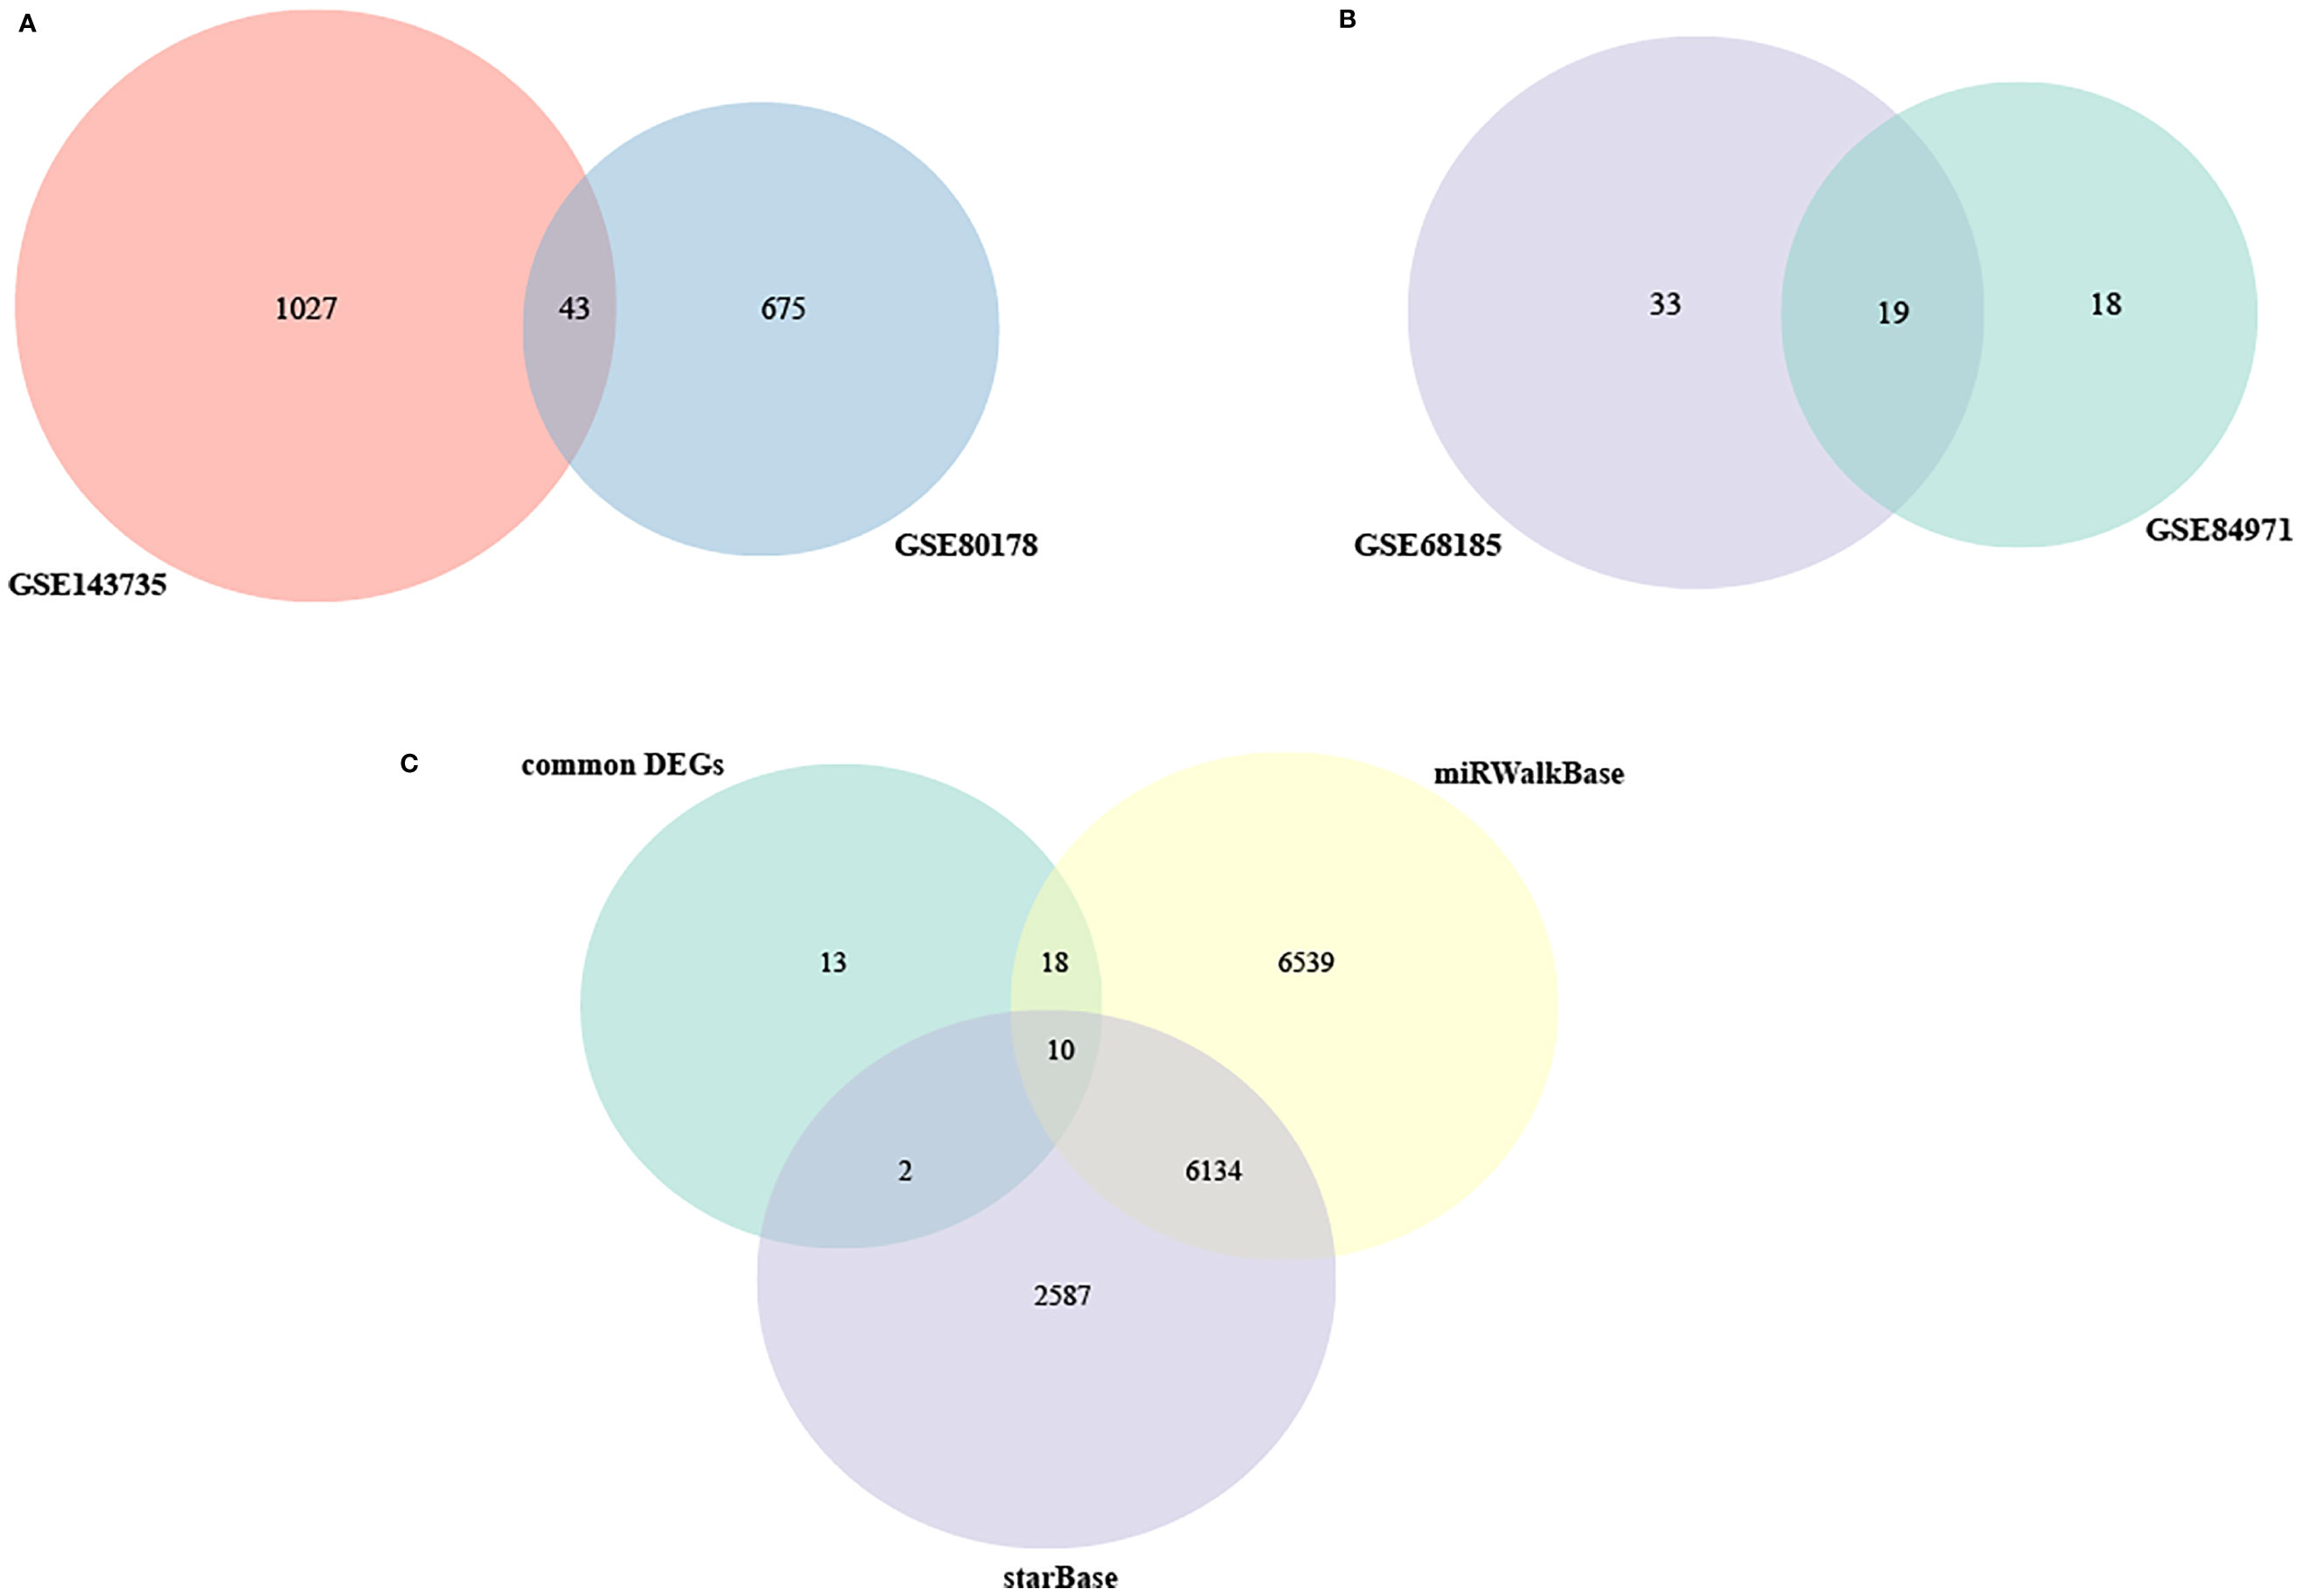
Figure 6 The Venn diagram of DEGs and DEMs. (A) Venn diagram of DEGs in GSE80178 and GSE143735. (B) Venn diagram of DEMs in GSE68185 and GSE84971. (C) Venn diagram of DEMs in GSE80178, GSE143735, and GSE84971.
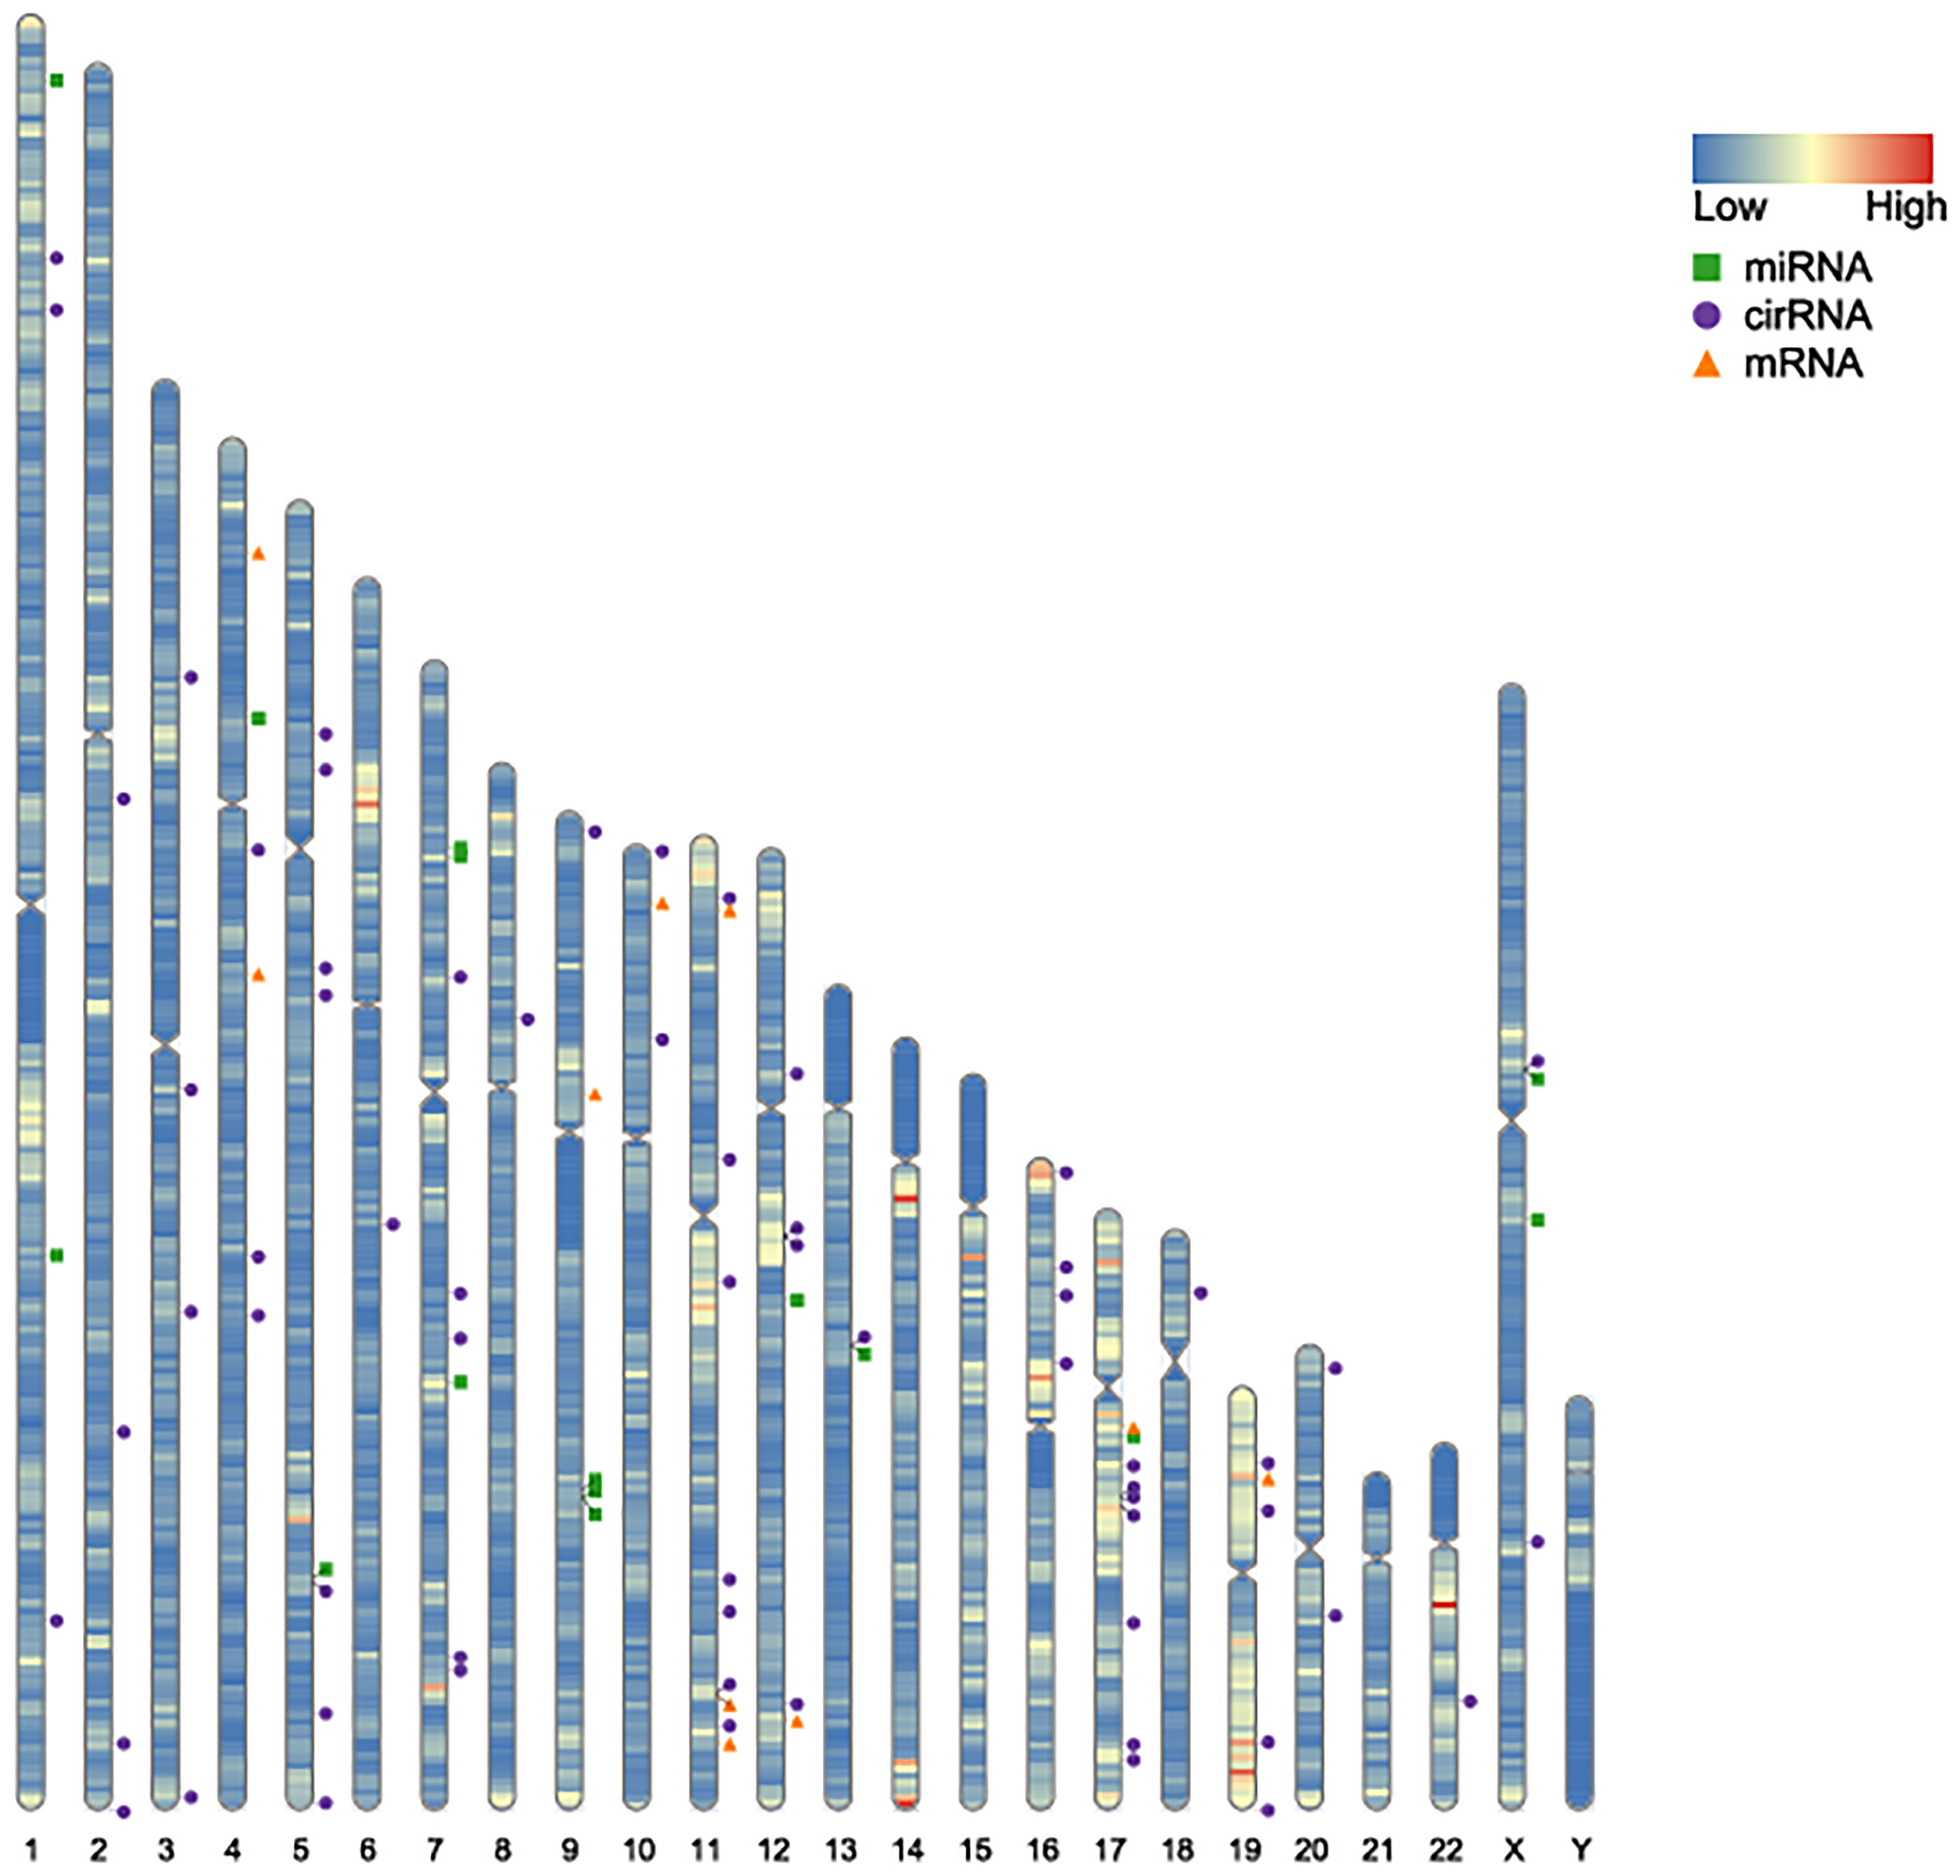
Figure 7 Location on the chromosomes of DEGs, DEMs, and DECs. The orange triangle represents the chromosomal location of DEGs in GSE80178 and GSE143735. The green block represents the chromosomal location of DEMs in GSE68185 and GSE84971. The blue spot represents the chromosomal location of DECs in GSE114248.
Next, the circRNA-miRNA-mRNA network (Figure 8A) was constructed according to the Sankey diagram (Figure 8B). It was found that circRNA mainly corresponded to hsa-miR-24–3p and hsa-miR-214–3p, and miRNA was specifical compared to JUNB and BLMH. Then, a significant circRNA-miRNA-mRNA network was constructed (Figure 8C); meanwhile, the PPI network of DEGs was visualized in GSE80178 and GSE143735 and screened by the STRING database (Figure 8D).
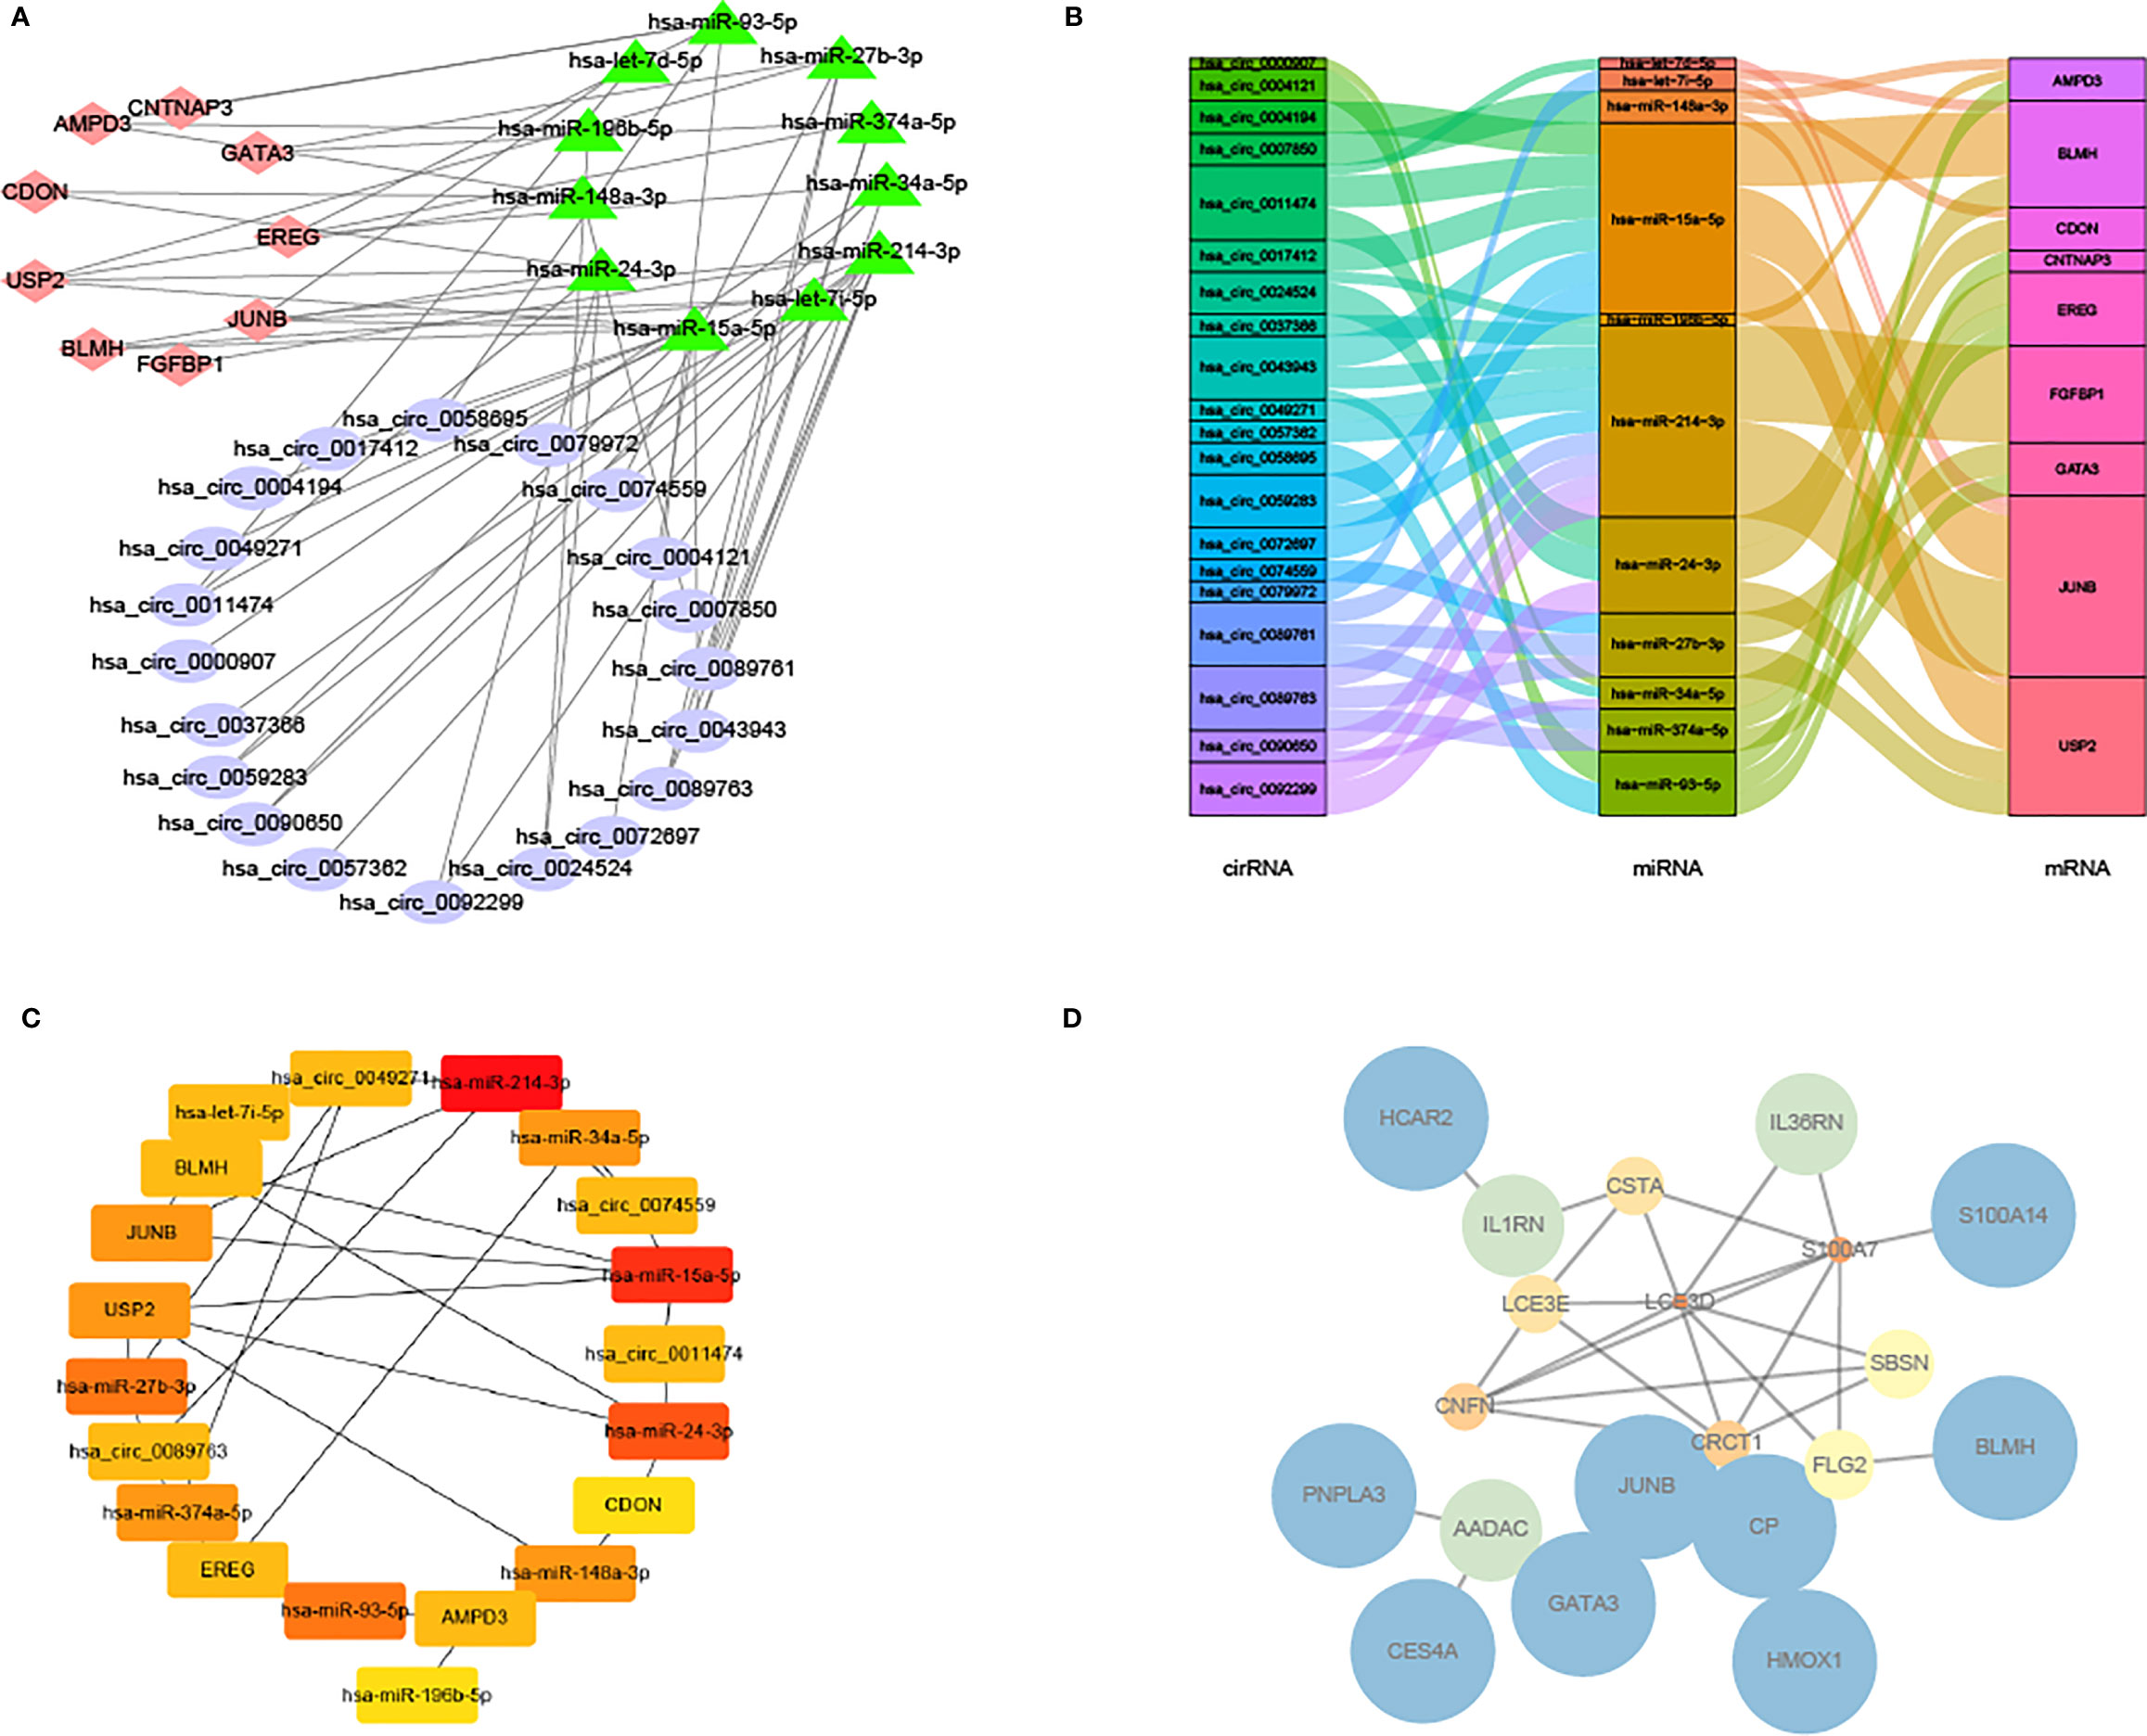
Figure 8 Network and PPI network of circRNA-miRNA-mRNA. (A) Network of circRNA-miRNA-mRNA. (B) Sankey diagram of the relationship between circRNA-miRNA-mRNA. (C) Network of significant circRNA-miRNA-mRNA. (D) PPI network of DEGs in GSE80178 and GSE143735.
ROC analysis evaluated the accuracy of crucial molecules in distinguishing whether a sample is DFU or regular by calculating AUC. The diagnostic criteria of DFU are referenced in the previous study (27). It was observed that circRNA, like hsa-circ-0049271 and hsa-circ-0074559; miRNAs, such as hsa-let-7i-5p, hsa-miR-24–3p, and hsa-miR-214–3p; and genes, including BLMH and EREG, had the classification predicting values (Figures 9A–I).
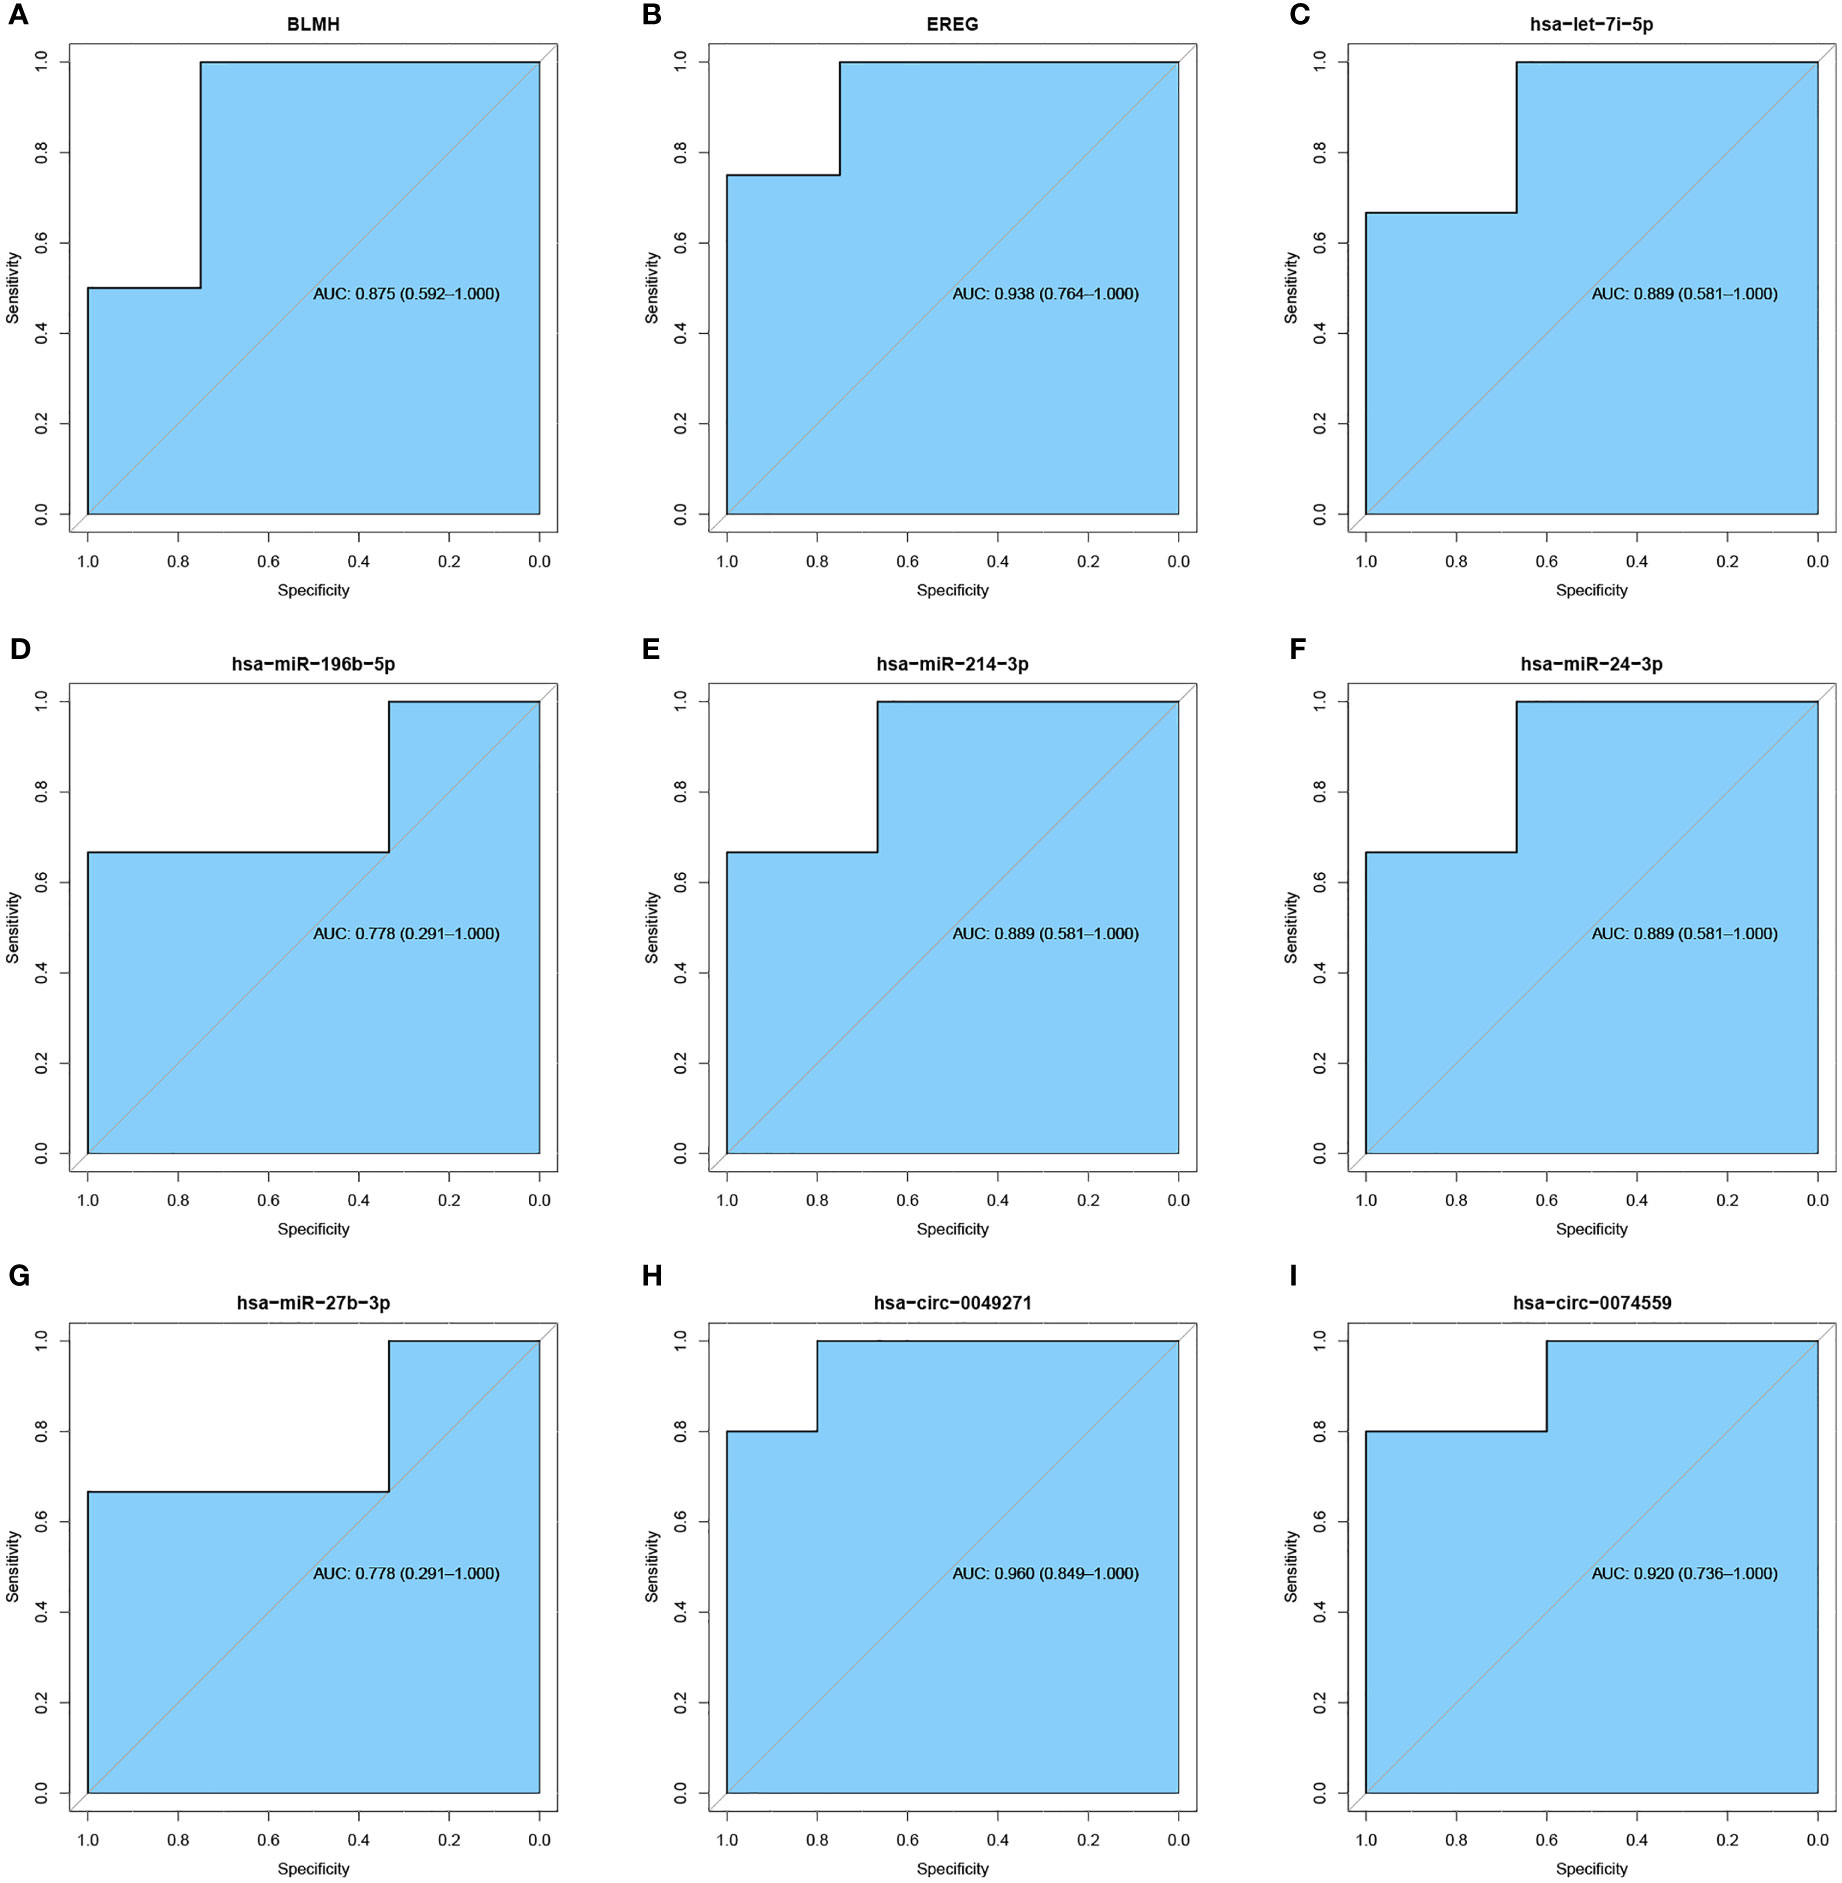
Figure 9 ROC curve of significant mRNA, miRNA, and circRNA. (A, B) ROC curve of significant mRNA. (C–G) ROC curve of significant miRNA. (H, I) ROC curve of significant circRNA. The blue areas represent AUC.
Using CIBERSORT, the ratio of 22 immune cells between standard and DFU samples was estimated (Figure 10A). In GSE80178, the proportions of immune cells are individual and have group difference; and the balance of T cells was higher in DFU samples, whereas macrophages were higher in standard samples (Figure 10B).
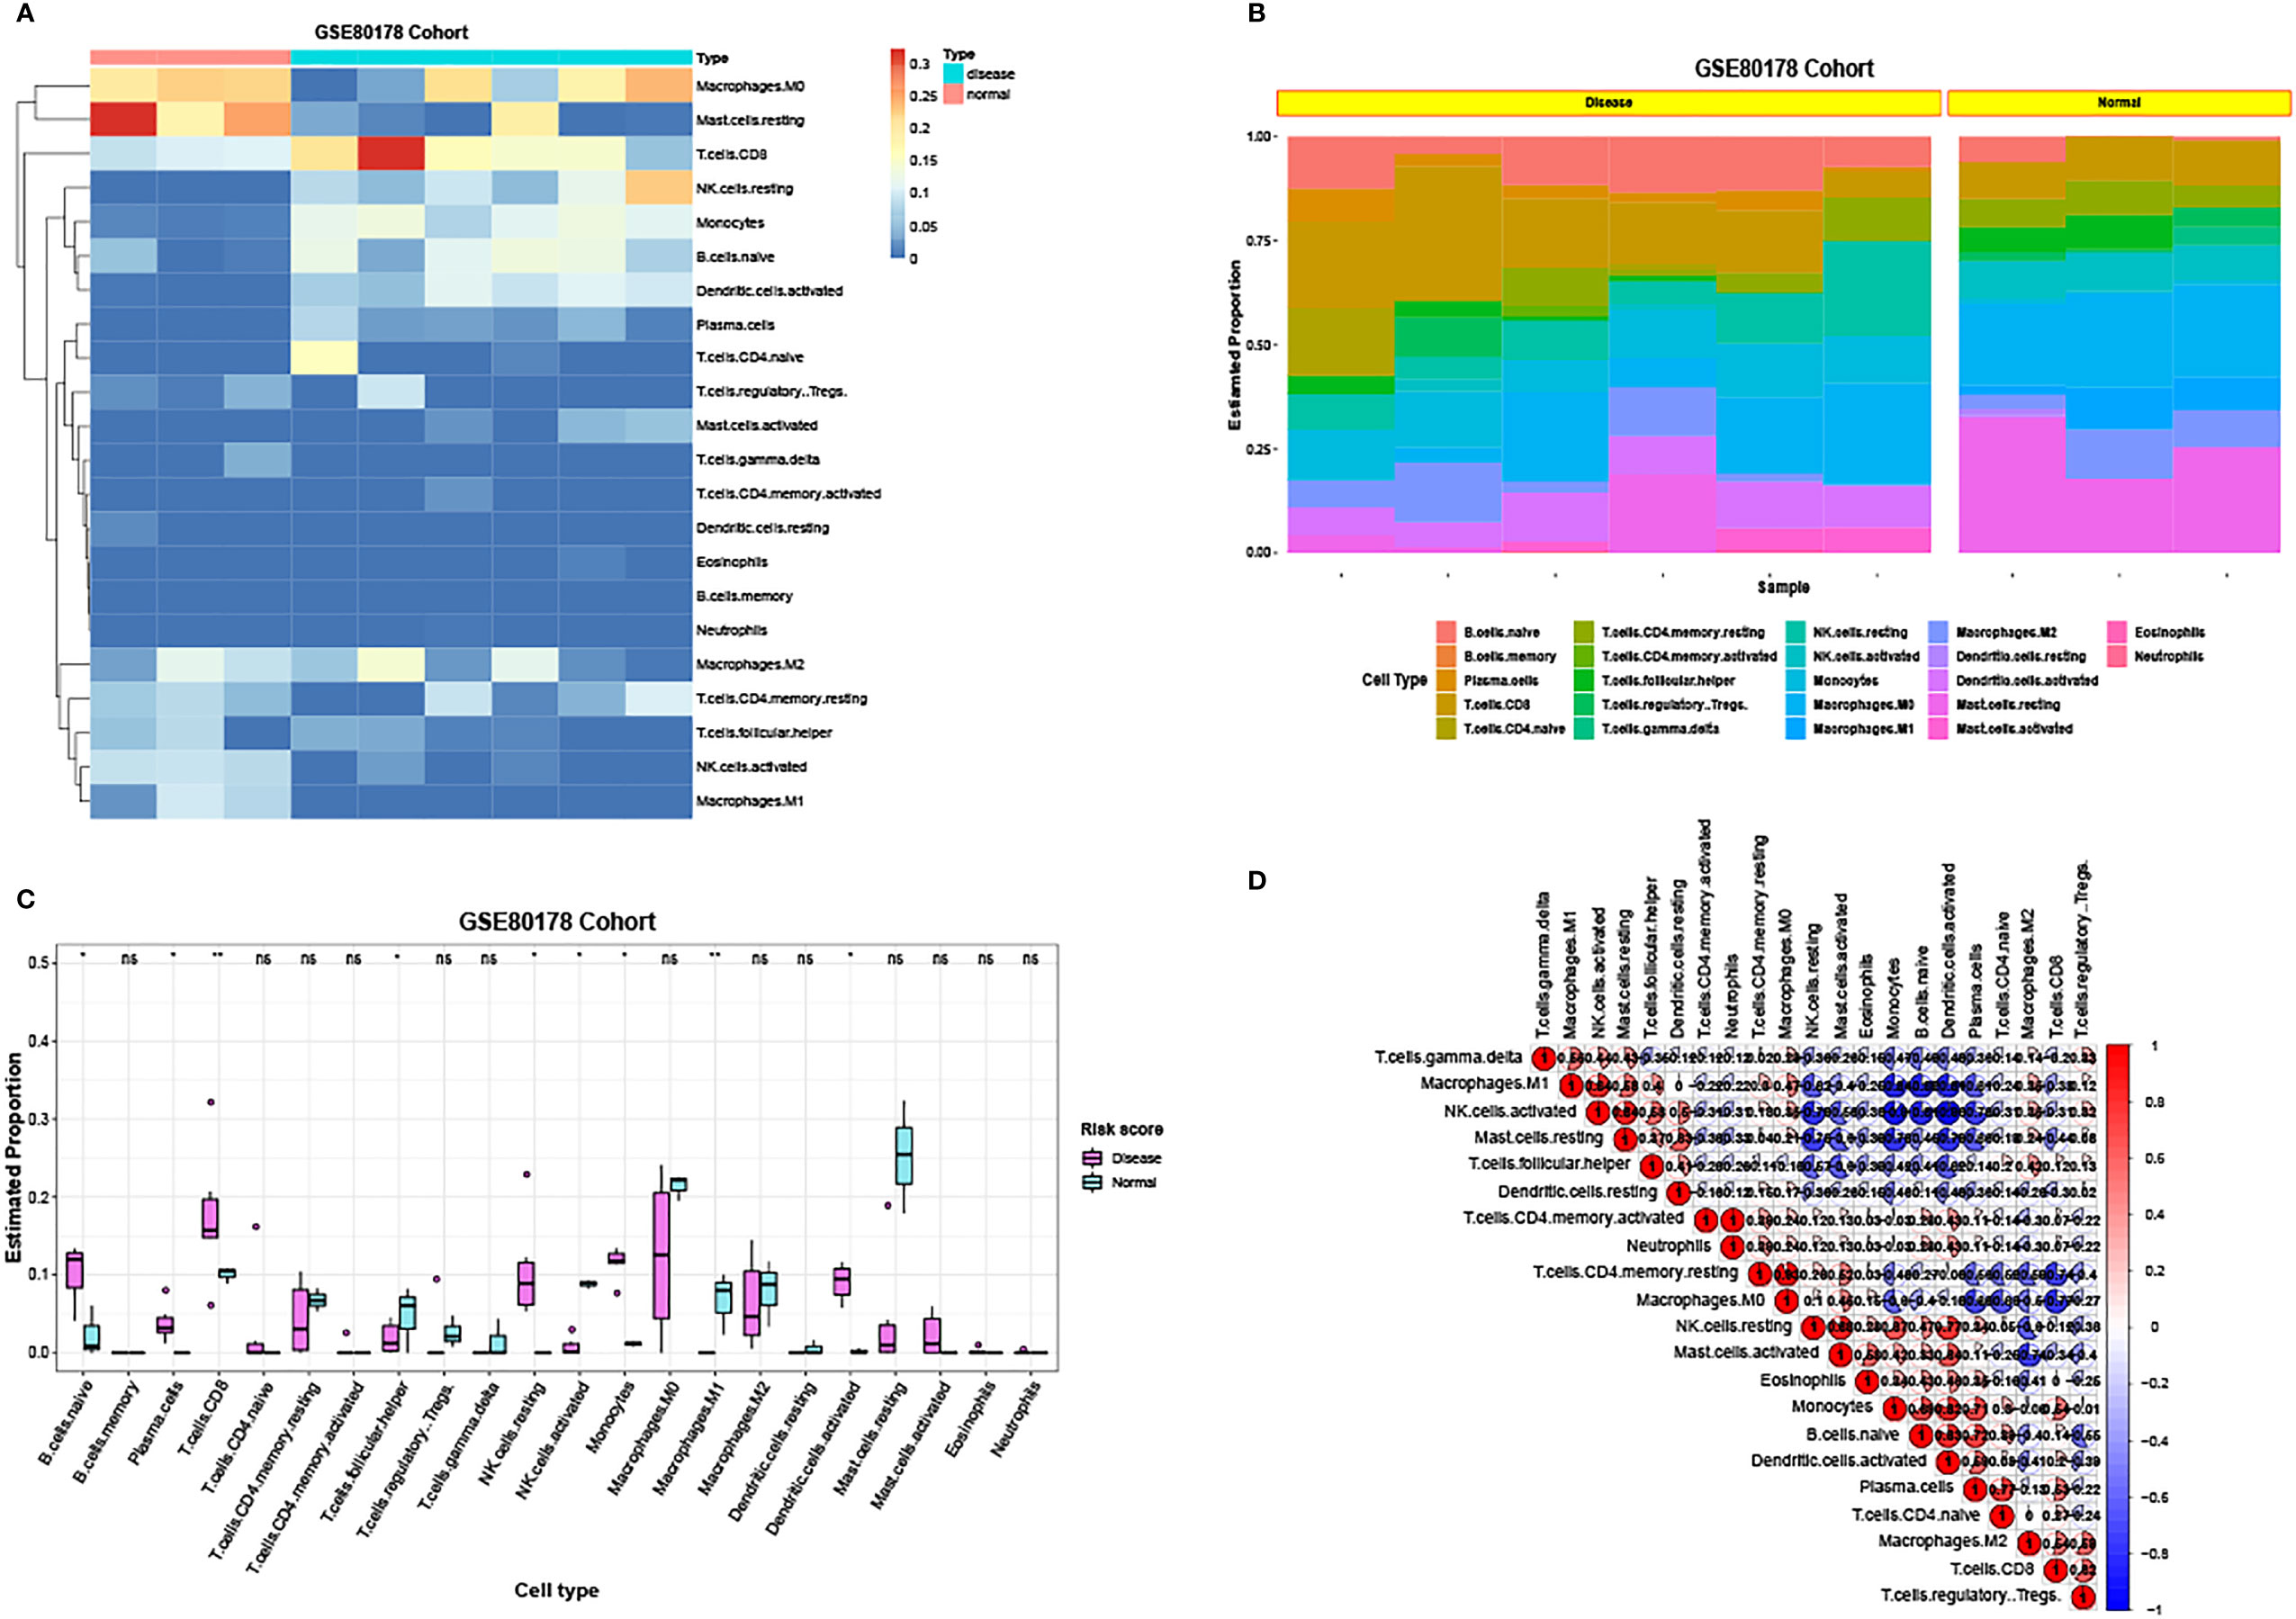
Figure 10 The ratio of immune cells between standard samples and DFU samples. (A) Heatmap of the ratio of 22 immune cells between standard and DFU samples in GSE80178. (B) Histogram of the ratio of 22 immune cells between standard and DFU samples in GSE80178. (C) Box diagram of the ratio of 22 immune cells between standard and DFU samples in GSE80178. (D) Correlation of 22 immune cells in GSE80178.
Then, the proportion of these immune cells between standard and DFU samples was compared. The abundance of B.cells.naïve, Plasma.cells, T.cells.CD8, Macrophages.M1, T.cells.follicular.helper, NK.cells.resting, NK.cells.activated, Dendritic.cells.activated, and monocytes showed a significant statistical difference (Figure 10C). Next, the correlation of the 22 immune cells was visualized (Figure 10D).
Obvious studies have demonstrated that IL-6 seems to be an inflammatory marker in the discrimination of infected DFU (28, 29). Through a Pearson’s analysis, it was observed that the proportion of T.cells.CD8 and monocytes were positively correlated with the expression of IL-6, whereas T.cells.CD4.memory.resting and NK.cells.resting were negatively correlated with IL-6 expression (Figures 11A–J).
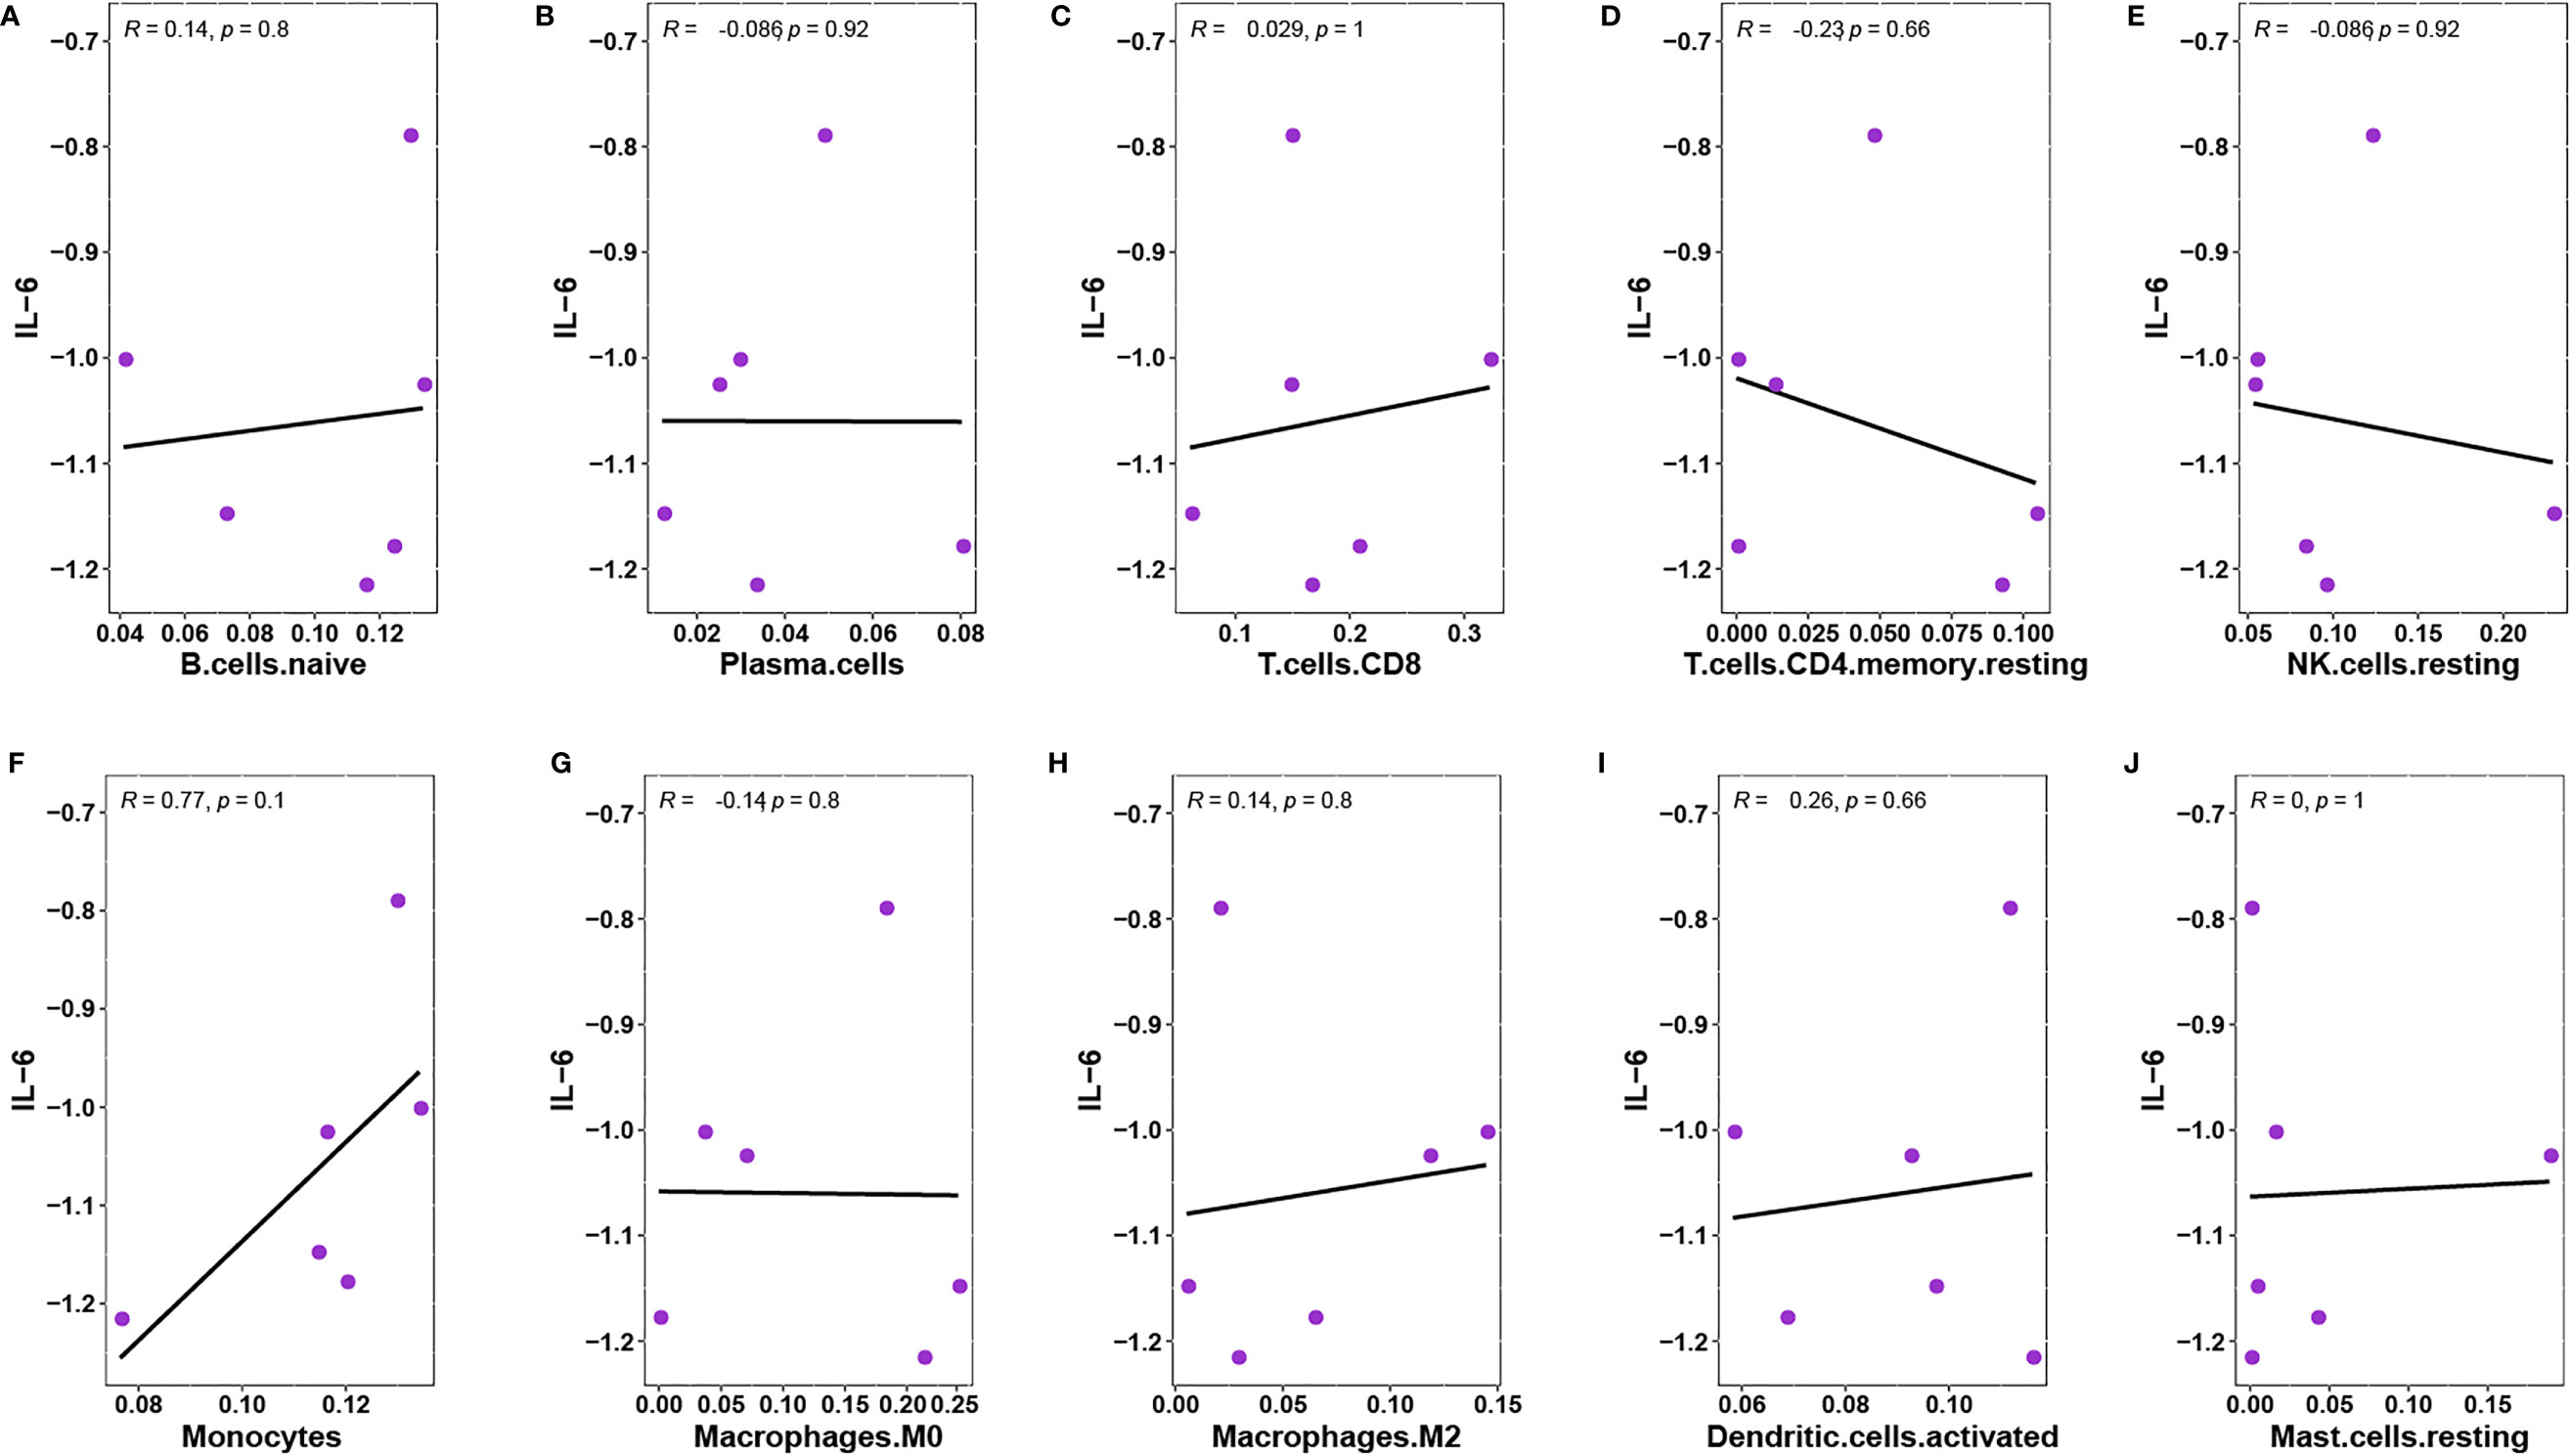
Figure 11 (A) Pearson’s correlation between IL-6 and B.cells.naive. (B) Pearson’s correlation between IL-6 and Plasma.cells. (C) Pearson’s correlation between IL-6 and T.cells.CD8. (D) Pearson’s correlation between IL-6 and T.cells.CD4.memory.resting. (E) Pearson’s correlation between IL-6 and NK.cells.resting. (F)Pearson’s correlation between IL-6 and Monocytes. (G) Pearson’s correlation between IL-6 and Macrophages.M0. (H) Pearson’s correlation between IL-6 and Macrophages.M2. (I) Pearson’s correlation between IL-6 and Dendritic.cells.activated. (J) Pearson’s correlation between IL-6 and Mast.cells.resting.
The miRNA corresponding to the common DEGs was predicted and the mRNA-miRNA network based on the starBase databases was constructed (Figure 12A). Then, the drugs targeted by overlapping miRNA were retrieved and the gene-drug network based on the Comparative Toxicogenomics Database database was created (Figure 12B).
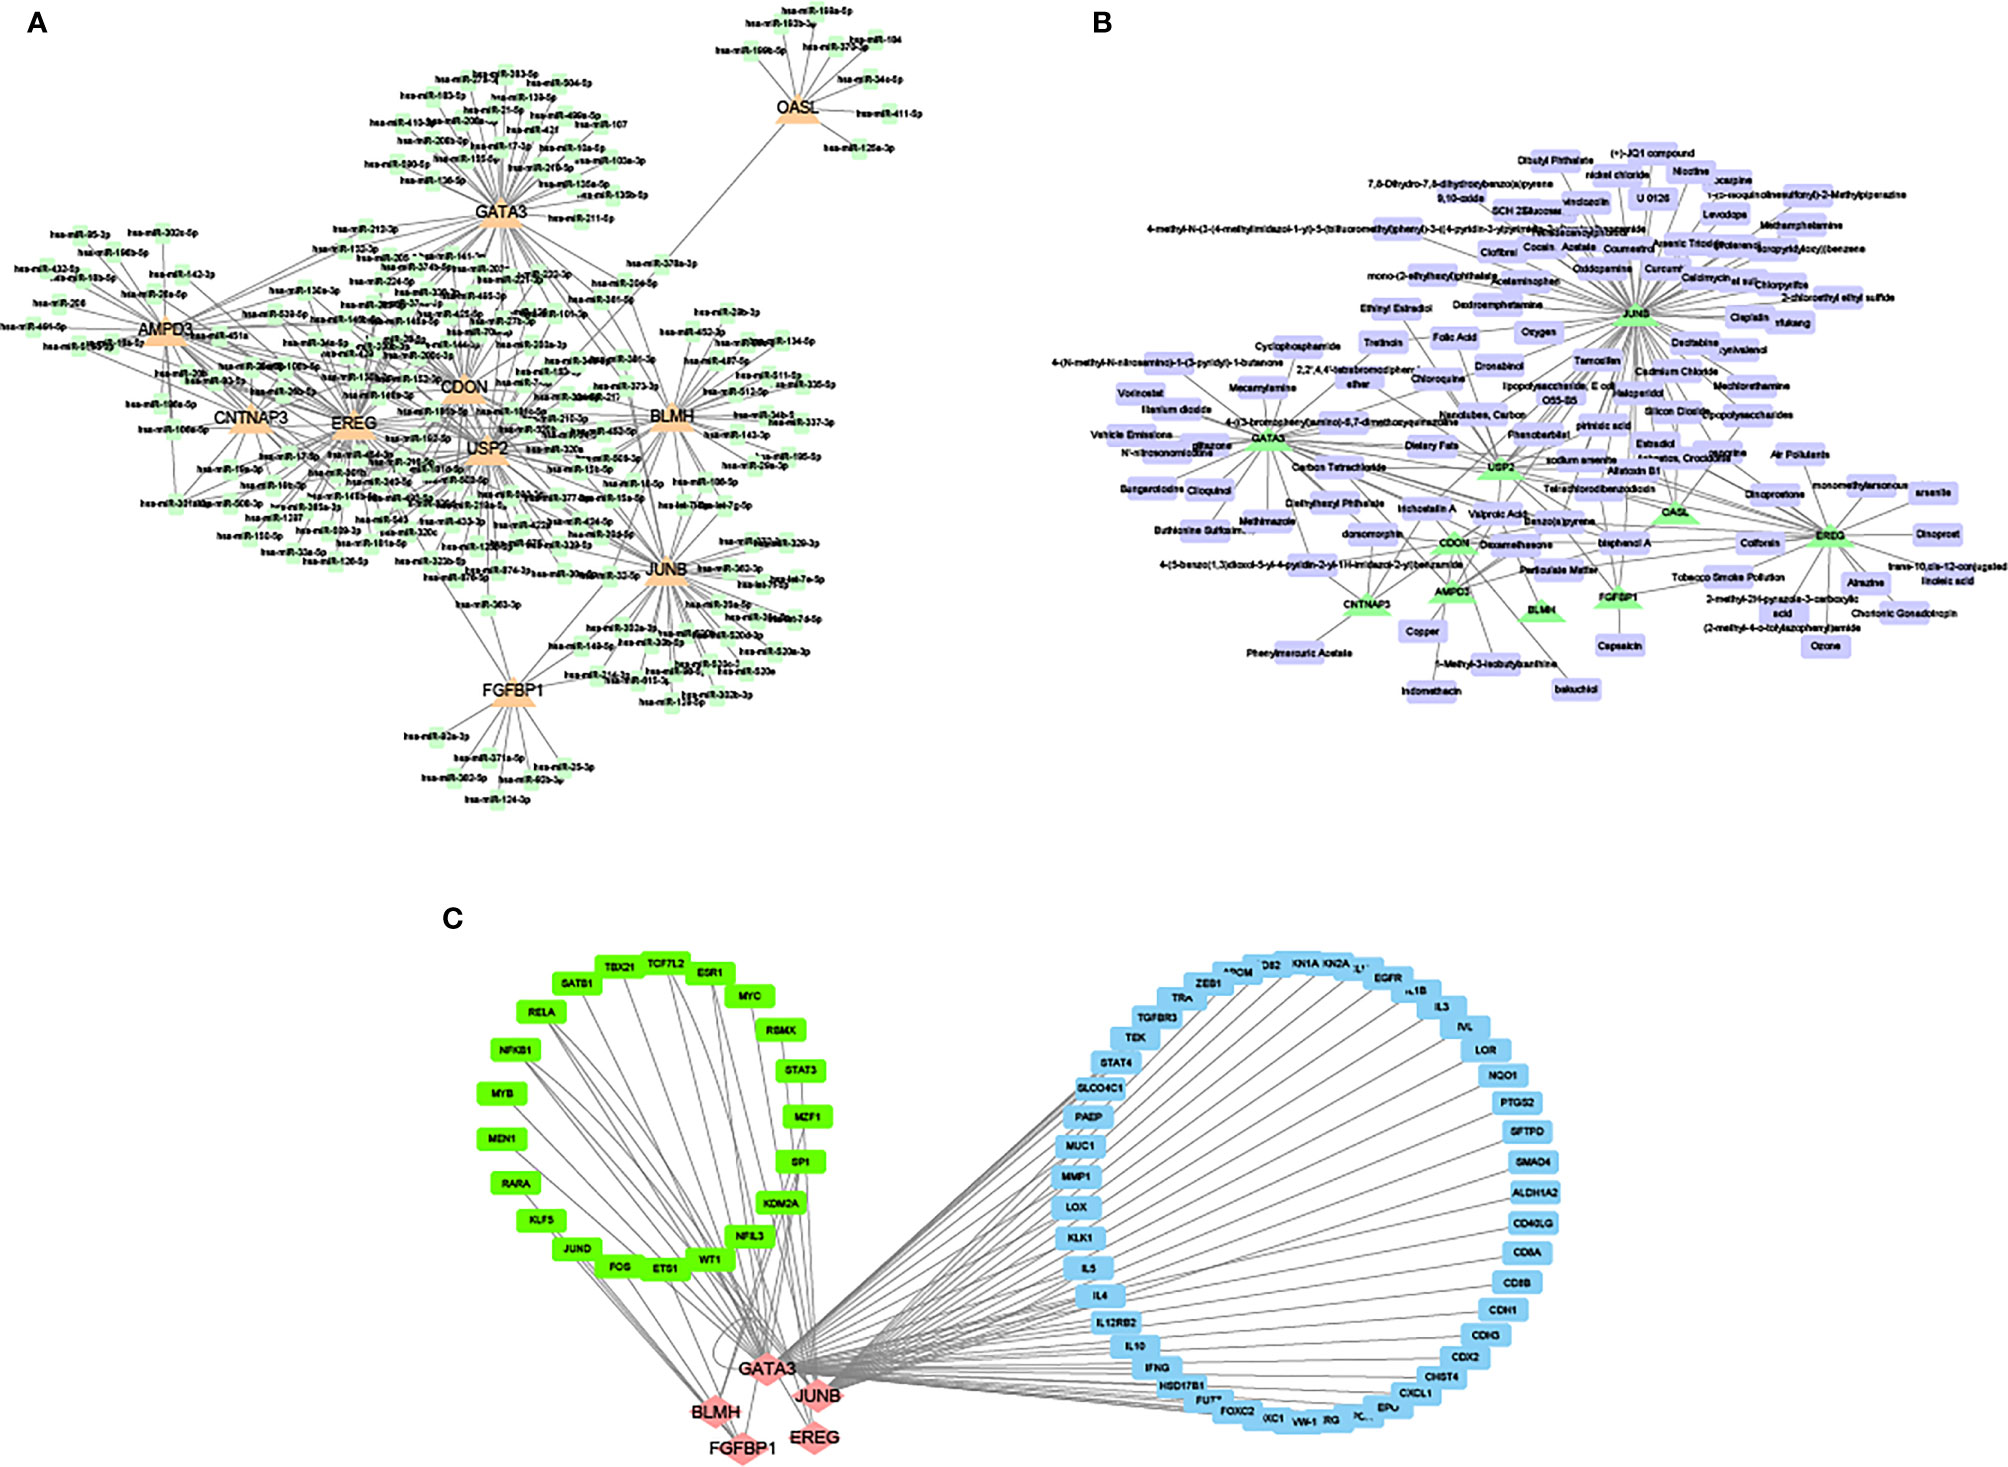
Figure 12 Network of miRNA and mRNA. (A) The network between overlapping mRNA and miRNA. Orange triangles represent overlapping mRNA. Green blocks represent miRNA. (B) The network between overlapping and targeted drugs. Green triangles represent overlapping mRNA. Purple blocks represent targeted drugs. (C) The network between overlapping mRNA and transcription factors. Red rhombuses express mRNA. Green blocks represent transcription factors that regulate mRNA. Blue blocks represent genes that are regulated when mRNA is a transcription factor.
Meanwhile, the mRNA regulated by overlapping mRNA and transcription factors from the TRRUST database was retrieved and the network between mRNA and transcription factors was developed (Figure 12C).
It was observed that JUNB and GATA3 were higher in the degree of connectivity in the gene miRNA transcription factor drug network, suggesting that these genes may be important targets for DFU.
Advanced research using next-generation sequencing technology has indicated the role of circRNA-associated ceRNA network in DFU. For example, studies had demonstrated that circRNA cPWWP2A interacted with miR-579 to upregulate the expression of angiopoietin 1, occludin 1, and SIRT1 acting as a ceRNA, consequently promoting retinal vascular dysfunction (30, 31). Liao et al. constructed the ceRNA network of DFU consisting of 8 circRNAs, 11 miRNAs, and 91 mRNAs, and GO analysis showed that hub genes including BCL2, CDND1, and SMAD4 are potential diagnostic biomarkers in DFU (7). At the same time, Qian et al (32). identified 1,192 DEGs in the GSE7014 dataset (900 upregulated and 292 downregulated) and 1,176 DEGs in the GSE29221 dataset (257 upregulated and 919 downregulated). However, it is unclear how the circRNA-associated ceRNA network and infiltrating immune cell are connected to the pathogenesis of DFU. Therefore, the construction and analysis of infiltrating immune cell and ceRNA networks have to be constructed to deepen the understanding of the molecular mechanism of DFU. The study created a ceRNA regulatory network in DFU consisting of 20 DEcircRNAs, 11 DEmiRNAs, and 8 DEmRNAs.
Angiogenesis extends blood vessels through vascular branching. DFU has been reported to be associated with poor angiogenesis in granulation tissues. Therefore, wound tissue angiogenesis could be a viable therapy for DFU. The transcription factors of the activator protein 1 (AP-1) are involved in the cell cycle and cell development, eventually regulating angiogenesis and vascular growth (33). Several members of the AP-1 family and JUNB are associated with embryonic fibroblast cell proliferation (34) and T-cell programming (35). Endothelial cells play a significant role in maintaining the function of blood vessels. JUNB knockdown attenuated the migration instead of the proliferation of HUVEC, primarily indicating the regulated migration of endothelial cells induced by JUNB and the eventual participating in angiogenesis of JUNB (33). The study similarly showed that JUNB might act as the target gene for DFU.
It was found that circRNAs (hsa-circ-0049271 and hsa-circ-0074559) and miRNAs (hsa-let-7i-5p, hsa-miR-24–3p, and hsa-miR-214–3p) were identified as significant predictors to distinguish DFU from standard samples. Functional enrichment analysis demonstrated DFU-related pathways, including VEGF and T-cell receptor signaling. A recent study showed that hsa-circ-0049271 was involved in cell proliferation (36). Guo et al. demonstrated that hsa-miR-24–3p expression is significantly higher in the vitreous of diabetic retinopathy (37), establishing the association of hsa-mir-24–3p with angiogenesis. The VEGF signaling pathway regulated angiogenesis in embryonic skin and blood vessel formation as an upstream JUNB regulator, eventually controlling endothelial cell proliferation, survival, and migration to develop blood vessels (38). CIBERSORT estimation indicated that CD8+ T cells and monocytes were related to the expression of IL-6. Therefore, hsa-circ-0049271/hsa-mir-24–3p/JUNB is supposedly the crucial axis for DFU angiogenesis and infectious inflammation.
However, the study had some limitations. First, the data collected from public databases were limited because of a lack of clinical factors, which could factor in potential errors and affect the reliability. Therefore, more experimental evidence included is required to increase the statistical power and authenticate the association between circRNA-miRNA-mRNA network and immune cells in DFU. In addition, the heterogeneity of DFU-related immune microenvironment was not analyzed. Furthermore, the specific mechanism of immune cells was not studied in detail. Therefore, future studies with single-cell sequencing are warranted to achieve more reliable outcomes. Last, the study did not analyze the direct mechanisms among ceRNA, filtrating immune cells, and cellular communication of DFU. Therefore, modern techniques like qRT-PCR, immunofluorescence, immunohistochemistry, and Western blotting are needed to detect the relationship among hsa-circ-0049271, hsa-mir-24–3p, JUNB, CD8+ T cells, and monocytes.
In summary, the study aimed to explore the biological functions and pathways involved in the development of DFU. It was identified that two circRNAs, three miRNAs, two hub genes, and nine immune cells are highly associated with the diagnosis and treatment through PPI network and ROC curve analyses. Furthermore, GO and KEGG enrichment analyses demonstrated that the VEGF signaling pathway, smooth muscle cell proliferation, and T-cell receptor signaling pathway could be potential targets for DFU treatment.
The original contributions presented in the study are included in the article/Supplementary Material. Further inquiries can be directed to the corresponding author.
LZ and PZ contributed equally to this work. All authors contributed to the article and approved the submitted version.
National Natural Science Foundation of China, Grant/Award Numbers: 81704002.
The authors declare that the research was conducted in the absence of any commercial or financial relationships that could be construed as a potential conflict of interest.
All claims expressed in this article are solely those of the authors and do not necessarily represent those of their affiliated organizations, or those of the publisher, the editors and the reviewers. Any product that may be evaluated in this article, or claim that may be made by its manufacturer, is not guaranteed or endorsed by the publisher.
The Supplementary Material for this article can be found online at: https://www.frontiersin.org/articles/10.3389/fendo.2022.836152/full#supplementary-material
1. International Diabetes Federation. IDF Diabetes Atlas. 8th. Brussels: International Diabetes Federation (2017). Available at: http://www.diabetesatlas.org.
2. Bakker K, Apelqvist J, Lipsky BA, Van Netten JJ. International Working Group on the Diabetic Foot. The 2015 IWGDF Guidance Documents on Prevention and Management of Foot Problems in Diabetes: Development of an Evidence-Based Global Consensus. Diabetes Metab Res Rev (2016) 32 Suppl 1:2–6. doi: 10.1002/dmrr.2694
3. Driver VR, Fabbi M, Lavery LA, Gibbons G. The Costs of Diabetic Foot: The Economic Case for the Limb Salvage Team. J Vasc Surg (2010) 52(3 Suppl):S17–22. doi: 10.1016/j.jvs.2010.06.003
4. Kristensen LS, Andersen MS, Stagsted LVW, Ebbesen KK, Hansen TB, Kjems J. The Biogenesis, Biology and Characterization of Circular RNAs. Nat Rev Genet (2019) 20(11):675–91. doi: 10.1038/s41576-019-0158-7
5. Han B, Chao J, Yao H. Circular RNA and its Mechanisms in Disease: From the Bench to the Clinic. Pharmacol Ther (2018) 187:31–44. doi: 10.1016/j.pharmthera.2018.01.010
6. Wang A, Toma MA, Ma J, Li D, Vij M, Chu T, et al. Circular RNA Hsa_Circ_0084443 Is Upregulated in Diabetic Foot Ulcer and Modulates Keratinocyte Migration and Proliferation. Adv Wound Care (New Rochelle) (2020) 9(4):145–60. doi: 10.1089/wound.2019.0956
7. Liao S, Lin X, Mo C. Integrated Analysis of circRNA-miRNA-mRNA Regulatory Network Identifies Potential Diagnostic Biomarkers in Diabetic Foot Ulcer. Non-coding RNA Res (2020) 5(3):116–24. doi: 10.1016/j.ncrna.2020.07.001
8. Sawaya AP, Stone RC, Brooks SR, Pastar I, Jozic I, Hasneen K, et al. Deregulated Immune Cell Recruitment Orchestrated by FOXM1 Impairs Human Diabetic Wound Healing[J]. Nat Commun (2020) 11(1):4678. doi: 10.1038/s41467-020-18276-0
9. Liu P, Zhu Y, Li Q, Cheng B. Comprehensive Analysis of Differentially Expressed miRNAs and mRNAs Reveals That miR-181a-5p Plays a Key Role in Diabetic Dermal Fibroblasts. J Diabetes Res (2020) 2020:4581954. doi: 10.1155/2020/4581954
10. Ramirez HA, Pastar I, Jozic I, Stojadinovic O, Stone RC, Ojeh N, et al. Staphylococcus Aureus Triggers Induction of miR-15B-5P to Diminish DNA Repair and Deregulate Inflammatory Response in Diabetic Foot Ulcers. J Invest Dermatol (2018) 138(5):1187–96. doi: 10.1016/j.jid.2017.11.038
11. Theocharidis G, Baltzis D, Roustit M, Tellechea A, Dangwal S, Khetani RS, et al. Integrated Skin Transcriptomics and Serum Multiplex Assays Reveal Novel Mechanisms of Wound Healing in Diabetic Foot Ulcers. Diabetes (2020) 69(10):2157–69. doi: 10.2337/db20-0188
12. Ritchie ME, Phipson B, Wu D, Hu Y, Law CW, Shi W, et al. Limma Powers Differential Expression Analyses for RNA-Sequencing and Microarray Studies. Nucleic Acids Res (2015) 43(7):e47. doi: 10.1093/nar/gkv007
13. Ashburner M, Ball CA, Blake JA, Botstein D, Butler H, Cherry JM, et al. Gene Ontology: Tool for the Unification of Biology. Gene Ontol Consortium [J]. Nat Genet (2000) 25(1):25–9. doi: 10.1038/75556
14. Kanehisa M, Goto S. KEGG: Kyoto Encyclopedia of Genes and Genomes. Nucleic Acids Res (2000) 28(1):27–30. doi: 10.1093/nar/28.1.27
15. Yu G, Wang LG, Han Y, He QY. Clusterprofiler: An R Package for Comparing Biological Themes Among Gene Clusters. OMICS (2012) 16(5):284–7. doi: 10.1089/omi.2011.0118
16. Subramanian A, Tamayo P, Mootha VK, Mukherjee S, Ebert BL, Gillette MA, et al. Gene Set Enrichment Analysis: A Knowledge-Based Approach for Interpreting Genome-Wide Expression Profiles. Proc Natl Acad Sci USA (2005) 102(43):15545–50. doi: 10.1073/pnas.0506580102
17. Hänzelmann S, Castelo R, Guinney J. GSVA: Gene Set Variation Analysis for Microarray and RNA-Seq Data. BMC Bioinf (2013) 14:7. doi: 10.1186/1471-2105-14-7
18. Szklarczyk D, Gable AL, Lyon D, Junge A, Wyder S, Huerta-Cepas J, et al. STRING V11: Protein-Protein Association Networks With Increased Coverage, Supporting Functional Discovery in Genome-Wide Experimental Datasets. Nucleic Acids Res (2019) 47(D1):D607–13. doi: 10.1093/nar/gky1131
19. Li JH, Liu S, Zhou H, Qu LH, Yang JH. Starbase V2.0: Decoding miRNA-ceRNA, miRNA-ncRNA and Protein-RNA Interaction Networks From Large-Scale CLIP-Seq Data. Nucleic Acids Res (2014) 42(Database issue):D92–7. doi: 10.1093/nar/gkt1248
20. Dweep H, Gretz N, Sticht C. Mirwalk Database for miRNA-Target Interactions. Methods Mol Biol (2014) 1182:289–305. doi: 10.1007/978-1-4939-1062-5_25
21. Liu M, Wang Q, Shen J, Yang BB, Ding X. Circbank: A Comprehensive Database for circRNA With Standard Nomenclature. RNA Biol (2019) 16(7):899–905. doi: 10.1080/15476286.2019.1600395
22. Han H, Cho JW, Lee S, Yun A, Kim H, Bae D, et al. TRRUST V2: An Expanded Reference Database of Human and Mouse Transcriptional Regulatory Interactions. Nucleic Acids Res (2018) 46(D1):D380–6. doi: 10.1093/nar/gkx1013
23. Davis AP, Grondin CJ, Johnson RJ, Sciaky D, Wiegers J, Wiegers TC, et al. Comparative Toxicogenomics Database (CTD): Update 2021[J]. Nucleic Acids Res (2021) 49(D1):D1138–43. doi: 10.1093/nar/gkaa891
24. Shannon P, Markiel A, Ozier O, Baliga NS, Wang JT, Ramage D, et al. Cytoscape: A Software Environment for Integrated Models of Biomolecular Interaction Networks. Genome Res (2003) 13(11):2498–504. doi: 10.1101/gr.1239303
25. Newman AM, Liu CL, Green MR, Gentles AJ, Feng W, Xu Y, et al. Robust Enumeration of Cell Subsets From Tissue Expression Profiles. Nat Methods (2015) 12(5):453–7. doi: 10.1038/nmeth.3337
26. Hao Z, Lv D, Ge Y, Shi J, Weijers D, Yu G, et al. RIdeogram: Drawing SVG Graphics to Visualize and Map Genome-Wide Data on the Idiograms. PeerJ Comput Sci (2020) 6:e251. doi: 10.7717/peerj-cs.251
27. Ramirez HA, Liang L, Pastar I, Rosa AM, Stojadinovic O, Zwick TG, et al. Comparative Genomic, MicroRNA, and Tissue Analyses Reveal Subtle Differences Between Non-Diabetic and Diabetic Foot Skin. PloS One (2015) 10:e0137133. doi: 10.1371/journal.pone.0137133
28. Korkmaz P, Koçak H, Onbaşı K, Biçici P, Özmen A, Uyar C, et al. The Role of Serum Procalcitonin, Interleukin-6, and Fibrinogen Levels in Differential Diagnosis of Diabetic Foot Ulcer Infection. J Diabetes Res (2018) 2018:7104352. doi: 10.1155/2018/7104352
29. Dhamodharan U, Viswanathan V, Krishnamoorthy E, Rajaram R, Aravindhan V. Genetic Association of IL-6, TNF-α and SDF-1 Polymorphisms With Serum Cytokine Levels in Diabetic Foot Ulcer. Gene (2015) 565(1):62–7. doi: 10.1016/j.gene.2015.03.063
30. Liu C, Ge HM, Liu BH, Dong R, Shan K, Chen X, et al. Targeting Pericyte-Endothelial Cell Crosstalk by Circular RNA-Cpwwp2a Inhibition Aggravates Diabetes-Induced Microvascular Dysfunction. Proc Natl Acad Sci USA (2019) 116(15):7455–64. doi: 10.1073/pnas.1814874116
31. Yan Q, He X, Kuang G, Ou C. CircRNA Cpwwp2a: An Emerging Player in Diabetes Mellitus. J Cell Commun Signal (2020) 14(3):351–3. doi: 10.1007/s12079-020-00570-7
32. Qian L, Xia Z, Zhang M, Han Q, Hu D, Qi S, et al. Integrated Bioinformatics-Based Identification of Potential Diagnostic Biomarkers Associated With Diabetic Foot Ulcer Development. J Diabetes Res (2021) 2021:5445349. doi: 10.1155/2021/5445349
33. Jia J, Ye T, Cui P, Hua Q, Zeng H, Zhao D. AP-1 Transcription Factor Mediates VEGF-Induced Endothelial Cell Migration and Proliferation. Microvasc Res (2016) 105:103–8. doi: 10.1016/j.mvr.2016.02.004
34. Andrecht S, Kolbus A, Hartenstein B, Angel P, Schorpp-Kistner M. Cell Cycle Promoting Activity of JunB Through Cyclin A Activation. J Biol Chem (2002) 277(39):35961–8. doi: 10.1074/jbc.M202847200
35. Katagiri T, Kameda H, Nakano H, Yamazaki S. Regulation of T Cell Differentiation by the AP-1 Transcription Factor JunB. Immunol Med (2021) 44(3):197–203. doi: 10.1080/25785826.2021.1872838
36. Liu Y, Wang X, Bi L, Huo H, Yan S, Cui Y, et al. Identification of Differentially Expressed Circular RNAs as miRNA Sponges in Lung Adenocarcinoma. J Oncol (2021) 2021:5193913. doi: 10.1155/2021/5193913
37. Guo J, Zhou P, Pan M, Liu Z, An G, Han J, et al. Relationship Between Elevated microRNAs and Growth Factors Levels in the Vitreous of Patients With Proliferative Diabetic Retinopathy. J Diabetes Complications (2021) 35(11):108021. doi: 10.1016/j.jdiacomp.2021.108021
Keywords: diabetic foot ulcer, competing endogenous RNA network, infiltrating immune cell, JunB, GATA3, hsa-circ-0049271, hsa-circ-0074559
Citation: Zeng L, Zhang P, Fang Z, Liu D, Li H, Qu X, Chu S, Zhao H, Liu X and Lee M (2022) The Construction and Analysis of Infiltrating Immune Cell and ceRNA Networks in Diabetic Foot Ulcer. Front. Endocrinol. 13:836152. doi: 10.3389/fendo.2022.836152
Received: 04 January 2022; Accepted: 07 June 2022;
Published: 14 July 2022.
Edited by:
Xingwu Ran, Sichuan University, ChinaReviewed by:
Lingling Xu, Shenzhen Hospital of Southern Medical University, ChinaCopyright © 2022 Zeng, Zhang, Fang, Liu, Li, Qu, Chu, Zhao, Liu and Lee. This is an open-access article distributed under the terms of the Creative Commons Attribution License (CC BY). The use, distribution or reproduction in other forums is permitted, provided the original author(s) and the copyright owner(s) are credited and that the original publication in this journal is cited, in accordance with accepted academic practice. No use, distribution or reproduction is permitted which does not comply with these terms.
*Correspondence: Deliang Liu, bGRsMjU4MEBnenVjbS5lZHUuY24=; Huilin Li, c3p0Y21saGxAMTYzLmNvbQ==
Disclaimer: All claims expressed in this article are solely those of the authors and do not necessarily represent those of their affiliated organizations, or those of the publisher, the editors and the reviewers. Any product that may be evaluated in this article or claim that may be made by its manufacturer is not guaranteed or endorsed by the publisher.
Research integrity at Frontiers
Learn more about the work of our research integrity team to safeguard the quality of each article we publish.