- 1Department of Radiology, Third Affiliated Hospital of Sun Yat-sen University, Guangzhou, China
- 2Department of Radiology, Sun Yat-Sen Memorial Hospital, Sun Yat-sen University, Guangzhou, Guangdong, China
- 3Department of VIP Medical Center, Third Affiliated Hospital of Sun Yat-sen University, Guangzhou, Guangdong, China
Purpose: To assess abdominal fat deposition and lumbar vertebra with iterative decomposition of water and fat with echo asymmetry and least-squares estimation (IDEAL-IQ) and investigate their correlation with menopausal status.
Materials and Methods: Two hundred forty women who underwent routine abdominal MRI and IDEAL-IQ between January 2016 and April 2021 were divided into two cohorts (first cohort: 120 pre- or postmenopausal women with severe fatty livers or without fatty livers; second cohort: 120 pre- or postmenopausal women who were obese or normal weight). The fat fraction (FF) values of the liver (FFliver) and lumbar vertebra (FFlumbar) in the first group and the FF values of subcutaneous adipose tissue (SAT) (FFSAT) and FFlumbar in the second group were measured and compared using IDEAL-IQ.
Results: Two hundred forty women were evaluated. FFlumbar was significantly higher in both pre- and postmenopausal women with severe fatty liver than in patients without fatty livers (premenopausal women: p < 0.001, postmenopausal women: p < 0.001). No significant difference in the FFlumbar was observed between obese patients and normal-weight patients among pre- and postmenopausal women (premenopausal women: p = 0.113, postmenopausal women: p = 0.092). Significantly greater lumbar fat deposition was observed in postmenopausal women than in premenopausal women with or without fatty liver and obesity (p < 0.001 for each group). A high correlation was detected between FFliver and FFlumbar in women with severe fatty liver (premenopausal women: r=0.76, p<0.01; postmenopausal women: r=0.82, p<0.01).
Conclusion: Fat deposition in the vertebral marrow was significantly associated with liver fat deposition in postmenopausal women.
Introduction
Osteoporosis is characterized by reduced bone density, increased bone fragility, and susceptibility to fracture. The reduced bone density occurring in individuals with osteoporosis is associated with an increase in vertebral bone marrow fat deposition (1, 2). Age is associated with changes in the musculoskeletal system. Substantial decreases in skeletal muscle function and bone density occur with aging (3, 4).The yellow bone marrow gradually replaces the red bone marrow in the vertebral body with increasing age (3, 5). Estrogen is another important factor affects bone composition. A reduction in estrogen levels promotes bone loss and the development of osteoporosis (6). Thus, osteoporosis is common in elderly individuals, especially in postmenopausal women (7). Furthermore, accumulating evidence has shown that postmenopausal women have increased abdominal adiposity, including subcutaneous adipose tissue (SAT) and visceral adipose tissue (VAT), compared to premenopausal women (8, 9). According to recent studies, abdominal adiposity is associated with osteopenia and osteoporosis (10, 11). Proinflammatory cytokines, such as tumor necrosis factor-α and interleukin-6, secreted by VAT are known to promote bone metabolism and resorption (12). Non-alcoholic fatty liver disease (NAFLD) is a multiple-system disease that is strongly associated with abdominal obesity (13), and VAT may cause NAFLD (14). Preliminary evidence also suggests that NAFLD may be associated with a decrease in bone mineral density (15). However, the relationship between vertebral bone marrow fat and abdominal adiposity, especially SAT and liver fat, remains unknown. And the possible contribution of abdominal adiposity to osteoporosis in postmenopausal women has not been well characterized.
MRI methods are the most accurate noninvasive techniques for quantifying body fat and bone marrow fat. MR spectroscopy is the most commonly used method to examine quantitative fat measurements (16). However, it has drawbacks, such as a long scan time, small imaging range, and substantial postprocessing, which may be impractical in some clinical settings (17, 18). Iterative decomposition of water and fat with echo asymmetry and least-squares estimation (IDEAL-IQ) imaging is a new method that steadily separates fat and water using three asymmetric echo times and the three-point Dixon method. In IDEAL-IQ, an iterative least-squares decomposition algorithm is employed to solve for a fat fraction map, a water fraction map, and an R2* map simultaneously (17, 18). By incorporating an R2* map into the algorithm, IDEAL-IQ accounts for T2* effects/field inhomogeneity and yields a proton density fat fraction that is not confounded by iron overload (19–21). IDEAL-IQ has been reported to accurately quantify hepatic fat deposition with good correlations observed between hepatic MR spectroscopy and liver biopsy (22–24). It was also used to measure the fat content in other organs and tissues, such as the pancreas, kidney, and bone marrow, in individuals with NAFLD (25, 26). IDEAL-IQ has been considered a valuable tool for providing information on fat content in clinical settings.
Therefore, using IDEAL-IQ as the noninvasive imaging methodology, we aimed to investigate the correlation between SAT, NAFLD, and vertebral bone marrow fat in a population of middle-aged females and investigate the correlations between fat deposits and menopausal status.
Materials and methods
Subjects
A total of 2360 middle-aged females (age range, 45 - 55 years old) who had received an abdominal MRI from January 2016 to April 2021 presented for a medical examination. The final data were acquired retrospectively from 240 middle-aged female subjects (age range, 45 – 55 years old; mean age, 48.50 ± 3.54 years old). Our institutional research ethics committee approved this study (02-005-01), and written informed consent was obtained from all study participants.
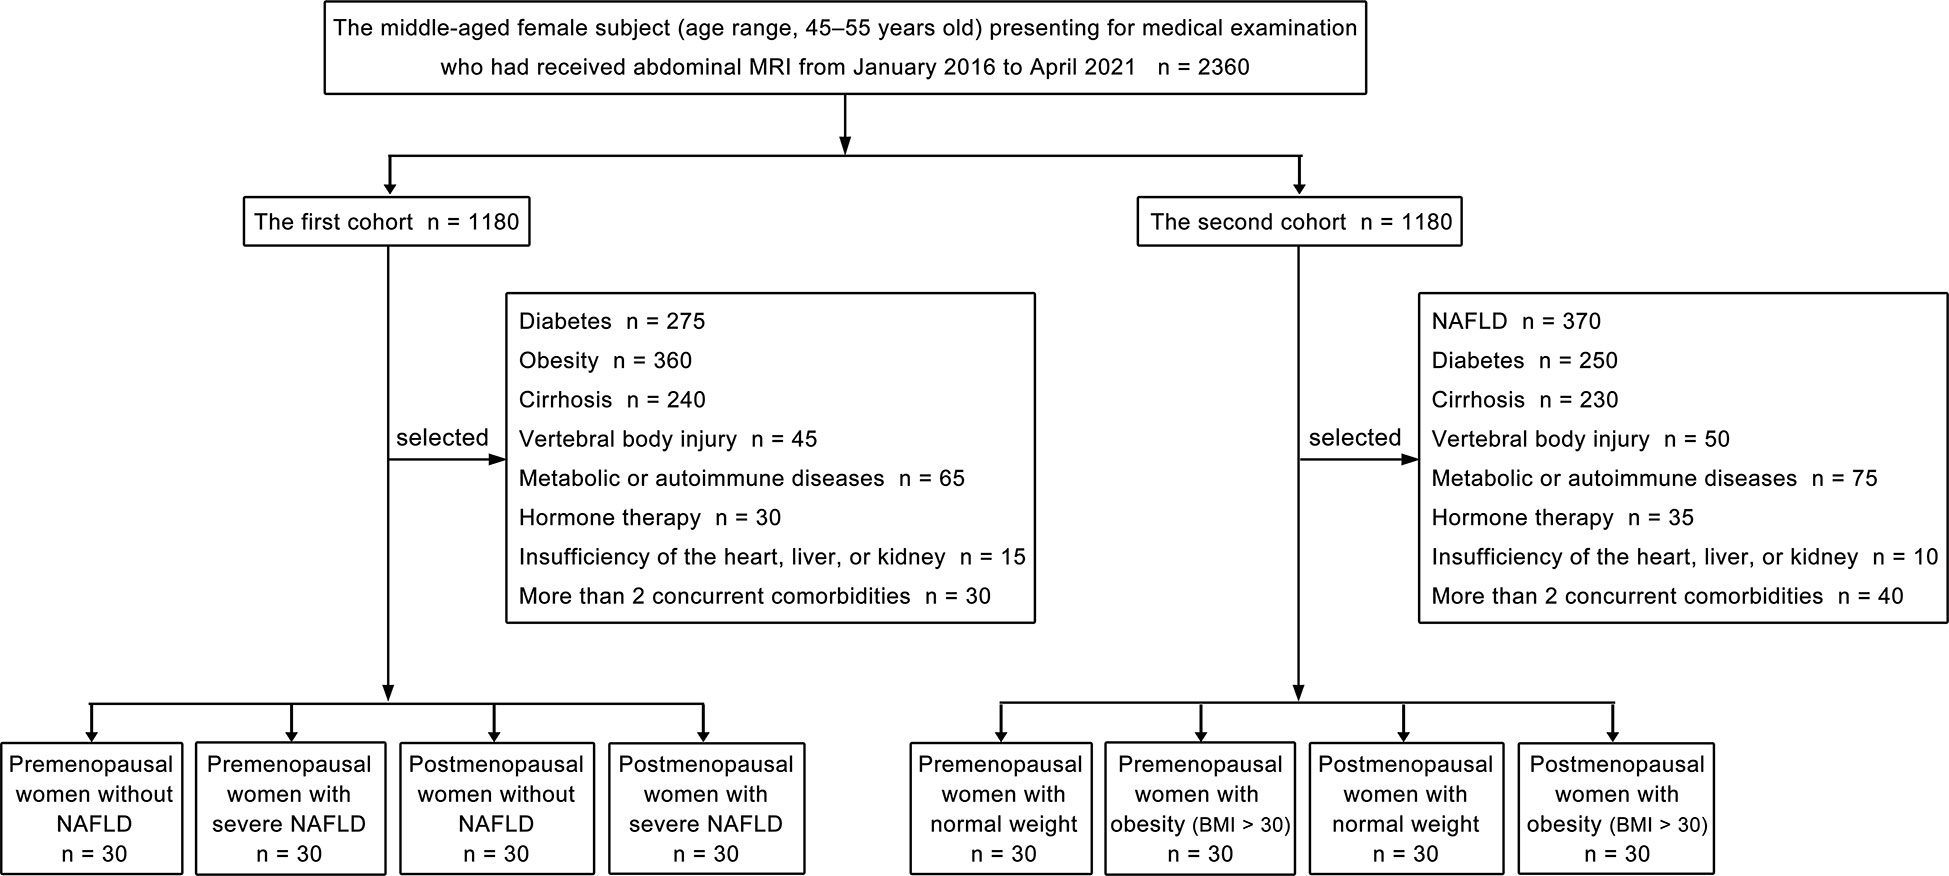
Our study consisted of two cohorts of patients, and each cohort included four groups. Propensity score matching was used to choose patients at a 1:1 ratio for the two cohorts’ patients, followed by subgrouping. The patient selection flowchart is shown in Figure 1. Women were categorized as postmenopausal if they had no menstrual cycle in the previous 12 months, whether owing to natural cessation or hysterectomy and/or oophorectomy (27). The first part of our study included the following four groups: premenopausal women without NAFLD (liver fat content is less than 5%) (28), premenopausal women with severe NAFLD (liver fat content is greater than 28%) (28), postmenopausal women without NAFLD, and postmenopausal women with severe NAFLD. Thirty patients were included in each group, and we quantitatively measured the fat deposition in the lumbar vertebra and liver of patients from each group. Patients with diabetes; obesity; cirrhosis; vertebral body injury; metabolic or autoimmune diseases; hormone therapy; insufficiency of the heart, liver, or kidney; or more than 2 concurrent comorbidities were excluded from the first cohort. The second cohort of patients in our study included the following four groups: premenopausal women with normal weight (body mass index, [BMI] 18- < 25 kg/m2) (29), premenopausal women with obesity (BMI > 30 kg/m2) (29), postmenopausal women with normal weight, and postmenopausal women with obesity (BMI > 30 kg/m2). Thirty patients were included in each group, and the fat deposition in the lumbar vertebra and subcutaneous fat were measured quantitatively. Patients with NAFLD; diabetes; cirrhosis; vertebral body injury; metabolic or autoimmune diseases; hormone therapy; insufficiency of the heart, liver, or kidney; or more than 2 concurrent comorbidities were excluded from the second cohort.
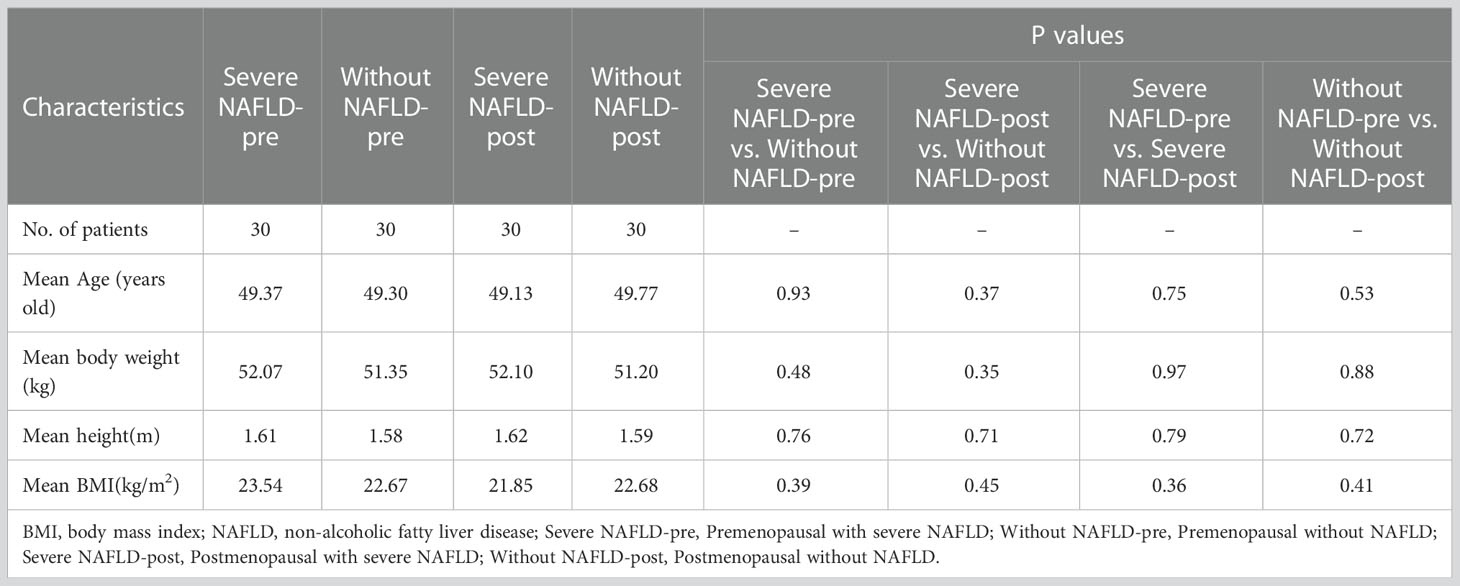
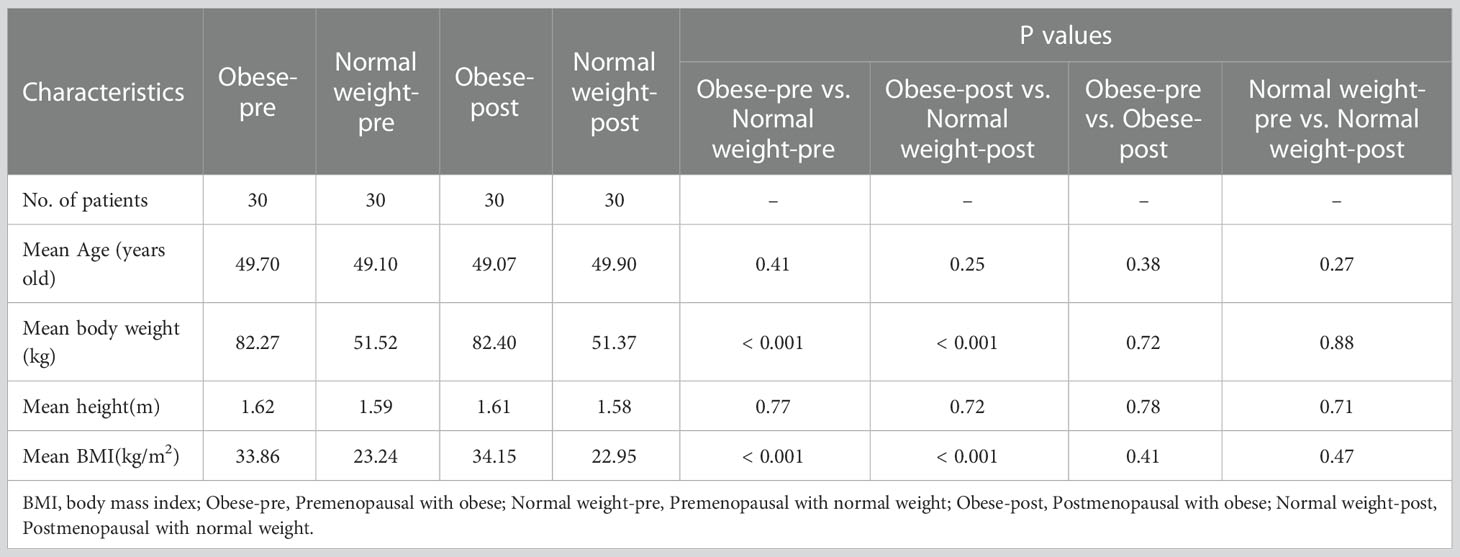
Of the 1180 consecutive patients in the first cohort, 1060 were excluded due to diabetes (n = 275), obesity (n = 360), cirrhosis (n = 240), vertebral body injury (n = 45), metabolic or autoimmune diseases (n = 65), hormone therapy (n = 30), insufficiency of the heart, liver or kidney (n = 15), or the presence of more than 2 concurrent comorbidities (n = 30). Accordingly, 120 women (mean age ± standard deviation, 49.50 ± 4.95 years old; range, 45 - 55 years old) were finally included in the first cohort. Of the 1180 consecutive patients in the second cohort, 1060 were excluded due to NAFLD (n = 370), diabetes (n = 250), cirrhosis (n = 230), vertebral body injury (n = 50), metabolic or autoimmune diseases (n = 75), hormone therapy (n = 35), insufficiency of the heart, liver or kidney (n = 10), or the presence of more than 2 concurrent comorbidities (n = 40). Accordingly, 120 women (mean age ± standard deviation, 49.00 ± 2.83 years old; range, 45 - 55 years old) were finally included in the second cohort. Significant differences in the mean age were not observed among the four groups (30 patients in each group) in the first or second cohorts of our study (Tables 1, 2).
Magnetic resonance imaging
This study was performed using a 3.0 T MRI scanner (Discovery 750 and Signa Architect, GE Healthcare, Milwaukee, Wisconsin, USA) equipped with a 32-channel, phased-array torso coil by two radiologists. Before scanning, patients were trained to hold their breath for > 20 s at the end of expiration. Prior to IDEAL, the routine sequences, liver acquisition with volume acceleration and fast spin–echo T2-weighted images (T2WI) with fat saturation of the abdomen were recorded. The detailed acquisition parameters are shown in Supplementary Material and listed in Supplementary Table 1.
The IDEAL-IQ sequence was used on the abdomen in the axis plane. The following six groups of images were obtained once the IDEAL sequence was scanned: in-phase image, out-of-phase image, pure water image, pure fat image, fat fraction (FF) map, and R2* relaxation rate image. The adipose contents of the fat infiltration regions were directly measured using the FF map, and the measurements represent the percentage of fat content in the local bone mass, SAT, and liver.
Image analysis
The IDEAL datasets were transferred to the workstation and processed using Functool 6.3.1 software (GE Healthcare, Milwaukee, Wisconsin, USA). Two radiologists independently evaluated the MRI studies. For the quantitative analysis of the FF values of the liver (FFliver), the radiologists independently placed three circulars (20 mm diameter) regions of interest (ROIs) in the liver on a plane passing through the main portal vein division: (1) in the right lobe of the liver (segment 6), (2) in segment 4 of the liver and (3) in the left lobe of the liver (segment 2/3). All ROIs were placed in the liver, avoiding major vessels, ligaments, and bile ducts, ensuring that each ROI was surrounded by liver parenchyma. Subcutaneous fat was defined as adipose tissue measured from the abdominal muscle wall to the skin. For the quantitative analysis of the FF values of SAT (FFSAT), box-shaped ROIs were placed on the left, middle, and right levels of the anterior abdominal subcutaneous fat in the upper abdomen. The ROIs were approximately 20 mm3. For the quantitation of FF values of the lumbar vertebra (FFlumbar), box-shaped ROIs were placed on each lumbar vertebra at the upper, middle, and lower levels (L1–L4) on the axial FF map, which avoids tumor diseases, bone island, Schmorl’s node, etc. in the vertebral body. The ROIs were approximately 20 mm3. Each area was measured 3 times, and the mean value was calculated. The liver fat content is less than 5% in the normal population and greater than 28% in patients with severe NAFLD (29).
Statistical analysis
All the data are presented as the means ± standard deviations, and a P value of less than 0.05 was considered significant. Differences in FFliver, FFSAT, and FFlumbar were analyzed using t tests with Bonferroni’s correction or the Mann–Whitney U test. The correlation coefficients were calculated by Spearman rank between the FFliver, FFSAT, and FFlumbar. The interobserver consistency of the FF values (independently determined by two radiologists) was evaluated using the Bland–Altman analysis and the intraclass correlation coefficient (ICC). One author analyzed all data using GraphPad Prism 9 software (GraphPad Software Inc., San Diego, CA, USA).
Results
The images of all patients were clear and usable. The interobserver consistency of the FFlumbar in the first cohort of patients was analyzed by constructing a Bland–Altman plot (Figure 2), and the 95% limits of agreement were -0.11 to 0.11, -0.06 to 0.06, -0.06 to 0.07, and -0.04 to 0.05, respectively. For the quantitative measurement of FFlumbar in premenopausal without NAFLD group and premenopausal with severe NAFLD group, interobserver agreement was high (ICC = 0.91, 0.93; 95% confidence interval (CI) 0.90–0.93, 0.91–0.95), and intraobserver agreement was also high (ICC = 0.92, 0.92; 95% CI 0.91–0.94, 0.90–0.94). The Bland–Altman analysis and ICC showed that the two radiologists had good consistency in the measured values.
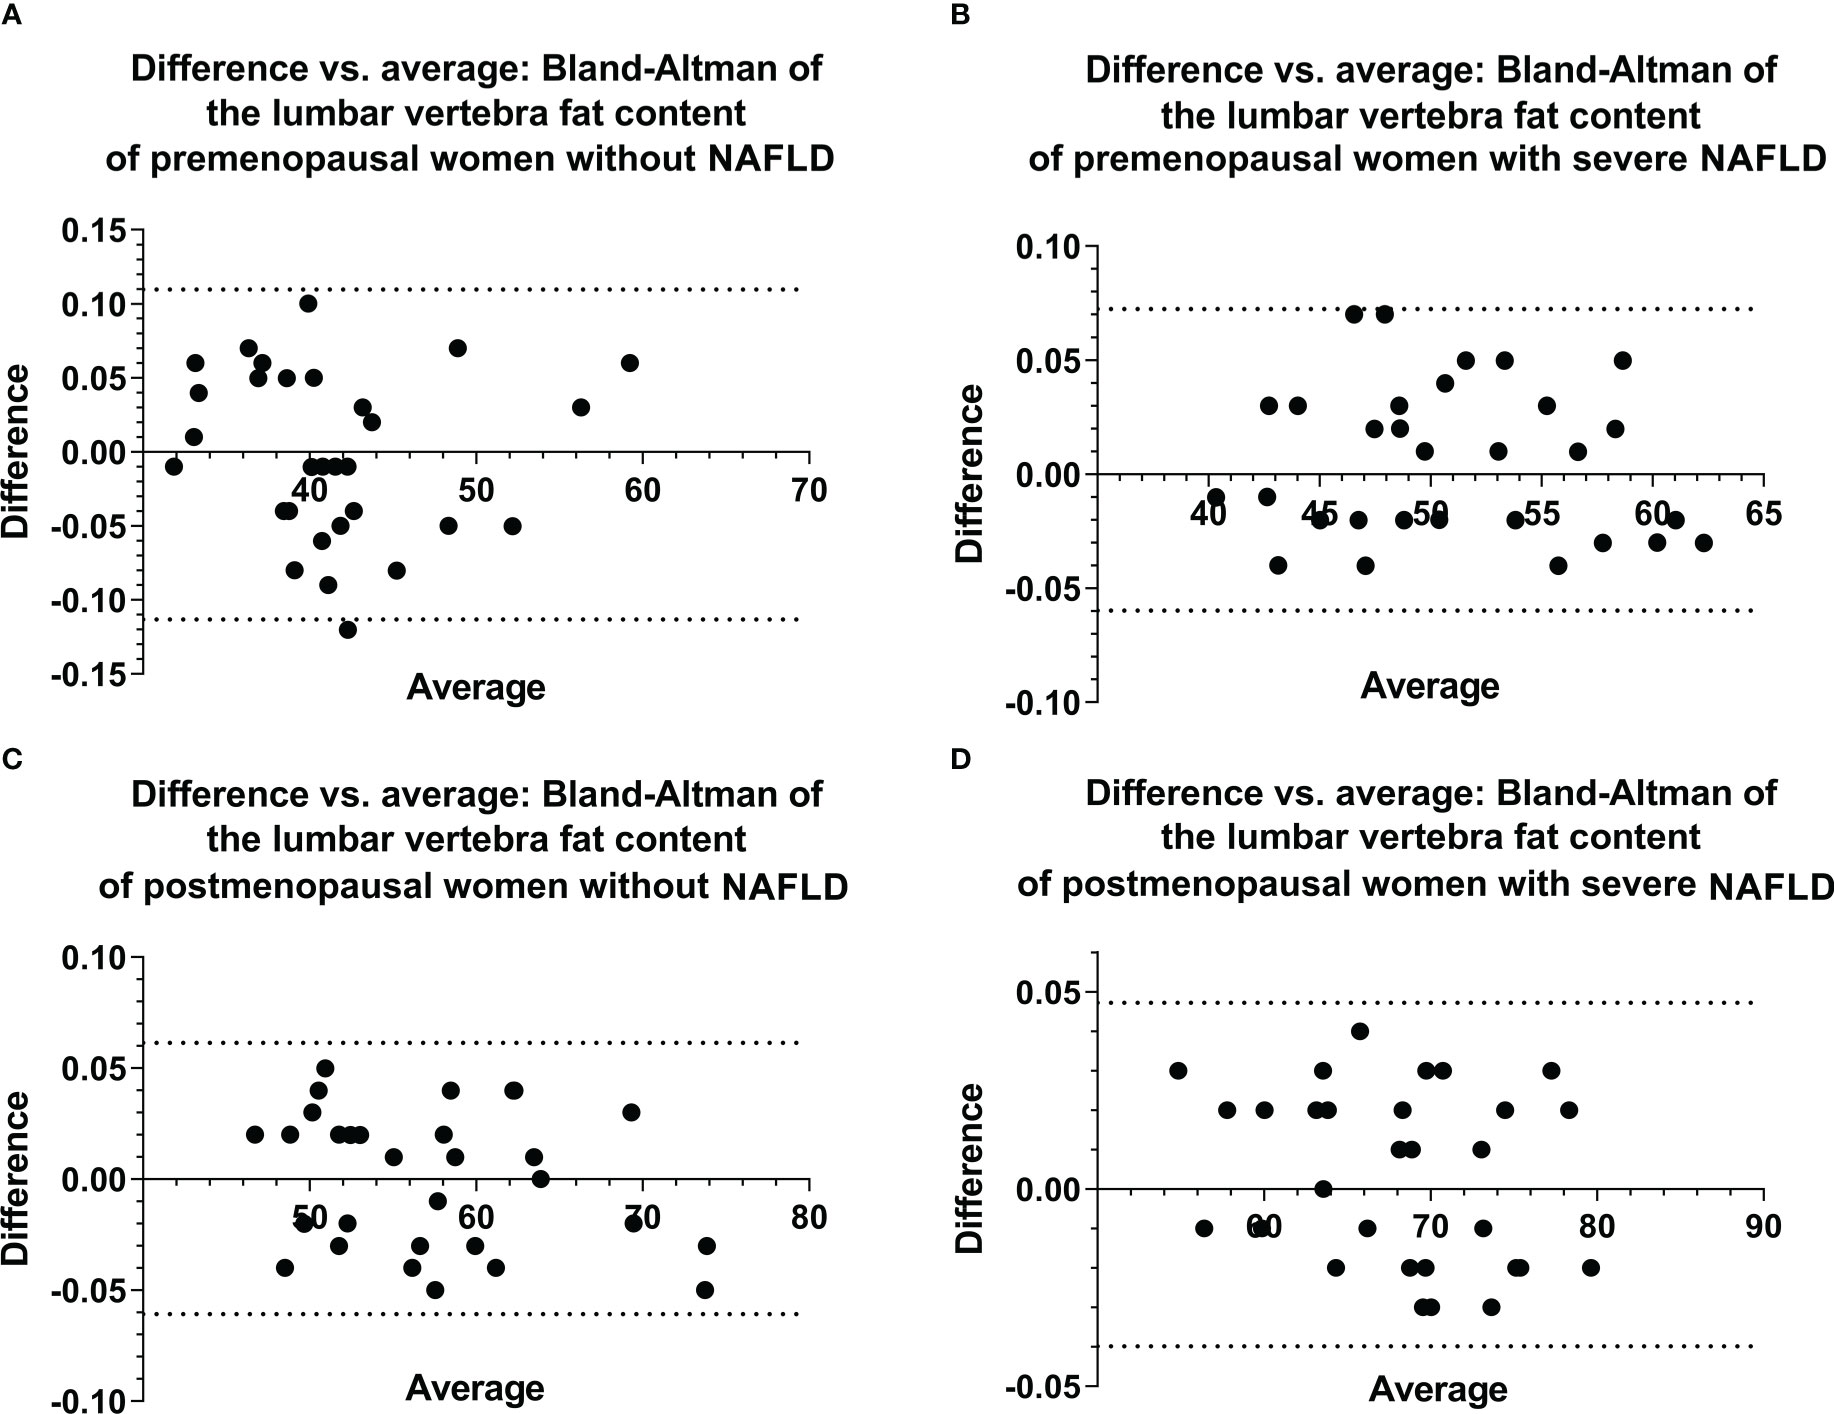
Figure 2 Bland–Altman plots of ROI-based FF values for the lumbar vertebra were obtained from two observations of the first cohort (A–D), showing excellent correlations, a negligible bias, and 95% limits of agreement of approximately ± 0.113 or less. ROI, region of interest, FF, fat fraction.
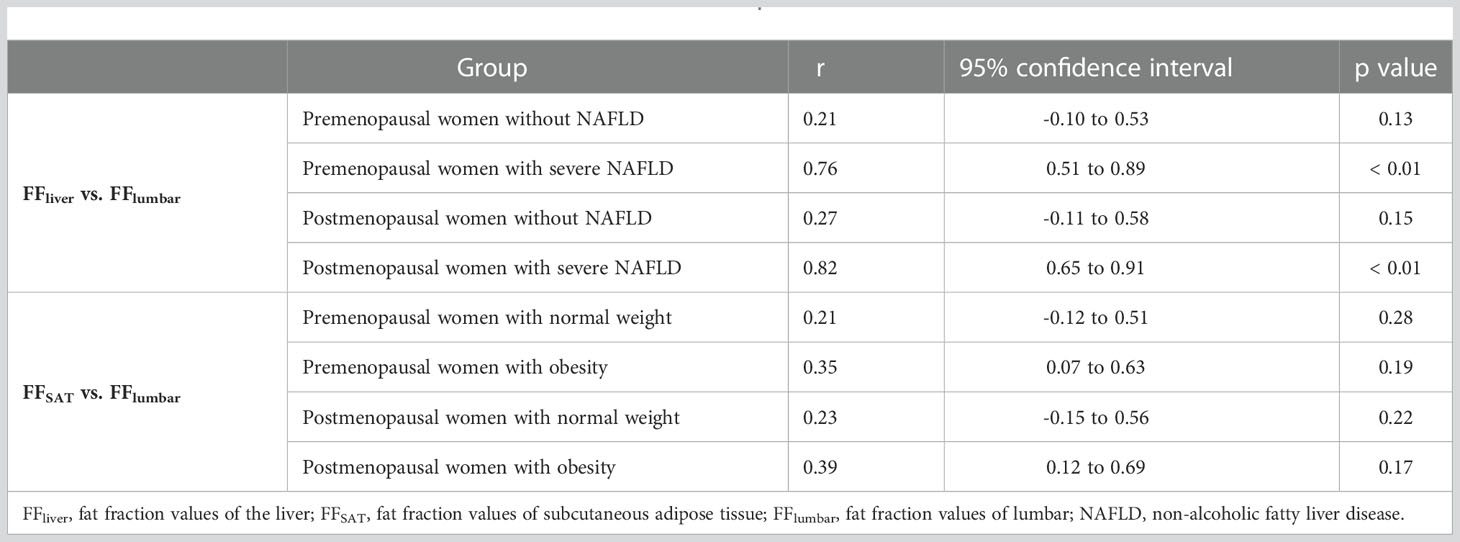
Examples of fat deposition in patients without NAFLD and severe NAFLD before or after menopause in the first part are shown in Figure 3. The mean FFlumbar and the FFliver were measured separately in the four groups and are summarized in Table 3. In premenopausal women and postmenopausal women, the FFlumbar were higher in patients with severe NAFLD than in patients without NAFLD (premenopausal women: 50.95 ± 6.03 vs. 41.58 ± 6.37, p < 0.001, t = 5.85; postmenopausal women: 68.11 ± 6.49 vs. 57.48 ± 7.38, p < 0.001, t = 5.92). Additionally, in patients with severe NAFLD or without NAFLD, the FFlumbar were higher in postmenopausal women than in premenopausal women (severe NAFLD: 68.11 ± 6.49 vs. 50.94 ± 6.03, p < 0.001, t = 10.62; without NAFLD: 57.48 ± 7.38 vs. 41.58 ± 6.37, p < 0.001, t = 8.93). Significant differences in the FFlumbar were observed between patients without NAFLD and with severe NAFLD in both premenopausal and postmenopausal women (Figures 4A, B). A high correlation was detected between FFlumbar and the FFliver in women with severe NAFLD (premenopausal women: r = 0.76, p < 0.01; postmenopausal women: r = 0.82, p < 0.01) (Table 4; Figures 4C–F). The correlation between FFlumbar and the FFliver was better in postmenopausal women with severe NAFLD than in premenopausal women with severe NAFLD.
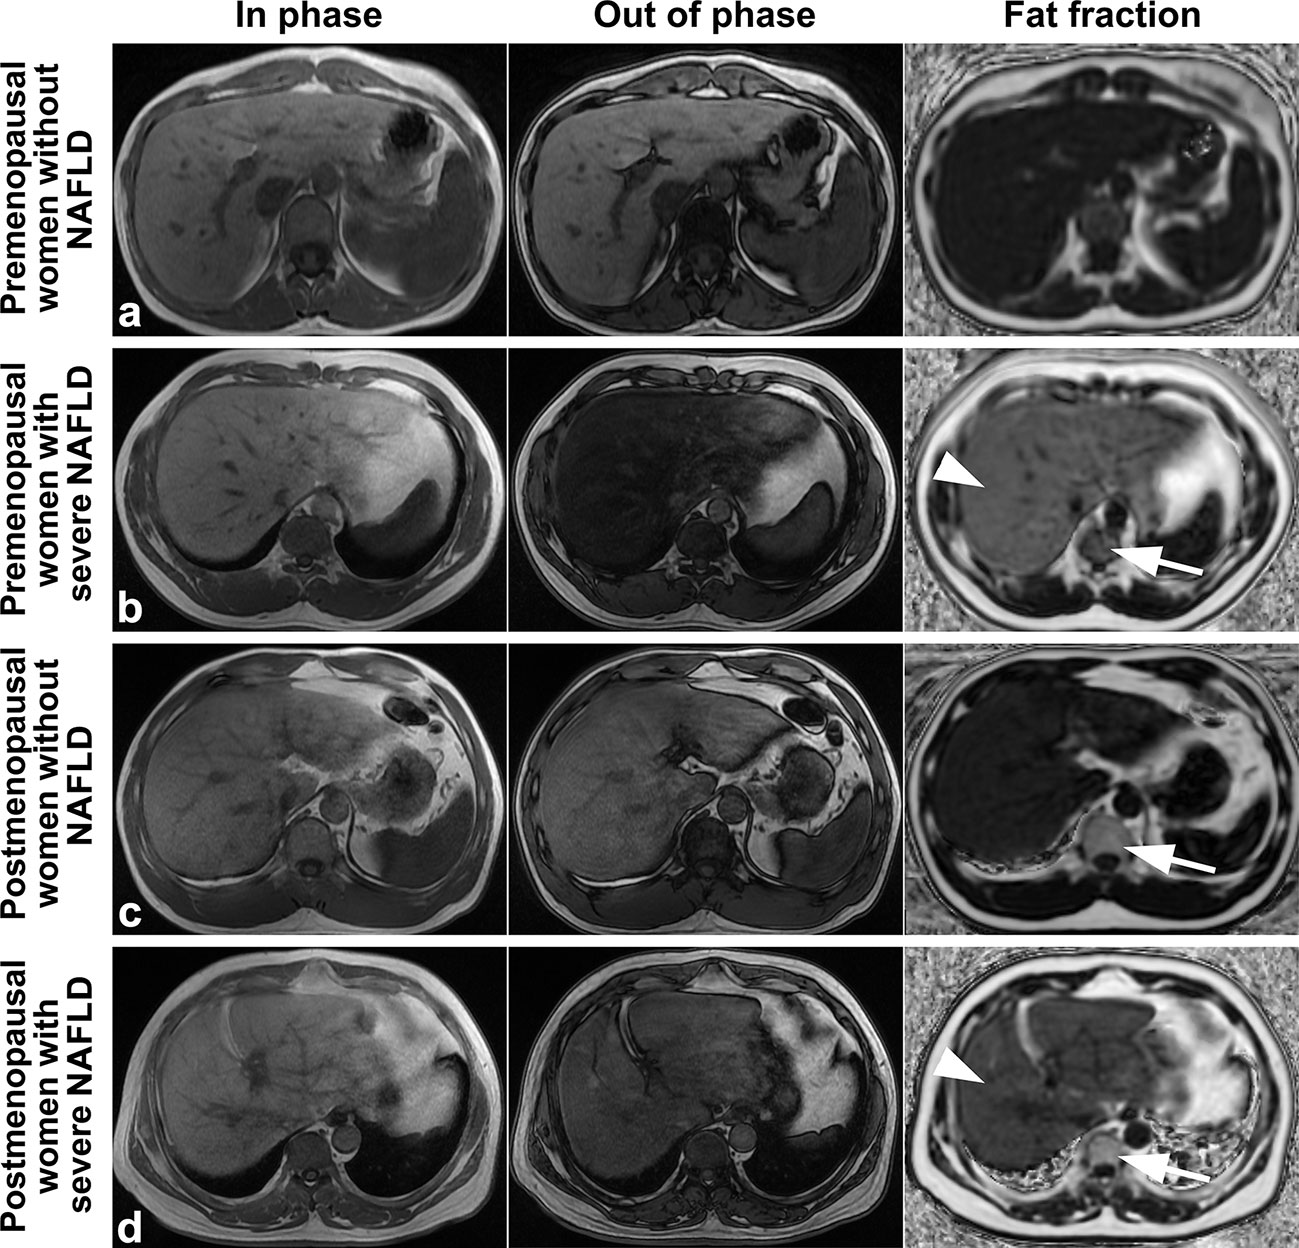
Figure 3 Images of premenopausal and postmenopausal women without NAFLD or with severe NAFLD (A) a 47 years old premenopausal woman without NAFLD; (B) a 45 years old premenopausal woman with severe NAFLD; (C) a 55 years old postmenopausal woman without NAFLD; and (D) a 57 years old postmenopausal woman with severe NAFLD). The fat deposition was visible by the decrease in the signal in the axial conventional T1-in phase and out-of-phase images of the mDIXON-Quant sequence and was measured in the fraction map of the IDEAL-IQ sequence. The example showed that fat deposition in a lumbar vertebra (arrows) increased after menopause in patients without NAFLD or with severe NAFLD (arrowheads). IDEAL-IQ, iterative decomposition of water and fat with echo asymmetry and least-squares estimation.
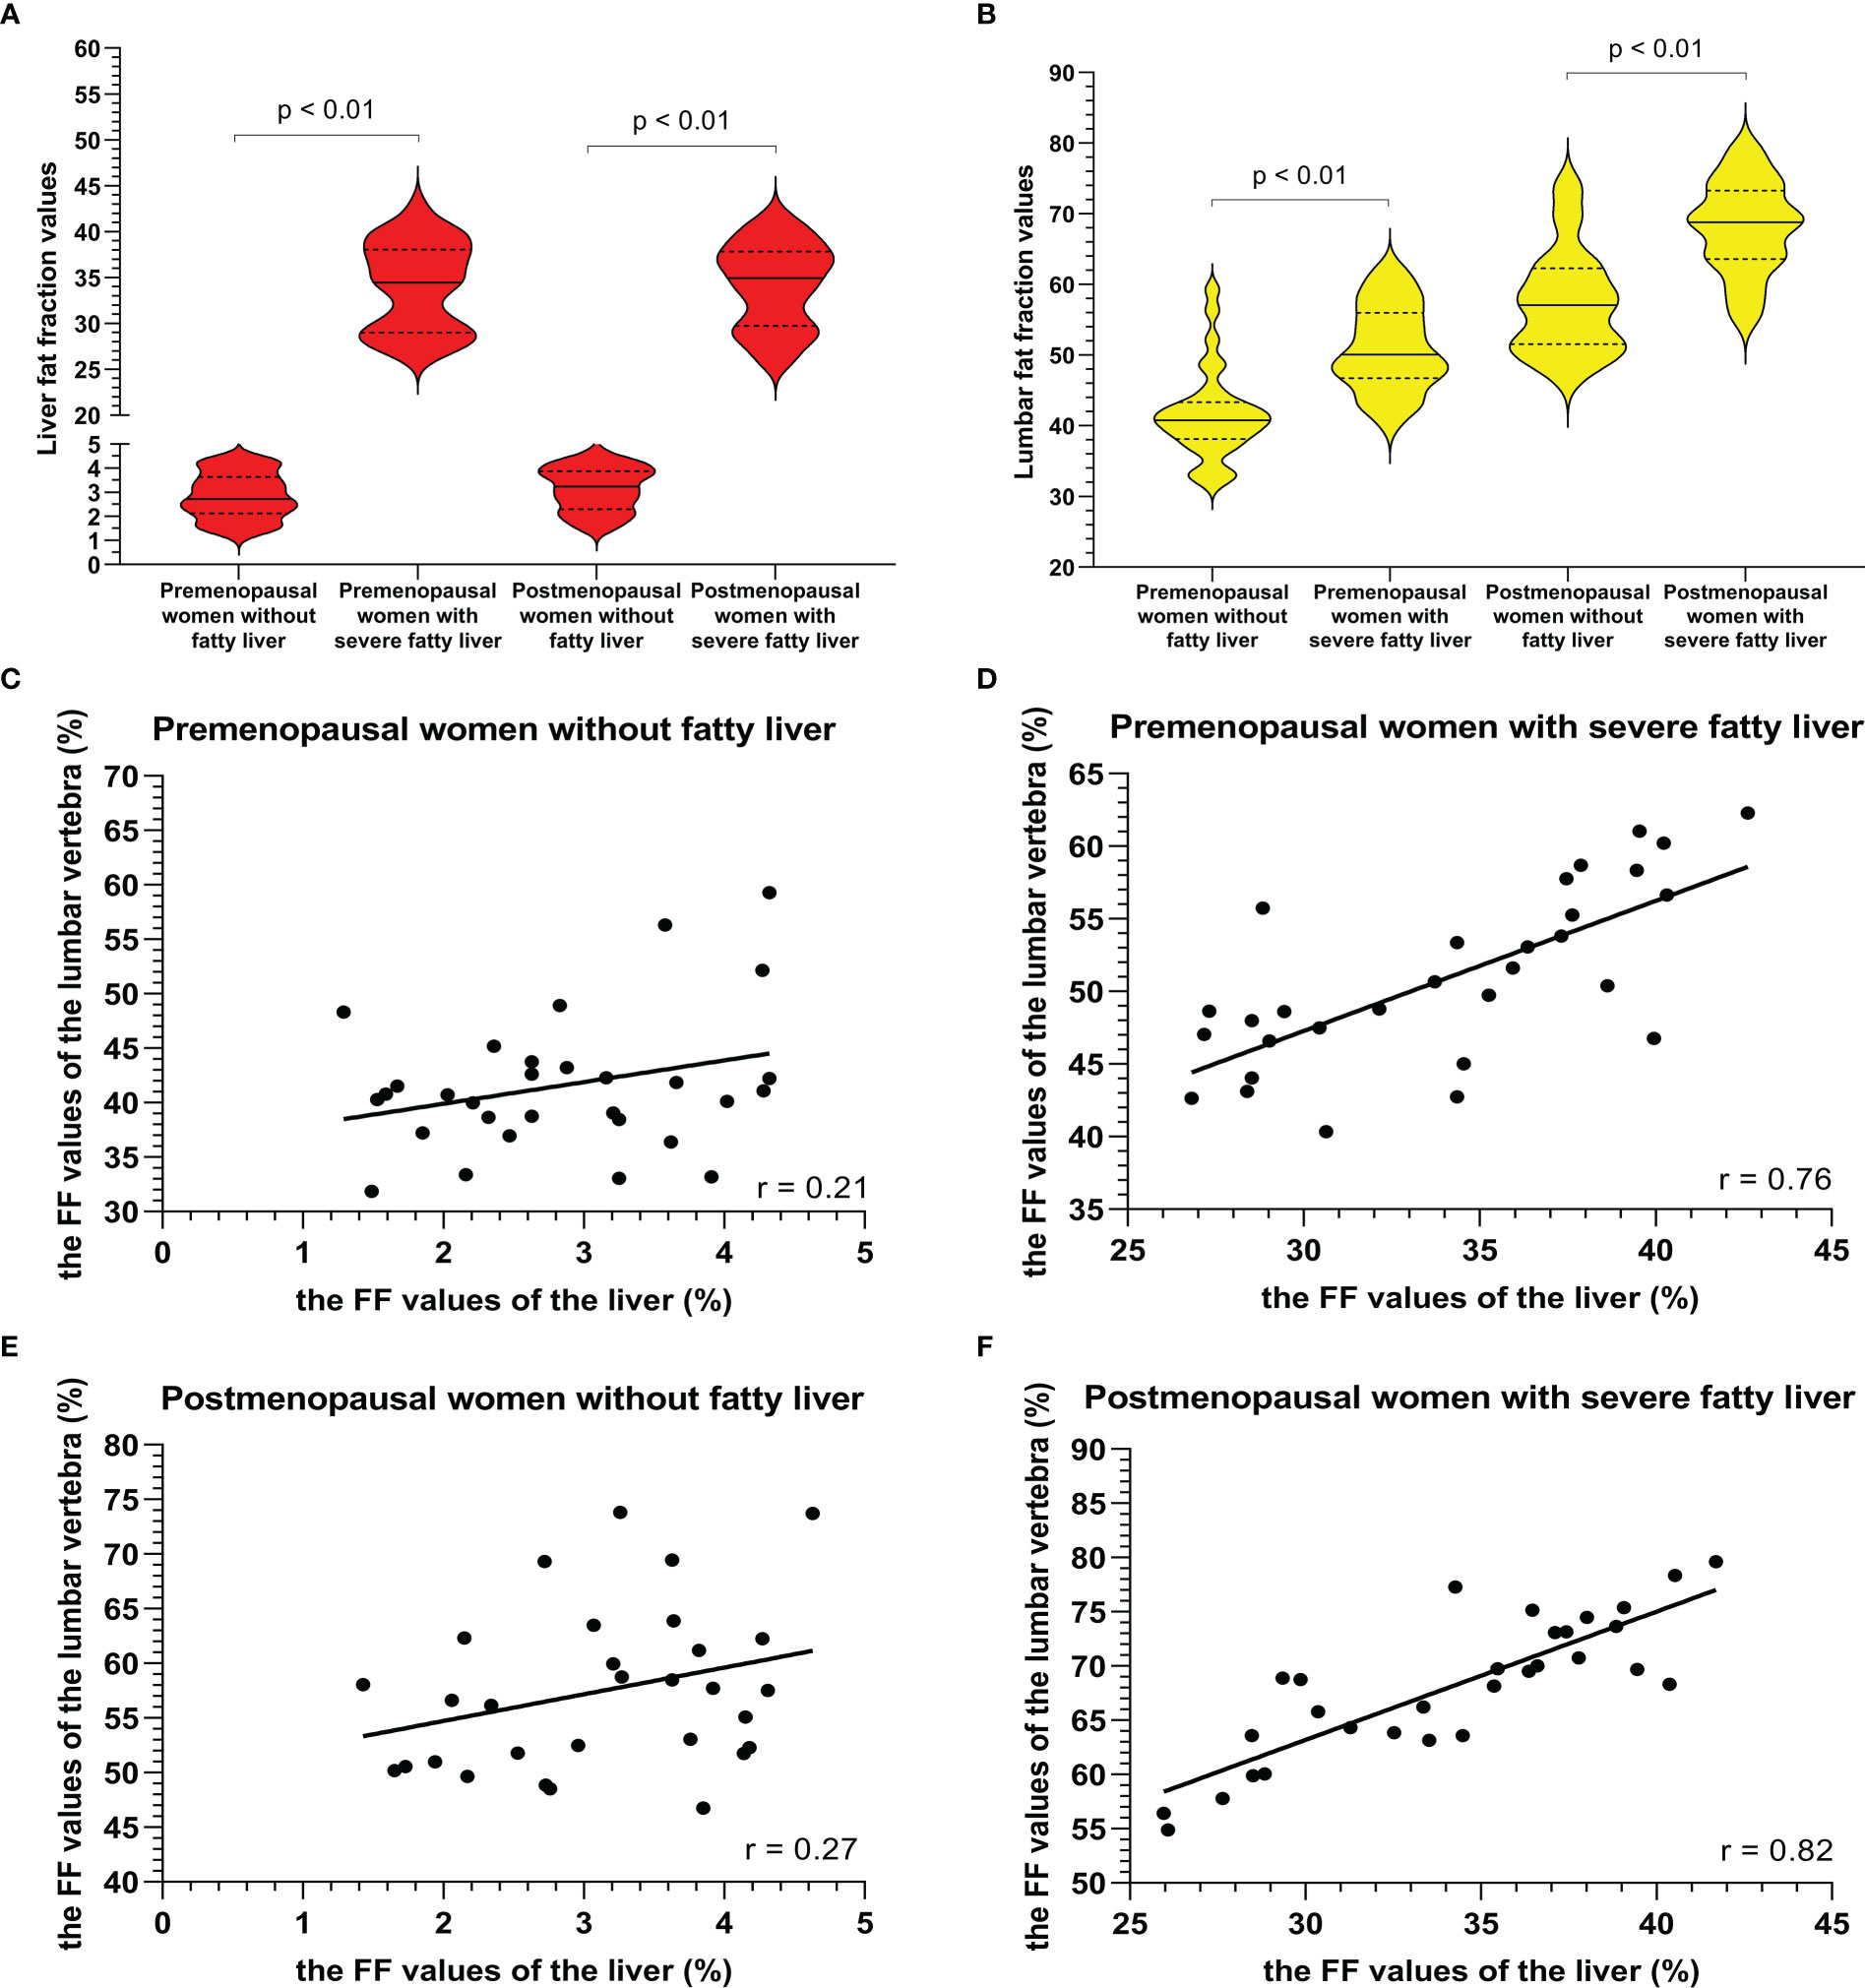
Figure 4 The violin plot analyzing the fat fraction values for the liver fat content (A) and lumbar fat content (B) in four groups (premenopausal women without NAFLD, premenopausal women with severe NAFLD, postmenopausal women without NAFLD, and postmenopausal women with severe NAFLD; 30 subjects in each group) confirmed that the lumbar fat content of patients with severe NAFLD more than that without NAFLD before menopause (p < 0.01) and after menopause (p < 0.01). The correlation plots for the correlations between FFlumbar and the FFliver (C–F) The correlation between FFlumbar and the FFliver in premenopausal (C) or postmenopausal (E) women without NAFLD was no different. A high correlation was detected between FFlumbar and the FFliver in women with severe NAFLD (premenopausal women: r = 0.76, p < 0.01; postmenopausal women: r = 0.82, p < 0.01) (D, F).
Examples of fat deposition in obese patients and normal-weight patients in the second cohort before or after menopause are shown in Figure 5. The mean FFlumbar and the FFSAT were measured separately in the four groups and are summarized in Table 5. Both in premenopausal women and postmenopausal women, no significant difference in the FFlumbar was observed obese patients and in normal-weight patients (premenopausal women: 44.15 ± 4.73 vs. 41.17 ± 5.49, p = 0.113, t = 5.18; postmenopausal women: 61.39 ± 6.75 vs. 57.15 ± 6.83, p = 0.092, t = 6.42). Postmenopausal women had higher FFlumbar than premenopausal women, regardless of the presence of obesity (obese: 61.39 ± 6.75 vs. 42.98 ± 4.73, p < 0.001, t = 12.23; normal weight: 57.15 ± 6.83 vs. 41.17 ± 5.49, p < 0.001, t = 9.99). Significant differences in the FF values of lumbar vertebra were observed between premenopausal women and postmenopausal women, but not between patients with obesity or without obesity (Figures 6A, B). No statistically significant correlation was found between the FFlumbar and the FFSAT in this cohort (Table 4; Figures 6C-F).
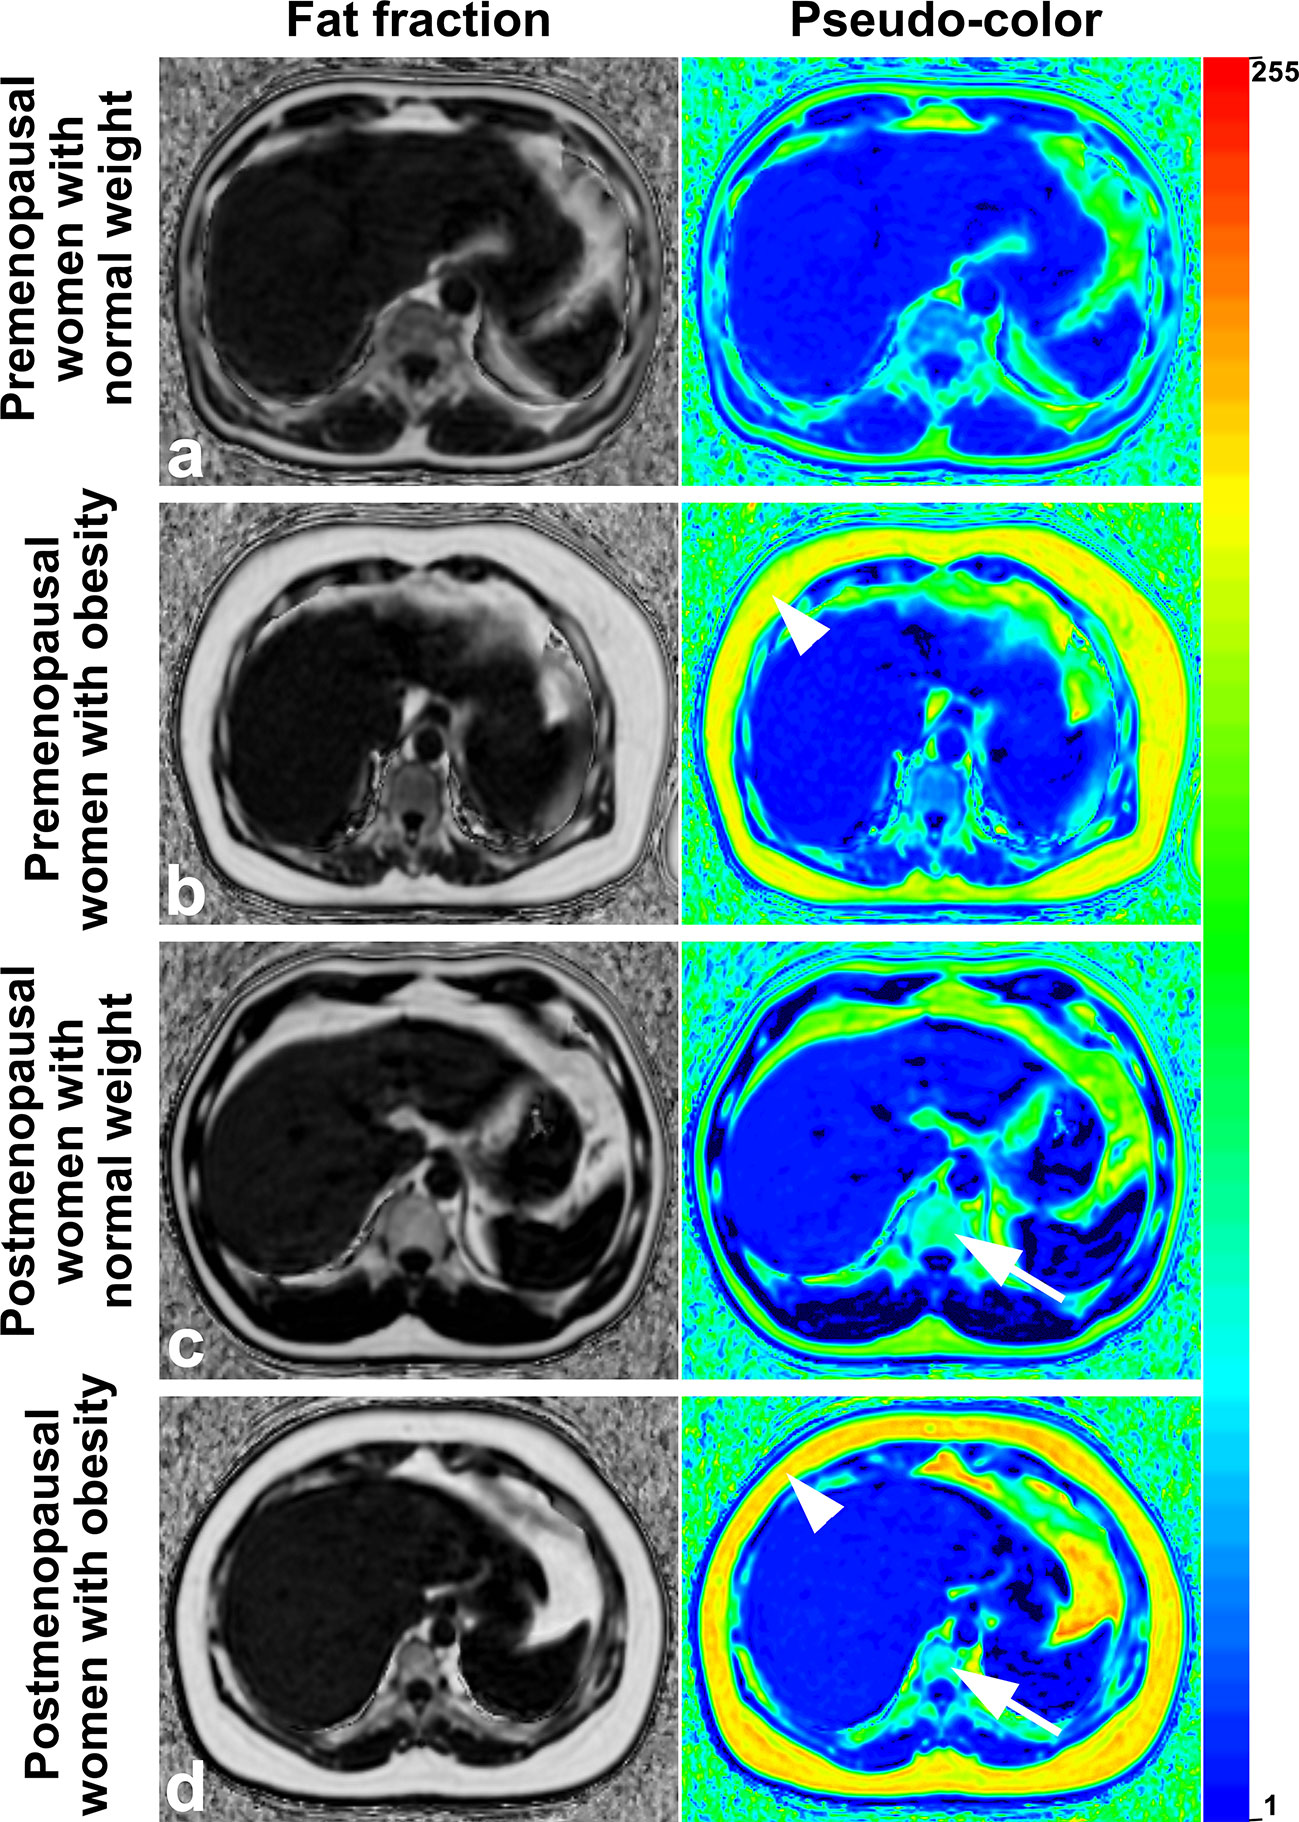
Figure 5 Images of premenopausal and postmenopausal women with obesity or normal weight patients (A) a 46 years old premenopausal woman with normal weight; (B) a 44 years old premenopausal woman with obesity; (C) a 53 years old postmenopausal woman with normal weight; and (D) a 56 years old postmenopausal woman with obesity). Fat deposition in subcutaneous sites (arrowheads) and lumbar vertebrae (arrows) was visible and was measured in the fraction map and pseudocolor images of the IDEAL-IQ sequence. Examples showed that fat deposition in the lumbar vertebra increased after menopause in both obese patients and normal-weight patients. IDEAL-IQ, iterative decomposition of water and fat with echo asymmetry and least-squares estimation.
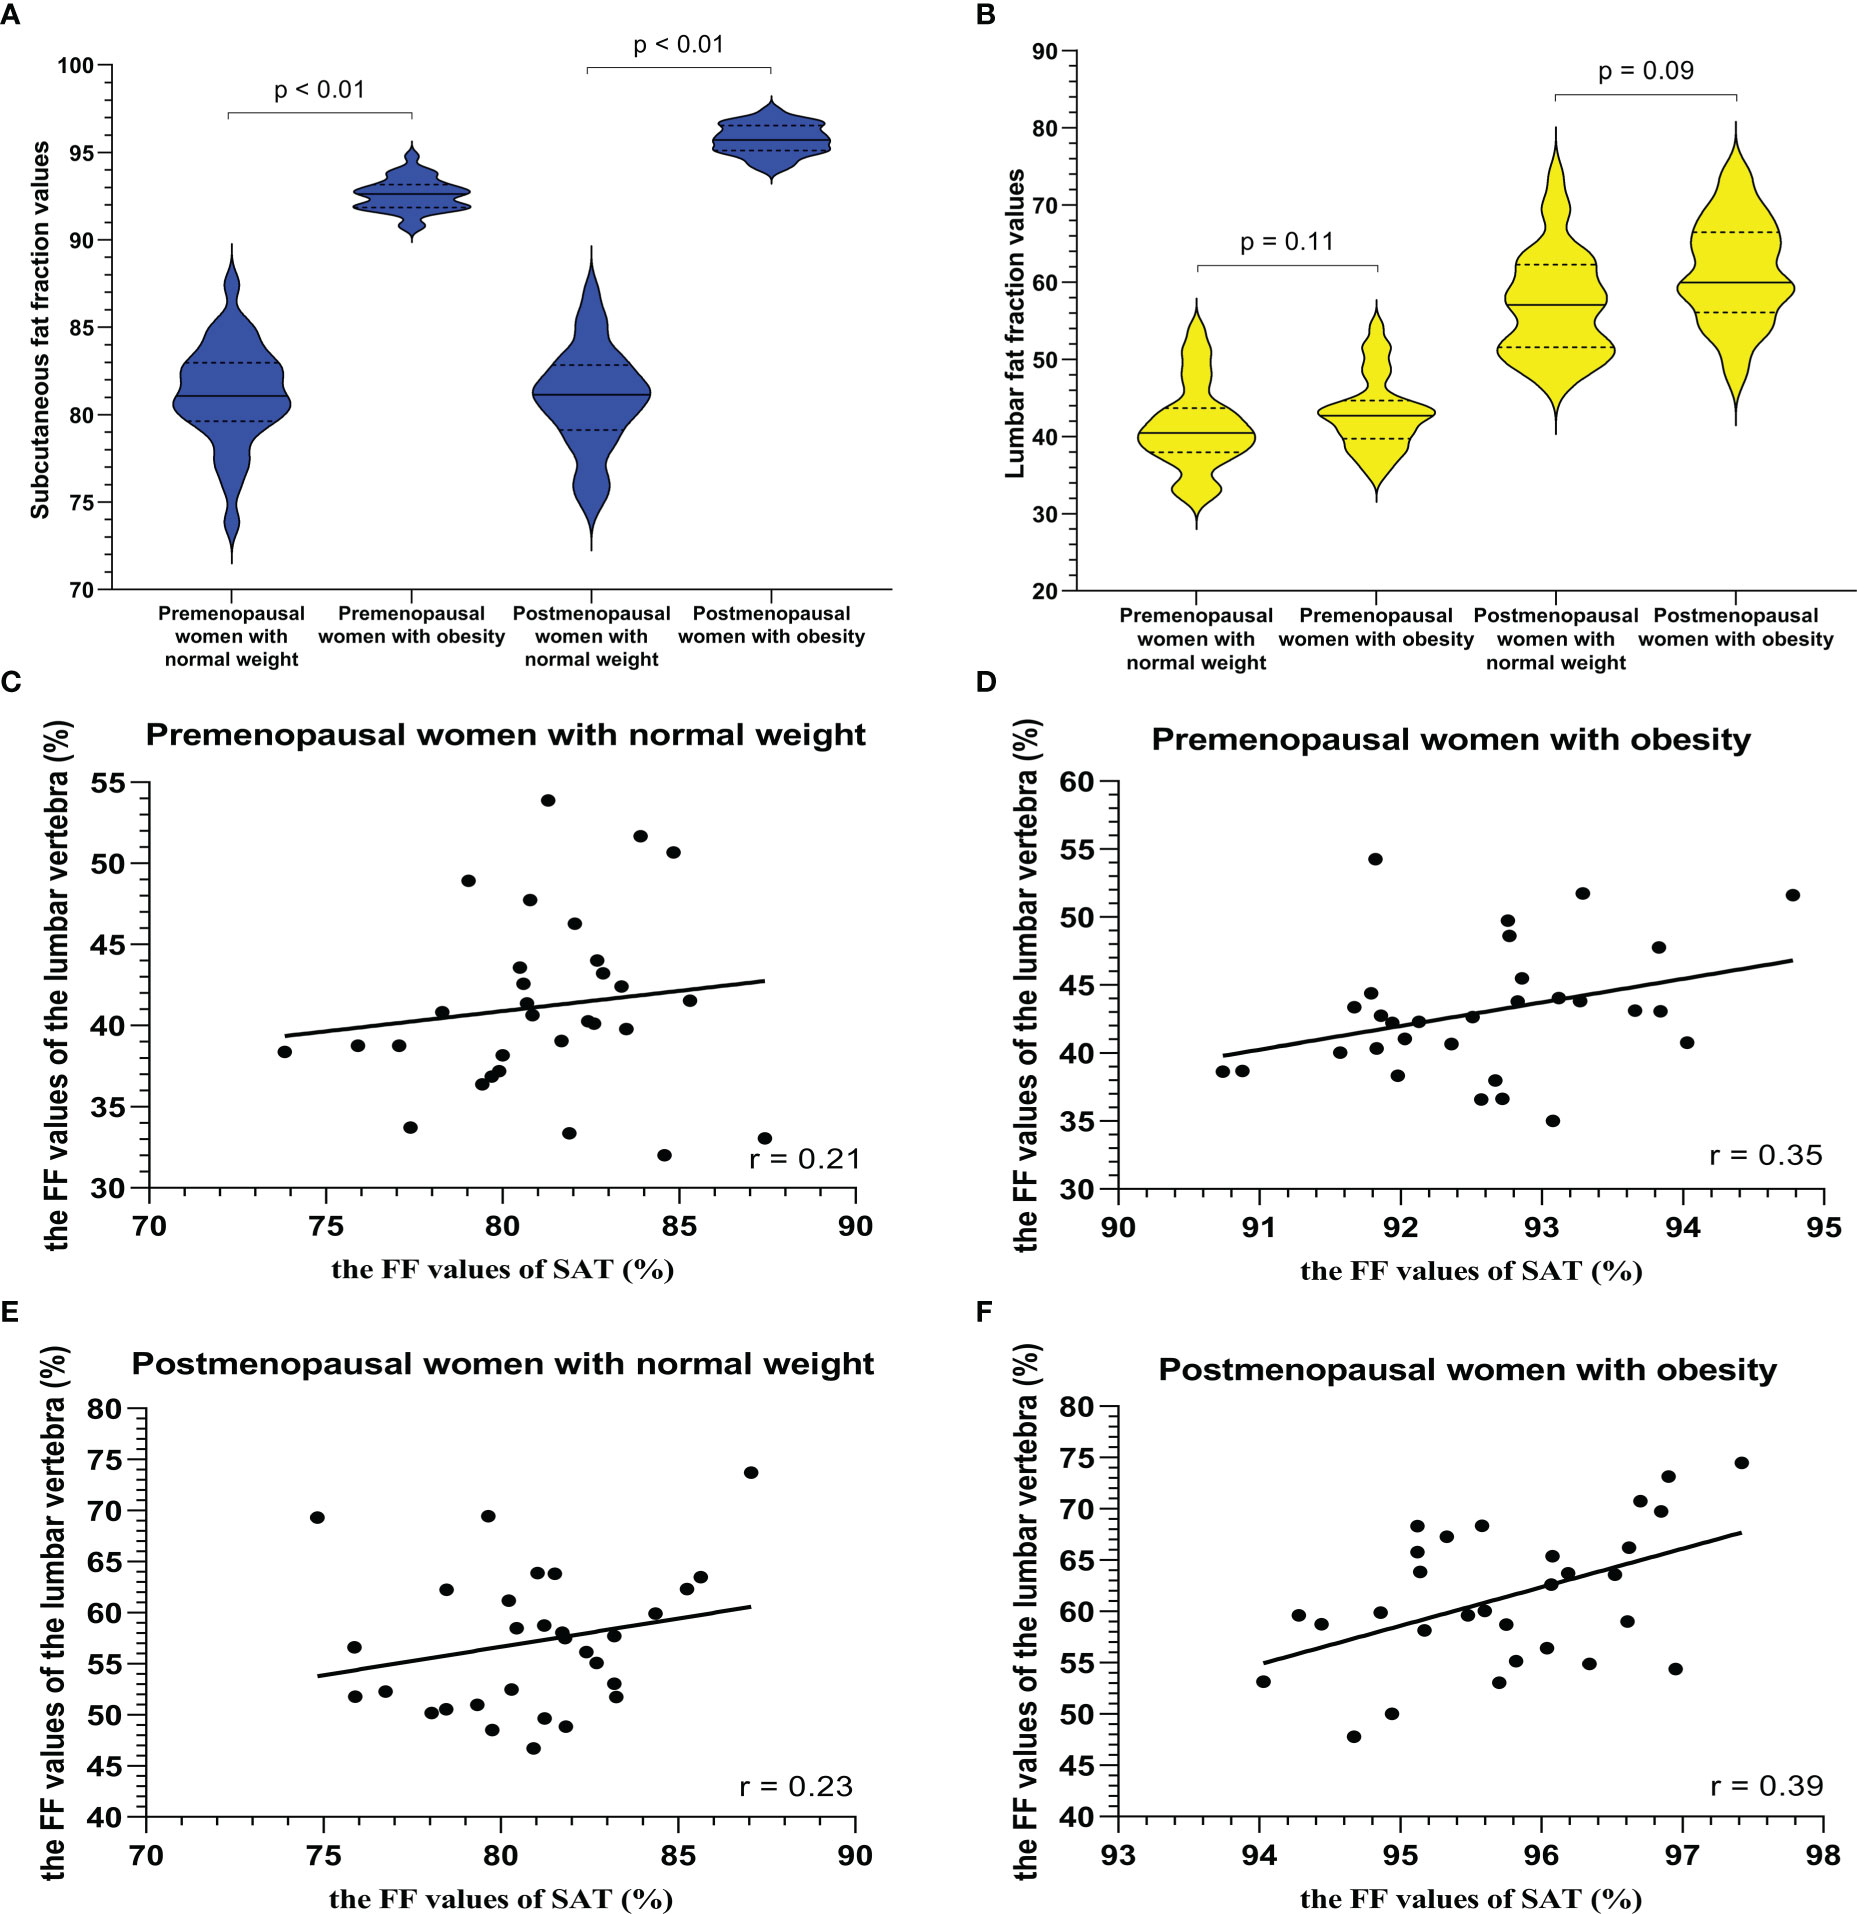
Figure 6 The violin plot analyzing fat fraction values for a subcutaneous site (A) and lumbar vertebra (B) in four groups (premenopausal women with normal weight, premenopausal women with obesity (BMI > 30 kg/m2), postmenopausal women with normal weight, and postmenopausal women with obesity (BMI > 30 kg/m2); 30 subjects in each group) confirmed that there is no statistical difference between the lumbar fat content of obese patients and that of normal-weight patients before menopause (p = 0.11) and after menopause (p = 0.09), and the subcutaneous fat content in the obese patients more than that in normal weight subjects (p < 0.01). BMI = body mass index. The correlation plots for the correlations between FFlumbar and the FFSAT (C–F) The correlation between FFlumbar and the FFSAT in premenopausal or postmenopausal women without or with obesity was no different (C–F).
Discussion
Our study focused on the association between abdominal adipose tissue and vertebral marrow fat in middle-aged women using the IDEAL-IQ methodology. Our analyses indicated that the vertebral marrow fat content was increased in postmenopausal women and that liver fat deposition potentially aggravated this situation. However, no statistically significant correlation was observed between vertebral marrow fat and subcutaneous fat deposition.
Traditionally, adipose tissue was postulated to exert a protective effect on bone. Researchers have speculated that this protective effect may be due to the stimulation of bone formation by the high mechanical load associated with overweight and obesity (11). However, a recent study showed that different local fat compartments are responsible for different metabolic effects and different effects on bone (30, 31). Wang et al. indicated that SAT has no relation to bone mineral density (BMD) in Chinese women < 55 years old (32). In contrast, Melissa et al. revealed that VAT and SAT had inverse associations with BMD in obese adolescent girls, with SAT exhibiting positive associations and VAT showing negative associations (33). In our study, SAT had no correction with vertebral marrow fat in postmenopausal women. Our results are consistent with a study of older Chinese women (32). However, the results are different from studies of obese adolescent girls (30, 33). This difference is probably because the population age in our study was much older than that in the studies of young girls, and the estrogen level of the population in our study was much lower than that in young girls.
NAFLD is strongly associated with abdominal obesity and metabolic disturbances (13). Preliminary data also suggest that NAFLD may be associated with other common and chronic debilitating conditions, particularly low BMD (14, 34). Our study found that liver fat deposition potentially aggravated vertebral marrow fat content in postmenopausal women. Adipose-modulated biochemical signals may explain some associations between fat mass and bone metabolism. Adipose tissue secretes various inflammatory cytokines and hormones, such as tumor necrosis factor-α and interleukin-6. These inflammatory cytokines promote osteoclast differentiation and activation and inhibit osteoclast apoptosis (34, 35). NAFLD may participate in bone metabolism via the systemic release of multiple proinflammatory, procoagulant, pro-oxidant and profibrogenic mediators and/or via the direct effect on hepatic and systemic insulin resistance (35, 36). The previousstudy also reported a positive correlation between hepatic fat content and bone marrow fat content in children with known or suspected NAFLD (37). However, the correlation in our study was much higher than that in this previous study. This difference is probably due to the subjects enrolled were not the same. In our study, subjects were over 45 years old which was much older than that in the previous. Besides, the patients with severe NAFLD were enrolled in our study. Estrogen level and varying degrees of NAFLD severity may be the reason for the above results.
Osteoporosis is characterized by a low BMD and progressive deterioration of the bone microarchitecture. The fat content in bone marrow is negatively correlated with BMD because the lost bone mass in the vertebral space is infilled with fatty bone marrow (38, 39). Therefore, the increase in vertebral marrow fat may reflect the progression of osteoporosis. Our findings are consistent with previous studies revealing that the menopause transition is associated with increased central adiposity (6, 36, 40) and confirmed a higher incidence of osteoporosis in postmenopausal women than in premenopausal women.
Our study has several limitations. First, our study was a retrospective cross-sectional study. As a cross-sectional study, we are unable to establish a causal relationship between liver fat and vertebral marrow fat. A further longitudinal prospective study with a large sample size is warranted to validate the current findings. Second, we were unable to control for the potential factors affecting bone loss and vertebral marrow fat deposition, such as dietary calcium intake or vitamin D supplementation. Third, this study did not focus on the thickness or volume of subcutaneous fat but on the percentage of fat in subcutaneous fat (mainly composed of fat and water). Finally, our study population included only middle-aged women, and our findings cannot be extrapolated to young women or the male skeleton. This approach limits the generalizability of the results but should not affect the internal validity.
Conclusions
This study describes a precise and noninvasive IDEAL-IQ technology to measure the fat content of vertebral marrow, SAT, and liver in pre- or postmenopausal women. FFlumbar was significantly higher in postmenopausal women than in premenopausal women. FFlumbar was higher in patients with severe NAFLD than in patients without NAFLD, but FFlumbar was not significantly different between obese patients with subcutaneous fat deposition and normal-weight patients, indicating that fat deposition in the vertebral marrow was significantly associated with liver fat deposition in postmenopausal women with severe NAFLD. Furthermore, our findings support the hypothesis that liver fat deposition is relative to vertebral fat deposition (which may cause osteoporosis) in postmenopausal women.
Data availability statement
The original contributions presented in the study are included in the article/Supplementary Material. Further inquiries can be directed to the corresponding authors.
Ethics statement
The studies involving human participants were reviewed and approved by the Institutional Research Ethics Committee of the Third Affiliated Hospital of Sun Yat-Sen University (02-005-01). The patients/participants provided their written informed consent to participate in this study.
Author contributions
C-SZ, R-MG: Data collection, Data analysis, Manuscript writing. H-QW, W-SL, X-WL, F-YZ, and XZ: Data collection. H-JH, Q-LL, L-SS, and R-MG: Data analysis, Manuscript editing. R-MG: Project development, Data analysis, Manuscript editing. All authors contributed to the article and approved the submitted version.
Funding
This study was supported by grants from the National Natural Science Foundation of China (No. 81801757), Guangdong Basic and Applied Basic Research Foundation (No. 2022A1515010369, 2019A1515012051), and Guangzhou Science and Technology Plan (No. 202201020421).
Conflict of interest
The authors declare that the research was conducted in the absence of any commercial or financial relationships that could be construed as a potential conflict of interest.
Publisher’s note
All claims expressed in this article are solely those of the authors and do not necessarily represent those of their affiliated organizations, or those of the publisher, the editors and the reviewers. Any product that may be evaluated in this article, or claim that may be made by its manufacturer, is not guaranteed or endorsed by the publisher.
Supplementary material
The Supplementary Material for this article can be found online at: https://www.frontiersin.org/articles/10.3389/fendo.2022.1099919/full#supplementary-material
References
1. Zhang LY, Li SL, Hao S, Yuan Z. Quantification of fat deposition in bone marrow in the lumbar vertebra by proton MRS and in-phase and out-of-phase MRI for the diagnosis of osteoporosis. J X-Ray Sci Technol (2016) 24(2):257–66. doi: 10.3233/XST-160549
2. Devlin MJ, Rosen CJ. The bone-fat interface: basic and clinical implications of marrow adiposity. Lancet Diabetes Endo (2015) 3(2):141–7. doi: 10.1016/S2213-8587(14)70007-5
3. Kugel H, Jung C, Schulte O, Heindel W. Age- and sex-specific differences in the h-1-spectrum of vertebral bone marrow. J Magn Reson Imaging (2001) 13(2):263–8. doi: 10.1002/1522-2586(200102)13:2<263::aid-jmri1038>3.0.co;2-m
4. Wang L, Yin L, Zhao Y, Su Y, Sun W, Liu Y, et al. Muscle density discriminates hip fracture better than computed tomography X-ray absorptiometry hip areal bone mineral density. J Cachexia Sarcopenia Muscle. (2020) 11(6):1799–812. doi: 10.1002/jcsm.12616
5. Justesen J, Stenderup K, Ebbesen EN, Mosekilde L, Steiniche T, Kassem M. Adipocyte tissue volume in bone marrow is increased with aging and in patients with osteoporosis. Biogerontology (2001) 2(3):165–71. doi: 10.1023/a:1011513223894
6. Khosla S, Monroe DG. Regulation of bone metabolism by sex steroids. Cold Spring Harb Perspect Med (2018) 8(1):a031211. doi: 10.1101/cshperspect.a031211
7. Khosla S, Oursler MJ, Monroe DG. Estrogen and the skeleton. Trends Endocrinol Metab (2012) 23(11):576–81. doi: 10.1016/j.tem.2012.03.008
8. van der Leeuw J, Wassink AM, van der Graaf Y, Westerveld HE, Visseren FL. Second manifestations of ARTerial disease (SMART) study group. age-related differences in abdominal fat distribution in premenopausal and postmenopausal women with cardiovascular disease. Menopause (2013) 20(4):409–17. doi: 10.1097/gme.0b013e31827212a5
9. Lv Y, Wang F, Sheng Y, Xia F, Jin Y, Ding G, et al. Estrogen supplementation deteriorates visceral adipose function in aged postmenopausal subjects via Gas5 targeting IGF2BP1. Exp Gerontol. (2022) 163:111796. doi: 10.1016/j.exger.2022.111796
10. Gkastaris K, Goulis DG, Potoupnis M, Anastasilakis AD, Kapetanos G. Obesity, osteoporosis and bone metabolism. J Musculoskelet Neuronal Interact (2020) 20(3):372–81.
11. Yang SM, Nguyen ND, Center JR, Eisman JA, Nguyen TV. Association between abdominal obesity and fracture risk: a prospective study. J Clin Endocr Metab (2013) 98(6):2478–83. doi: 10.1210/jc.2012-2958
12. Yoo HJ, Park MS, Yang SJ, Kim TN, Lim K, Kang HJ, et al. The differential relationship between fat mass and bone mineral density by gender and menopausal status. J Bone Miner Metab (2012) 30(1):47–53. doi: 10.1007/s00774-011-0283-7
13. Andronescu CI, Purcarea MR, Babes PA. Nonalcoholic fatty liver disease: epidemiology, pathogenesis and therapeutic implications. J Med Life (2018) 11(1):20–3.
14. Zubáňová V, Červinková Z, Kučera O, Palička V. The connection between MicroRNAs from visceral adipose tissue and non-alcoholic fatty liver disease. Acta Med (2021) 64(1):1–7. doi: 10.14712/18059694.2021.1
15. Targher G, Lonardo A, Rossini M. Nonalcoholic fatty liver disease and decreased bone mineral density: is there a link? J Endocrinol Invest (2015) 38(8):817–25. doi: 10.1007/s40618-015-0315-6
16. Schellinger D, Lin CS, Fertikh D, Lee JS, Lauerman WC, Henderson F, et al. Normal lumbar vertebrae: anatomic, age, and sex variance in subjects at proton MR spectroscopy - initial experience. Radiology (2000) 215(3):910–6. doi: 10.1148/radiology.215.3.r00jn42910
17. Kim H, Taksali SE, Dufour S, Befroy D, Goodman TR, Petersen KF, et al. Comparative MR study of hepatic fat quantification using single-voxel proton spectroscopy, two-point dixon and three-point IDEAL. Magn Reson Med (2008) 59(3):521–7. doi: 10.1002/mrm.21561
18. Aoki T, Yamaguchi S, Kinoshita S, Hayashida Y, Korogi Y. Quantification of bone marrow fat content using iterative decomposition of water and fat with echo asymmetry and least-squares estimation (IDEAL): reproducibility, site variation and correlation with age and menopause. Br J Radiol (2016) 89(1065):20150538. doi: 10.1259/bjr.20150538
19. Kang GH, Cruite I, Shiehmorteza M, Wolfson T, Gamst AC, Hamilton G, et al. Reproducibility of MRI-determined proton density fat fraction across two different MR scanner platforms. J Magn Reson Imaging (2011) 34(4):928–34. doi: 10.1002/jmri.22701
20. Johnson BL, Schroeder ME, Wolfson T, Gamst AC, Hamilton G, Shiehmorteza M, et al. Effect of flip angle on the accuracy and repeatability of hepatic proton density fat fraction estimation by complex data-based, T1-independent, T2*-corrected, spectrum-modeled MRI. J Magn Reson Imaging (2014) 39(2):440–7. doi: 10.1002/jmri.24153
21. Tang A, Desai A, Hamilton G, Wolfson T, Gamst A, Lam J, et al. Accuracy of MR imaging-estimated proton density fat fraction for classification of dichotomized histologic steatosis grades in nonalcoholic fatty liver disease. Radiology (2015) 274(2):416–25. doi: 10.1148/radiol.14140754
22. Idilman IS, Aniktar H, Idilman R, Kabacam G, Savas B, Elhan A, et al. Hepatic steatosis: quantification by proton density fat fraction with MR imaging versus liver biopsy. Radiology (2013) 267(3):767–75. doi: 10.1148/radiol.13121360
23. Permutt Z, Le TA, Peterson MR, Seki E, Brenner DA, Sirlin C, et al. Correlation between liver histology and novel magnetic resonance imaging in adult patients with nonalcoholic fatty liver disease - MRI accurately quantifies hepatic steatosis in NAFLD. Aliment Pharm Ther (2012) 36(1):22–9. doi: 10.1111/j.1365-2036.2012.05121.x
24. Guo YH, Chen YJ, Zhang XT, Mei YJ, Yi PW, Wang Y, et al. Magnetic susceptibility and fat content in the lumbar spine of postmenopausal women with varying bone mineral density. J Magn Reson Imaging (2019) 49(4):1020–8. doi: 10.1002/jmri.26279
25. Idilman IS, Tuzun A, Savas B, Elhan AH, Celik A, Idilman R, et al. Quantification of liver, pancreas, kidney, and vertebral body MRI-PDFF in nonalcoholic fatty liver disease. Abdom Imaging (2015) 40(6):1512–9. doi: 10.1007/s00261-015-0385-0
26. Shen N, Li XY, Zheng S, Zhang L, Fu Y, Liu XM, et al. Automated and accurate quantification of subcutaneous and visceral adipose tissue from magnetic resonance imaging based on machine learning. Magn Reson Imaging (2019) 64:28–36. doi: 10.1016/j.mri.2019.04.007
27. Gibson CJ, Huang AJ, McCaw B, Subak LL, Thom DH, Van Den Eeden SK. Associations of intimate partner violence, sexual assault, and posttraumatic stress disorder with menopause symptoms among midlife and older women. JAMA Intern Med (2019) 179(1):80–7. doi: 10.1001/jamainternmed.2018.5233
28. Guo Z, Blake GM, Li K, Liang W, Zhang W, Zhang Y, et al. Liver fat content measurement with quantitative CT validated against MRI proton density fat fraction: a prospective study of 400 healthy volunteers. Radiology (2020) 294(1):89–97. doi: 10.1148/radiol.2019190467
29. Dikaiou P, Björck L, Adiels M, Lundberg CE, Mandalenakis Z, Manhem K, et al. Obesity, overweight and risk for cardiovascular disease and mortality in young women. Eur J Prev Cardiol (2021) 28(12):1351–9. doi: 10.1177/2047487320908983
30. Crivelli M, Chain A, da Silva ITF, Waked AM, Bezerra FF. Association of visceral and subcutaneous fat mass with bone density and vertebral fractures in women with severe obesity. J Clin Densitom. (2021) 24(3):397–405. doi: 10.1016/j.jocd.2020.10.005
31. Yamaguchi T, Kanazawa I, Yamamoto M, Kurioka S, Yamauchi M, Yano S, et al. Associations between components of the metabolic syndrome versus bone mineral density and vertebral fractures in patients with type 2 diabetes. Bone (2009) 45(2):174–9. doi: 10.1016/j.bone.2009.05.003
32. Wang L, Wang W, Xu L, Cheng XG, Ma YM, Liu D, et al. Relation of visceral and subcutaneous adipose tissue to bone mineral density in Chinese women. Int J Endocrinol (2013) 2013:378632. doi: 10.1155/2013/378632
33. Russell M, Mendes N, Miller KK, Rosen CJ, Lee H, Klibanski A, et al. Visceral fat is a negative predictor of bone density measures in obese adolescent girls. J Clin Endocrinol Metab (2010) 95(3):1247–55. doi: 10.1210/jc.2009-1475
34. Zhu X, Yan H, Chang X, Xia M, Zhang L, Wang L, et al. Association between non-alcoholic fatty liver dis-ease-associated hepatic fibrosis and bone mineral density in postmenopausal women with type 2 diabetes or impaired glucose regulation. BMJ Open Diabetes Res Care (2020) 8(1):e000999. doi: 10.1136/bmjdrc-2019-000999
35. Cao JJ. Effects of obesity on bone metabolism. J Orthop Surg Res (2011) 6:30. doi: 10.1186/1749-799X-6-30
36. Yu AH, Duan-Mu YY, Zhang Y, Wang L, Guo Z, Yu YQ, et al. Correlation between non-alcoholic fatty liver disease and visceral adipose tissue in non-obese Chinese adults: A CT evaluation. Korean J Radiol (2018) 19(5):923–9. doi: 10.3348/kjr.2018.19.5.923
37. Yu NY, Wolfson T, Middleton MS, Hamilton G, Gamst A, Angeles JE, et al. Bone marrow fat content is correlated with hepatic fat content in paediatric non-alcoholic fatty liver disease. Clin Radiol (2017) 72(5):425.e9–425.e14. doi: 10.1016/j.crad.2016.11.017
38. Di Iorgi N, Rosol M, Mittelman SD, Gilsanz V. Reciprocal relation between marrow adiposity and the amount of bone in the axial and appendicular skeleton of young adults. J Clin Endocr Metab (2008) 93(6):2281–6. doi: 10.1210/jc.2007-2691
39. Schwartz AV, Sigurdsson S, Hue TF, Lang TF, Harris TB, Rosen CJ, et al. Vertebral bone marrow fat associated with lower trabecular BMD and prevalent vertebral fracture in older adults. J Clin Endocr Metab (2013) 98(6):2294–300. doi: 10.1210/jc.2012-3949
Keywords: magnetic resonance imaging, subcutaneous fat, severe fatty liver, postmenopausal women, fat fraction
Citation: Zheng C-S, Wen H-Q, Lin W-S, Luo X-W, Shen L-S, Zhou X, Zou F-Y, Li Q-L, Hu H-J and Guo R-M (2023) Quantification of lumbar vertebral fat deposition: Correlation with menopausal status, non-alcoholic fatty liver disease and subcutaneous adipose tissue. Front. Endocrinol. 13:1099919. doi: 10.3389/fendo.2022.1099919
Received: 16 November 2022; Accepted: 27 December 2022;
Published: 12 January 2023.
Edited by:
Ling Wang, Beijing Jishuitan Hospital, ChinaReviewed by:
Yuanyuan Qin, Huazhong University of Science and Technology, ChinaSiqi Wang, Nanjing Medical University, China
Copyright © 2023 Zheng, Wen, Lin, Luo, Shen, Zhou, Zou, Li, Hu and Guo. This is an open-access article distributed under the terms of the Creative Commons Attribution License (CC BY). The use, distribution or reproduction in other forums is permitted, provided the original author(s) and the copyright owner(s) are credited and that the original publication in this journal is cited, in accordance with accepted academic practice. No use, distribution or reproduction is permitted which does not comply with these terms.
*Correspondence: Qing-Ling Li, bGlxaW5nbDNAbWFpbC5zeXN1LmVkdS5jbg==; Hui-Jun Hu, aHVodWlqdW5AbWFpbC5zeXN1LmVkdS5jbg==; Ruo-Mi Guo, Z3VvcnVvbWk4NkBtYWlsLnN5c3UuZWR1LmNu
†These authors have contributed equally to this work
 Chu-Shan Zheng
 Hui-Quan Wen
 Wu-Sheng Lin1†
 Qing-Ling Li
 Ruo-Mi Guo