 Danrong Zhong
 Dongchen Liu
 Yongtian Guo
 Haoyin Huang
 Lu Li1,3*
 Suli Huang
95% of researchers rate our articles as excellent or good
Learn more about the work of our research integrity team to safeguard the quality of each article we publish.
Find out more
ORIGINAL RESEARCH article
Front. Endocrinol. , 21 December 2022
Sec. Clinical Diabetes
Volume 13 - 2022 | https://doi.org/10.3389/fendo.2022.1060442
This article is part of the Research Topic Endocrine Disruptors, Epigenetics, and Diabetes: An Intricate Relationship View all 7 articles
Background: Metabolic syndrome (MetS) has attracted great interest, with an increasing prevalence. Recent studies have shown that the serum uric acid-to-creatinine ratio (SUACr) might be an excellent biomarker for MetS risk prediction in diabetic patients and postmenopausal women. However, the relationship between SUACr and MetS in a middle-aged and older population remains unclear.
Methods: A total of 1277 participants were included in this cross-sectional study. Logistic regression modelling was performed to assess the association between SUACr and MetS in the total population. The dose–response relationship of SUACr and MetS was further assessed by a restricted cubic spline model (RCS). Furthermore, to explore the relationships between the levels of SUACr and the number of metabolic components, analysis of covariance (ANCOVA) was applied.
Results: The levels of SUACr were lower in the non-MetS participants (OR 1.60, 95% CI 1.36 to 1.89; P<0.001),. Positive and dose–response relationships were further confirmed by the RCS model. We also found that, with increased number of components, the SUACr tended to increase. Moreover, values of SUACr were strongly related to levels of triglycerides (TGs), body mass index (BMI), blood glucose levels, systolic blood pressure/diastolic blood pressure (SBP/DBP), and hypertension. In addition, the positive association between SUACr and MetS also occurred in those patients with normal uric acid levels.
Conclusion: Elevated values of SUACr were strongly associated with an increased risk of MetS; this positive relationship remained in those individuals with normal uric acid levels.
The metabolic syndrome (MetS) is characterized as a clustering of metabolic disorders, including hypertension, hyperglycemia, overweight/obesity, high levels of triglyceride (TGs), or low levels of high-density lipoprotein cholesterol (HDL-c) (1). The MetS had been proven to be associated with an increased risk of diabetes and cardiovascular mortality and morbidity. MetS patients also exhibited a four times greater risk of fatal coronavirus disease 2019 (COVID-19) outcomes compared with MetS-free participants (2).
Apart from these serious life-threatening conditions, emerging prevalence data have shown that MetS is becoming increasingly common in both economically developing and developed countries. According to a report based on the data from 31 provinces in China, Lu et al. indicated that MetS affects nearly 454 million adults in mainland China, and the prevalence of MetS was 13.3% in those aged 35–64 years (3). In addition, nearly 35% of US adults have suffered from MetS and 50% of those were older than 60 years (4). Greater awareness of MetS and its health burden may have contributed to improvements in optimizing treatment and new biomarkers of this disease given the prevalence rate in the world.
Serum uric acid (SUA) is a major product of purine metabolism (5), and has been shown to be a risk factor for various adverse health outcomes, such as cardiovascular disease, stroke, metabolic syndrome, and metabolic-associated fatty liver disease (6–9). However, conflicting research exists (10–12). The controversial conclusions may be explained by the fact that levels of endogenous uric acid depend on renal clearance function. Consequently, renal function-normalized uric acid (the serum uric acid-to-creatinine ratio, SUACr) has emerged as a new biomarker and is regarded as a superior indicator of net uric acid production (13–16). Several studies have indicated that SUACr is associated with metabolic disorders and is a predictor for total mortality (13, 14). Previous researchers have indicated that SUACr was more sensitive than SUA in relation to MetS in diabetic patients and postmenopausal women (15, 16). To date, the relation between SUACr and MetS among a middle-aged and older population has not been reported, especially the effect on MetS within normal uric acid concentrations. In the present study, we aim to investigate the association between SUACr and MetS and its components in middle-aged and older Chinese people.
This cross-sectional research was a retrospective study that was conducted with 1277 patients who were aged between 31 and 91 years. All participants were recruited in the Eighth Affiliated Hospital of Sun Yat-Sen University by routine physical examination between 2012 and 2017. Patients with malignancies or neurological disease, peripheral arterial occlusive disease, and cerebrovascular disease were excluded. All participants were outpatients. Informed consent was obtained from all enrolled participants. The ethics committees of the Shenzhen Center for Disease Control and Prevention approved this research.
A structural questionnaire was applied to collect demographic information including gender, age, smoking and drinking status, history of diseases, and medical treatments. The anthropometric indices were measured by well-trained healthcare workers following standardized protocols. The collected measurements included weight, height, and diastolic and systolic blood pressure. Blood samples were collected and tested for different indexes by laboratory assays.
According to the Chinese Diabetes Society Criteria (17), the patients were defined as having MetS if they had three or more of the following:
(1) a body mass index (BMI) ≥25 kg/m2;
(2) were receiving treatment for hypertension or had a diastolic blood pressure (DBP) ≥90mm/Hg or (and) a systolic blood pressure (SBP) ≥140mm/Hg;
(3) had been diagnosed with diabetes or had a fasting plasma glucose (FBG) concentration ≥6.1mmol/l;
(4) were female and had HDL-c levels <1.0 mmol/l, were male and had a HDL-c concentration <0.9 mmol/l, or/and had TG levels ≥1.7 mmol/l.
Characteristics (from laboratory assessments) and general information of the study participants were described as medians with interquartile ranges (IQRs) or means ± standard deviations (SDs), or frequencies with percentages. Differences between groups were examined using the Wilcoxon rank-sum test or the Student’s t-test, or chi-squared test based on the characteristics of the data. Spearman’s rank correlation test was conducted to assess the correlations between SUACr and the components of MetS.
The logistic regression models were used to calculate the odds ratios (ORs) and 95% confidence intervals (95% CIs) for the associations between SUACr and the prevalence of MetS. The covariates adjusted for in the logistic regression model included gender, age, smoking and drinking status, and eGFR. To explore the dose–response relationships between SUACr levels and the risk of MetS, we performed the restricted cubic spline (RCS) with knots at the 10th, 50th and 90th percentiles, and the reference values (OR=1) were set at the 10th percentiles. Furthermore, the difference of SUACr in the participants with a diverse number of MetS components was assessed by the analysis of covariance (ANCOVA), and presented as estimated marginal means with 95% CIs. To evaluate the associations between SUACr and the different combinations of MetS, we classified the components of MetS according to the definition of the disease; multivariable logistic regression was applied. In addition, to evaluate the associations between SUACr levels and the components of MetS, a logistic regression model was applied, the SUACr levels were distributed into quartiles according to the concentrations of the total population, and the covariates were as same as the model 1.
Statistical analyses were conducted using R 3.33 (Lucent Technologies, USA) and SPSS 16.0 (Statistical Package for the Social Science, Chicago, IL, UAS). A two-tailed p-value <0.05 was considered to be statistically significant.
The general characteristics of the study participants are summarized in Table 1. Participants with MetS were older than non-MetS (P<0.001), and more men were found in the MetS cohort (P=0.003). Participants with MetS presented with higher SBP, DBP and BMI and higher levels of TGs, FBG, uric acid, and SUACr (P<0.001) than the non-MetS participants. They also showed lower levels of HDL-c and lower eGFRs than the non-MetS individuals (P=0.002, and P=0.010, respectively). The prevalence of diabetes or hypertension was both higher in the MetS group (P<0.001).
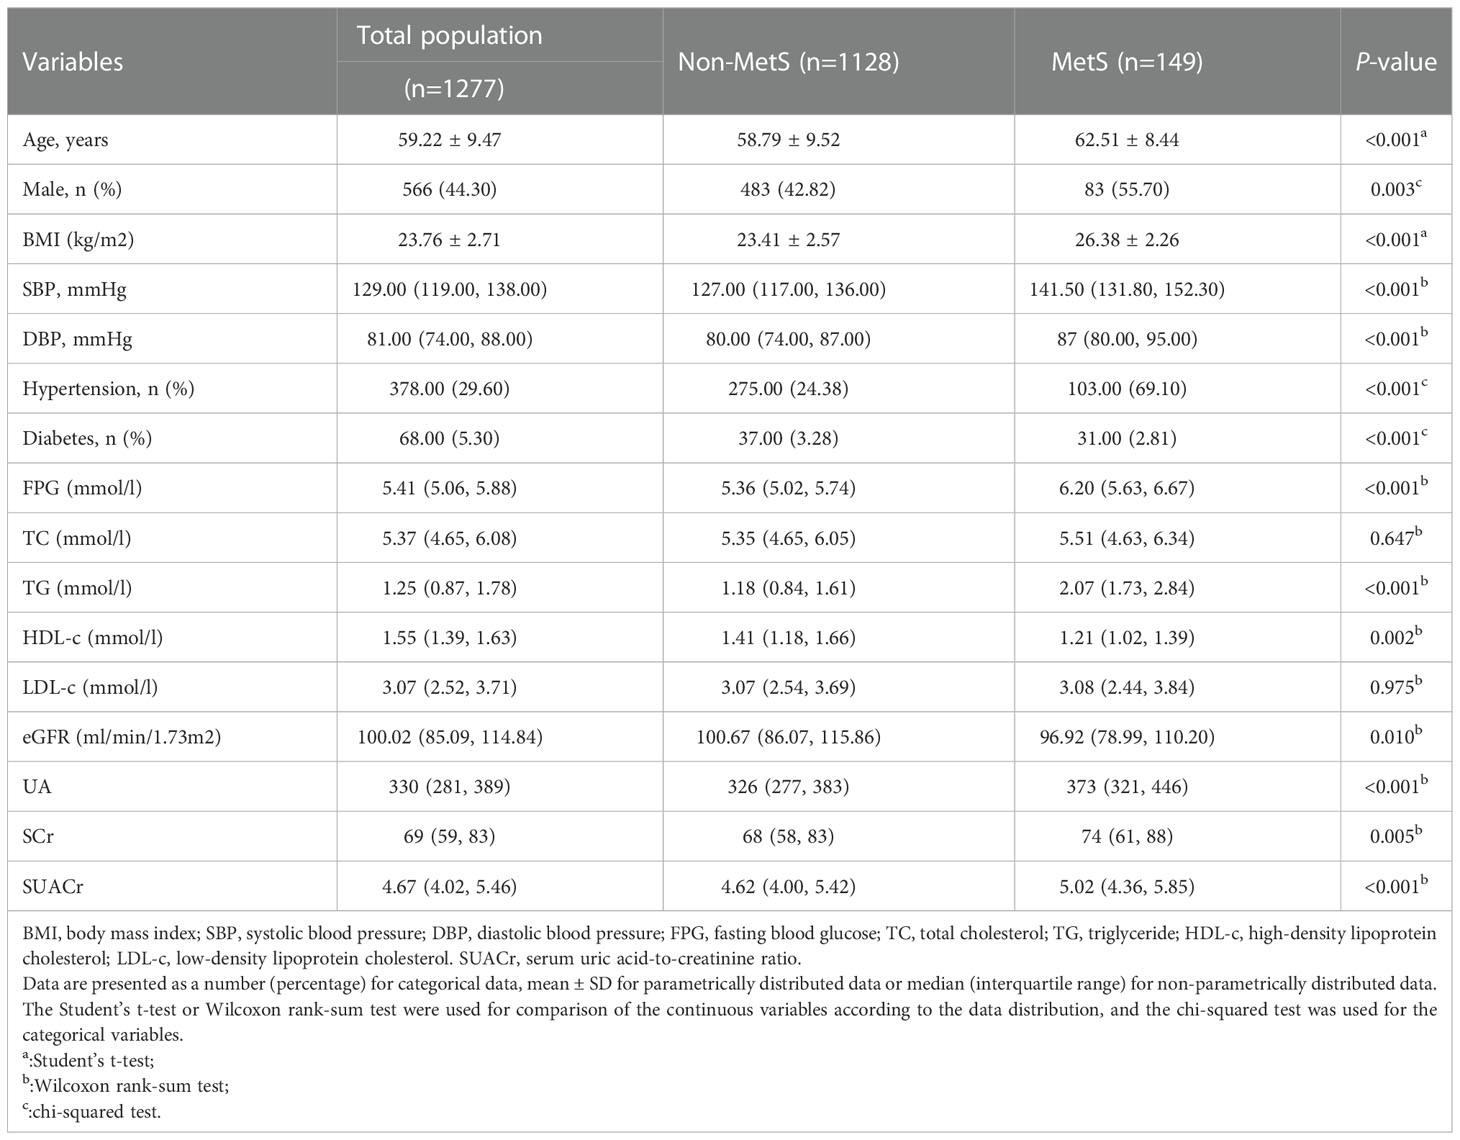
Table 1 General characteristics of the study population.
The correlation between SUACr and MetS components are shown in Table S1, the adjusted coefficients (rs) ranged from 0.95 to –0.12, as the results indicated that SUACr was positively related to BMI (rs=0.23, P<0.001) and levels of TGs (rs=0.21, P<0.001). The positive associations were also observed in the correlations of SUACr and SBP, DBP, TGs, and FBG with rs =0.10, 0.14,0.21, and 0.07, respectively (all P<0.05). The negative association was observed in the HDL-c and SUACr (rs=–0.12, P<0.01).
As shown in Table 2, logistic regression indicated that SUACr was positively associated with the risk of MetS (ORs 1.60, 95% CI 1.36 to 1.89; P<0.001) after adjustment for gender, age, smoking, drinking, and eGFR.
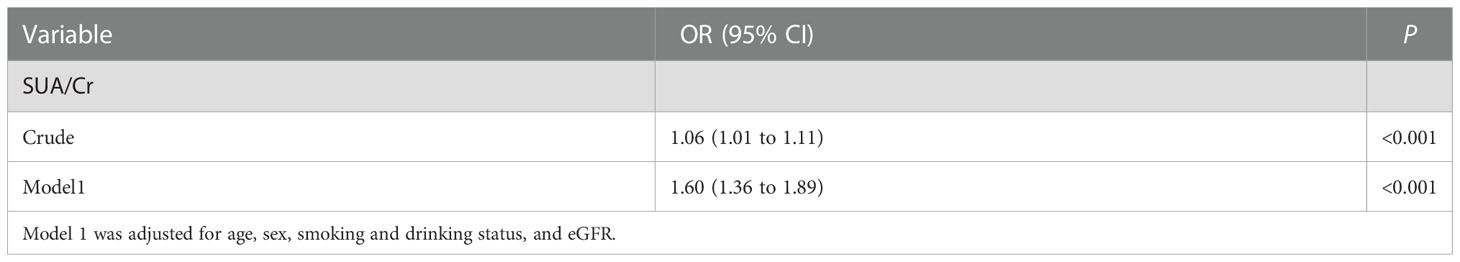
Table 2 The associations between SUACr and the prevalence of MetS.
To figure out which levels of the SUACr were associated with the prevalence of MetS (Table 3), we classified SUACr levels into quartiles based on the distribution of the non-MetS population. Compared with the lowest quartile, the adjusted ORs and 95% CIs were 2.67 (1.50 to 4.74) and 3.86 (2.11 to 7.08) in the third (4.62 to 5.42) and fourth quartiles (≥5.42), respectively.
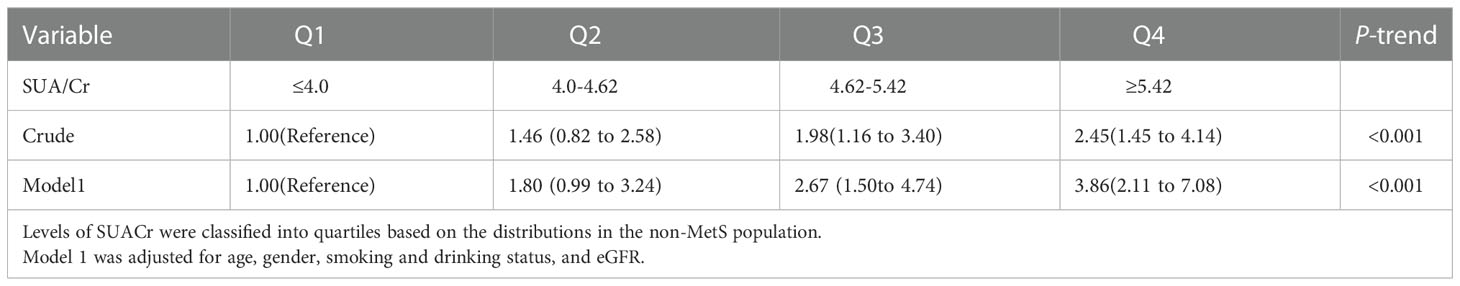
Table 3 Odds ratios (95% confidence intervals) for the MetS associated with quartiles of SUACr.
As shown in the Figure 1, the dose–response relationship was evaluated in the RCS model. A linear relationship and increasing trend with MetS prevalence were indicated for SUACr, with the overall association with a P-value <0.001. The P-value for non-linearity was 0.326.
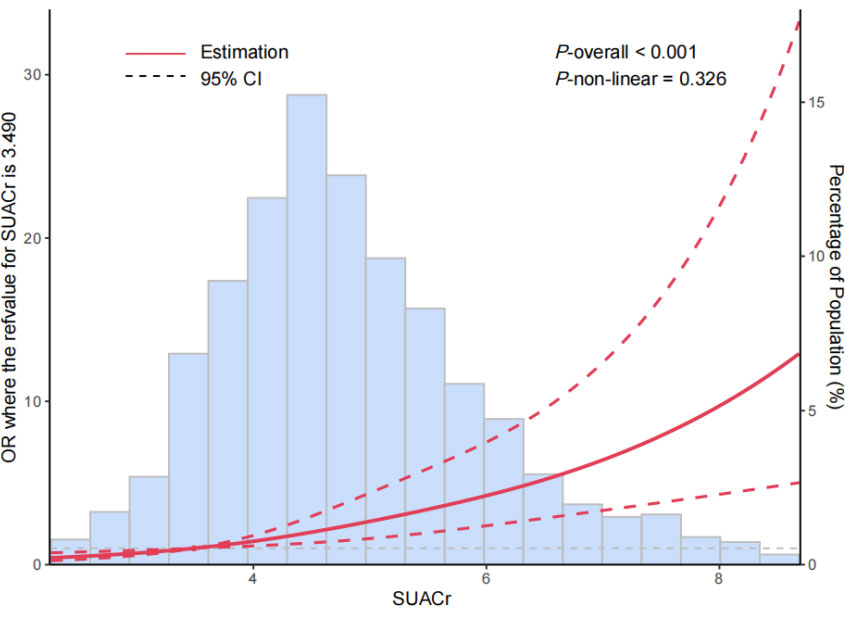
Figure 1 The restricted cubic spline for the relationships between levels of serum uric acid-to-creatinine ratio (SUACr) and the risk of metabolic syndrome (MetS). The adjusted ORs (red lines) and 95% confidence intervals (dashed lines) were calculated based on the restricted cubic spline models for the level of SUACr. The 10th percentiles were set as the reference values, with knots set at 10th, 50th, and 90th percentiles of the SUACr. Adjusted confounders were age, gender, smoking and drinking status, and eGFR.
In the ANCOVA analysis (Figure 2), with the number of MetS increased, the values of SUACr tended to decrease with the estimated marginal means for the number of 0, 1, 2, 3 or 4 components of MetS, which were 4.37 (95% CI 4.27 to 4.47), 4.86 (95% CI 4.76 to 4.95), 5.16 (95% CI 5.04 to 5.27) and 5.31 (95% CI 5.14 to 5.47), respectively.
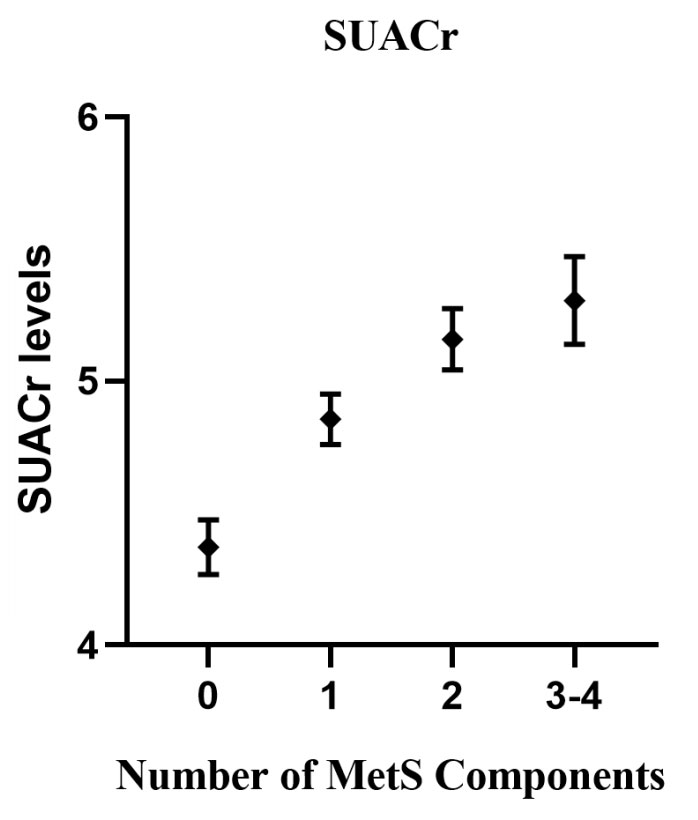
Figure 2 Associations between serum uric acid (SUACr) levels and the number of metabolic syndrome (MetS) components. The analysis of covariance (ANCOVA) model included the levels of SUACr as the dependent variables, and the number of MetS components as a fixed factor. Adjusted confounders were age, gender, smoking and drinking status, and eGFR.
Moreover, to analyze the associations between SUACr and different combination of MetS components, we calculated the OR (95% CI) for the whole population using multivariable logistic regression (Table 4). The adjusted ORs (95% CIs) were 0.85 (0.55 to 1.31) for BHD, 1.65(1.27 to 2.15) for HTB, 1.83(1.28 to 2.61) for TDB, 1.48(1.11 to1.98) for HDT, and 1.62 (1.14 to 2.31) for HDTB. All P-values were <0.05.
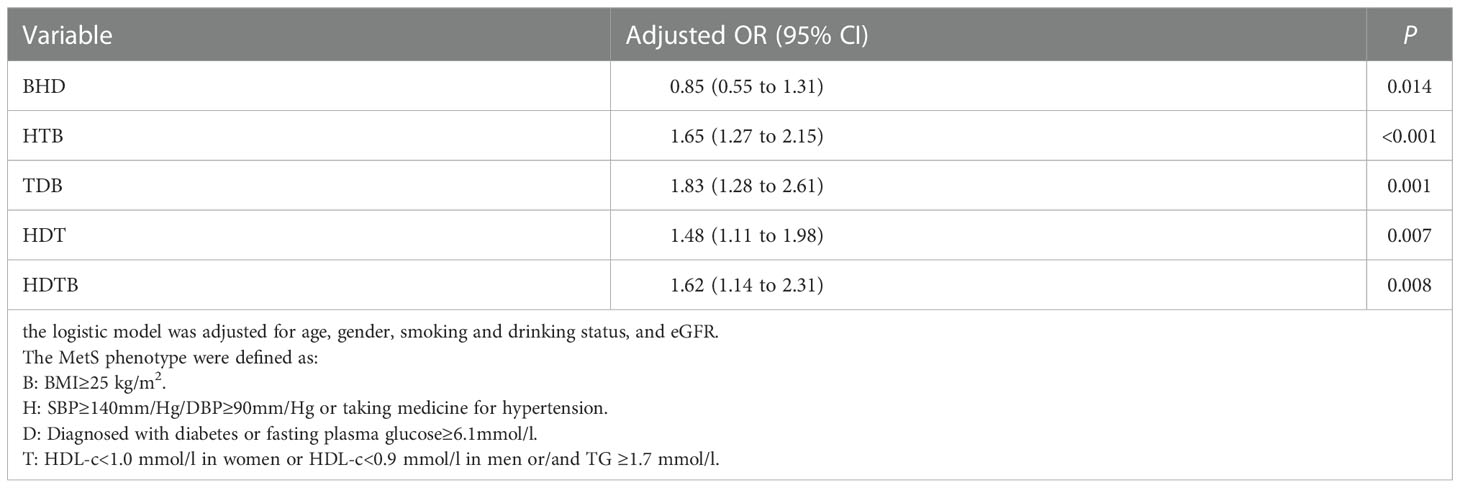
Table 4 Odds ratios (95% confidence intervals) for the different combination of MetS components associated with SUACr.
We further evaluated the relations of SUACr and the components of MetS (Table 5). Results indicated that SUACr was positively associated with BMI (OR 3.08, 95% CI: 2.06 to 4.59) and FBG (OR 1.84, 95% CI 1.12 to 3.04). Such positive relations were also suggested for hypertension and SBP/DBP, with ORs of 2.05 (95% CI 1.36 to 3.09) and 1.96 (95% CI 1.14 to 3.39) in the fourth quartile, respectively. No significant association was found in HDL-c concentrations, but strong increasing trends were found in the levels of TGs as the levels of SUACr increased (OR 6.46, 95% CI 4.21 to 9.92).
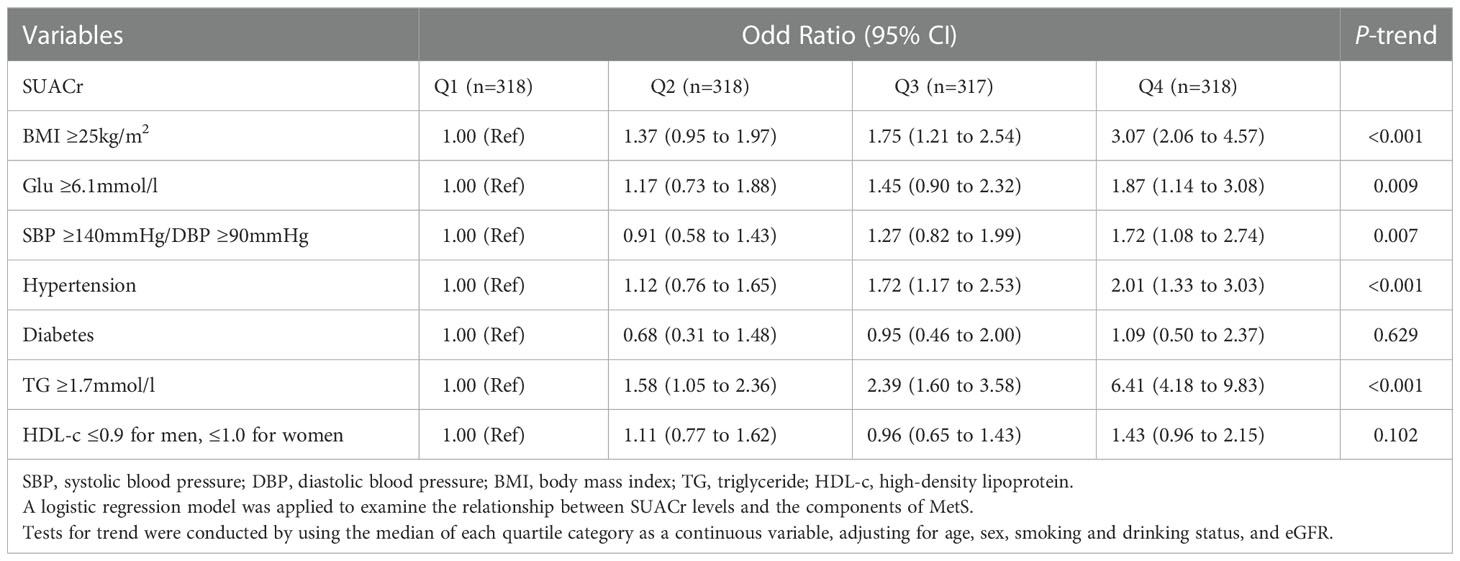
Table 5 Associations of the SUACr levels with the components of MetS.
In addition, based on the individuals with normal uric acid (UA) levels (SUA<360 umol/l for women and SUA<420 umol/l for men) (18), we found that, in the logistic regression model (Table S2), such positive associations remained with an OR of 1.56 (95% CI 1.1 to 2.06) after adjustment for the same covariates of gender, age, smoking, drinking, and eGFR. The same linear associations were still indicated in the RCS model (Figure S1), with the overall association having a P-value of 0.005 and a P-value for non-linearity of 0.675. When we performed a stratified analysis by age in this normal uric acid participants (Table S3), we found a positive relationship in the middle-aged participant group with an OR of 2.05 (95% CI 1.28 to 3.28), but such positive relationships were not observed in the older participants with an OR of 1.52 (95% CI 0.84 to 2.73).
In this cross-sectional study, we systematically evaluated the associations of SUACr with the MetS risk in a middle-aged and older population of Chinese people. We found that, related to the first quartile, when SUACr levels were >4.62, SUACr was associated with an increased risk of MetS in a dose–response curve, even after adjusting for multiple risk factors. Notably, positive associations of SUACr and MetS still remained in 961 individuals with normal uric acid levels. Moreover, we found that SUACr was positively related to the components of MetS, namely, TG, BMI, SBP/DBP, hypertension, and FBG.
The role of uric acid in the prevalence of MetS has long been argued. In a cross-sectional analysis, Ford et al. found that serum levels of uric acid are significantly associated with the risk of MetS and its components in US children and adolescents (19). However, other retrospective research failed to demonstrate a strong association between SUA and MetS, and no associations with components of MetS were found (12). In fact, the inconsistencies may be due to renal clearance dysfunction, that is, those individuals with lower eGFRs are more likely to have higher uric acid concentrations (20) and, therefore, renal function-normalized uric acid, will be more precise to reflect net uric acid production (21).
Previous studies have indicated that the SUACr is associated with various diseases. With 778 participants, a cross-sectional study found that SUACr in subjects with non-alcoholic fatty liver disease (NAFLD) was significantly higher than in participants without NAFLD in a South Korean population. This suggested that SUACr may be a reliable marker for predicting NAFLD (22). Such positive relationships between SUACr and NAFLD were also found in a Chinese population and in the US population (21, 23). As an emerging biomarker, SUACr was also found to be related to renal dysfunction (24), that is, a study comprising 185 men and 175 women found that SUACr was independently associated with future renal function decline among diabetic patients (OR 3.15, 95% CI 1.66 to 5.95) (24). Previous research suggested that SUACr is strongly associated with MetS under some specific conditions, such as MetS in diabetic patients or postmenopausal women (15, 16). Consistent with our results, in a retrospective study with 912 Chinese postmenopausal women, Jing et al. suggested that SUACr was an independent risk factor for MetS with an OR of 2.93 (95% CI 2.39 to 3.60) after adjusting for multiple confounders (15). With 332 Saudi type 2 diabetes mellitus participants, Nasser et al. also found that the SUACr in type 2 diabetic patients was strongly associated with full MetS, as well as its individual components (16). In a prospective cohort study, with 1072 community-dwelling persons, Japanese researchers found that baseline SUACr was independently and significantly associated with MetS after the 3-year follow-up and that baseline SUACr was a strong predictor of MetS in women compared with men (14). To our knowledge, the relationship between SUACr and MetS has not yet been fully described in the middle-aged and older population of Chinese people. To address this gap, we performed the present analysis.
The mechanisms that lead to risk of MetS in high SUACr individuals are not completely understood. Recent studies have reported that higher SUA may be related to MetS components. A cross-sectional study had documented that hyperuricemia is related to dyslipidemia and adiposity in 14,618 northwestern Chinese people (25). The lipid metabolic disorder and uric acid are mutually related. Elevated levels of uric acid can lead to a decline in lipoprotein enzymes that impact lipid metabolism, and, ultimately, leads to changes in the adipokines that regulate fat synthesis (26). The unfavorable effect on blood pressure has been confirmed by previous research (27), uric acid can activate the renin–angiotensin system that can be activated by uric acid, thus decreasing renal blood flow, inducing endothelial cell dysfunction, and stimulating vascular smooth muscle cell proliferation in systemic circulation. All the above mechanisms can be explained the occurrence of hypertension (28, 29). As for the positive relation of FBG, consistent with our finding, a prospective analysis of 4883 participants from the Framingham Heart Study and a cohort study recruiting 4292 patients, indicated that individuals with hyperuricemia developed diabetes at a significantly higher rate than those with normal uric acid levels (30). The effect of uric acid on blood glucose may explain by the fact that uric acid amplifies oxidative stress in adipocytes by increasing monocyte chemotactic protein-1 and decreasing adiponectin (31). The pro-oxidative action may accelerate adipose formation (32, 33) and contribute to insulin resistance (34). Consistent with our cross-sectional research, we found that SUACr was positively related to the prevalence of MetS and the components of the disease, specifically, TG, BMI, SBP/DBP, hypertension, and FBG.
Our research had some strengths, the present cross-sectional study was carried out with a large sample size, and all the participants were enrolled from the general population. Multiple statistical methods were conducted to systematically evaluate the relationship between SUACr and MetS. However, several limitations should be acknowledged. First, the cross-sectional study hid the causal association between SUACr and the risk of MetS. Second, the information needed to decrease the confounding influences, such as diet and physical exercise, should be collected in any future analysis. Finally, our findings were based on the data from only a fraction of the participants who had undergone health examinations; thus, our results might not be generalizable to all Chinese individuals.
The present research showed that higher levels of SUACr levels might increase the risk of MetS and its components in a dose–response relationship in middle-aged and older Chinese people. This finding indicates that we should pay more attention to high SUACr levels due to its positive relationship to MetS risk. Lowering SUACr levels might be a useful strategy for clinical doctors to diagnose MetS patients and to reduce the health and economic burden caused by MetS. Further analysis is required to determine the causal relationship of SUACr in the pathogenesis of MetS.
The raw data supporting the conclusions of this article will be made available by the authors, without undue reservation.
The ethics committees of the Shenzhen Center for Disease Control and Prevention approved this research (SZCDC[2019]No.006A). The patients/participants provided their written informed consent to participate in this study.
DZ: Conceptualization, Methodology, Formal analysis, Investigation, Data curation, Writing – original draft, Writing – review, and editing; DL: Conceptualization, Methodology, Formal analysis, Writing – review and editing; YG: Conceptualization, Writing – review and editing; HH: Methodology; LL: Conceptualization, Methodology, Investigation, Writing – review, and editing, Funding acquisition. FW: Conceptualization, Methodology, Investigation, Formal analysis, Writing – review, and editing. SH: Conceptualization, Methodology, Writing – review and editing, Funding acquisition. All authors contributed to the article and approved the submitted version.
This work was supported by the Department of Education of Guangdong Province (2020KTSCX034), Guangdong Basic and Applied Basic Research Foundation (2020A151501030), and the National Natural Science Foundation of China (Grant No.81973004).
The authors declare that the research was conducted in the absence of any commercial or financial relationships that could be construed as a potential conflict of interest.
All claims expressed in this article are solely those of the authors and do not necessarily represent those of their affiliated organizations, or those of the publisher, the editors and the reviewers. Any product that may be evaluated in this article, or claim that may be made by its manufacturer, is not guaranteed or endorsed by the publisher.
The Supplementary Material for this article can be found online at: https://www.frontiersin.org/articles/10.3389/fendo.2022.1060442/full#supplementary-material
1. Alberti KG, Zimmet P, Shaw J, Group IDFETFC. The metabolic syndrome–a new worldwide definition. Lancet (2005) 366(9491):1059–62. doi: 10.1016/S0140-6736(05)6702-8
2. Xie J, Zu Y, Alkhatib A, Pham TT, Gill F, Jang A, et al. Metabolic syndrome and COVID-19 mortality among adult black patients in new Orleans. Diabetes Care (2020) 44(1):188–93. doi: 10.2337/dc20-1714
3. Lu J, Wang L, Li M, Xu Y, Jiang Y, Wang W, et al. Metabolic syndrome among adults in China: The 2010 China noncommunicable disease surveillance. J Clin Endocrinol Metab (2017) 102(2):507–15. doi: 10.1210/jc.2016-2477
4. Aguilar M, Bhuket T, Torres S, Liu B, Wong RJ. Prevalence of the metabolic syndrome in the united states, 2003-2012. Jama (2015) 313(19):1973–4. doi: 10.1001/jama.2015.4260
5. Cho SK, Chang Y, Kim I, Ryu S. U-Shaped association between serum uric acid level and risk of mortality: A cohort study. Arthritis Rheumatol (2018) 70(7):1122–32. doi: 10.1002/art.40472
6. Chen JH, Chuang SY, Chen HJ, Yeh WT, Pan WH. Serum uric acid level as an independent risk factor for all-cause, cardiovascular, and ischemic strok e mortality: a Chinese cohort study. Arthritis Rheum (2009) 61(2):225–32. doi: 10.1002/art.24164
7. Chen YL, Li H, Li S, Xu Z, Tian S, Wu J, et al. Prevalence of and risk factors for metabolic associated fatty liver disease in an urban population in China: a cross-sectional comparative study. BMC Gastroenterol (2021) 21(1):212. doi: 10.1186/s12876-021-01782-w
8. Fang J, Alderman MH. Serum uric acid and cardiovascular mortality the NHANES I epidemiologic follow-up study, 1971-1992. n ational health and nutrition examination survey. Jama (2000) 283(18):2404–10. doi: 10.1001/jama.283.18.2404
9. Ishizaka N, Ishizaka Y, Toda E, Nagai R, Yamakado M. Association between serum uric acid, metabolic syndrome, and carotid atherosclerosis in Japanese indi viduals. Arterioscler Thromb Vasc Biol (2005) 25(5):1038–44. doi: 10.1161/01.ATV.0000161274.87407.26
10. Ong G, Davis WA, Davis TM. Serum uric acid does not predict cardiovascular or all-cause mortality in type 2 diabetes: the freman tle diabetes study. Diabetologia (2010) 53(7):1288–94. doi: 10.1007/s00125-010-1735-7
11. Wang Z, Lin Y, Liu Y, Chen Y, Wang B, Li C, et al. Serum uric acid levels and outcomes after acute ischemic stroke. Mol Neurobiol (2016) 53(3):1753–9. doi: 10.1007/s12035-015-9134-1
12. Li L, Song Q, Yang X. Lack of associations between elevated serum uric acid and components of metabolic syndrome such as hy pertension, dyslipidemia, and T2DM in overweight and obese Chinese adults. J Diabetes Res (2019) 2019:3175418. doi: 10.1155/2019/3175418
13. Moriyama K. The association between the serum uric acid to creatinine ratio and metabolic syndrome, liver functio n, and alcohol intake in healthy Japanese subjects. Metab Syndr Relat Disord (2019) 17(7):380–7. doi: 10.1089/met.2019.0024
14. Kawamoto R, Ninomiya D, Akase T, Kikuchi A, Kasai Y, Kusunoki T, et al. Serum uric acid to creatinine ratio independently predicts incident metabolic syndrome among communit y-dwelling persons. Metab Syndr Relat Disord (2019) 17(2):81–9. doi: 10.1089/met.2018.0055
15. Tao J, Shen X, Li J, Cha E, Gu PP, Liu J, et al. Serum uric acid to creatinine ratio and metabolic syndrome in postmenopausal Chinese women. Med (Baltimore) (2020) 99(17):e19959. doi: 10.1097/MD.0000000000019959
16. Al-Daghri NM, Al-Attas OS, Wani K, Sabico S, Alokail MS. Serum uric acid to creatinine ratio and risk of metabolic syndrome in Saudi type 2 diabetic patients. Sci Rep (2017) 7(1):12104. doi: 10.1038/s41598-017-12085-0
17. Pang C, Jia L, Hou X, Gao X, Liu W, Bao Y, et al. The significance of screening for microvascular diseases in Chinese community-based subjects with var ious metabolic abnormalities. PloS One (2014) 9(5):e97928. doi: 10.1371/journal.pone.0097928
18. Kuo CC, Weaver V, Fadrowski JJ, Lin YS, Guallar E, Navas-Acien A. Arsenic exposure, hyperuricemia, and gout in US adults. Environ Int (2015) 76:32–40. doi: 10.1016/j.envint.2014.11.015
19. Ford ES, Li C, Cook S, Choi HK. Serum concentrations of uric acid and the metabolic syndrome among US children and adolescents. Circulation (2007) 115(19):2526–32. doi: 10.1161/CIRCULATIONAHA.106.657627
20. Johnson RJ, Bakris GL, Borghi C, Chonchol MB, Feldman D, Lanaspa MA, et al. Hyperuricemia, acute and chronic kidney disease, hypertension, and cardiovascular disease: Report of a scientific workshop organized by the national kidney foundation. Am J Kidney Dis (2018) 71(6):851–65. doi: 10.1053/j.ajkd.2017.12.009
21. Ma C, Liu Y, He S, Zeng J, Li P, Ma C, et al. C-peptide: A mediator of the association between serum uric acid to creatinine ratio and non-alcoholi c fatty liver disease in a Chinese population with normal serum uric acid levels. Front Endocrinol (Lausanne) (2020) 11:600472. doi: 10.3389/fendo.2020.600472
22. Seo YB, Han AL. Association of the serum uric acid-to-Creatinine ratio with nonalcoholic fatty liver disease diagnosed by computed tomography. Metab Syndr Relat Disord (2021) 19(2):70–5. doi: 10.1089/met.2020.0086
23. Sookoian S, Pirola CJ. The serum uric acid/creatinine ratio is associated with nonalcoholic fatty liver disease in the general population. J Physiol Biochem (2022). doi: 10.1007/s13105-022-00893-6
24. Kawamoto R, Ninomiya D, Kikuchi A, Akase T, Kasai Y, Ohtsuka N, et al. Serum uric acid to creatinine ratio is a useful predictor of renal dysfunction among diabetic persons. Diabetes Metab Syndr (2019) 13(3):1851–6. doi: 10.1016/j.dsx.2019.04.023
25. Liu F, Du GL, Song N, Ma YT, Li XM, Gao XM, et al. Hyperuricemia and its association with adiposity and dyslipidemia in Northwest China: results from ca rdiovascular risk survey in xinjiang (CRS 2008-2012). Lipids Health Dis (2020) 19(1):58. doi: 10.1186/s12944-020-01211-z
26. Wang H, Sun Y, Wang S, Qian H, Jia P, Chen Y, et al. Body adiposity index, lipid accumulation product, and cardiometabolic index reveal the contribution o f adiposity phenotypes in the risk of hyperuricemia among Chinese rural population. Clin Rheumatol (2018) 37(8):2221–31. doi: 10.1007/s10067-018-4143-x
27. Cannon PJ, Stason WB, Demartini FE, Sommers SC, Laragh JH. Hyperuricemia in primary and renal hypertension. N Engl J Med (1966) 275(9):457–64. doi: 10.1056/NEJM196609012750902
28. Choi YJ, Yoon Y, Lee KY, Hien TT, Kang KW, Kim KC, et al. Uric acid induces endothelial dysfunction by vascular insulin resistance associated with the impairme nt of nitric oxide synthesis. FASEB J (2014) 28(7):3197–204. doi: 10.1096/fj.13-247148
29. Ma H, Wang X, Guo X, Li X, Qi L, Li Y. Distinct uric acid trajectories are associated with different risks of incident hypertension in middl e-aged adults. Mayo Clin Proc (2019) 94(4):611–9. doi: 10.1016/j.mayocp.2018.08.042
30. Rathmann W, Funkhouser E, Dyer AR, Roseman JM. Relations of hyperuricemia with the various components of the insulin resistance syndrome in young bl ack and white adults: the CARDIA study. coronary artery risk development in young adults. Ann Epidemiol (1998) 8(4):250–61. doi: 10.1016/s1047-2797(97)002044
31. Baldwin W, McRae S, Marek G, Wymer D, Pannu V, Baylis C, et al. Hyperuricemia as a mediator of the proinflammatory endocrine imbalance in the adipose tissue in a mur ine model of the metabolic syndrome. Diabetes (2011) 60(4):1258–69. doi: 10.2337/db10-0916
32. Johnson RJ, Lanaspa MA, Gaucher EA. Uric acid: a danger signal from the RNA world that may have a role in the epidemic of obesity, metabo lic syndrome, and cardiorenal disease: evolutionary considerations. Semin Nephrol (2011) 31(5):394–9. doi: 10.1016/j.semnephrol.2011.08.002
33. Lee H, Lee YJ, Choi H, Ko EH, Kim JW. Reactive oxygen species facilitate adipocyte differentiation by accelerating mitotic clonal expansion. J Biol Chem (2009) 284(16):10601–9. doi: 10.1074/jbc.M808742200
Keywords: serum uric acid-to-creatinine ratio (SUACr), metabolic syndrome, cross-sectional research, population study, multiple statistical analyses
Citation: Zhong D, Liu D, Guo Y, Huang H, Li L, Wu F and Huang S (2022) Association of the serum uric acid to creatinine ratio with metabolic syndrome in the middle age and older population in China. Front. Endocrinol. 13:1060442. doi: 10.3389/fendo.2022.1060442
Received: 03 October 2022; Accepted: 28 November 2022;
Published: 21 December 2022.
Edited by:
Mohammed Hussen Bule, Ambo University, EthiopiaReviewed by:
Tadesse Bekele Tafesse, Haramaya University, EthiopiaCopyright © 2022 Zhong, Liu, Guo, Huang, Li, Wu and Huang. This is an open-access article distributed under the terms of the Creative Commons Attribution License (CC BY). The use, distribution or reproduction in other forums is permitted, provided the original author(s) and the copyright owner(s) are credited and that the original publication in this journal is cited, in accordance with accepted academic practice. No use, distribution or reproduction is permitted which does not comply with these terms.
*Correspondence: Lu Li, bGlsdUBzdHUuZWR1LmNu; Fangqin Wu, d3VmYW5ncWlubmljZUBzaW5hLmNvbQ==; Suli Huang, aHVhbmdzdWxpNDIwQDE2My5jb20=
Disclaimer: All claims expressed in this article are solely those of the authors and do not necessarily represent those of their affiliated organizations, or those of the publisher, the editors and the reviewers. Any product that may be evaluated in this article or claim that may be made by its manufacturer is not guaranteed or endorsed by the publisher.
Research integrity at Frontiers
Learn more about the work of our research integrity team to safeguard the quality of each article we publish.