 Pei Xiao
 Pu Liang
 Panjun Gao
 Jinyi Wu
95% of researchers rate our articles as excellent or good
Learn more about the work of our research integrity team to safeguard the quality of each article we publish.
Find out more
ORIGINAL RESEARCH article
Front. Endocrinol. , 02 December 2022
Sec. Obesity
Volume 13 - 2022 | https://doi.org/10.3389/fendo.2022.1057261
This article is part of the Research Topic The NAFLD-MAFLD Conundrum View all 8 articles
Introduction: Metabolic dysfunction-associated fatty liver disease (MAFLD) is known to be the most common chronic liver disease worldwide, and accumulating evidence suggests that skeletal muscle might play an important role in metabolic health. However, the association between skeletal muscle and MAFLD is poorly understood so far. Therefore, we aimed to evaluate the associations of skeletal muscle with MAFLD and significant fibrosis.
Methods: A cross-sectional analysis was conducted using data obtained from the 2017-2018 US National Health and Nutrition Examination Survey. The whole-body, appendicular, and trunk skeletal muscle mass index (SMI) were assessed by dual-energy x-ray absorptiometry. MAFLD and significant fibrosis were assessed by transient elastography. Survey-weight adjusted multivariable logistic regressions were used to determine the associations. The area under the receiver operating characteristic curve (AUC) and variable importance scores from the random forest and logistic regression model were calculated to assess the predictive capability of variables and models.
Results: Of the 2065 participants, those with appendicular SMI in the highest quartile were associated with a lower risk for MAFLD in both sexes (male, OR[95%CI]: 0.46 [0.25~0.84]; female, OR[95%CI]: 0.32 [0.13~0.82]), but with a significantly different scale of the associations between sexes (Pinteraction = 0.037). However, females with trunk SMI in the highest quartile had an increased risk of significant fibrosis (OR[95%CI]: 7.82 [1.86~32.77]). Trunk SMI and appendicular SMI ranked the third contributor to MAFLD in random forest and logistic regression models, respectively. Taking appendicular and trunk SMI into consideration, the AUCs for MAFLD were 0.890 and 0.866 in random forest and logistic regression models, respectively.
Discussion: The distribution of skeletal muscle mass differently affects MAFLD and significant fibrosis in the sex groups. Higher appendicular skeletal muscle mass was associated with a lower risk of MAFLD, while the risk of significant fibrosis in females was increased with the trunk skeletal muscle mass.
Metabolic dysfunction-associated fatty liver disease (MAFLD), formerly named non-alcoholic fatty liver disease (NAFLD), is the most common cause of chronic liver disease affecting approximately one-quarter of the adult population worldwide (1). Given the high correlation between fatty liver and metabolic disease, the newly named MAFLD is proposed to be diagnosed by the presence of hepatic steatosis and coexistence with any of the following three conditions: overweight/obesity, metabolic risk abnormalities, or type 2 diabetes mellitus (T2DM). Over the decades, it causes an enormous and increasing burden on global health, and yet there is no approved pharmacologic treatment. Around 2 out of 5 adults in the US are suffering from MAFLD, and they have a significantly higher risk of all-cause and cardiovascular mortality (2). Moreover, the rising trend of obesity and T2DM will fuel a growing epidemic of MAFLD globally (3). Therefore, further understanding of emerging risk factors contributing to MAFLD might help to identify individuals at higher risk and develop prevention or intervention strategies.
Different body weight compartments may play opposite roles in the progress of disease: fat mass is detrimental to health, whereas skeletal muscle mass has the disposition to promote healthy outcomes (4). A large cohort of UK adults has revealed that greater muscle quality was associated with decreased risk of cardiovascular mortality (5). In addition, muscle weakness has been observed to be associated with T2DM, which was an important component of MAFLD (6). As an endocrine organ, skeletal muscle can secrete myokines that might affect the function of the liver (7). Nevertheless, the relationships between skeletal muscle mass and NAFLD were estimated only by a limited number of studies and using less accurate surrogate measures, such as handgrip strength and hepatic steatosis index (HSI) (8, 9). Moreover, the effects of regional skeletal muscle distribution on MAFLD and the differences between sexes are largely unknown.
Considering the significant impacts of MAFLD and the knowledge gap between MAFLD and skeletal muscle mass, a better understanding on the characteristics of skeletal muscle mass in individuals with MAFLD could help to identify the susceptible population and control the progression of this metabolic disease. Using national representative data of body composition, and hepatic steatosis and fibrosis in the US, we therefore aimed to determine whether skeletal muscle mass and its distribution were associated with the decreased risk of MAFLD and significant fibrosis, and to investigate the prognostic impact of genders on MAFLD progression.
The data was obtained from the recent 2017-2018 cycle of the National Health and Nutrition Examination Survey (NHANES). It is a program of studies to assess the health and nutritional status of adults and children in the US using a multi-stage, stratified, and clustering probability sampling method (10). A total of 9254 participants were included in the NHANES 2017-2018 public release data. Among them, 5533 adults (> 18 years) have been both interviewed and examined at a mobile center. After excluding individuals (n = 3468) with missing or invalid data for dual-energy x-ray absorptiometry (DXA), vibration controlled transient elastography (VCTE), body measures, total cholesterol, and alanine aminotransferase, 2065 participants with complete data were included in the final analysis (Figure 1). All participants provided informed consent, and the protocols of NHANES were approved by the Centers for Disease Control and Prevention institutional review board. The current study was exempted by the institutional review board due to the use of entirely de-identified data.
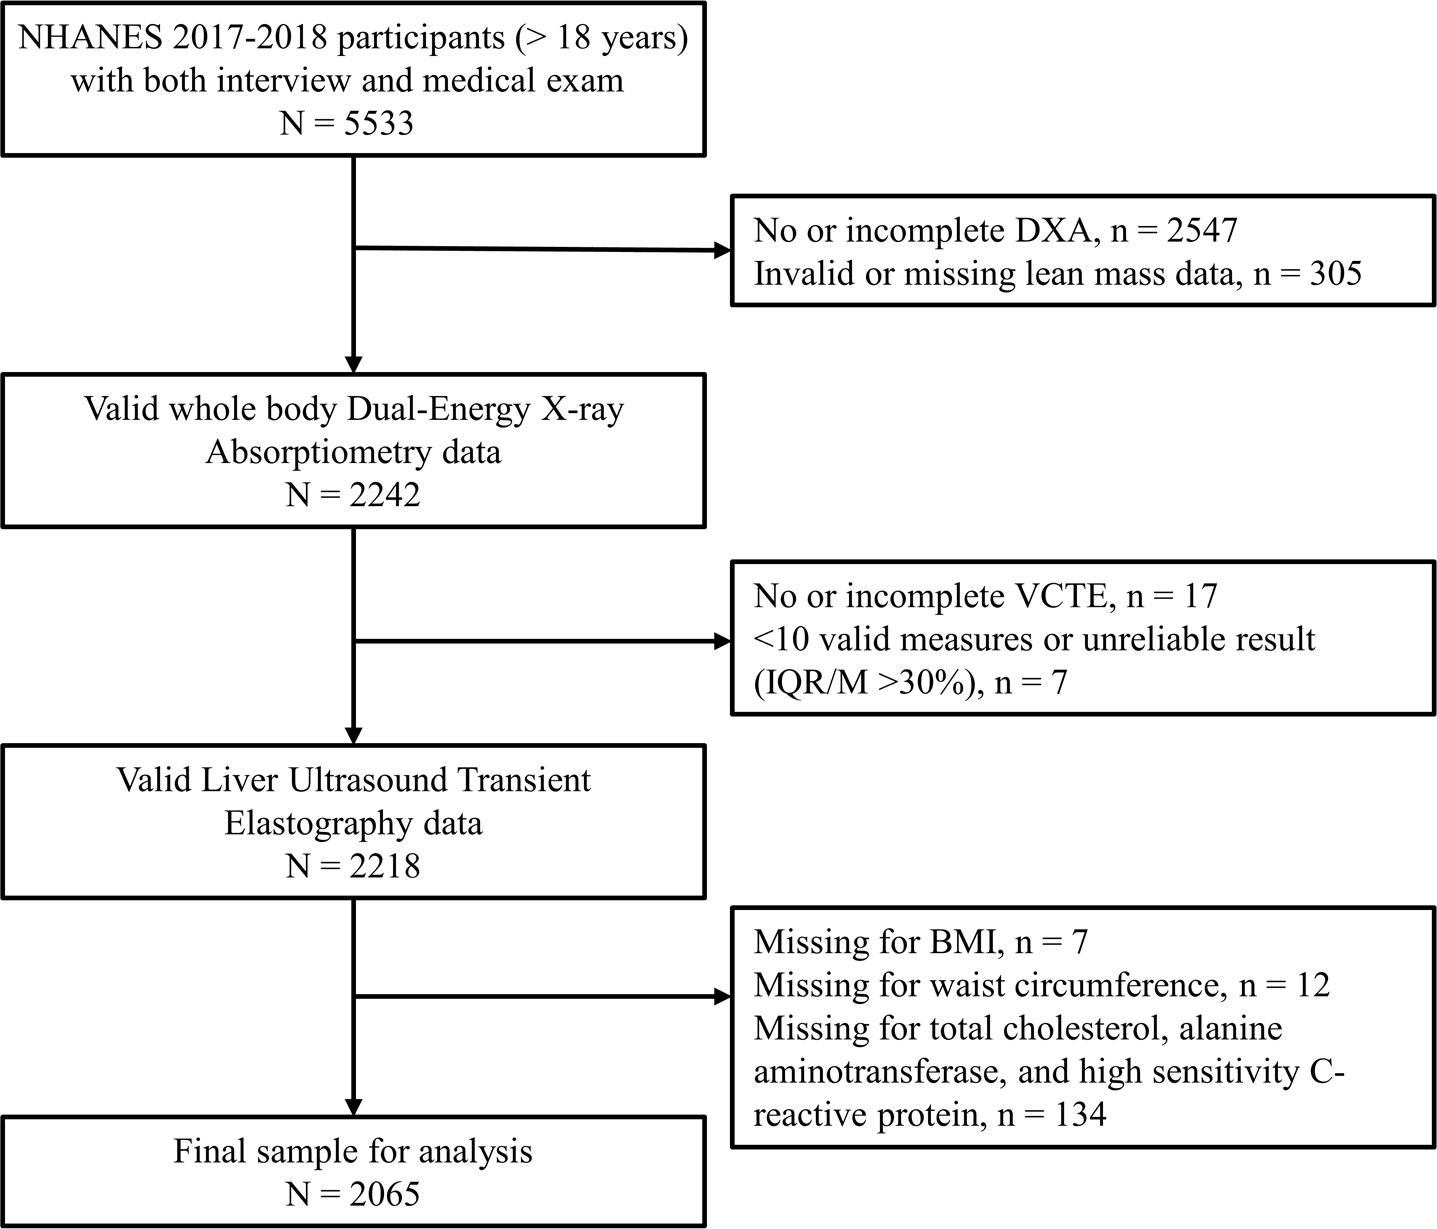
Figure 1 Flow diagram of the analytic sample.
Detailed information about the 2017-2018 cycle of the NHANES protocol can be found online (https://www.cdc.gov/nchs/nhanes/index.htm). Briefly, a combination of computer-assisted personal interviewing and audio computer-assisted self-interviewing system were used to obtain sociodemographic and behavioral characteristics, including race, education, poverty, smoking, drinking, physical activity, eating habits, and history of cardiovascular disease. A standardized health examination, which included physical examination and laboratory tests, was conducted at a mobile examination center.
Hepatic steatosis and liver fibrosis, as two important liver disease manifestations, were objectively assessed by the liver ultrasound transient elastography. The controlled attenuation parameter (CAP) related to the presence of hepatic steatosis and liver stiffness measurement (LSM) related to liver fibrosis were recorded by FibroScan® (Echosens, Waltham, MA) which used ultrasound and the VCTE (11). Participants were considered to be eligible for the examination if they fasted at least 3 hours prior to the exam and had 10 or more complete stiffness measures with a liver stiffness interquartile (IQR) range/median < 30%. The inter-observer reliability was 0.94 for the CAP score and 0.86 for LSM. We define MAFLD as the presence of hepatic steatosis (CAP scores ≥ 263 dB/m) (12) with at least one of the following: (1) overweight or obesity (body mass index(BMI) ≥ 25 kg/m2), (2) T2DM, or (3) at least 2 metabolic risk abnormalities (1). Metabolic risk abnormalities consisted of (1) waist circumference ≥ 102 cm for men or ≥ 88 cm for women, (2) blood pressure ≥ 130/85 mmHg or specific drug treatment, (3) fasting plasma triglycerides (TG) ≥ 150 mg/dl or specific drug treatment, (4) plasma high density lipoprotein cholesterol (HDL-C) <40 mg/dl for men or <50 mg/dl for women or specific drug treatment, (5) prediabetes, for example, fasting glucose levels between 100 and 125 mg/dl, or hemoglobin A1c between 5.7% and 6.4%, (6) homeostasis model assessment of insulin resistance score ≥ 2.5, (7) plasma high-sensitivity C-reactive protein level >2 mg/L. Significant fibrosis was defined as a median LSM ≥ 8 kPa (13, 14). Besides, we also defined the hepatic steatosis of MALFD as CAP scores ≥ 274 dB/m to perform a sensitivity analysis (14).
The data on body composition was collected by DXA scans (Hologic, Inc., Bedford, Massachusetts) with the Hologic software of APEX v4.0. DXA is the most widely accepted method due to its speed, ease of use, and low radiation exposure. Data was considered invalid if the participants were removable, non-removable, or morbidly obese. Skeletal muscle mass referred to the lean mass excluding bone mineral content recorded by DXA. Skeletal muscle mass index (SMI) was defined as skeletal muscle mass by height squared (kg/m2). Appendicular SMI was defined as the sum of both arms and legs skeletal muscle mass divided by height squared (kg/m2). Trunk SMI was defined as trunk skeletal muscle mass by height squared (kg/m2). In the current study, we defined adequate skeletal muscle mass status as the SMI in the highest quartile.
The race was defined as non-Hispanic White, non-Hispanic Black, Hispanic, or other. Educational status was categorized into < 12th grade, high school graduate, and college or above. Poverty was defined as the family income-to-poverty ratio ≤ 0.99. Marital status was grouped as being married or living with a partner vs others. Smoking behaviors were grouped as current smoker, former smoker, and nonsmoker. Among participants who had smoked at least 100 cigarettes in their lifetime, current smoker was defined as those who reported still smoking every day or some days at the time of survey, whereas former smoker referred to those who did not smoke at the time of survey (15). Alcohol consumption was assessed by asking how many days of the year they drank alcoholic beverages and the average number of drinks consumed on drinking days during the past year. We categorized alcohol consumption into three groups: no past year use, light-to-moderate (≤ 2 drinks/day for men or ≤ 1 drink/day for women), and heavy use (16). We calculated the Health Eating Index (HEI)-2015 by using the US Department of Agriculture Food Patterns Equivalents Database and 24-h dietary recalls collected in NHANES (17). With a total score ranging from 0 to 100, the HEI-2015 assesses the adequacy of the consumption of foods as a healthy diet, which consists of 13 components: 9 adequacy components (total fruits, whole fruits, total vegetables, greens and beans, whole grains, dairy, total protein foods, seafood and plant proteins, and fatty acids) and 4 moderation components (refined grains, sodium, added sugars, and saturated fats). Global Physical Activity Questionnaire was used in the survey to assess the typical physical activity over the past week. We calculated the sum of metabolic equivalent (MET) hours per week across all physical activity using suggested MET scores in NHANES (18). Weight status was categorized into underweight or normal (BMI < 25 kg/m2), overweight (BMI 25-29.9 kg/m2), and obesity (BMI ≥ 30 kg/m2). Hypertension was defined as systolic blood pressure ≥ 130 mmHg/diastolic blood pressure ≥ 85 mmHg, or currently using specific drugs. T2DM was diagnosed by fasting glucose > 125 mg/dl, hemoglobin A1c ≥ 6.5%, or self-reporting. Fat mass index (FMI) was defined as fat mass by height squared (kg/m2).
Given a complex, multi-stage sample design used in the NHANES, we applied appropriate sample weights in all analyses to account for clustering, stratification, non-response, and oversampling population. The continuous variables were described as the weighted mean ± SE, and the categorical variables were presented as the number (weighted frequency). Rao-Scott χ2 test and t-test were used to compare the differences in categorical and continuous variables between groups, respectively. We applied sex-specific generalized additive models with smoothing spline terms to explore the nonlinear associations of SMI, appendicular SMI, and trunk SMI with CAP scores and LSM. Restricted cubic spline regression models with three knots were used to further examine the nonlinear relationships between muscle mass and MAFLD, as well as significant fibrosis. Survey-weight adjusted multivariable logistic regressions were performed to determine the independent associations between the adequate muscle mass status (dichotomous variable) and MAFLD or significant fibrosis. We further added a two-way product term of adequate muscle mass status and sex into the models to evaluate the interactions between them. In the multivariate analyses mentioned above, sex (except for sex-stratified analysis), age, race, education, poverty, married status, smoking, alcohol use, HEI, physical activity, BMI, hypertension, waist circumference, total cholesterol, alanine aminotransferase (ALT), and FMI were treated as covariates. To further determine the impact of these factors on the MAFLD and significant fibrosis, we calculated the area under the receiver operating characteristic curve (AUC) and variable importance scores from the random forest and logistic regression model.
A 2-tailed P ≤0.05 was considered statistically significant, and the analyses were performed using the “survey” and “caret” package of R software (R Foundation for Statistical Computing, Vienna, Austria) with Taylor series linearization.
A total of 2065 participants were included in the analysis. The weighted prevalence of MAFLD and significant fibrosis were 39.2% (95%CI 36.4%-42.0%) and 6.1% (95%CI 4.8%-8.0%), respectively. The characteristics of study population by MAFLD and MAFLD with fibrosis are presented in Table 1. Compared to those without MAFLD, MAFLD subjects were older and had significantly higher levels of SMI, total cholesterol, and LDL cholesterol. In addition, they had lower health eating index and physical activity (P <0.05). Among the MAFLD patients, individuals with significant fibrosis had significantly higher levels of SMI, appendicular SMI, and trunk SMI (P <0.05).

Table 1 Characteristics of study sample.
Figure 2 shows the sex-specific nonlinear associations between (the whole-body, appendicular, and trunk) SMI and CAP, as well as LSM after multivariate adjustment. There was no evidence of nonlinearity between the whole-body SMI and CAP score (Pnonlinearity = 0.146) in females, but a slightly curvilinear relationship in males (Pnonlinearity = 0.037) (Figure 2A). The CAP score was curvilinearly decreased with the increment of appendicular SMI in both sexes (Pnonlinearity < 0.05) (Figure 2B). However, a slightly U-shaped relationship (Pnonlinearity = 0.068) between trunk SMI and CAP score was observed in males only, but not in females (Figure 2C). Interestingly, both the whole-body and appendicular SMI showed a J-shaped relationship with LSM in females (Pnonlinearity < 0.001), whereas approximately negatively linear associations between them were found in males (Figures 2D, E).
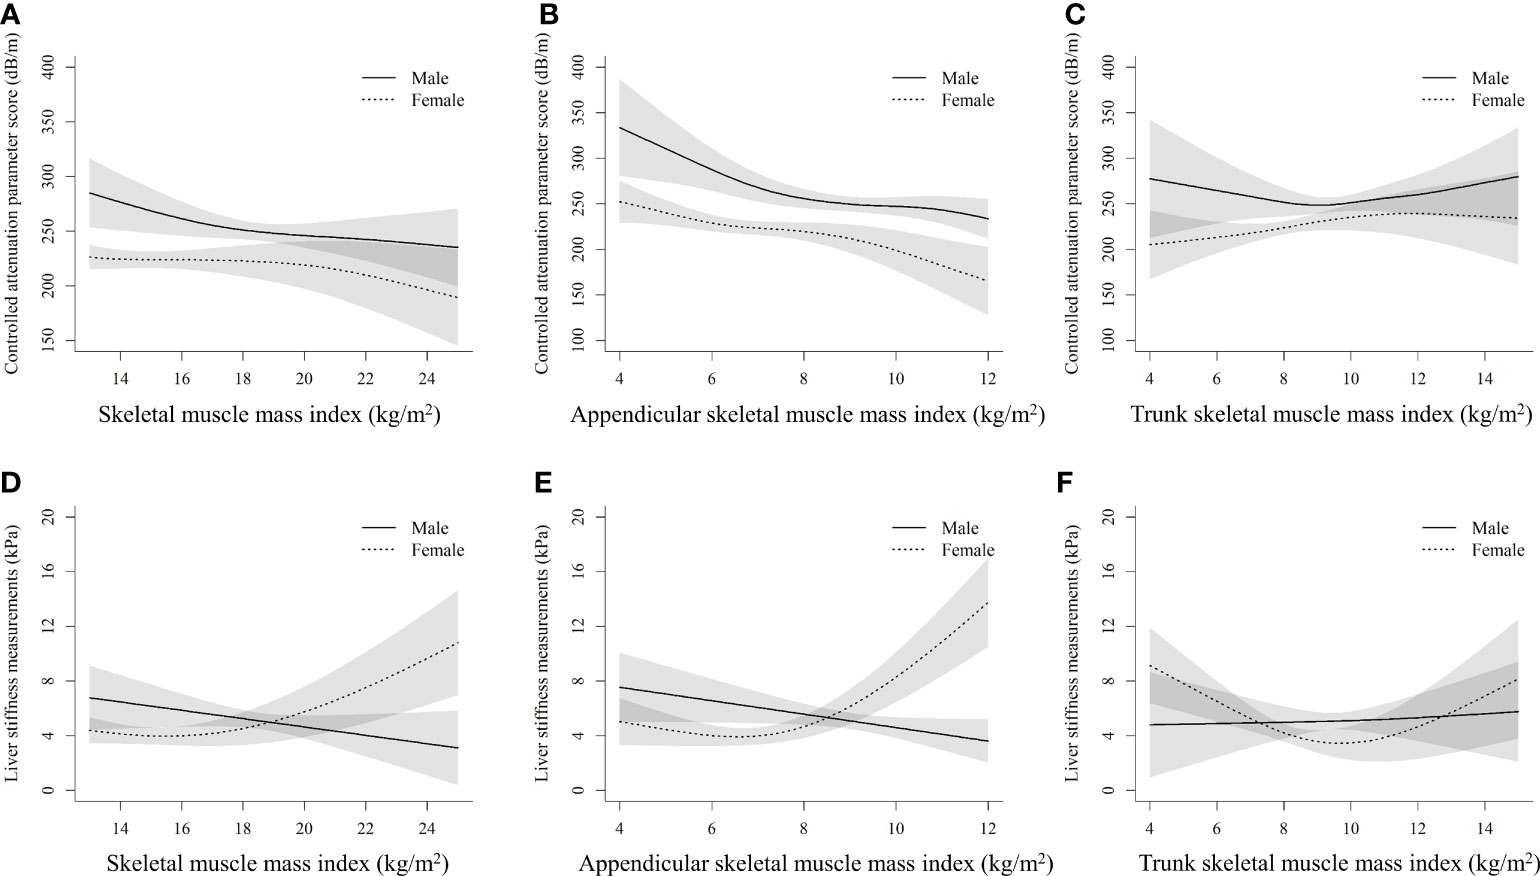
Figure 2 Nonlinear associations of muscle mass index with controlled attenuation parameter score and liver stiffness measurements by sexes (A), (B), and (C) stand for the whole-body skeletal muscle mass index, appendicular skeletal muscle mass index, and trunk skeletal muscle mass index with controlled attenuation parameter score, respectively. (D), (E), and (F) stand for the whole-body skeletal muscle mass index, appendicular skeletal muscle mass index, and trunk skeletal muscle mass index with liver stiffness measurements, respectively. The models are adjusted for age, race, education, poverty, married status, smoking, alcohol use, health eating index, physical activity, BMI, hypertension, waist circumference, total cholesterol, alanine aminotransferase, aspartate transaminase, and fat mass index.
The nonlinear dose-response associations of muscle mass with MAFLD and significant fibrosis derived from restricted cubic spline models are shown in Figure 3. Nonlinear relationships between them were observed for all the analyses after multivariable adjustment (all Pnonlinearity < 0.001). Increased whole-body SMI, appendicular SMI, and trunk SMI were associated with reduced risk of MAFLD and significant fibrosis in males, and L-shaped associations between them were observed. However, differing from that in males, the risk of MAFLD increased with the increment of trunk SMI in females, leveling off up to 10-14 kg/m2 (Figure 3C). In addition, unlike that in the males, a J-shaped relationship between trunk SMI and the risk of significant fibrosis was observed in females (Figure 3F).
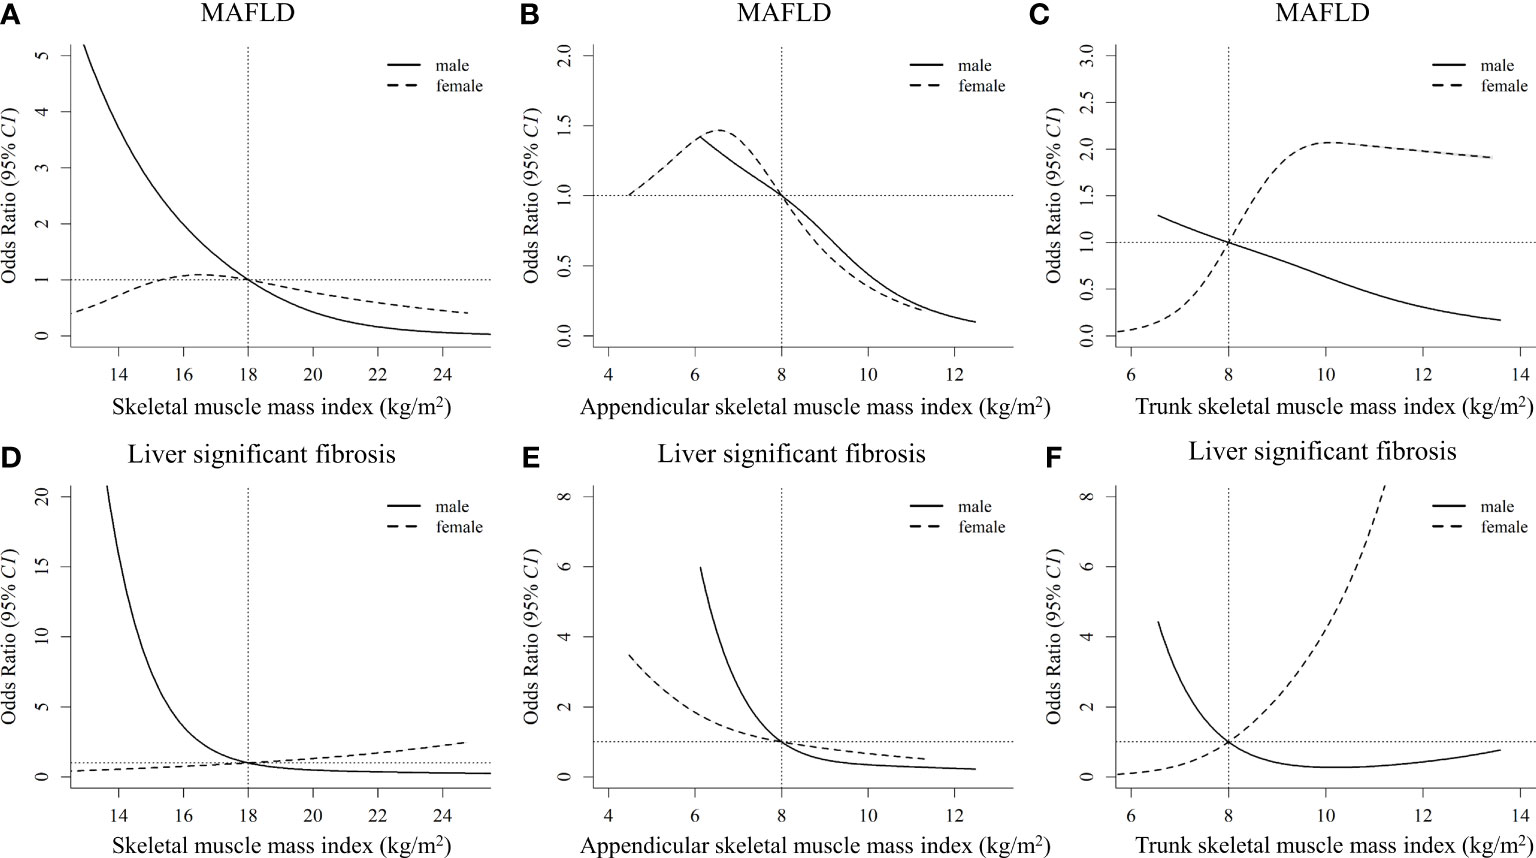
Figure 3 Nonlinear associations of muscle mass index with MAFLD and liver significant fibrosis by sexes (A), (B), and (C) stand for the whole-body skeletal muscle mass index, appendicular skeletal muscle mass index, and trunk skeletal muscle mass index with MAFLD, respectively. (D), (E), and (F) stand for the whole-body skeletal muscle mass index, appendicular skeletal muscle mass index, and trunk skeletal muscle mass index with liver significant fibrosis, respectively. The models are adjusted for age, race, education, poverty, married status, smoking, alcohol use, health eating index, physical activity, BMI, hypertension, waist circumference, total cholesterol, alanine aminotransferase, aspartate transaminase, and fat mass index. MAFLD, metabolic dysfunction-associated fatty liver disease.
Table 2 categorizes SMI into 2 groups (adequate status defined as SMI in the highest quartile vs non-adequate status) to assess the effect of adequate SMI status on MAFLD. After multivariable adjustment, adequate whole-body SMI and trunk SMI status were not significantly associated with MAFLD in the overall and sex-stratified analyses. A marginal significance was observed between adequate appendicular SMI and reduced risk of MAFLD (OR[95%CI]: 0.61 [0.36~1.03], P = 0.083). It is noteworthy that significant sex-specific associations between adequate appendicular SMI and MAFLD have been found (Pinteraction = 0.037): compared to those with appendicular SMI below the highest quartile, males and females with adequate appendicular SMI status had 54% (OR[95%CI]: 0.46 [0.25~0.84], P = 0.023) and 68% (OR[95%CI]: 0.32 [0.13~0.82], P = 0.031) lower risk for MAFLD, respectively. When the sensitivity analysis was performed by using the 274 dB/m CAP scores for steatosis definition, a significantly reduced risk of MAFLD was still observed in the adequate appendicular SMI group (Table 3).
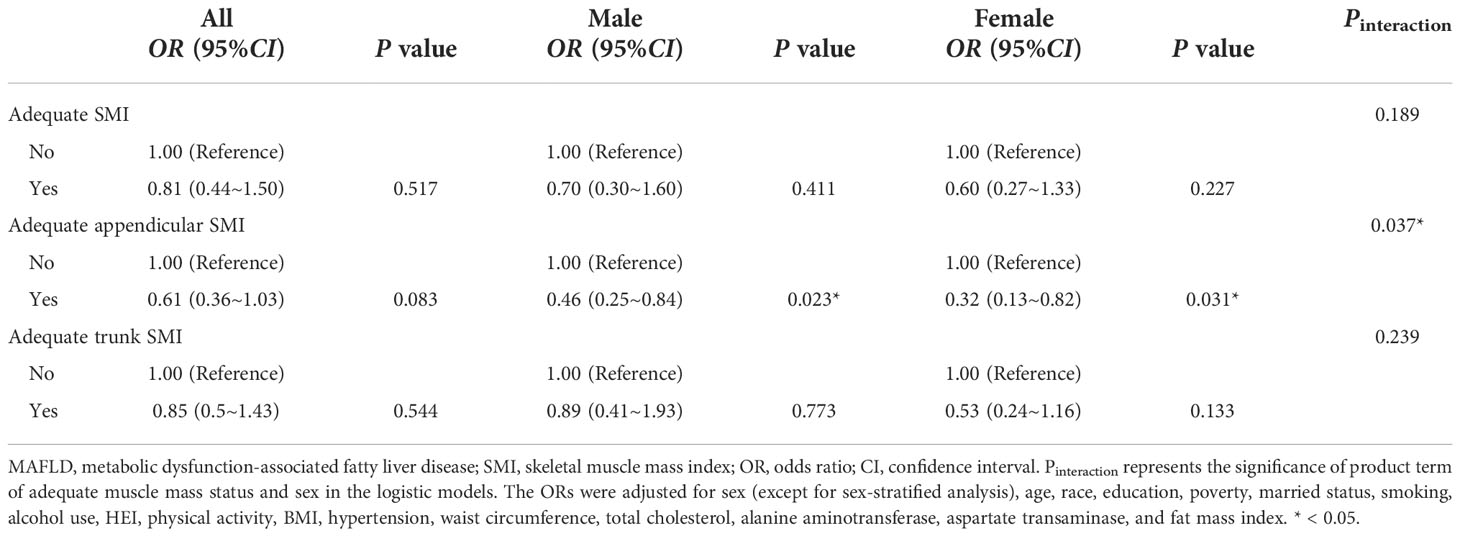
Table 2 Associations between adequate muscle mass status and MAFLD by sexes.
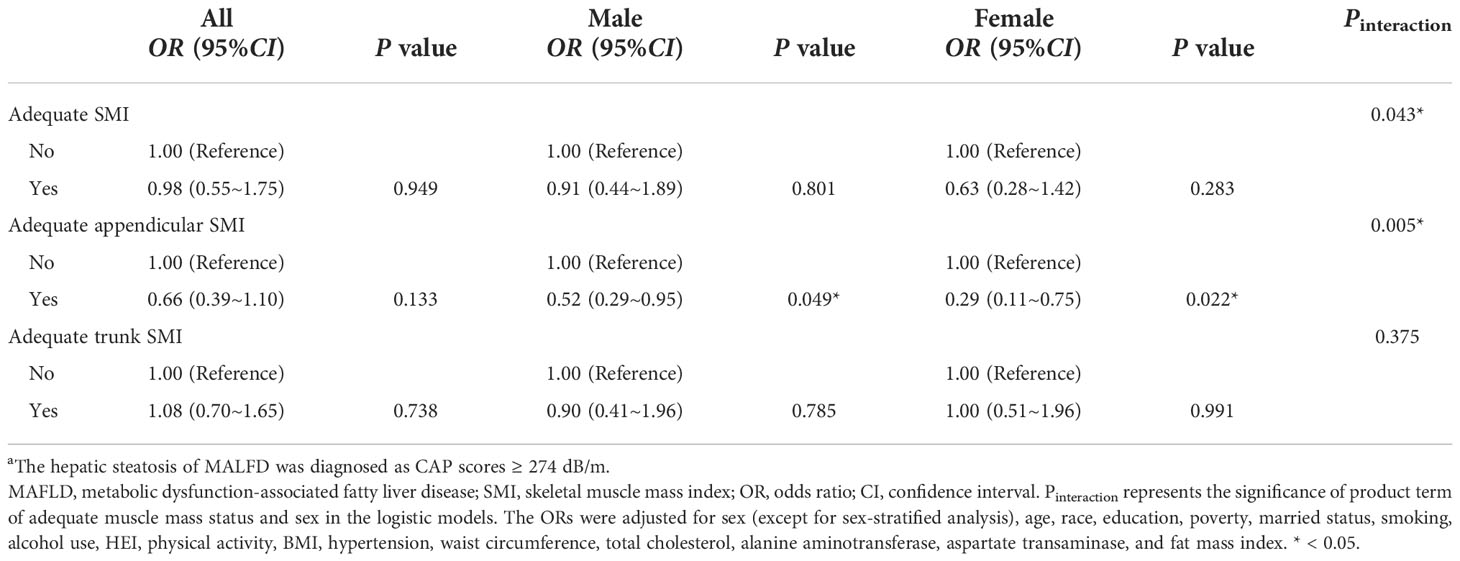
Table 3 Sensitivity analysis: Associations between adequate muscle mass status and MAFLD a by sexes.
The associations between adequate SMI status and the risk of significant fibrosis are shown in Table 4. Significant interactions between adequate whole-body (Pinteraction = 0.029) and trunk (Pinteraction = 0.008) SMI and sex on significant fibrosis were found in the sex-stratified analyses. Adequate whole-body SMI (OR[95%CI]: 8.68 [1.56~48.12], P = 0.025) and trunk SMI status (OR[95%CI]: 7.82 [1.86~32.77], P = 0.013) were associated with an increased risk of significant fibrosis in females, but not in males. In addition, individuals with adequate appendicular SMI had a lower risk for significant fibrosis compared to those with appendicular SMI below the highest quartile, of borderline statistical significance (P = 0.091).
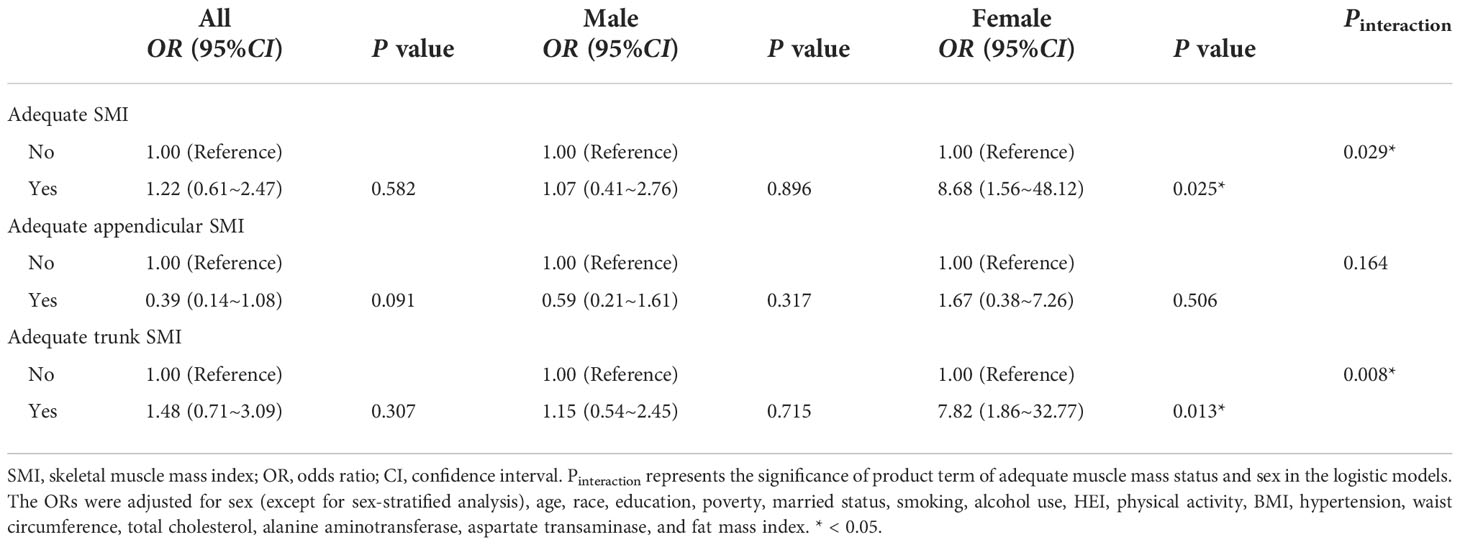
Table 4 Associations between adequate muscle mass status and significant fibrosis by sexes.
The top three contributors to MAFLD based on variable importance were not the same between prediction methods: waist circumference ranked first in both methods whereas trunk SMI and appendicular SMI ranked third in random forest and logistic regression models, respectively (Figures 4A, B). For significant fibrosis, Trunk SMI ranked the first in the random forest model (Figure 4C), and appendicular SMI ranked fifth in the logistic regression model (Figure 4D). The performance in predicting MAFLD and significant fibrosis was compared among models with different adjusted covariates (Figure 5). With the fully adjusted model that further took appendicular and trunk SMI into consideration, the AUCs for MAFLD were 0.890 and 0.866 in random forest and logistic regression models, respectively. Regarding significant fibrosis, AUCs showed minor changes when further adjusting skeletal muscle.
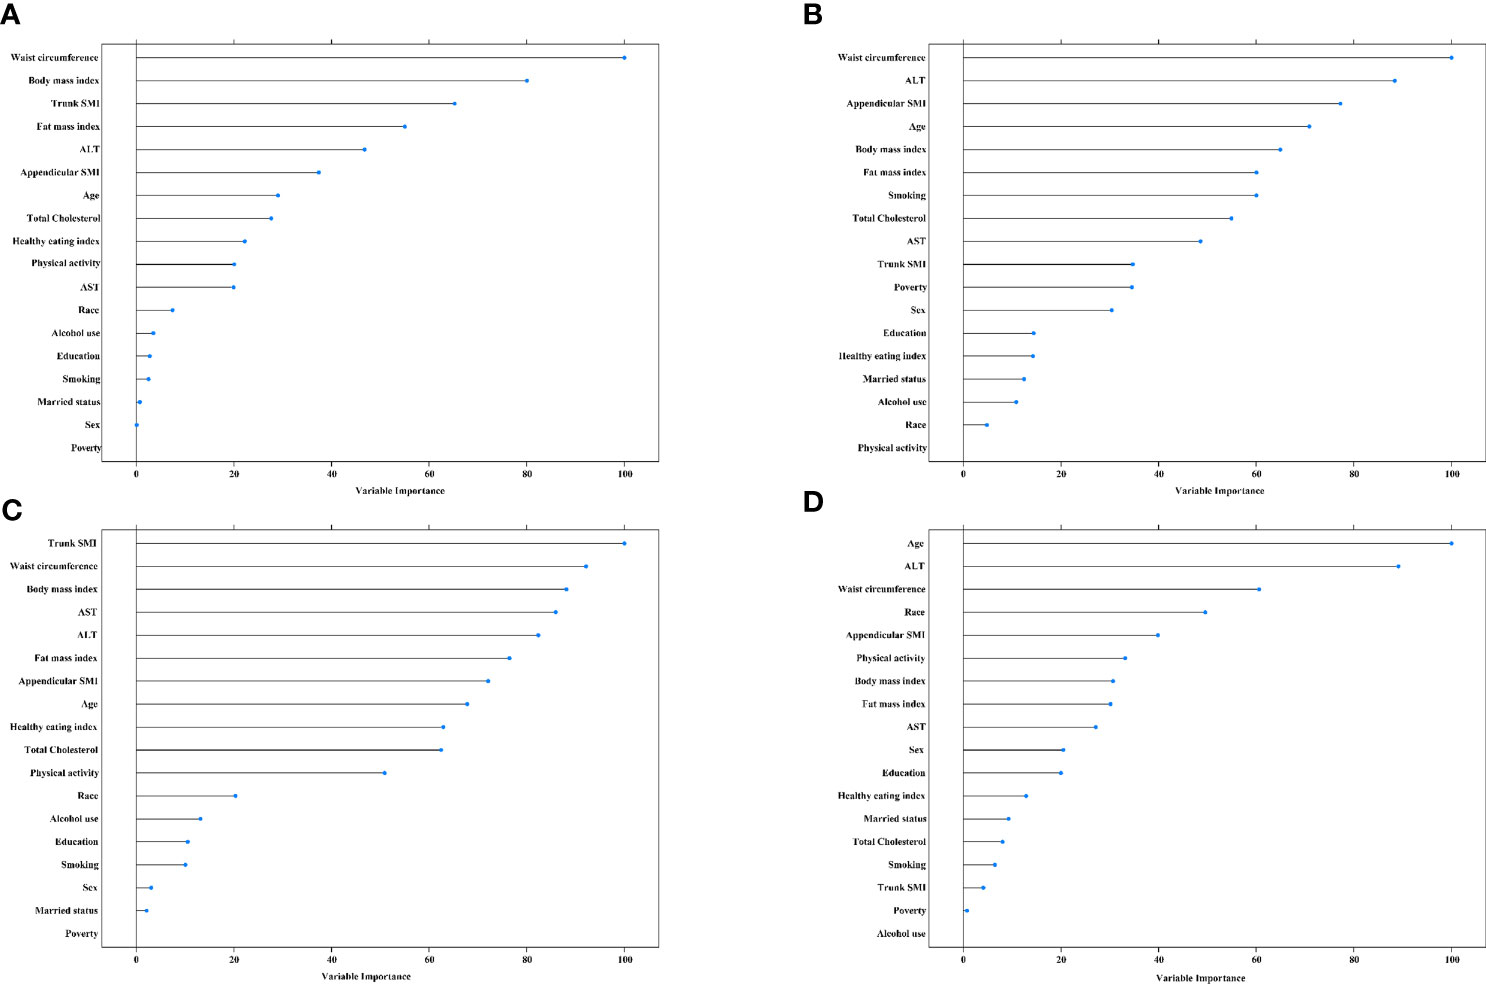
Figure 4 Variable importance for predictors of MAFLD and significant fibrosis (A), random forest for MAFLD. (B), logistic regression model for MAFLD. (C), random forest for significant fibrosis. (D), logistic regression model for significant fibrosis. The predicators included age, race, education, poverty, married status, smoking, alcohol use, health eating index, physical activity, BMI, hypertension, waist circumference, total cholesterol, alanine aminotransferase, and fat mass index. MAFLD, metabolic dysfunction-associated fatty liver disease. SMI, skeletal muscle mass index. ALT, alanine aminotransferase. AST, aspartate transaminase.
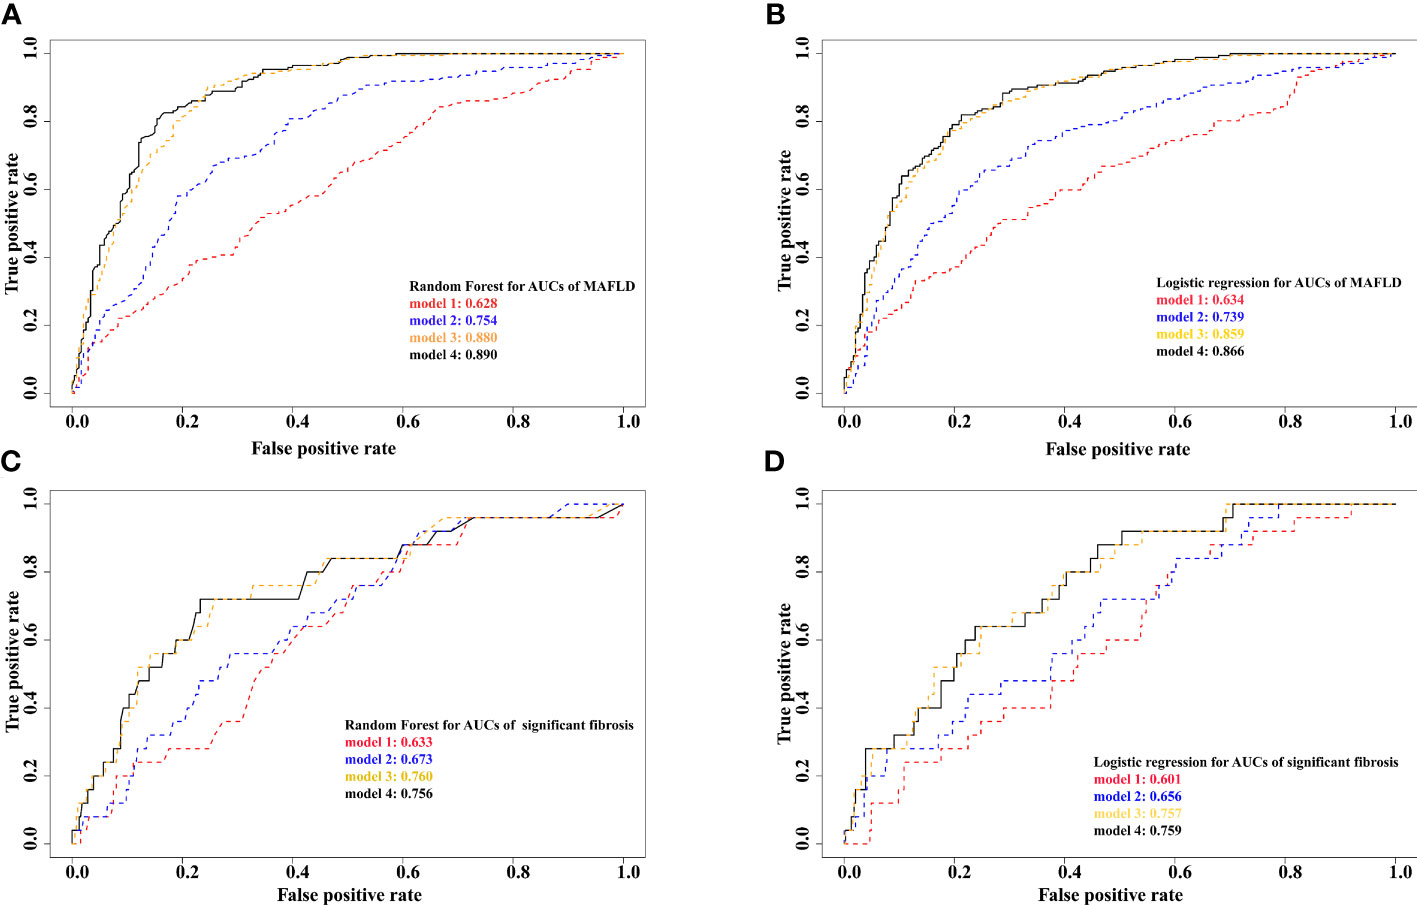
Figure 5 Prediction results from different models for MAFLD and significant fibrosis (A), random forest for MAFLD. (B), logistic regression for MAFLD. (C), random forest for significant fibrosis. (D), logistic regression for significant fibrosis. Model 1 adjusted for age, race, education, poverty, married status, smoking, alcohol use, HEI, physical activity, hypertension. Model 2 further adjusted for total cholesterol, alanine aminotransferase, and aspartate transaminase. Model 3 further adjusted for BMI, waist circumference, and fat mass index. Model 4 further adjusted for appendicular and trunk skeletal muscle mass index. MAFLD, metabolic dysfunction-associated fatty liver disease.
Using a nationally representative US population sample, we observed that adequate appendicular skeletal muscle mass was associated with a lower risk for MAFLD in both sexes but with a significantly different scale of the associations between sexes. Interestingly, significantly sex-specific associations between adequate trunk skeletal muscle mass and significant fibrosis were found in the current study: adequate trunk skeletal muscle mass was related to the increased risk of significant fibrosis in females, but not in males.
Skeletal muscle, which accounts for the majority of post-prandial glucose uptake, is considered to be related to obesity-related metabolic abnormalities (19). The diagnosis of new terminology MAFLD is based on the recognition of underlying abnormalities in metabolic health (1), and thus skeletal muscle is supposed to be a potential player in MAFLD. Emerging studies have explored the relationships between skeletal muscle mass and NAFLD, hepatic steatosis, as well as significant liver fibrosis (8, 9, 20–23). However, most of them used less accurate surrogate measures, such as handgrip strength (8, 9, 22) and fatty liver index (23). Leveraging data from the Korean National Health and Nutrition Examination Surveys (KNHANES), Lee Sung-Bum found that handgrip strength was inversely associated with HSI, and the prevalence of NAFLD defined by HSI decreased in the quartile groups of handgrip strength (9). Being partially consistent with our results, they also observed that the risk for NAFLD in females (OR[95%CI]: 0.30 [0.22–0.40]) was more relevant to muscle strength than that in males (OR[95%CI]: 0.42 [0.32–0.55]), though without testing the difference by a statistical method. A cross-sectional analysis of 613 Chinese middle-aged individuals with biopsy-proven NAFLD showed that lower skeletal muscle mass combined with abdominal obesity was strongly associated with the presence of non-alcoholic steatohepatitis only in males (24). However, another cross-sectional study performed in Chinese patients with type 2 diabetes indicated that the appendicular skeletal muscle mass to visceral fat area ratio was inversely associated with the risk of NAFLD only in females (25).
Recent evidence from a prospective cohort study with a large sample from the UK Biobank investigated the relationships between skeletal muscle mass estimated by bioimpedance and NAFLD (8). Consistently, they found a lower risk of NAFLD was associated with the increment of skeletal muscle mass, but the associations between skeletal muscle mass distribution and NAFLD were not further analyzed. Our research took further steps in this regard. With more accurate skeletal muscle mass data assessed by DXA, instead of the whole-body and trunk skeletal muscle mass, we found that a lower risk of MAFLD was only related to the appendicular skeletal muscle mass. Another KNHANES study found an unstable association between low skeletal muscle strength and significant fibrosis after multivariable adjustment (22). Whereas in our current study, the higher risk for significant fibrosis in females with adequate trunk skeletal muscle mass remained after adjusting for potential confounders. Inconsistently, a cross-sectional analysis of 487 patients with T2DM indicated that low skeletal muscle mass is independently associated with liver fibrosis (26).
A decline in muscle mass, or sarcopenia, is commonly observed among patients with liver disease, with a prevalence ranging from 20% to 70% (27). The biological mechanisms underpinning the associations between skeletal muscle mass and chronic liver diseases are related to insulin resistance, oxidative stress, chronic inflammation, insufficient physical activity, myokines, and hepatokines (28). As an endocrine organ, skeletal muscle can secrete a panel of cytokines named “myokines”, which exert a paracrine regulatory function on distant organs (i.e., adipose tissue, bone, and liver) and counteract the condition of chronic low-grade inflammation raised by metabolic disorders (29). Beyond the beneficial effects of skeletal muscle mass on MAFLD, our results also indicated a protective role of the appendicular skeletal muscle mass rather than trunk skeletal muscle mass that played. By using NHANES III survey data, Peng TC also found severe hepatic steatosis was associated with a lower risk of sarcopenia when using the height-adjusted SMI (30). Even though it is still not well understood why the associations vary between regional skeletal muscle mass distribution MAFLD and significant fibrosis, it is reasonable to hypothesize that the lipid-rich environment in which the trunk skeletal muscles are embedded, surrounded by both visceral and subcutaneous adipose tissue, could influence their intra-muscular fat content (31). There is consistent evidence that ectopic adipose tissue infiltration into skeletal muscle (i.e., myosteatosis) plays an important role in the risk of metabolic disorders (32). Hsieh YC et al. found severe myosteatosis was significantly associated with fibrosis progression rather than sarcopenia (33). In a prospective study consisting of 52 obese patients, myosteatosis was the strongest factor associated with fibrosis (34). Previous studies demonstrated that myosteatosis is positively associated with insulin resistance and systemic inflammation, and therefore linked with early steatohepatitis (35–37). The evidence offered a plausible explanation for the adverse effect of trunk skeletal muscle mass on significant fibrosis observed in the present study. Additionally, our result showed sex-related differences in the associations between skeletal muscle mass and MAFLD and significant fibrosis. A recent study performed in the same population reported sex-specific differences in the role of fat distribution on NAFLD and liver fibrosis (38). Similarly, their results showed that the effect of android fat deposition on fibrosis was only evident in females. The sex differences in hormones, muscle capillary density, muscle fiber type composition, and expressed estrogen receptors, which may affect glucose and fatty acid oxidative and storage capacities in muscle, could lead to these sex-specific associations observed in the present study (39).
The utilization of DXA and transient elastography in the present study provides more accurate data on skeletal muscle mass and MAFLD diagnosis than surrogate measures, such as handgrip strength and fatty liver predictor. However, there are several limitations in our study worth noting. First, the trunk composition measured by DXA involves substantial prediction and thus is less accurate than the composition in the limbs (40). Additionally, DXA cannot measure muscle lipid content and the location of fat storage within or surrounding myocytes. Thus, the causality between skeletal muscle and MAFLD needs to be further investigated using more accurate measurements, such as computed tomography and magnetic resonance imaging. Second, the temporal causality of the observed associations can not be inferred due to the nature of the cross-sectional design. Therefore, prospective studies are needed to assess the impact of skeletal muscle mass on MAFLD to validate our results. Third, the unmeasured residual confounders may limit the validity of our results. Fourth, the accuracy of the diagnosis of liver steatosis and fibrosis by transient elastography might be affected by body fat.
To the best of our knowledge, this is the first investigation of regional and sex-specific associations between skeletal muscle mass and MAFLD and significant fibrosis using a representative sample of the US general population. In our research, the appendicular skeletal muscle mass was suggested to have beneficial effects on MAFLD in both sexes, whereas the trunk skeletal muscle mass may increase the risk of significant fibrosis in females. These findings indicated that future studies on the effects of skeletal muscle on MAFLD should account for regional distribution and sex-specific differences. Given that MAFLD is the most common chronic liver disease and its inverse associations observed in the present study, improving appendicular skeletal muscle mass among the general population might be helpful to prevent this increasing public health concern.
Publicly available datasets were analyzed in this study. This data can be found here: https://www.cdc.gov/nchs/nhanes/index.htm.
The studies involving human participants were reviewed and approved by the Centers for Disease Control and Prevention Institutional Review Board. The patients/participants provided their written informed consent to participate in this study.
Conceptualization and methodology, PX and PL. Formal analysis, PX. Writing—original draft preparation, PL. Writing—review and editing, PX, PG, and JW. Supervision, PL. All authors have read and agreed to the published version of the manuscript.
PX was supported by Beijing Natural Science Foundation (7214277). PL was supported by funding from Scientific Research Common Program of Beijing Municipal Commission of Education (KM202110025003).
We gratefully thank all participants in the study and thank all the staff of the NHANES.
The authors declare that the research was conducted in the absence of any commercial or financial relationships that could be construed as a potential conflict of interest.
All claims expressed in this article are solely those of the authors and do not necessarily represent those of their affiliated organizations, or those of the publisher, the editors and the reviewers. Any product that may be evaluated in this article, or claim that may be made by its manufacturer, is not guaranteed or endorsed by the publisher.
1. Eslam M, Newsome PN, Sarin SK, Anstee QM, Targher G, Romero-Gomez M, et al. A new definition for metabolic dysfunction-associated fatty liver disease: An international expert consensus statement. J Hepatol (2020) 73:202–9. doi: 10.1016/j.jhep.2020.03.039
2. Ciardullo S, Perseghin G. Prevalence of NAFLD, MAFLD and associated advanced fibrosis in the contemporary united states population. Liver Int (2021) 41:1290–3. doi: 10.1111/liv.14828
3. Xian YX, Weng JP, Xu F. MAFLD vs. NAFLD: shared features and potential changes in epidemiology, pathophysiology, diagnosis, and pharmacotherapy. Chin Med J (Engl) (2020) 134:8–19. doi: 10.1097/CM9.0000000000001263
4. Larsson SC, Back M, Rees JMB, Mason AM, Burgess S. Body mass index and body composition in relation to 14 cardiovascular conditions in UK biobank: a mendelian randomization study. Eur Heart J (2019) 41(2):221–6. doi: 10.1093/eurheartj/ehz388
5. Farmer RE, Mathur R, Schmidt AF, Bhaskaran K, Fatemifar G, Eastwood SV, et al. Associations between measures of sarcopenic obesity and risk of cardiovascular disease and mortality: A cohort study and mendelian randomization analysis using the UK biobank. J Am Heart Assoc (2019) 8(13):e011638. doi: 10.1161/jaha.118.011638
6. Moon SW, Lee SH, Woo A, Leem AY, Lee SH, Chung KS, et al. Reference values of skeletal muscle area for diagnosis of sarcopenia using chest computed tomography in Asian general population. J cachexia sarcopenia Muscle (2022) 13(2):955–65. doi: 10.1002/jcsm.12946
7. Kim G, Kim JH. Impact of skeletal muscle mass on metabolic health. Endocrinol Metab (Seoul) (2020) 35:1–6. doi: 10.3803/EnM.2020.35.1.1
8. Petermann-Rocha F, Gray SR, Forrest E, Welsh P, Sattar N, Celis-Morales C, et al. Associations of muscle mass and grip strength with severe NAFLD: a prospective study of 333,295 UK biobank participants. J Hepatol (2022) 76(5):1021–29. doi: 10.1016/j.jhep.2022.01.010
9. Lee SB, Kwon YJ, Jung DH, Kim JK. Association of muscle strength with non-alcoholic fatty liver disease in Korean adults. Int J Environ Res Public Health (2022) 19(3):1675. doi: 10.3390/ijerph19031675
10. Statistics NCfH. About the national health and nutrition examination survey (2022). Available at: https://www.cdc.gov/nchs/nhanes/about_nhanes.htm (Accessed 2022/2/26).
11. Survey NHaNE. Liver ultrasound transient elastography procedures manual (2022). Available at: https://wwwn.cdc.gov/nchs/data/nhanes/2017-2018/manuals/2018_Liver_Ultrasound_Elastography_Procedures_Manual.pdf (Accessed 2022/2/28).
12. Siddiqui MS, Vuppalanchi R, Van Natta ML, Hallinan E, Kowdley KV, Abdelmalek M, et al. Vibration-controlled transient elastography to assess fibrosis and steatosis in patients with nonalcoholic fatty liver disease. Clin Gastroenterol Hepatol (2019) 17:156–63 e2. doi: 10.1016/j.cgh.2018.04.043
13. Abeysekera KWM, Fernandes GS, Hammerton G, Portal AJ, Gordon FH, Heron J, et al. Prevalence of steatosis and fibrosis in young adults in the UK: a population-based study. Lancet Gastroenterol Hepatol (2020) 5:295–305. doi: 10.1016/S2468-1253(19)30419-4
14. Eddowes PJ, Sasso M, Allison M, Tsochatzis E, Anstee QM, Sheridan D, et al. Accuracy of FibroScan controlled attenuation parameter and liver stiffness measurement in assessing steatosis and fibrosis in patients with nonalcoholic fatty liver disease. Gastroenterology (2019) 156(6):1717–30. doi: 10.1053/j.gastro.2019.01.042
15. Garduno A, Wu T. Tobacco smoke and CYP1A2 activity in a US population with normal liver enzyme levels. Int J Environ Res Public Health (2021) 18(5):2225. doi: 10.3390/ijerph18052225
16. Heredia NI, Zhang X, Balakrishnan M, Daniel CR, Hwang JP, McNeill LH, et al. Physical activity and diet quality in relation to non-alcoholic fatty liver disease: A cross-sectional study in a representative sample of U. S adults using NHANES 2017-2018 Prev Med (2022) 154:106903. doi: 10.1016/j.ypmed.2021.106903
17. Reedy J, Lerman JL, Krebs-Smith SM, Kirkpatrick SI, Pannucci TE, Wilson MM, et al. Evaluation of the healthy eating index-2015. J Acad Nutr Diet (2018) 118:1622–33. doi: 10.1016/j.jand.2018.05.019
18. Survey NHaNE. Data documentation, codebook, and frequencies (2017-2018). Available at: https://wwwn.cdc.gov/Nchs/Nhanes/2017-2018/PAQ_J.htm.
19. Dahlmans D, Houzelle A, Schrauwen P, Hoeks J. Mitochondrial dynamics, quality control and miRNA regulation in skeletal muscle: implications for obesity and related metabolic disease. Clin Sci (Lond) (2016) 130:843–52. doi: 10.1042/CS20150780
20. Yodoshi T, Orkin S, Romantic E, Hitchcock K, Clachar AA, Bramlage K, et al. Impedance-based measures of muscle mass can be used to predict severity of hepatic steatosis in pediatric nonalcoholic fatty liver disease. Nutrition (2021) 91-92:111447. doi: 10.1016/j.nut.2021.111447
21. Kang MK, Baek JH, Kweon YO, Tak WY, Jang SY, Lee YR, et al. Association of skeletal muscle and adipose tissue distribution with histologic severity of non-alcoholic fatty liver. Diagnostics (Basel) (2021) 11(6):1061. doi: 10.3390/diagnostics11061061
22. Kang S, Moon MK, Kim W, Koo BK. Association between muscle strength and advanced fibrosis in non-alcoholic fatty liver disease: a Korean nationwide survey. J Cachexia Sarcopenia Muscle (2020) 11:1232–41. doi: 10.1002/jcsm.12598
23. Pasco JA, Sui SX, West EC, Anderson KB, Rufus-Membere P, Tembo MC, et al. Fatty liver index and skeletal muscle density. Calcif Tissue Int (2022) 110(6):649–57. doi: 10.1007/s00223-021-00939-9
24. Li G, Rios RS, Wang XX, Yu Y, Zheng KI, Huang OY, et al. Sex influences the association between appendicular skeletal muscle mass to visceral fat area ratio and non-alcoholic steatohepatitis in patients with biopsy-proven non-alcoholic fatty liver disease. Br J Nutr (2021) 127(11):1–8. doi: 10.1017/S0007114521002415
25. Su X, Xu J, Zheng C. The relationship between non-alcoholic fatty liver and skeletal muscle mass to visceral fat area ratio in women with type 2 diabetes. BMC Endocr Disord (2019) 19:76. doi: 10.1186/s12902-019-0404-1
26. Kuchay MS, Choudhary NS, Gagneja S, Mathew A, Bano T, Kaur P, et al. Low skeletal muscle mass is associated with liver fibrosis in individuals with type 2 diabetes and nonalcoholic fatty liver disease. J Gastroenterol Hepatol (2021) 36:3204–11. doi: 10.1111/jgh.15595
27. Ponziani FR, Gasbarrini A. Sarcopenia in patients with advanced liver disease. Curr Protein Pept Sci (2018) 19:681–91. doi: 10.2174/1389203718666170428121647
28. Kim JA, Choi KM. Sarcopenia and fatty liver disease. Hepatol Int (2019) 13:674–87. doi: 10.1007/s12072-019-09996-7
29. Gomarasca M, Banfi G, Lombardi G. Myokines: The endocrine coupling of skeletal muscle and bone. Adv Clin Chem (2020) 94:155–218. doi: 10.1016/bs.acc.2019.07.010
30. Peng TC, Wu LW, Chen WL, Liaw FY, Chang YW, Kao TW. Nonalcoholic fatty liver disease and sarcopenia in a Western population (NHANES III): The importance of sarcopenia definition. Clin Nutr (2019) 38(1):422–8. doi: 10.1016/j.clnu.2017.11.021
31. Maltais A, Almeras N, Lemieux I, Tremblay A, Bergeron J, Poirier P, et al. Trunk muscle quality assessed by computed tomography: Association with adiposity indices and glucose tolerance in men. Metabolism (2018) 85:205–12. doi: 10.1016/j.metabol.2018.04.003
32. Miljkovic I, Vella CA, Allison M. Computed tomography-derived myosteatosis and metabolic disorders. Diabetes Metab J (2021) 45:482–91. doi: 10.4093/dmj.2020.0277
33. Hsieh YC, Joo SK, Koo BK, Lin HC, Lee DH, Chang MS, et al. Myosteatosis, but not sarcopenia, predisposes NAFLD subjects to early steatohepatitis and fibrosis progression. Clin Gastroenterol Hepatol (2022) S1542-3565(22):00074–X. doi: 10.1016/j.cgh.2022.01.020
34. Lanthier N, Rodriguez J, Nachit M, Hiel S, Trefois P, Neyrinck AM, et al. Microbiota analysis and transient elastography reveal new extra-hepatic components of liver steatosis and fibrosis in obese patients. Sci Rep (2021) 11(1):659. doi: 10.1038/s41598-020-79718-9
35. Bhanji RA, Narayanan P, Allen AM, Malhi H, Watt KD. Sarcopenia in hiding: the risk and consequence of underestimating muscle dysfunction in nonalcoholic steatohepatitis. Hepatology (2017) 66:2055–65. doi: 10.1002/hep.29420
36. Therkelsen KE, Pedley A, Speliotes EK, Massaro JM, Murabito J, Hoffmann U, et al. Intramuscular fat and associations with metabolic risk factors in the framingham heart study. Arterioscler Thromb Vasc Biol (2013) 33:863–70. doi: 10.1161/ATVBAHA.112.301009
37. Miljkovic I, Zmuda JM. Epidemiology of myosteatosis. Curr Opin Clin Nutr Metab Care (2010) 13:260–4. doi: 10.1097/MCO.0b013e328337d826
38. Ciardullo S, Oltolini A, Cannistraci R, Muraca E, Perseghin G. Sex-related association of nonalcoholic fatty liver disease and liver fibrosis with body fat distribution in the general US population. Am J Clin Nutr (2022) 115(6):1528–34. doi: 10.1093/ajcn/nqac059
39. Lundsgaard AM, Kiens B. Gender differences in skeletal muscle substrate metabolism - molecular mechanisms and insulin sensitivity. Front Endocrinol (Lausanne) (2014) 5:195. doi: 10.3389/fendo.2014.00195
Keywords: metabolic dysfunction-associated fatty liver disease, fibrosis, skeletal muscle mass, body composition, National Health and Nutrition Examination Survey
Citation: Xiao P, Liang P, Gao P and Wu J (2022) Sex- and region-specific associations of skeletal muscle mass with metabolic dysfunction-associated fatty liver disease. Front. Endocrinol. 13:1057261. doi: 10.3389/fendo.2022.1057261
Received: 30 September 2022; Accepted: 21 November 2022;
Published: 02 December 2022.
Edited by:
Luca Busetto, Università degli Studi di Padova, ItalyReviewed by:
Barbara Zanini, University of Brescia, ItalyCopyright © 2022 Xiao, Liang, Gao and Wu. This is an open-access article distributed under the terms of the Creative Commons Attribution License (CC BY). The use, distribution or reproduction in other forums is permitted, provided the original author(s) and the copyright owner(s) are credited and that the original publication in this journal is cited, in accordance with accepted academic practice. No use, distribution or reproduction is permitted which does not comply with these terms.
*Correspondence: Pu Liang, bGlhbmdwdUBjY211LmVkdS5jbg==
†These authors have contributed equally to this work
Disclaimer: All claims expressed in this article are solely those of the authors and do not necessarily represent those of their affiliated organizations, or those of the publisher, the editors and the reviewers. Any product that may be evaluated in this article or claim that may be made by its manufacturer is not guaranteed or endorsed by the publisher.
Research integrity at Frontiers
Learn more about the work of our research integrity team to safeguard the quality of each article we publish.