 Jialu Wang
 Liyun He
 Na Yang
 Ziyi Li
 Lingling Xu
 Wei Li
 Fan Ping
 Huabing Zhang
 Yuxiu Li
95% of researchers rate our articles as excellent or good
Learn more about the work of our research integrity team to safeguard the quality of each article we publish.
Find out more
ORIGINAL RESEARCH article
Front. Endocrinol. , 23 December 2022
Sec. Clinical Diabetes
Volume 13 - 2022 | https://doi.org/10.3389/fendo.2022.1054671
Background: Body mass index (BMI) is a common indicator in clinical practice, but it is not sufficient to predict insulin resistance (IR). Other anthropometric methods supplement BMI in the assessment of body composition, which can be predicted more accurately. This cross-sectional study aimed to evaluate the association between mid-upper arm circumference (MUAC), triceps skinfold (TSF) thickness, mid-arm muscle circumference (MAMC) and IR in Chinese adults.
Methods: This cross-sectional study analyzed data from the 2009 China Health and Nutrition Survey database. The study population was divided into four groups according to the MUAC quartiles, and the homeostasis mode assessment was used to evaluate the degree of IR. Logistic regression analysis was performed to calculate odds ratios (ORs) with 95% confidence intervals (CIs), with adjustments for multiple covariates. Subgroup analyses stratified by age, sex, BMI, waist circumference (WC), smoking status, and alcohol consumption were performed.
Results: In total, 8,070 participants were included in the analysis. As MUAC increased, BMI, TSF thickness, MAMC, and the proportion of IR tended to increase. However, we found that there was a significant negative association between MUAC and MAMC and IR in the logistic regression analysis, independent of BMI and WC, the ORs for the highest quartiles compared with the lowest quartiles were 0.662 (95%CI: 0.540-0.811) and 0.723 (95%CI: 0.609-0.860), respectively. There was no significant association was observed between the TSF thickness and IR (OR=1.035 [95%CI: 0.870-1.231]). The inverse associations were more pronounced among participants with lower BMI and WC. No significant age-specific differences were observed (P-heterogeneity > 0.05).
Conclusions: After adjusting for BMI and WC, MUAC was negatively associated with IR in Chinese adults, and the association between MUAC and IR was derived from arm muscle instead of subcutaneous fat. MUAC could be an additional predictor of IR besides BMI and WC in clinical practice.
Insulin resistance (IR) plays an important role in the development of metabolic syndrome and type 2 diabetes mellitus (T2DM) (1, 2). The incidence of metabolic syndrome and T2DM is increasing, and T2DM has become a major burden on the healthcare system worldwide, especially in China (3, 4). In addition, IR and metabolic disorders are positively associated with all-cause mortality (5, 6). Therefore, early detection of IR and intensive intervention are effective ways to reduce metabolic diseases and mortality.
Many studies have suggested that anthropometric measurements, such as body mass index (BMI) and waist circumference (WC), can be used as indicators of IR (5, 7–11). However, BMI can only be used as an indicator of overall obesity, and WC is associated with visceral fat (12, 13). Muscle and subcutaneous fat also play a role in the development of IR. Therefore, identifying indicators that can represent muscle and subcutaneous fat and predict IR is important.
Mid-upper arm circumference (MUAC) is a readily available, simple, and inexpensive indicator (14), and some studies have proposed that it could replace other anthropometric measurements as a new indicator for predicting IR. However, different results have been reported regarding the relationship between MUAC and IR. Most studies indicated a positive association between MUAC and the degree of IR (12, 15–17), whereas some studies did not observe this correlation (5). The participants in most studies were mostly middle-aged and elderly adults (5, 16, 17). Several studies were limited to specific populations, such as those with T2DM and obesity (12, 15). In addition, MUAC consists of mid-upper arm fat, which is indicated by triceps skinfold (TSF) thickness, and mid-upper arm muscle, which is indicated by mid-arm muscle circumference (MAMC) (18, 19). Different components may have diverse mechanisms in the metabolic process. To the best of our knowledge, few studies have evaluated the relationship between mid-arm measurements and IR in Chinese adults and examined the effects of muscle and subcutaneous fat. This study aimed to explore the association between MUAC and IR in the Chinese adult population using the China Health and Nutrition Survey (CHNS) database and the roles of TSF thickness and MAMC in the relationship.
The CHNS is an ongoing open large-scale cohort study in China. The CHNS comprised ten rounds of surveys between 1989 and 2015 for investigating the impact of social and economic transformation on the health and nutritional status of the Chinese population. A multistage randomized cluster sampling method was used to select samples from both rural and urban areas of nine representative provinces in mainland China, covering most of the northern and southern regions (20, 21). Detailed information on the survey design and methodology has been reported previously (22). The study was conducted in collaboration with the University of North Carolina at Chapel Hill and the National Institute of Nutrition and Food Safety of the Chinese Center for Disease Control and Prevention, with CHNS data provided by the website (https://www.cpc.unc.edu/projects/china).
In this study, we used CHNS data from 2009, when blood samples were first collected. A total of 9,549 CHNS participants were enrolled (23). Participants were excluded if they met any of the following criteria: missing age and sex data, age <18 years, missing laboratory or anthropometric data, participants who were pregnancy or breast-feeding, fasting glucose levels <3.5 mmol/L, and participants with extreme MUAC values greater than or less than the mean ± three standard deviations. In addition, participants receiving glucose-lowering therapy were also excluded from analysis because their decreased beta-cell function could potentially result in an inaccurate homeostatic model assessment for insulin resistance (HOMA-IR) value.
All research procedures were conducted in accordance with the tenets of the Declaration of Helsinki (as revised in 2013) and were approved by the institutional review boards of the University of North Carolina at Chapel Hill, the National Institute for Nutrition and Health, and the Chinese Center for Disease Control and Prevention. Consent was obtained from each participant.
Mid-arm measurements were performed by trained investigators following the anthropometric standards recommended by the World Health Organization (20). Three measurements were taken for each participant and the mean of these measurements was used in the analysis. With the participant’s elbow fully extended, the MUAC was measured at the midpoint between the ulnar eminence and the acromion of the scapula with an accuracy of 0.1 cm (24). TSF thickness was measured at the midpoint of the posterior line between the olecranon and tip of the acromion using a skinfold caliper and recorded to the nearest 0.5 mm (24). The muscle circumference of the mid-upper arm was calculated using a standard formula (19).
Participants wore light clothing, and their weight was measured using a calibrated beam scale with a weight measurement accurate to 0.1 kg. The height of the participants without shoes was measured using a portable stadiometer accurate to 0.1 cm. BMI was calculated as weight (kg) divided by height (meters) squared. WC was measured at the midpoint between the lowest rib and iliac crest using a non-elastic tape (20). According to the modified NCEP criteria, the cut-off points for WC should be ethnic-specific. Central obesity defined as WC ≥ 90 cm in men or ≥ 85 cm in women in Chinese population (25). Blood pressure was measured three times with the participant in a seated position at 10 min intervals, and the average values of the systolic blood pressure (SBP) and diastolic blood pressure (DBP) were calculated.
A standardized questionnaire was used by the staff to collect background information, medical history, and lifestyle information, including age, sex, educational attainments(low: lower middle school or below; medium: higher middle school or vocational/technical school; high: college/university or higher), smoking status (current/ever smoking or not), alcohol consumption (current/ever drinking or not), and physical activity (low, medium, high) (26). Blood samples were collected from all participants after 12–14 hours of fasting and were stored in test tubes. All blood samples were analyzed at the central laboratory of the China–Japan Friendship Hospital. Fasting blood glucose was measured with a glucose oxidase–peroxidase kit (Landau, UK) (27). The total energy intake was obtained from three consecutive day recalls at the individual level in combination with a weighed food record at the household level (22). Further details on the data are available at https://www.cpc.unc.edu/projects/china. IR was measured using the HOMA-IR as described by Matthews et al. (28). The formula for calculating HOMA-IR was HOMA-IR (mmol/L2) = fasting insulin (mmol/L) × fasting glucose (mmol/L)/22.5. IR was defined as the upper quartile of the HOMA-IR values.
Statistical analysis was performed using the SAS 9.4 statistical software (version 9.4; SAS Institute, Cary, North, USA). Continuous variables were expressed as mean ± standard deviation (M ± SD), and categorical data were expressed as percentages or frequencies. The participants were divided into four groups according to the MUAC quartiles. ANOVA test was performed to compare between-group differences for continuous data, and the Chi-squared test was used to compare between-group differences for categorical data. To investigate whether the effect of MUAC on IR was mainly due to TSF thickness or MAMC, logistic regression was used to evaluate the relationship between MUAC, MAMC, and TSF thickness and IR, respectively. Possible confounding factors were adjusted in the regression models. Model 1 was not adjusted for confounding factors. Model 2 was adjusted for age, sex, smoking, alcohol consumption, physical activity, energy intake, and education level. Model 3 was adjusted for the variables in Model 2 plus total cholesterol (TC), triglycerides (TG), SBP, and DBP. Model 4 was adjusted for the variables in Model 3 and BMI. Model 5 was further adjusted for WC based on Model 4 to eliminate the effect of visceral fat. Subgroup analysis stratified by age, sex, BMI, WC, smoking status, and alcohol consumption was performed to explore the potential effect modification. A two-sided test with P < 0.05 indicates a significant difference.
After applying the exclusion criteria, 8,070 participants with a mean age of 50.2 years, including 4,301 women (53.3%) and 3,769 men (46.7%), were finally included in the study (Figure 1). The numbers of participants younger than 40, 40-60, and older than 60 were 2019 (25%), 3853 (48%), and 2198 (27%), respectively. The average MUAC, MAMC, and TSF thickness in the whole population were 27.1 (3.6) cm, 21.9 (3.4) cm, and 16.4 (7.7) mm, respectively. The study population was divided into four groups according to the MUAC quartiles. As the MUAC levels increased, the proportion of men, smoking, drinking, IR, and central obesity tended to increase. Participants in the highest MUAC quartile demonstrated high values in height, weight, BMI, TSF thickness, MAMC, hip circumference, WC, SBP, DBP, fasting blood glucose, fasting insulin, HbA1c, TG, TC, HOMA-IR, low-density lipoprotein cholesterol, and C-reactive protein levels; however, the participants in the highest MUAC quartile exhibited low high-density lipoprotein cholesterol levels. There were no statistical differences in educational attainment levels among the groups (Table 1).
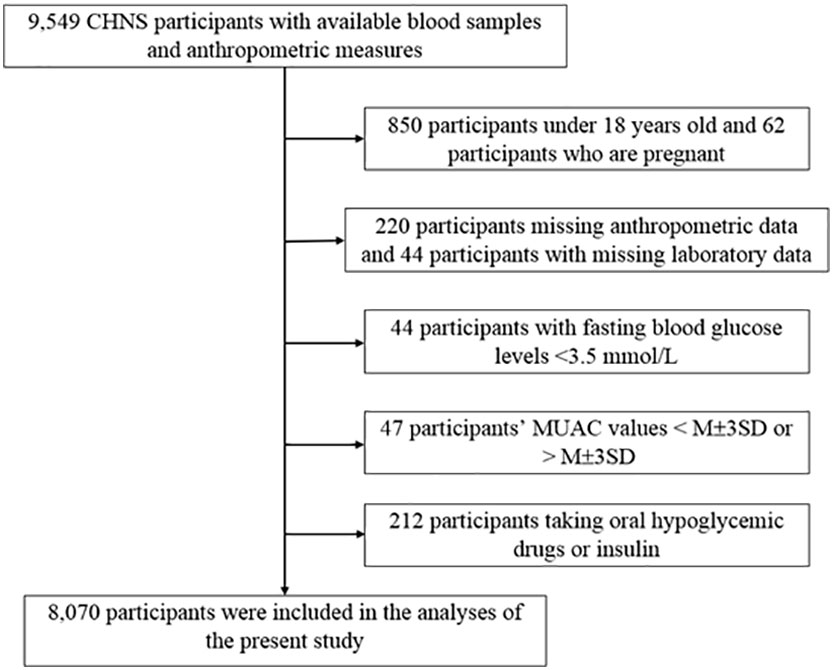
Figure 1 Flowchart of study participants. CHNS, the China Health and Nutrition Survey; MUAC, mid-upper arm circumference; M, mean; SD, Standard deviation.
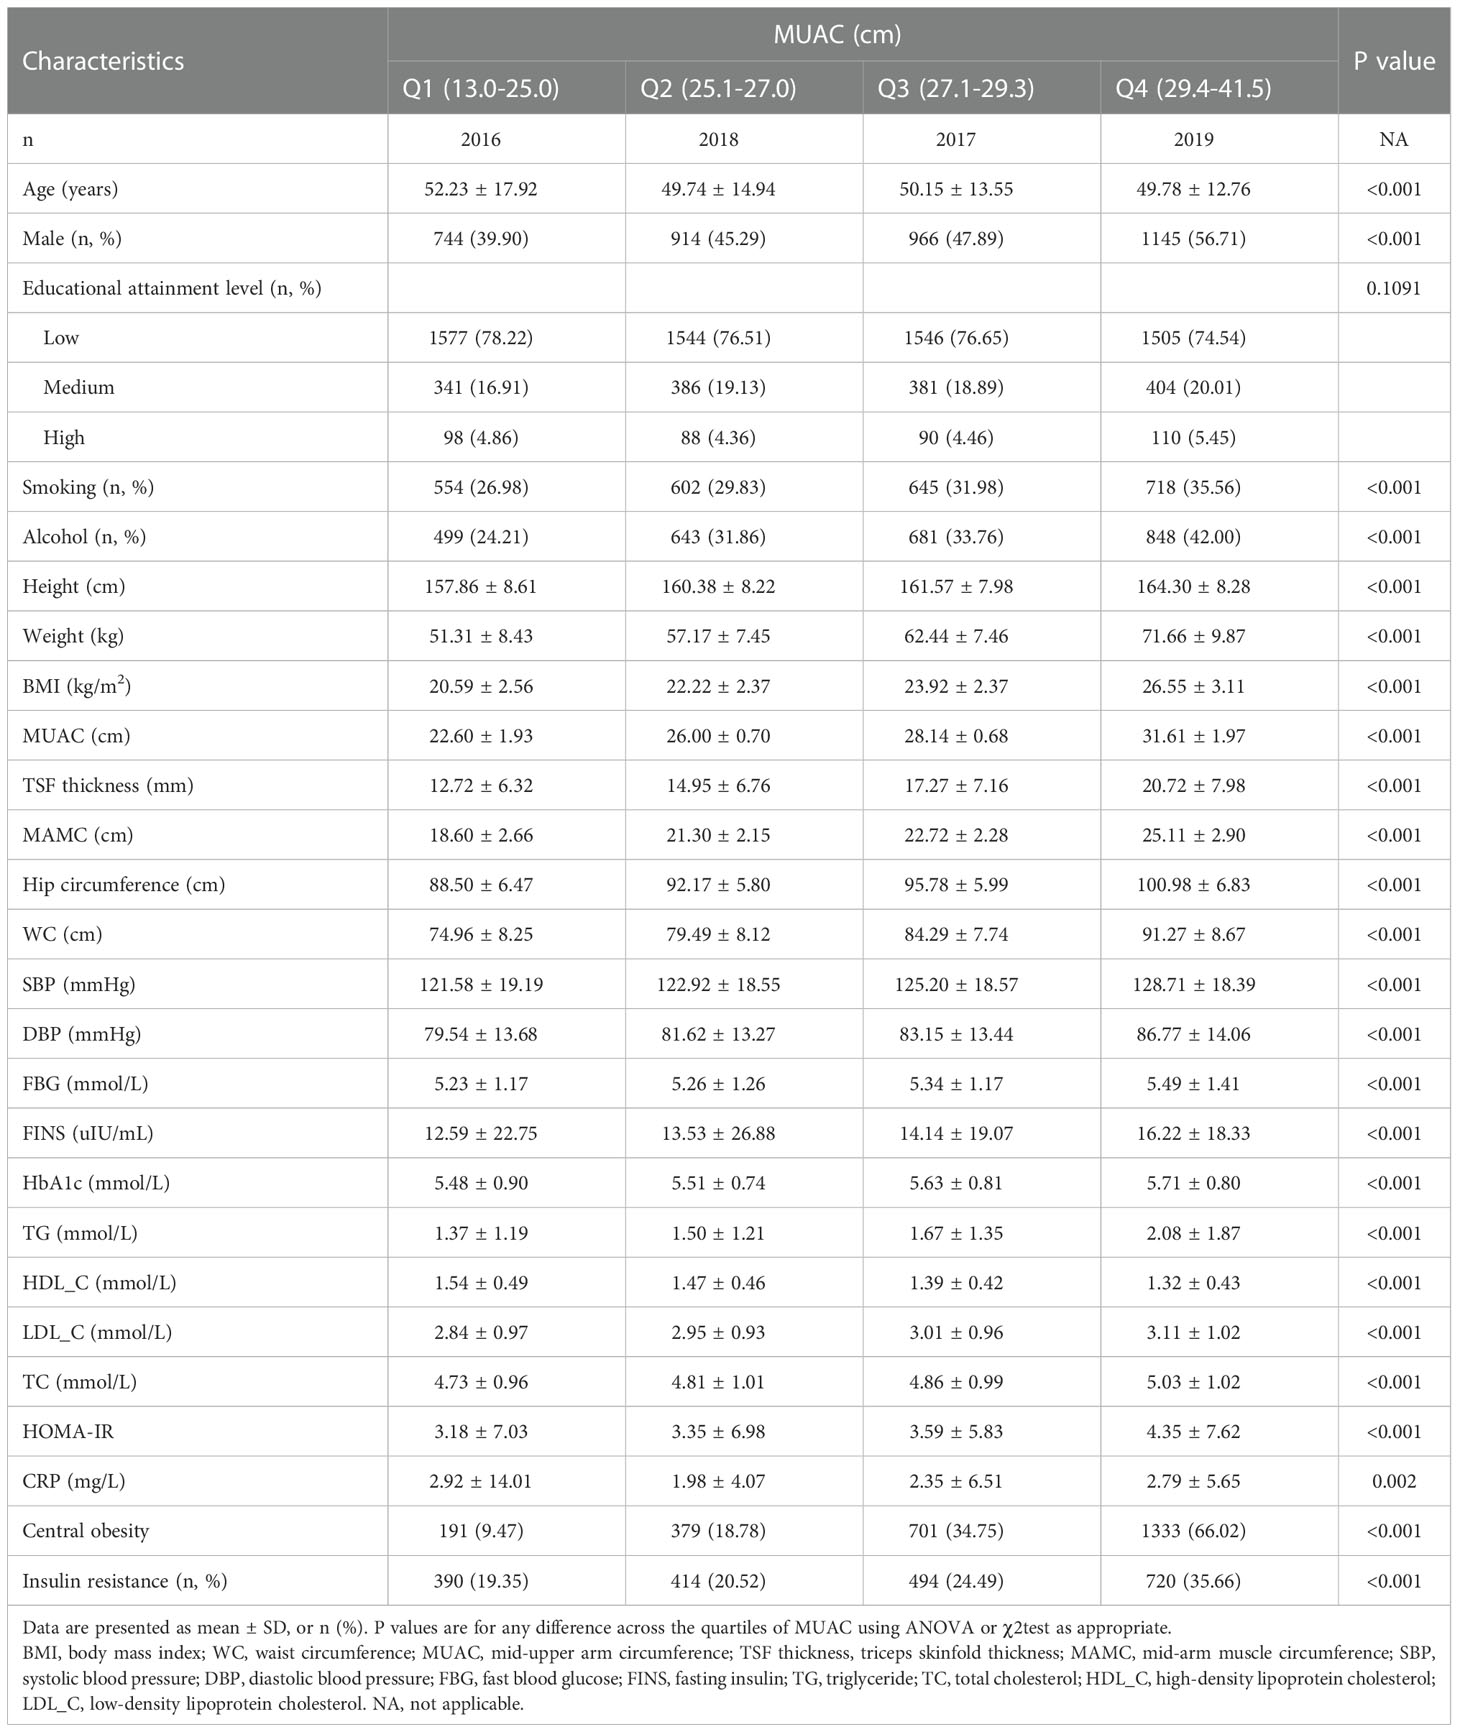
Table 1 Baseline characteristics of the study population according to mid-upper arm circumference quartiles.
MUAC, TSF thickness, and MAMC were divided into quartiles, with the lowest quartile considered as the reference group. Logistic regression analysis was performed to evaluate the association between MUAC, MAMC, and TSF thickness and IR after adjusting for covariates. In Models 1–3, MUAC, MAMC, and TSF thickness were significantly positively associated with IR (P < 0.001) (Table 2). However, after further adjustment for BMI, the relationship between MUAC and IR reversed. MUAC was negatively associated with IR, and the odds ratio (OR) was 0.763 (95% confidence interval [CI]: 0.627–0.929) for the highest versus the lowest quartiles. Similar to MUAC, MAMC became a protective factor in Model 4, and the OR was 0.756 (95%CI: 0.637–0.897) for the highest quartile compared to the lowest quartile. Unlike MUAC and MAMC, after further adjustment for BMI in Model 4, the relationship between TSF thickness and IR was insignificant, and the OR for the highest quartile was 1.117 (95%CI: 0.942–1.326) compared to the lowest quartile.
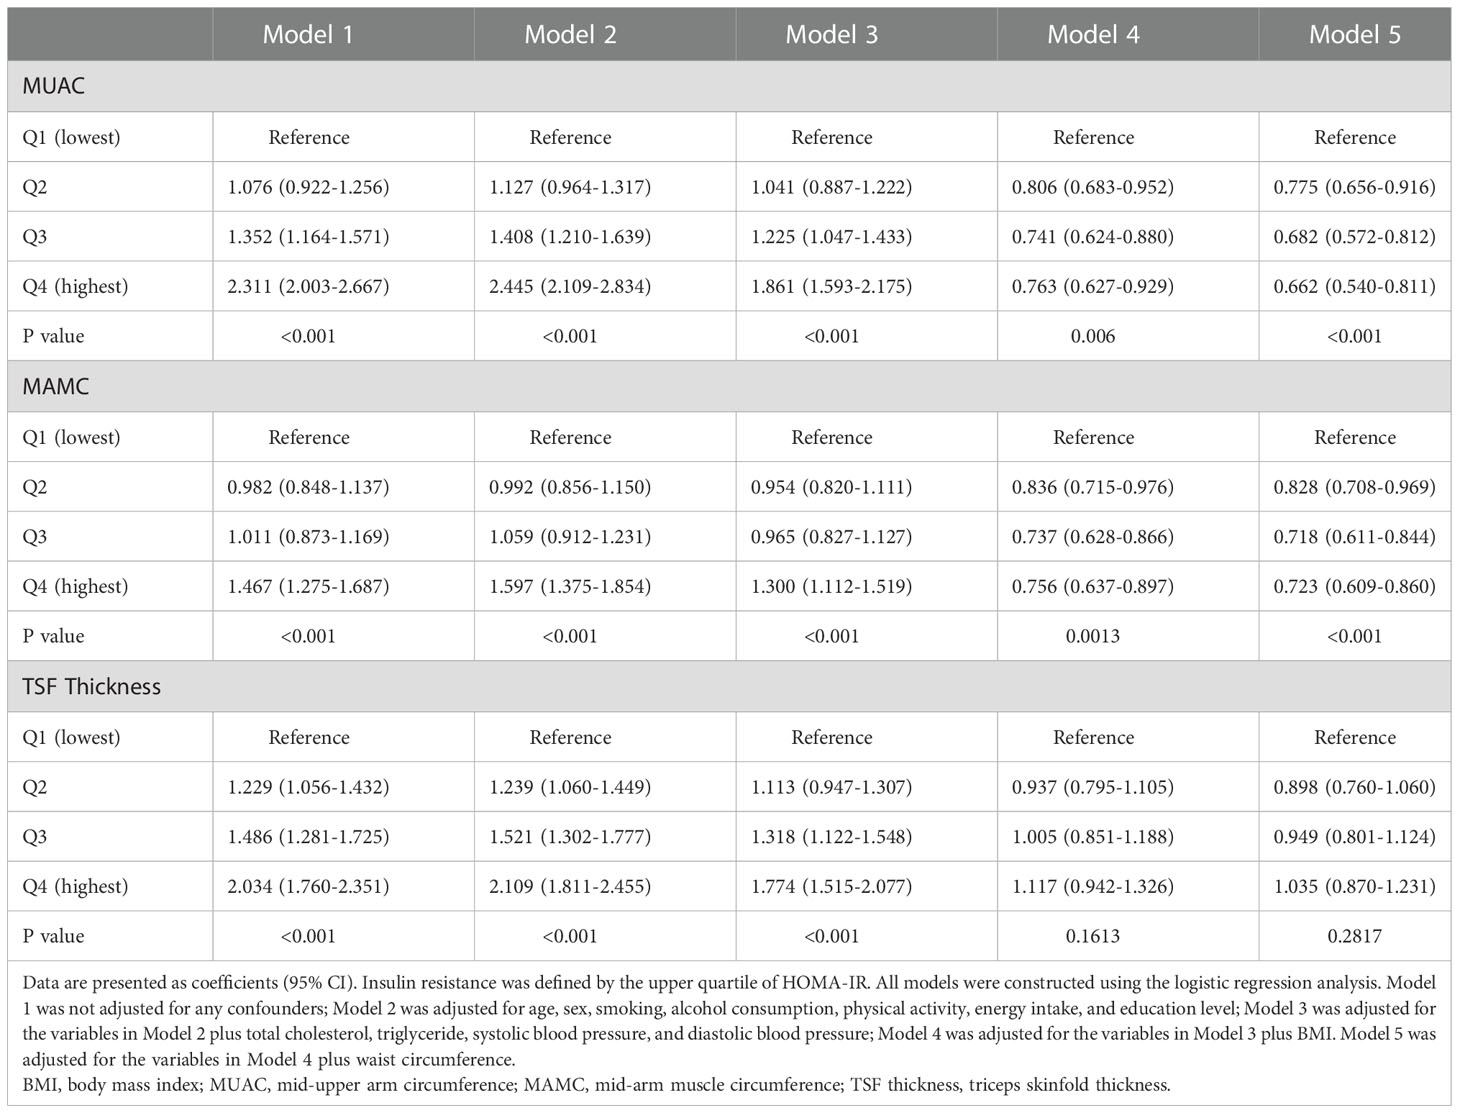
Table 2 Association between mid-upper measurements and insulin resistance in participants.
With further adjustment for WC, MUAC and MAMC consistently remained inversely associated with IR, with the effect being more pronounced (Table 2), and the ORs of the highest quartiles over the lowest quartiles were 0.662 (95%CI: 0.540–0.811) and 0.723 (95%CI: 0.609-0.860), respectively. TSF thickness still did not indicate an association with IR with further adjustment for WC, and the OR for the highest quartile was 1.035 (95%CI: 0.870-1.231) over the lowest quartile.
Subgroup analyses were conducted to explore whether the relationships between MUAC, MAMC, and TSF thickness and IR were influenced by other potential factors (Table 3). The models were adjusted for age, sex, smoking status, alcohol consumption, physical activity, educational attainment levels, energy intake, TC, TG, SBP, DBP, BMI, and WC. The modified effects of BMI and WC on the relationship between MUAC and IR were significant (P-heterogeneity < 0.05). The protective effect of MUAC on IR attenuated as BMI and WC increased. We observer a declining trend in the association between MAMC and IR with increasing BMI or WC, which was mainly consistent with MUAC. No significant modified effects of age, sex, smoking status or alcohol consumption were observed (P-heterogeneity > 0.05).
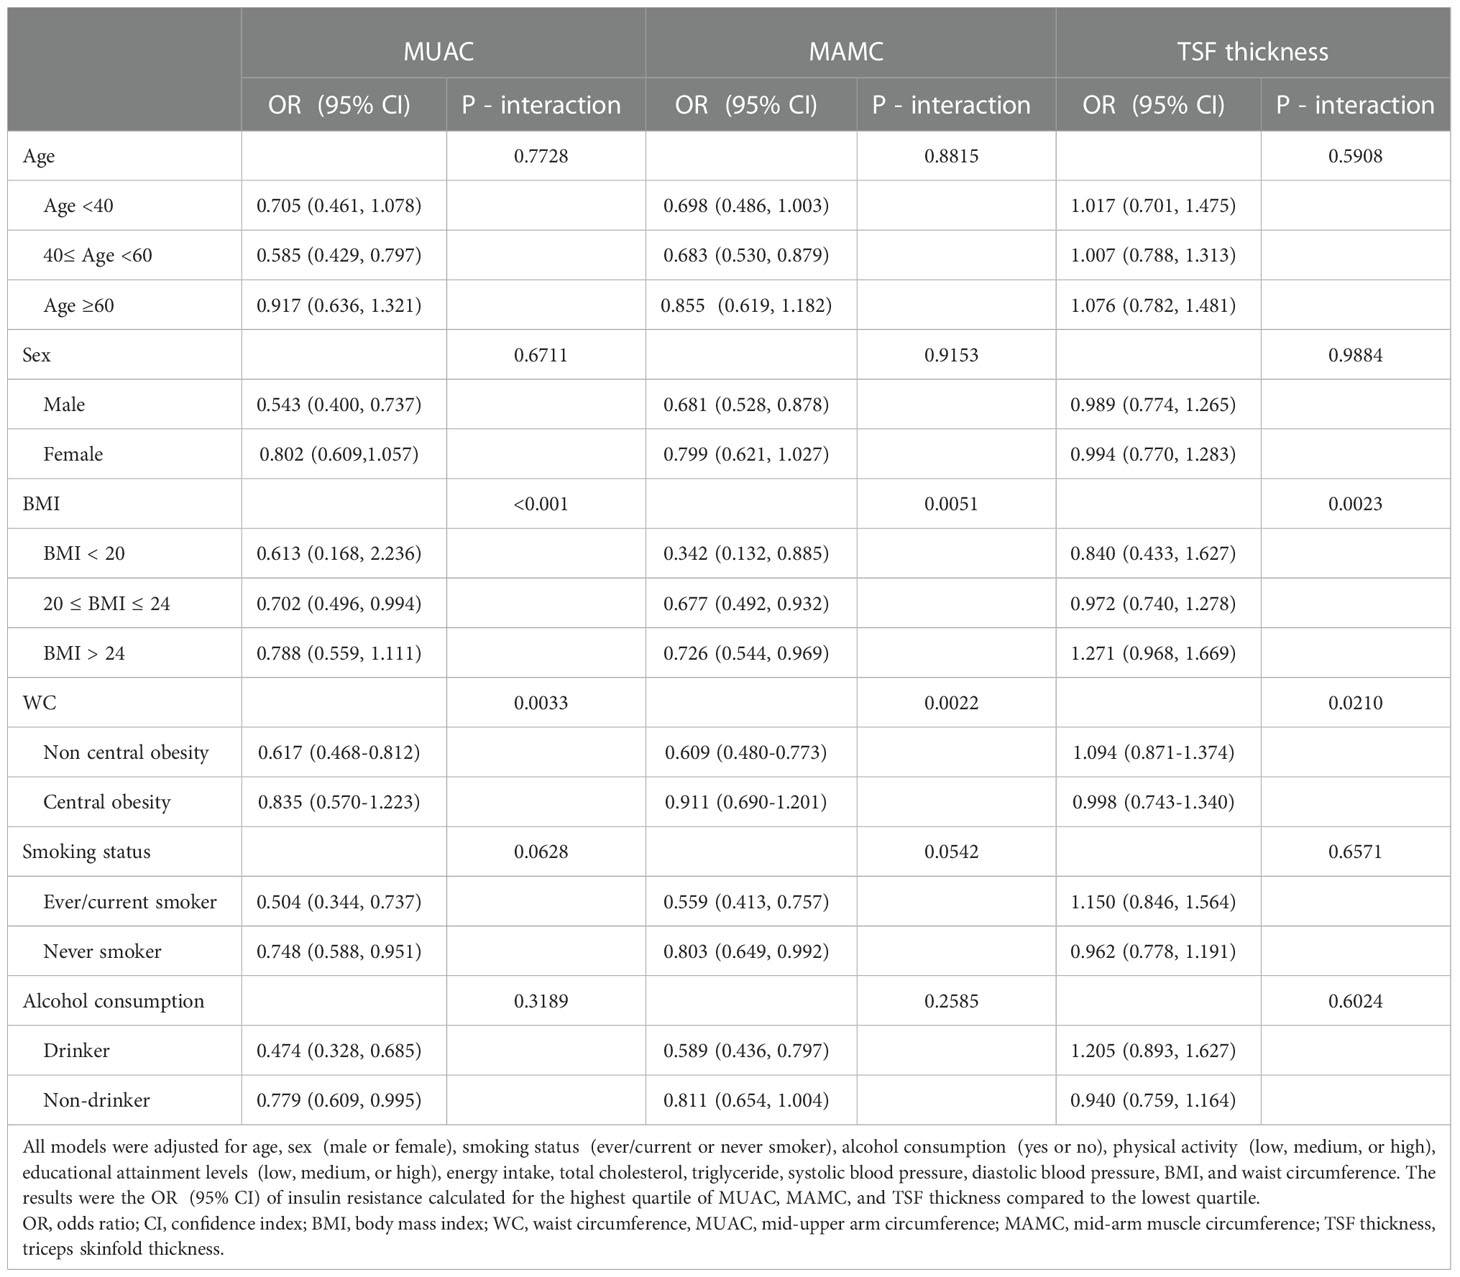
Table 3 Association between mid-upper measurements and insulin resistance stratified by age, sex, BMI, WC, smoking status, and alcohol consumption.
In this study, we observed a negative association between MUAC and MAMC and IR, which is independent of BMI and WC. No significant association was observed between TSF thickness and IR. The results of MUAC and MAMC were consistent, which may indicate that the protective effect on IR mainly comes from muscle but not subcutaneous fat. In addition, the finding did not differ significantly among different age groups. The results implied that MUAC could be used to predict IR and the effects of MUAC on IR should receive more attention.
In clinical practice and research, BMI representing overall obesity is considered to be associated with metabolic risk and can predict IR. But substantial evidence has demonstrated that visceral fat has a detrimental effect on IR. Therefore, WC is often used as an indicator of visceral fat mass to help further screen for individuals with high metabolic risk (12, 13). Furthermore, whether other anthropometric methods independent of BMI and WC can help better predict metabolic risk. As a readily available, simple, inexpensive, and non-invasive anthropometric measurement, MUAC is often used as an indicator to assess nutritional status (29, 30). However, many recent studies have explored the association between MUAC and metabolic risk factors (15, 16). Several studies have revealed the association between MUAC and IR, some of which have identified a positive association between MUAC and IR (5, 12). But these studies did not adjust for the effect of BMI on the relationship between MUAC and IR, which may not reflect the true relationship. Only one study has reported that the association between MUAC and IR disappeared after adjusting for BMI in logistic regression model (5). The study population was from the United States, whereas the study population in the current study was from China, ethnic differences may have contributed to the different results. Their study focused on middle-aged and elderly adults, while the current study population comprised adults aged >18 years.
Furthermore, the relationship between MAMC and IR was consistent with that between MUAC and IR, which may indicate that the protective effect of MUAC on IR is derived from MAMC. Similar results have been reported in previous studies, with consistent effects of MUAC and MAMC on clinical outcomes (31–33). In our study, MUAC and MAMC levels were negatively associated with IR. However, different results have also been reported. A previous study discovered that greater muscle mass may promote the development of IR (8, 34); but it did not adjust for BMI as a confounding factor, which may account for the different results. By contrast, the findings of a cross-sectional study were consistent with the present study that IR was significantly associated with lower muscle mass after adjusting for BMI (35). Nevertheless, the population in their study comprised elderly adults, which may not be generalizable. The current study expanded the population and observed that this relationship also existed in the young population. Skeletal muscle is the largest organ in the body and also the regulator of glucose homeostasis. Insulin could increase glucose uptake by skeletal muscle cells through activation of glucose transporter protein 4 (GLUT4). 80% of postprandial glucose is taken up by muscle from circulation and stored as glycogen (36, 37). Therefore, muscle plays a key role in the association between MUAC and IR.
After adjusting for BMI in the logistic regression analysis, the relationship between TSF thickness and IR disappeared. Further adjustment for WC, which represents visceral fat, indicated that the association between TSF thickness and IR remained uncorrelated. BMI is often used as an indicator of overall obesity. A previous study has revealed that in the Asian population, BMI was weakly correlated with overall fat mass but more strongly correlated with visceral fat mass. As visceral adipose tissue mass increased, IR became more severe (38). This indicated that visceral fat plays a more important role in the development of IR (39). There was a mechanism that may explain the non-significant association between TSF thickness and IR. The amount of ectopic fat accumulation, rather than subcutaneous fat accumulation, has been suggested to be associated with metabolic complications (40, 41). Subcutaneous adipose tissue preferentially stores energy surplus (13, 41). When a cutoff point of subcutaneous adipocyte expansion is reached, it leads to adipocyte hypertrophy, decreased fat synthesis, decreased angiogenesis, and subcutaneous adipose fibrosis, prompting the efflux of free fatty acids and ectopic accumulation, which eventually leads to IR (38, 42). Therefore, the expansion of subcutaneous adipose tissue is an important factor in the development of IR (40, 41).
Additionally, this study explored potential effects on the relationship between mid-arm measurements and IR. Our study found that BMI and WC modification was associated with the negative relationship between MUAC and IR. Although the protective effect of MUAC on IR diminished with the increase of BMI or WC, the relationship between MUAC and IR remained the same among different groups. Previous studies included middle-aged and/or elderly participants, we also included all participant aged above 18 and subjects those who was younger than 40 years old accounted for a quarter of the study population. Age-specific effect was not observed in this relationship, which may suggest that the current findings can also be applied to younger age groups.
This large-scale cross-sectional study has some limitations. First, this study was a cross-sectional study, thus, observing long-term changes in causal relationships was not possible. Second, our study was observational, and residual and unmeasured confounding factors may have existed. Third, only Chinese adults were included in this study, future research exploring whether the results are applicable to other populations is needed.
In conclusion, after adjusting for BMI and WC, MUAC was negatively associated with IR in the Chinese adult population. This relationship was mainly derived from MAMC, while TSF thickness was not significantly associated with IR. Mid-arm measurements can be used as a supplement to BMI to better assess IR. At the same BMI level, a larger MUAC would be protective against IR. The protective effects of MUAC existed not only in elderly, but also in young adults. Our findings may help clinicians to determine IR more accurately and to understand the pathophysiology of IR more clearly in clinical practice.
The raw data supporting the conclusions of this article will be made available by the authors, without undue reservation.
The studies involving human participants were reviewed and approved by the University of North Carolina at Chapel Hill, the National Institute for Nutrition and Health, and the Chinese Center for Disease Control and Prevention. The patients/participants provided their written informed consent to participate in this study.
The conception and design of the study: HZ, LH, and JW. Acquisition of the data: JW, LH, NY, and HZ. Analysis and interpretation of the data: JW, LH, and HZ. Draft of the article: JW, LH, HZ, and YL. Critical revision for important intellectual content: JW, LH, NY, LX, FP, WL, HZ and YL. Final approval of the version to be published: All authors. Funding acquisition: HZ and YL. Supervision: HZ and YL. Agreement to be accountable for all aspects of the work: All authors. All authors contributed to the article and approved the submitted version.
This work was supported by grants from National High Level Hospital Clinical Research Funding (2022-PUMCH-B-015), the Beijing Municipal Natural Science Foundation (No. M22014), the CAMS Innovation Fund for Medical Sciences (No. 2021-1-I2M-002), and the National Natural Science Foundation of China (No. 91846106).
This research uses data from China Health and Nutrition Survey (CHNS). We thank the National Institute of Nutrition and Food Safety, China Center for Disease Control and Prevention, Carolina Population Center, the University of North Carolina at Chapel Hill, the NIH (R01-HD30880, DK056350, and R01-HD38700) and the Fogarty International Center, NIH for financial support for the CHNS data collection and analysis. We also thank s the China-Japan Friendship Hospital and Ministry of Health for support for their support with the CHNS 2009 survey.
The authors declare that the research was conducted in the absence of any commercial or financial relationships that could be construed as a potential conflict of interest.
All claims expressed in this article are solely those of the authors and do not necessarily represent those of their affiliated organizations, or those of the publisher, the editors and the reviewers. Any product that may be evaluated in this article, or claim that may be made by its manufacturer, is not guaranteed or endorsed by the publisher.
T2DM, type 2 diabetes mellitus; IR, insulin resistance; MUAC, mid-upper arm circumference; MAMC, mid-arm muscle circumference; TSF, triceps skinfold thickness; BMI, body mass index; WC, waist circumference; CNHS, China Health and Nutrition Survey; SBP, systolic blood pressure; DBP, diastolic blood pressure; HOMA-IR, homeostatic model assessment for insulin resistance; TC, total cholesterol; TG, triglyceride; OR, odds ratio; CI, confidence interval.
1. Ke C, Narayan KMV, Chan JCN, Jha P, Shah BR. Pathophysiology, phenotypes and management of type 2 diabetes mellitus in Indian and Chinese populations. Nat Rev Endocrinol (2022) 18:413–32. doi: 10.1038/s41574-022-00669-4
2. Rachdaoui N. Insulin: The friend and the foe in the development of type 2 diabetes mellitus. Int J Mol Sci (2020) 21:1770. doi: 10.3390/ijms21051770
3. Ma RCW. Epidemiology of diabetes and diabetic complications in China. Diabetologia (2018) 61:1249–60. doi: 10.1007/s00125-018-4557-7
4. Chen XW, Ding G, Xu L, Li P. A glimpse at the metabolic research in China. Cell Metab (2021) 33:2122–5. doi: 10.1016/j.cmet.2021.09.014
5. Chao YP, Kao TW, Chang YW, Peng TC, Chen WL, Wu LW. Utilization of anthropometric parameters as a novel tool for detection of insulin resistance. Clin Nutr (2020) 39:2571–9. doi: 10.1016/j.clnu.2019.11.023
6. Hong SH, Choi KM. Sarcopenic obesity, insulin resistance, and their implications in cardiovascular and metabolic consequences. Int J Mol Sci (2020) 21:494. doi: 10.3390/ijms21020494
7. Laohabut I, Udol K, Phisalprapa P, Srivanichakorn W, Chaisathaphol T, Washirasaksiri C, et al. Neck circumference as a predictor of metabolic syndrome: A cross-sectional study. Prim Care Diabetes (2020) 14:265–73. doi: 10.1016/j.pcd.2019.08.007
8. Chao Y-P, Lai Y-F, Kao T-W, Peng T-C, Lin Y-Y, Shih M-T, et al. Mid-arm muscle circumference as a surrogate in predicting insulin resistance in non-obese elderly individuals. Oncotarget (2017) 8:79775–84. doi: 10.18632/oncotarget.19340
9. Sasaki R, Yano Y, Yasuma T, Onishi Y, Suzuki T, Maruyama-Furuta N, et al. Association of waist circumference and body fat weight with insulin resistance in Male subjects with normal body mass index and normal glucose tolerance. Intern Med (2016) 55:1425–32. doi: 10.2169/internalmedicine.55.4100
10. Kim KY, Moon HR, Yun JM. Neck circumference as a predictor of metabolic syndrome in koreans: A cross-sectional study. Nutrients (2021) 13:3029. doi: 10.3390/nu13093029
11. Yan Q, Sun D, Li X, Zheng Q, Long H, Feng B. Neck circumference and incidence of type 2 diabetes in Chinese elderly individuals: A community-based cohort study. Obes Facts (2021) 14:450–5. doi: 10.1159/000514219
12. Zhu Y, Lin Q, Zhang Y, Deng H, Hu X, Yang X, et al. Mid-upper arm circumference as a simple tool for identifying central obesity and insulin resistance in type 2 diabetes. PloS One (2020) 15:e0231308. doi: 10.1371/journal.pone.0231308
13. Goossens GH. The metabolic phenotype in obesity: Fat mass, body fat distribution, and adipose tissue function. Obes Facts (2017) 10:207–15. doi: 10.1159/000471488
14. Benitez Brito N, Suarez Llanos JP, Fuentes Ferrer M, Oliva Garcia JG, Delgado Brito I, Pereyra-Garcia Castro F, et al. Relationship between mid-upper arm circumference and body mass index in inpatients. PloS One (2016) 11:e0160480. doi: 10.1371/journal.pone.0160480
15. Sagun G, Oguz A, Karagoz E, Filizer AT, Tamer G, Mesci B. Application of alternative anthropometric measurements to predict metabolic syndrome. Clinics (2014) 69:347–53. doi: 10.6061/clinics/2014(05)09
16. Hou Y, Jia X, Xuan L, Zhu W, Deng C, Wang L, et al. Association between mid-upper arm circumference and cardiometabolic risk in Chinese population: a cross-sectional study. BMJ Open (2019) 9:e028904. doi: 10.1136/bmjopen-2019-028904
17. Shi J, Yang Z, Niu Y, Zhang W, Li X, Zhang H, et al. Large Mid-upper arm circumference is associated with metabolic syndrome in middle-aged and elderly individuals: a community-based study. BMC Endocrine Disord (2020) 20:78. doi: 10.1186/s12902-020-00559-8
18. Schaap LA, Quirke T, Wijnhoven HAH, Visser M. Changes in body mass index and mid-upper arm circumference in relation to all-cause mortality in older adults. Clin Nutr (2017) 37:2252–9. doi: 10.1016/j.clnu.2017.11.004
19. Huang CX, Tighiouart H, Beddhu S, Cheung AK, Dwyer JT, Eknoyan G, et al. Both low muscle mass and low fat are associated with higher all-cause mortality in hemodialysis patients. Kidney Int (2010) 77:624–9. doi: 10.1038/ki.2009.524
20. Song P, Li X, Bu Y, Ding S, Zhai D, Wang E, et al. Temporal trends in normal weight central obesity and its associations with cardiometabolic risk among Chinese adults. Sci Rep (2019) 9:5411. doi: 10.1038/s41598-019-41986-5
21. Huang L, Wang H, Wang Z, Zhang J, Zhang B, Ding G. Regional disparities in the association between cereal consumption and metabolic syndrome: Results from the China health and nutrition survey. Nutrients (2019) 11:764. doi: 10.3390/nu11040764
22. Zhang B, Zhai FY, Du SF, Popkin BM. The China health and nutrition survey, 1989-2011. Obes Rev (2014) 15(Suppl 1):2–7. doi: 10.1111/obr.12119
23. Zhao W, Zhang J, Zhao A, Wang M, Wu W, Tan S, et al. Using an introduced index to assess the association between food diversity and metabolic syndrome and its components in Chinese adults. BMC Cardiovasc Disord (2018) 18:189. doi: 10.1186/s12872-018-0926-x
24. He L, Yang N, Wang J, Huang J, Li W, Xu L, et al. Mid-arm muscle and subcutaneous fat associated with all-cause mortality independent of BMI: A prospective cohort study. Obes (Silver Spring) (2021) 29:1203–14. doi: 10.1002/oby.23179
25. Association DBoCM Guideline for the prevention and treatment of type 2 diabetes mellitus in China (2020 edition). Chin J Pract Internal Med (2021) 41:757–84. doi: 10.19538/j.nk2021090106
26. Xu X, Hall J, Byles J, Shi Z. Dietary pattern, serum magnesium, ferritin, c-reactive protein and anaemia among older people. Clin Nutr (2017) 36:444–51. doi: 10.1016/j.clnu.2015.12.015
27. Wang H, Yu Y, Tian X. Does eating-Away-from-Home increase the risk of a metabolic syndrome diagnosis? Int J Environ Res Public Health (2019) 16:575. doi: 10.3390/ijerph16040575
28. Matthews DR, Hosker JR, Rudenski AS, Naylor BA, Treacher DF, Turner RC. Homeostasis model assessment: insulin resistance and beta-cell function from fasting plasma glucose and insulin concentrations in man. Diabetologia (1985) 28:412–9. doi: 10.1007/BF00280883
29. Sisay BG, Haile D, Hassen HY, Gebreyesus SH. Performance of mid-upper arm circumference as a screening tool for identifying adolescents with overweight and obesity. PloS One (2020) 15:e0235063. doi: 10.1371/journal.pone.0235063
30. Reilly JJ. Mid-upper arm circumference (MUAC): new applications for an old measure. Arch Dis Child (2017) 102:1–2. doi: 10.1136/archdischild-2016-311682
31. de Almeida Roediger M, de Fatima Nunes Marucci M, Quintiliano Scarpelli Dourado DA, de Oliveira C, Licio Ferreira Santos J, de Oliveira Duarte YA. Body composition changes and 10-year mortality risk in older Brazilian adults: Analysis of prospective data from the SABE study. J Nutr Health Aging (2019) 23:51–9. doi: 10.1007/s12603-018-1118-1
32. Kim G, Lee SE, Jun JE, Lee YB, Ahn J, Bae JC, et al. Increase in relative skeletal muscle mass over time and its inverse association with metabolic syndrome development: a 7-year retrospective cohort study. Cardiovasc Diabetol (2018) 17:23. doi: 10.1186/s12933-018-0659-2
33. Aleman-Mateo H, Lopez Teros MT, Ramirez FA, Astiazaran-Garcia H. Association between insulin resistance and low relative appendicular skeletal muscle mass: evidence from a cohort study in community-dwelling older men and women participants. J Gerontol A Biol Sci Med Sci (2014) 69:871–7. doi: 10.1093/gerona/glt193
34. Ghachem A, Lagace JC, Brochu M, Dionne IJ. Fat-free mass and glucose homeostasis: is greater fat-free mass an independent predictor of insulin resistance? Aging Clin Exp Res (2018) 31:447–54. doi: 10.1007/s40520-018-0993-y
35. Seko T, Akasaka H, Koyama M, Himuro N, Saitoh S, Miura T, et al. Lower limb muscle mass is associated with insulin resistance more than lower limb muscle strength in non-diabetic older adults. Geriatr Gerontol Int (2019) 19:1254–9. doi: 10.1111/ggi.13805
36. Merz KE, Thurmond DC. Role of skeletal muscle in insulin resistance and glucose uptake. Compr Physiol (2020) 10:785–809. doi: 10.1002/cphy.c190029
37. James DE, Stockli J, Birnbaum MJ. The aetiology and molecular landscape of insulin resistance. Nat Rev Mol Cell Biol (2021) 22:751–71. doi: 10.1038/s41580-021-00390-6
38. Alba DL, Farooq JA, Lin MYC, Schafer AL, Shepherd J, Koliwad SK. Subcutaneous fat fibrosis links obesity to insulin resistance in Chinese americans. J Clin Endocrinol Metab (2018) 103:3194–204. doi: 10.1210/jc.2017-02301
39. Miao Z, Alvarez M, Ko A, Bhagat Y, Rahmani E, Jew B, et al. The causal effect of obesity on prediabetes and insulin resistance reveals the important role of adipose tissue in insulin resistance. PloS Genet (2020) 16:e1009018. doi: 10.1371/journal.pgen.1009018
40. Stefan N. Causes, consequences, and treatment of metabolically unhealthy fat distribution. Lancet Diabetes Endocrinol (2020) 8:616–27. doi: 10.1016/s2213-8587(20)30110-8
41. Gustafson B, Hedjazifar S, Gogg S, Hammarstedt A, Smith U. Insulin resistance and impaired adipogenesis. Trends Endocrinol Metab (2015) 26:193–200. doi: 10.1016/j.tem.2015.01.006
Keywords: mid-upper arm circumference, insulin resistance, mid-arm muscle circumference, triceps skinfold thickness, body composition
Citation: Wang J, He L, Yang N, Li Z, Xu L, Li W, Ping F, Zhang H and Li Y (2022) Large mid-upper arm circumference is associated with reduced insulin resistance independent of BMI and waist circumference: A cross-sectional study in the Chinese population. Front. Endocrinol. 13:1054671. doi: 10.3389/fendo.2022.1054671
Received: 27 September 2022; Accepted: 07 December 2022;
Published: 23 December 2022.
Edited by:
Bert B. Little, University of Louisville, United StatesReviewed by:
Zhicheng Liu, Anhui Medical University, ChinaCopyright © 2022 Wang, He, Yang, Li, Xu, Li, Ping, Zhang and Li. This is an open-access article distributed under the terms of the Creative Commons Attribution License (CC BY). The use, distribution or reproduction in other forums is permitted, provided the original author(s) and the copyright owner(s) are credited and that the original publication in this journal is cited, in accordance with accepted academic practice. No use, distribution or reproduction is permitted which does not comply with these terms.
*Correspondence: Huabing Zhang, aHVhYmluZ3poYW5nY2huQDE2My5jb20=; Yuxiu Li, bGl5dXhpdUBtZWRtYWlsLmNvbS5jbg==
†These authors have contributed equally to this work and share first authorship
Disclaimer: All claims expressed in this article are solely those of the authors and do not necessarily represent those of their affiliated organizations, or those of the publisher, the editors and the reviewers. Any product that may be evaluated in this article or claim that may be made by its manufacturer is not guaranteed or endorsed by the publisher.
Research integrity at Frontiers
Learn more about the work of our research integrity team to safeguard the quality of each article we publish.