 Joana Saraiva Rodrigues1
 Andreia Faria-Pereira2
 Sérgio Póvoas Camões1
 Ana Sofia Serras1
 Vanessa Alexandra Morais2
 Jorge Lira Ruas3
 Joana Paiva Miranda1*
- 1Research Institute for Medicines (imed.ULisboa), Faculty of Pharmacy, Universidade de Lisboa, Lisbon, Portugal
- 2Instituto de Medicina Molecular João Lobo Antunes, Faculdade de Medicina, Universidade de Lisboa, Lisbon, Portugal
- 3Department of Physiology and Pharmacology, Biomedicum, Karolinska Institutet, Stockholm, Sweden
Introduction: The development of reliable hepatic in vitro models may provide insights into disease mechanisms, linking hepatocyte dysmetabolism and related pathologies. However, several of the existing models depend on using high concentrations of hepatocyte differentiation-promoting compounds, namely glucose, insulin, and dexamethasone, which is among the reasons that have hampered their use for modeling metabolism-related diseases. This work focused on modulating glucose homeostasis and glucocorticoid concentration to improve the suitability of a mesenchymal stem-cell (MSC)-derived hepatocyte-like cell (HLC) human model for studying hepatic insulin action and disease modeling.
Methods: We have investigated the role of insulin, glucose and dexamethasone on mitochondrial function, insulin signaling and carbohydrate metabolism, namely AKT phosphorylation, glycogen storage ability, glycolysis and gluconeogenesis, as well as fatty acid oxidation and bile acid metabolism gene expression in HLCs. In addition, we evaluated cell morphological features, albumin and urea production, the presence of hepatic-specific markers, biotransformation ability and mitochondrial function.
Results: Using glucose, insulin and dexamethasone levels close to physiological concentrations improved insulin responsiveness in HLCs, as demonstrated by AKT phosphorylation, upregulation of glycolysis and downregulation of Irs2 and gluconeogenesis and fatty acid oxidation pathways. Ammonia detoxification, EROD and UGT activities and sensitivity to paracetamol cytotoxicity were also enhanced under more physiologically relevant conditions.
Conclusion: HLCs kept under reduced concentrations of glucose, insulin and dexamethasone presented an improved hepatic phenotype and insulin sensitivity demonstrating superior potential as an in vitro platform for modeling energy metabolism-related disorders, namely for the investigation of the insulin signaling pathway.
Introduction
Obesity, considered a global epidemic and a major cause of death, is closely related to insulin resistance (IR) that may lead to non-alcoholic fatty liver disease (NAFLD) and type 2 diabetes (T2D). Playing a key role in the control of systemic glucose and lipid metabolism, the liver is a crucial insulin target organ. It is the main source of endogenous glucose, produced via gluconeogenesis, and thus has a key part in IR and associated disorders. Moreover, insulin has a direct action on the control of glucose metabolism in hepatocytes (1). Therefore, identifying the specific role of insulin on hepatocyte metabolism in physiological and in IR conditions is crucial to unravel the link between IR and related pathological conditions. However, for this field to progress there is a need for human-based physiologically relevant hepatic culture models that enable investigating insulin action in the hepatocyte and its role in metabolic homeostasis and disease progression.
The well-described drawbacks associated to the use of human primary hepatocytes (hpHeps) have promoted a growing interest within the scientific community for developing reliable human physiological hepatic models, namely by deriving hepatocyte-like cells (HLCs) from induced pluripotent stem cells (iPSCs), mesenchymal stem cells (MSCs) or other stem cells (2–6). In particular, our group has previously characterized and validated the use of MSC-derived HLCs, namely in comparison with other cell lines, which support the use of these HLCs for other applications, namely as an in vitro platform for disease modeling (4, 5). Still, a fully mature and stable hepatic phenotype has not been reached yet. Strategies to counteract the loss of hepatocyte function, viability and the differentiated phenotype in culture rely deeply on the use of differentiation-promoting compounds, such as glucose, dexamethasone and insulin (7–11).
Although it is appreciated that dexamethasone and other glucocorticoids can differentially regulate some drug-detoxifying enzymes, such as cytochrome P450 (CYP) enzymes, it is not clear what their role is in hepatic differentiation. In fact, dexamethasone selectively induces or inhibits some CYP isoforms while hyper- and hypo-glycemic conditions also cause differences in the functionality of different CYP isoforms (12–14). Moreover, the involvement of glucose or insulin in hepatic differentiation is also not fully understood, and the concentrations used are often far from human physiological values (within the millimolar range for glucose and nanomolar range for insulin). This ultimately interferes with energy homeostasis and eventually causes IR in vitro, compromising the use of these models for studying metabolic disease development or progression (13). As for the insulin signaling pathway in in vitro hepatic models, this remains largely uncharacterized. A recent study has directly compared insulin action in several hepatic cell lines, showing that none of them resemble pHeps in terms of energy metabolism (1). The authors attributed the inadequacy of the different cell lines for metabolism studies or disease modeling to defective levels of gluconeogenic enzymes and glucose production or insulin unresponsiveness.
Here, we investigated the effects of reducing insulin and dexamethasone levels in glucose metabolism, biotransformation ability, mitochondrial activity, as well as ammonia detoxification and albumin secretion. We further analyzed the expression of genes involved in glycolysis, gluconeogenesis, fatty acid (FA) and bile acid metabolism, and mitochondrial function and if it correlates with an improvement in the metabolic profile of cells.
Materials and methods
All culture media and supplements, solvents (all analytical grade) and other chemicals were acquired from Sigma-Aldrich (Madrid, Spain) unless specified.
Cell culture
The isolation of human neonatal mesenchymal stem cells (hnMSCs) was approved by the Ethics Committee of the Cascais Hospital Dr. José de Almeida. hnMSCs isolated from human umbilical cord stroma were fully characterized (15) and cultured as described by Santos et al. (16). For generating HLCs, a three-step differentiation protocol was applied to hnMSCs as detailed previously (4). From D21 onwards, HLCs seeded in collagen-coated culture plates were maintained in one of four media formulations comprehending different glucose, insulin, and dexamethasone concentrations supplemented with 1% of DMSO, 8 ng/mL of oncostatin M (OSM), 1% of penicillin-streptomycin (PS) and 0.01% of amphotericin B (Ampho): (i) Diff, as detailed previously (4), with Iscove’s modified Dulbecco’s medium (IMDM) containing 25 mM of glucose, 1.72 µM of insulin and 1 µM of dexamethasone; (ii) Diff -glu, with Dulbecco’s modified Eagle’s medium (DMEM), supplemented with L-glutamic acid, L-proline, HEPES and alanine to match IMDM concentrations, containing 5 mM of glucose, 1.72 µM of insulin and 1 µM of dexamethasone; (iii) Physiol +glu, with IMDM supplemented with 1 nM of insulin, 100 nM of dexamethasone and 0.2% of bovine serum albumin (BSA); and (iv) Physiol, with DMEM supplemented with 1 nM of insulin, 100 nM of dexamethasone and 0.2% BSA (Table 1).
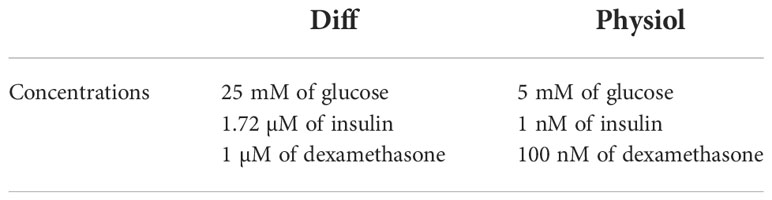
Table 1 Concentrations of glucose, insulin and dexamethasone present in Diff and Physiol media.
HepG2 cells (ATCC, MD, USA) and cryopreserved hpHeps (pool of 10 donors; Invitrogen, CA, USA) were cultured as described previously (4, 5).
Collagen coating
The protocol for rat-tail extraction was performed as described by Rajan et al. (17). The extracted rat-tail collagen was dissolved in 0.1% acetic acid to a stock concentration of 1 mg/mL. The stock solution was diluted in PBS to 0.2 mg/mL in a volume that assures total culture surface coverage. After 1h-incubation at 37 °C, cell culture surfaces were washed with PBS before inoculation. The differentiation process occurred using this collagen coating until D17 in T-flasks and onwards for cultures in well plates.
Urea and albumin production
Urea and albumin were quantified in cell culture supernatants using a colorimetric urea kit (QuantiChrom™ Urea Assay Kit, BioAssay Systems, Hayward, CA, USA) and an enzyme-linked immunosorbent assay (ELISA) kit (Bethyl Laboratories, Montgomery, TX, USA), respectively. The absorbance was measured at 520 nm for urea and 450 nm for albumin in a microplate reader (SPECTROStar Omega, BMG Labtech, Stuttgart, Germany), according to manufacturer’s instructions. Data is presented as the rate of production: µg/106 cells.h (for urea) and pg/106 cells.h (for albumin).
Biotransformation activity
EROD assay covers CYP1A1 and CYP1A2 activity (12, 18–25). The protocol herein used was adapted from Donato et al. (26) and consisted in a 90-minute cell incubation with 8 µM of 7-ethoxyresorufin followed by a 2-hour enzymatic digestion with β-glucuronidase/arylsulfatase. The concentration of the product (7-hydroxyresorufin) was measured at an excitation wavelength of 530 nm and an emission of 590 nm.
UGTs’ activity was determined by quantification of 4-methylumbelliferone (4-MU) before and after cell incubation to evaluate the extent of substrate conversion, as described by Miranda et al. (27, 28).
Protein quantification was performed as detailed in Cipriano et al. (4). EROD and UGT activities were normalized to incubation time (h) and cell number (106 cells).
Mitochondrial function
HLC mitochondrial function was assessed by direct measurement of the oxygen consumption rate (OCR) using extracellular flux analysis (XF24, Seahorse Biosciences, North Billerica, MA, USA). HLCs were inoculated in pre-coated Seahorse XF cell culture plates as described in section Cell culture’ methods section. The Mitochondrial Stress Test assay was performed in XF Base medium (Agilent Technologies, Santa Clara, CA, USA) with 1 mM of pyruvate, 2 mM of L-glutamine (ThermoFisher Scientific, Waltham, MA, USA) and 10 mM of glucose. Baseline OCR were measured every 7 minutes. Following baseline measurements, oligomycin (1.5 µM), Carbonyl cyanide-4-(trifluoromethoxy)phenylhydrazone (FCCP) (1.25 µM), and rotenone (2 µM) and antimycin A (2 µM) were sequentially injected to measure OCR. From the obtained OCR profile, basal respiration, ATP production, maximal respiration and spare respiratory capacity could be calculated. Protein extraction from the HLCs was performed with RIPA lysis buffer supplemented with protease inhibitors 1x (Roche, Basel, Switzerland). Protein concentration (µg/µL) was determined using the bicinchoninic acid (BCA) protein assay kit (Pierce) according to manufacturer instructions. Mitochondrial function was normalized to the protein concentration (µg/µL) of each well.
HLC viability assessment upon paracetamol exposure
Paracetamol cytotoxicity was evaluated using the MTS reduction assay (Promega, Madison, WI, USA). At D34, cells were exposed to concentrations of paracetamol of 0, 5, 10, 15, 20, 25, 50 and 75 mM. Cell viability was measured upon a 24-hour incubation, according to manufacturer’s instructions. IC50 was calculated with a nonlinear regression fit for the Log10 transformation of the concentration values using GraphPad Prism (GraphPad Software, La Jolla, CA, USA). The percentage of viable cells was calculated relative to non-treated HLCs.
Periodic acid Schiff’s staining
PAS staining was performed as described previously (4, 5). The wells were rinsed with distilled water and were observed under light microscope (Olympus CK30 inverted microscope, Tokyo, Japan).
Insulin stimuli
The hormone stimuli assays were performed at D34, exposing cells to 80 nM of insulin for 8 hours for gene expression analysis and for 30 minutes for AKT phosphorylation analysis. Before the insulin stimuli, cells culture medium was changed to starvation medium (DMEM, 1% of PS, 4 mM of glutamine, 1% of DMSO, 8 ng/mL of OSM and 0.2% of BSA), for an incubation period of 2 hours, to enhance the response to insulin incubation, as described in Correia et al. (29).
Gene expression
Total RNA of 6.0×10⁵ cells was isolated using TRIzol (Life Technologies, Carlsbad, CA, USA) and extracted according to the manufacturer’s instructions. RNA concentration was determined by measuring the absorbance at 260 nm using LVis plate mode (SPECTROstar Omega, BMG Labtech). cDNA was synthesized from 1 μg of RNA using NZY First-Strand cDNA Synthesis Kit (NZYTech, Lisbon, Portugal), according to the manufacturer’s instructions. Quantitative real-time polymerase chain reaction (RT-qPCR) was performed using PowerUp SYBR Green Master Mix (Life Technologies) for a final reaction volume of 15 μL, using 2 μL of template cDNA and 0.333 μM of forward and reverse primers. Primer sequences are provided in Table 2. Reaction was performed on QuantStudio™ 7 Flex Real-Time PCR System (Applied Biosystems, Foster City, CA, USA) according to the described by Cipriano et al. (4, 5). The comparative Ct method (2-ΔΔCt) was used to quantify gene expression, which was normalized to a reference gene (β-actin).
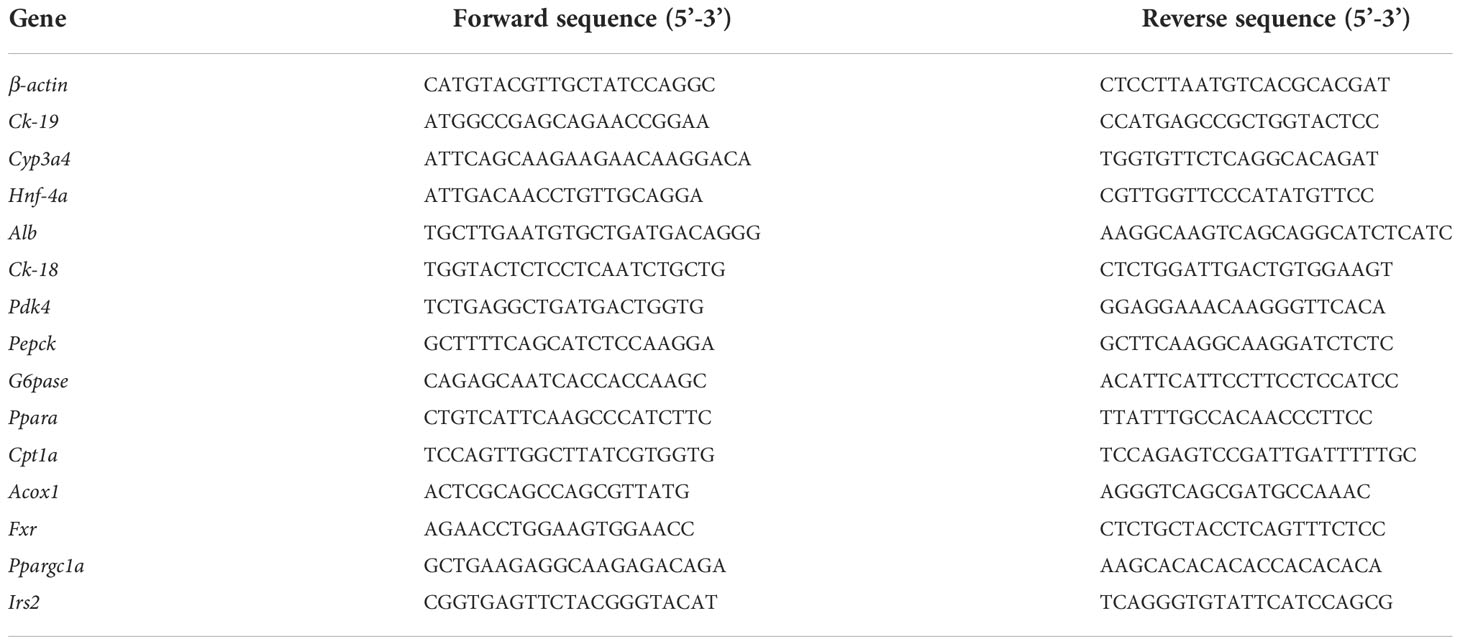
Table 2 Primers used for RT-qPCR characterization of HLCs, undifferentiated hnMSCs and hpHeps.
Western blot analysis
Western blot analysis was performed on HLC lysates. 30 μg of protein, quantified by Bradford protein assay kit according to manufacturer instructions, were separated by 12% SDS-PAGE and were transferred to PVDF membrane. Rabbit monoclonal antibody against human AKT (1:1000; Cell Signaling Technology, Danvers, MA, USA) and rabbit monoclonal antibody against human p-AKT (1:1000; Cell Signaling Technology) were used as primary antibodies. All blots were probed overnight at 4°C. Anti-rabbit horseradish peroxidase-conjugated antibody was used as secondary (1:20 000; Jackson ImmunoResearch, Ely, Cambridgeshire, UK). Immunoreacted proteins were detected by using Immobilon Western Blotting Kit (Merck Millipore, Burlington, MA, USA).
Statistical analysis
The results are presented as Average ± SEM unless stated otherwise. Data was analyzed with two-way ANOVA with GraphPad Prism. A threshold of p < 0.05 was considered statistically significant.
Results
Reducing glucose, insulin and dexamethasone concentrations enhances the hepatic phenotype and biotransformation competence of HLCs
Ideally, in vitro hepatic models should retain most, if not all, of the characteristic biochemical machinery and molecular pathways that allow for a normal phenotype. We evaluated the effect of glucose, insulin and dexamethasone levels on HLC maturation by analyzing hepatic morphological features, albumin and urea production, as well as the presence of hepatic-specific markers and the biotransformation ability of HLCs at day 27 (D27) and day 34 (D34), corresponding to 1 and 2 weeks in culture post differentiation, respectively. As such, a comparative analysis of glucose, insulin and dexamethasone at physiological levels, corresponding to the plasmatic levels observed in vivo (Physiol), and the levels routinely used in hepatic in vitro cultures (Diff) (4) was performed to better understand their effect on hepatocyte biology and phenotype (Table 1). HepG2 and hpHeps and undifferentiated cells (hnMSCs) were used as positive and negative controls, respectively.
Under Physiol conditions, cells displayed a typical polygonal hepatocyte-like shape with one or more nuclei with prominent nucleoli in both days (Figure 1A). The expression levels of the hepatic-specific genes Alb, Cyp3a4 and Hnf4a in HLCs were higher in Diff (p < 0.001, p < 0.001 and p < 0.01, respectively) and in Physiol (p < 0.01, p < 0.001 and p > 0.05, respectively) at D34 relative to hnMSCs (Figure 1B). Ck-18 expression, on the other hand, was similar to that of hnMSCs, whereas the cholangiocyte marker Ck-19 was not detected in both media. These observations were further supported by identical albumin production in both conditions (Figure 2A) and higher levels of urea synthesis at D27 in HLCs maintained in Physiol when compared to Diff (p < 0.05) (Figure 2B). Curiously, overall, intermediate concentrations of glucose, dexamethasone and insulin (Diff -glu and Physiol +glu) did not result in an improvement of the HLC phenotype when compared to Physiol (Supplementary Figures 1, 2).
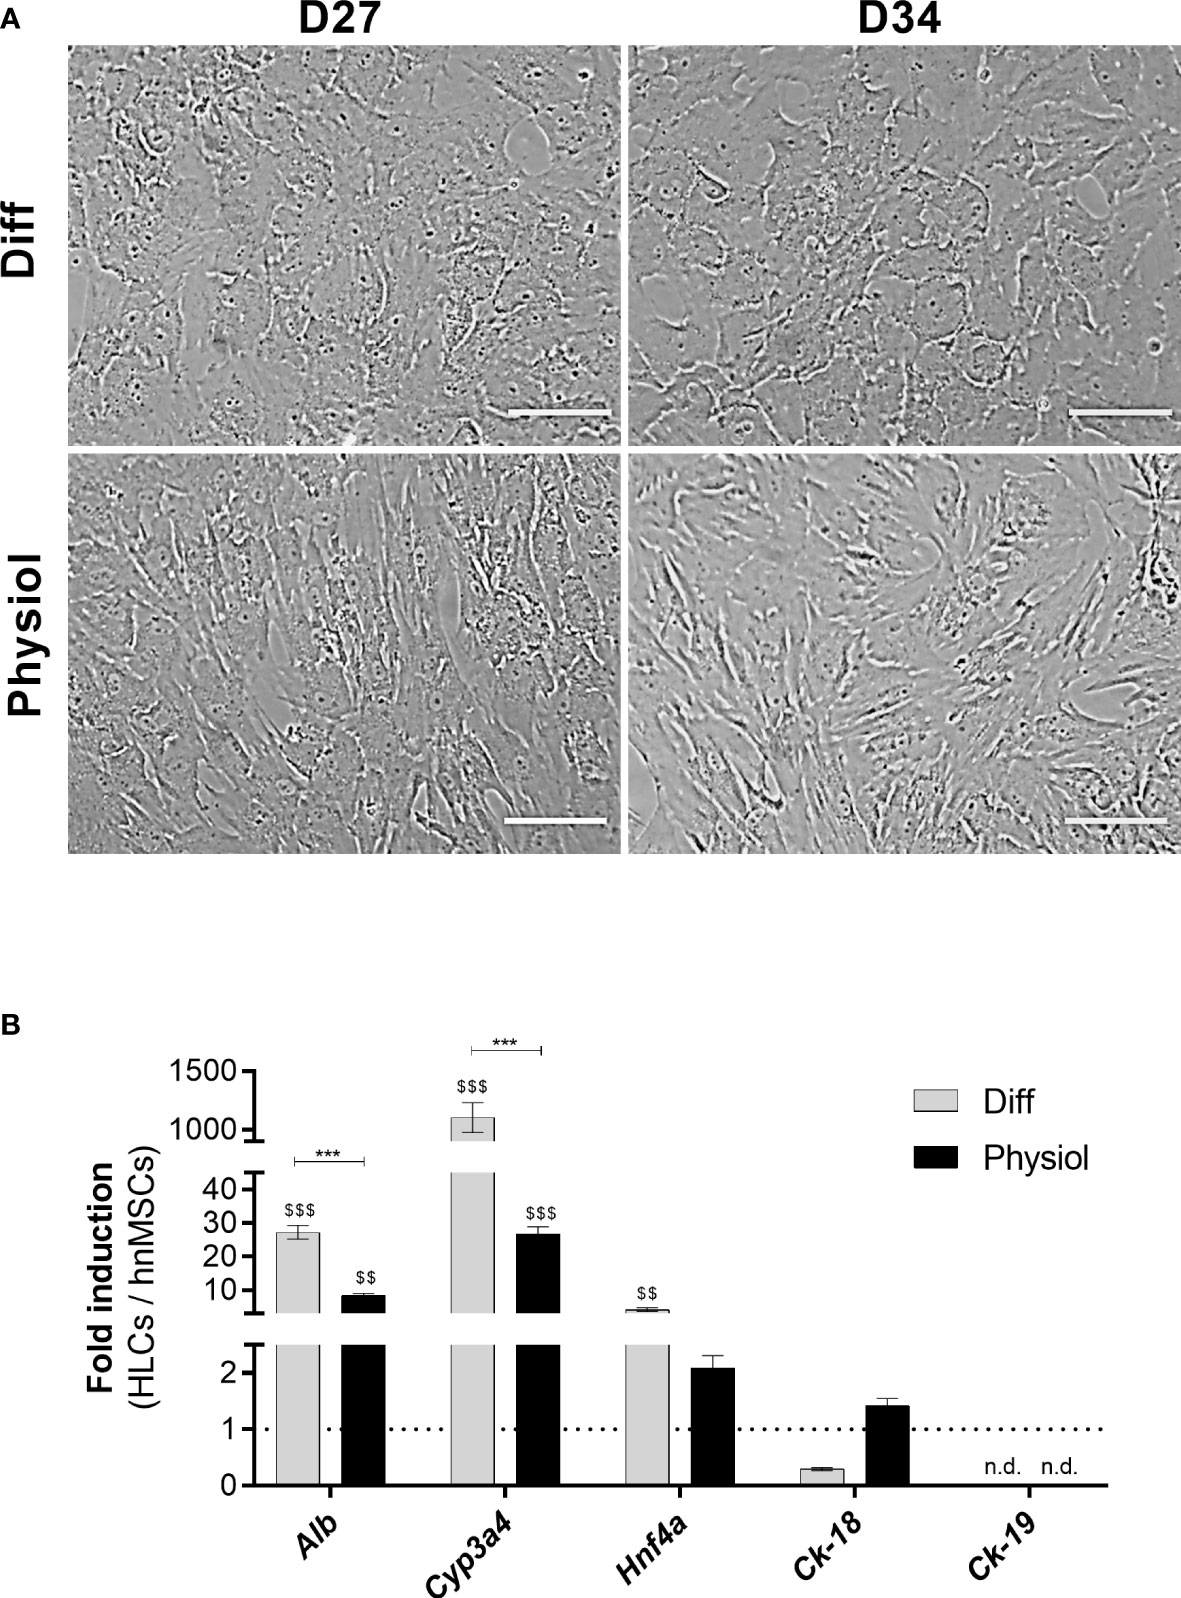
Figure 1 Physiol maintained the typical polygonal hepatocyte-like morphology and the induction of Alb, Cyp3a4 and Hnf4a in HLCs. (A) Morphology in HLCs maintained in Diff and Physiol, at D27 and D34. Scale bar = 100 µm. (B) Hepatic-specific gene expression in HLCs at D34. Data are expressed as fold induction relative to hnMSCs and represented as Average ± SEM (n = 3-6). *** significantly differs from the other conditions with p < 0.001. $$ and $$$ significantly induced with p < 0.01 and p < 0.001, respectively (two-way ANOVA). D27, D34, day 27, day 34 of the differentiation protocol; HLCs, hepatocyte-like cells; hnMSCs, undifferentiated human neonatal mesenchymal stem cells; Alb, albumin; Cyp3a4, cytochrome P450, 3A4; Hnf4a, hepatocyte nuclear factor-4α; Ck-18, cytokeratin-18; Ck-19, cytokeratin-19; n.d., non-determined.

Figure 2 Albumin production was similar in both conditions while urea synthesis was improved with Physiol. Effect of Diff and Physiol and culture time on (A) albumin and (B) urea production. Data are represented as Average ± SEM (n = 3). Undifferentiated hnMSCs and HepG2 cell line and cryopreserved hpHeps are negative and positive controls, respectively (white bars). *, **, *** significantly differs from the other conditions with p < 0.05, p < 0.01 and p < 0.001, respectively (two-way ANOVA). hnMSC, undifferentiated human neonatal mesenchymal stem cells; hpHep, human primary hepatocytes; D27, D34, day 27, day 34 of the differentiation protocol.
The hepatic phenotype was further assessed by measuring phase I and II enzyme activity. EROD activity, covering CYP1A1 and CYP1A2 activity (12, 18–25), at D34, was higher in HLCs maintained in Physiol than cells in Diff (p < 0.01) and HepG2 (p < 0.001) (Figure 3A). Concerning phase II of biotransformation, UGT activity in HLCs kept in Physiol at D34 was superior to all other conditions, including hpHeps (p < 0.001) (Figure 3B). These results indicate that HLCs maintained in Physiol were metabolic competent, which was further confirmed by the cells’ ability to metabolize the model drug, paracetamol (Figure 4). Cell viability was evaluated by MTS reduction assay and the IC50 for HLCs kept in Physiol and in Diff were 21.04 mM and 30.00 mM, respectively, suggesting that HLCs kept in Physiol were more sensitive to paracetamol exposure than in Diff.

Figure 3 EROD and UGTs’ activities were improved with Physiol. Effect of culture time and medium composition on (A) EROD (phase I) and (B) UGTs’ (phase II) activities. Data are represented as Average ± SEM (n = 3-4). Undifferentiated hnMSCs and HepG2 cell line and cryopreserved hpHep are negative and positive controls, respectively (white bars). **, *** significantly differs from the other conditions with p < 0.01 and p < 0.001, respectively (two-way ANOVA). EROD, 7-ethoxyresorufin-O-deethylase; UGTs, uridine 5’-diphosphate glucuronosyltransferases; hnMSC, undifferentiated human neonatal mesenchymal stem cells; hpHep, human primary hepatocytes; D27, D34, day 27, day 34 of the differentiation protocol.

Figure 4 HLCs in Physiol presented higher sensitivity to paracetamol-induced cytotoxicity. Comparison of paracetamol cytotoxicity in HLCs maintained in Diff and Physiol at D34 evaluated by MTS mitochondrial activity assay. HLCs were incubated with 0, 5, 10, 15, 20, 50 and 75 mM of paracetamol. The percentage of viable cells is calculated relative to non-treated HLCs (mean ± SEM) (n = 3).
HLCs cultured in a more physiological medium display increased ATP production and maximal mitochondrial functional capacity
To evaluate mitochondrial function in the different cells we used an extracellular flux analyzer (Seahorse XFp). Real time oxygen consumption rates (OCR) in hnMSCs and HLCs were measured using Seahorse XFp Cell Mito Stress Test (Figure 5A). Basal respiration (Figure 5B) shows the cellular energetic demands under baseline conditions. At D27, HLCs in both media displayed higher basal respiration, being significantly higher than in cells at the hepatoblast phase (D17) (p < 0.01) or undifferentiated (p < 0.05); whereas at D34 there was a decrease in basal respiration in both conditions (Diff, p < 0.01). ATP production (Figure 5C) refers to the reduction in OCR upon inhibition of ATP synthase activity. HLCs in Physiol at D27 had a significantly higher ATP production than cells at D17 and hnMSCs (p < 0.001 and p < 0.05, respectively). Maximal respiration (Figure 5D), on the other hand, demonstrates the maximum rate of respiration that the cell can achieve by stimulating the respiratory chain to operate at maximum capacity and it was significantly higher in HLCs in Physiol at D27 when compared to hnMSCs (p < 0.01) and cells at D17 (p < 0.05). Finally, spare respiration (Figure 5E) indicates cell fitness or flexibility to respond to an energetic demand as well as how closely the cell is to respire at its maximum capacity. Herein, HLCs in both Physiol and Diff at D27 displayed enhanced cell fitness when compared to undifferentiated cells (p < 0.05). Importantly, neither of the intermediate conditions tested presented improved mitochondrial activity when compared to Physiol (Supplementary Figure 4). These data support the higher differentiation degree of HLCs in Physiol throughout time, which is known to be associated with higher rates of mitochondria respiration when compared to undifferentiated cells.
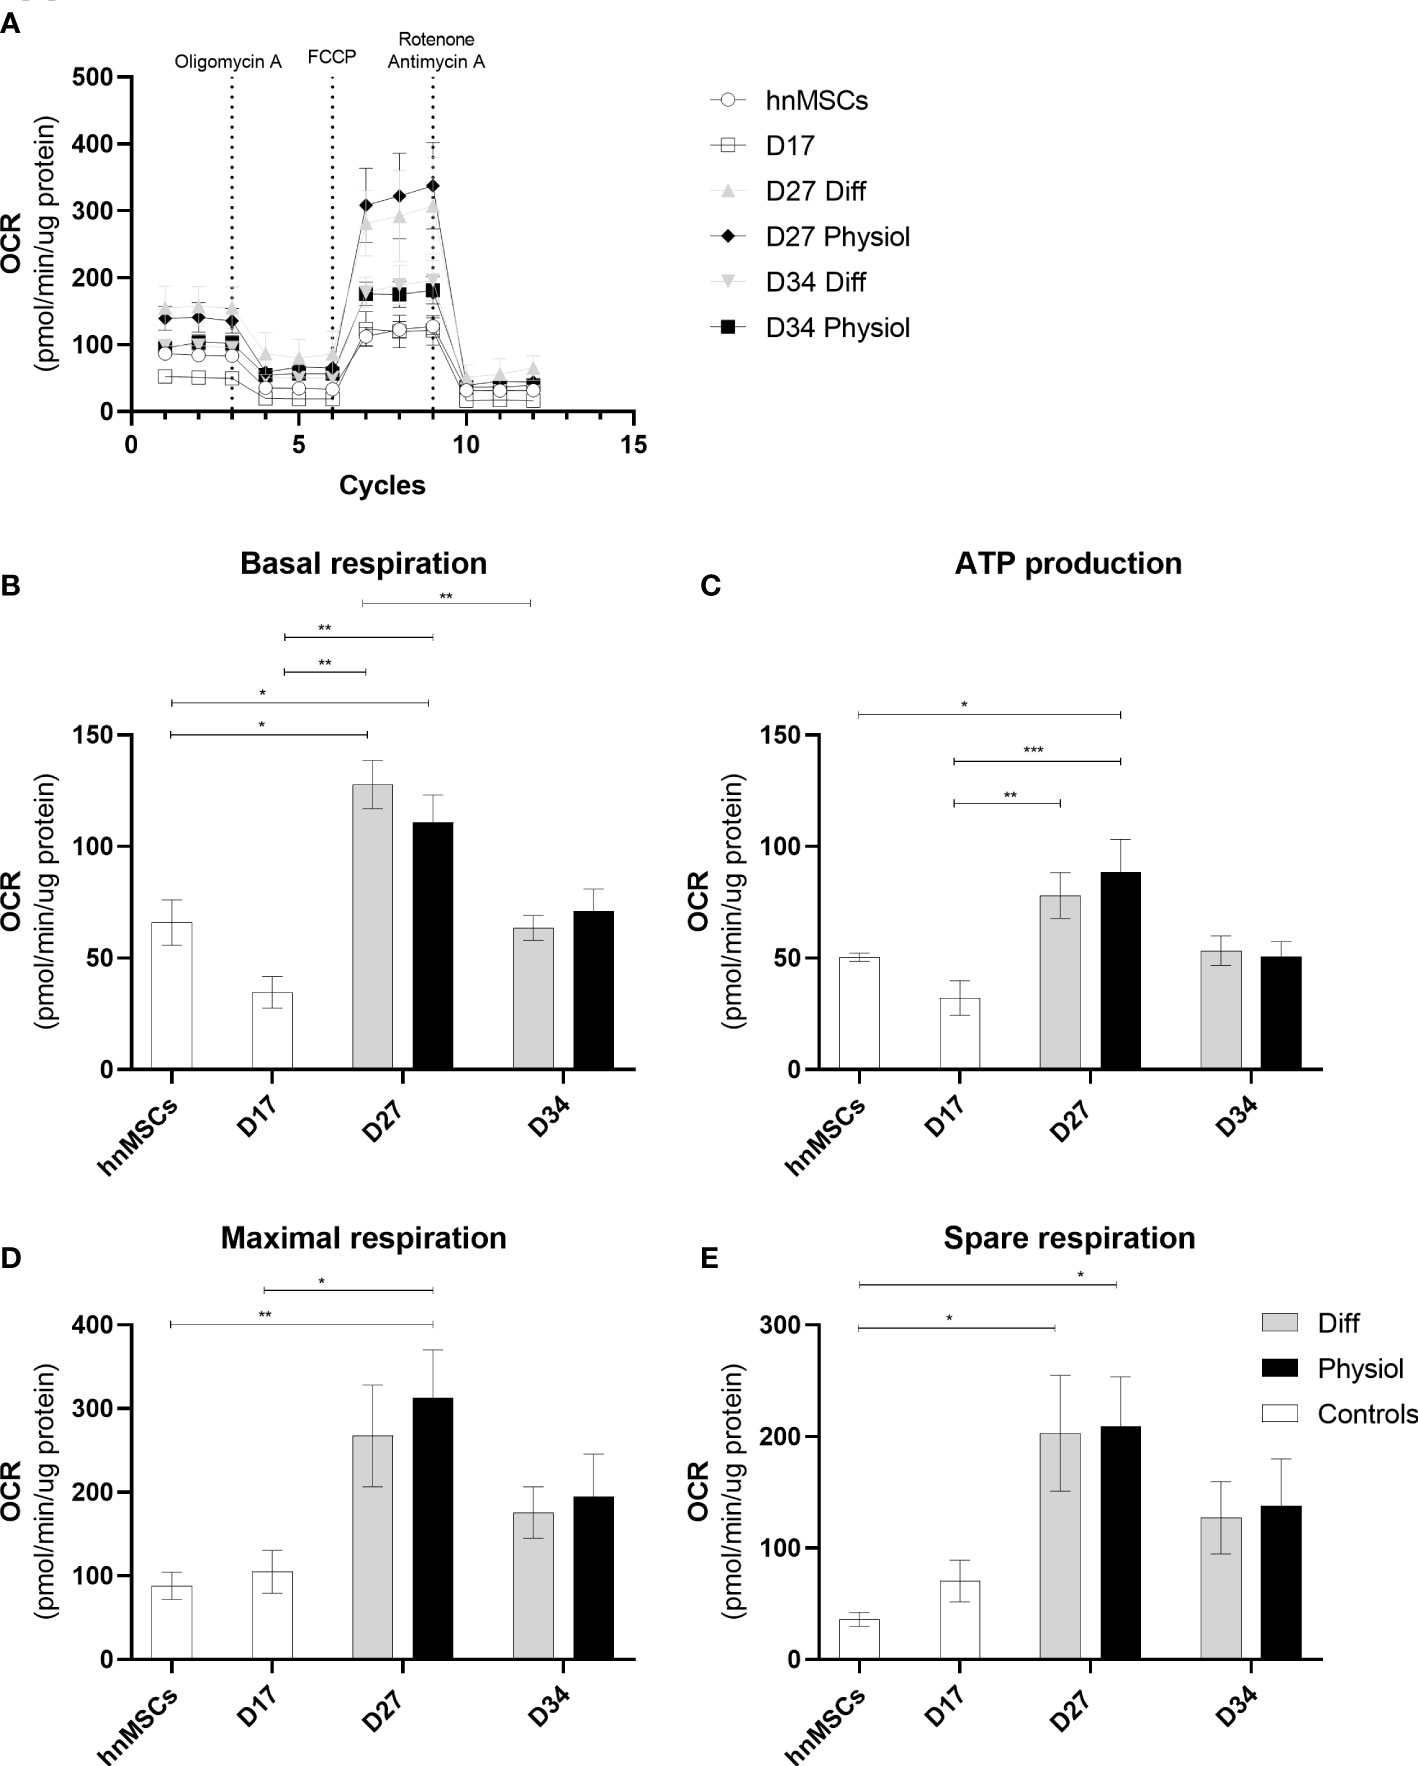
Figure 5 Physiol maintained HLC mitochondrial function. Evaluation of mitochondrial function by directly measuring the OCR of cells at different stages of differentiation and exposed to different media. (A) OCR in the presence of 1.5 μM of oligomycin, 1.25 μM of FCCP, 2 μM of antimycin and 2 μM of rotenone. (B) Basal respiration. (C) ATP production. (D) Maximal respiration. (E) Spare respiration. Data are represented as Average ± SEM (n = 3-5). *, **, *** significantly differs from the other conditions with p < 0.05, p < 0.01 and p < 0.001, respectively (two-way ANOVA). hnMSC, undifferentiated human neonatal mesenchymal stem cells; OCR, oxygen consumption rate; D17, D27, D34, day 17, day 27, day 34 of the differentiation protocol.
HLCs under more physiological conditions display insulin-responsive glucose metabolism
To evaluate HLC insulin signaling we measured glycogen storage ability (Figure 6A), AKT phosphorylation (Figure 6B) and insulin receptor substrate 2 (Irs2) expression (Figure 6C). Moreover, the effects of insulin stimuli on the expression of genes involved in glycolysis (Pdk4), gluconeogenesis (Pepck and G6pase), FA oxidation (Ppara, Cpt1a and Acox1), bile acid metabolism (Fxr) and mitochondrial function (Ppargc1a) was also evaluated (Figure 6D).

Figure 6 Physiol maintained glycogen storage ability and improved HLC responsiveness to insulin stimuli. (A) Glycogen storage ability evaluated by PAS staining at D27 and D34. Scale bar = 100 µm. (B) AKT phosphorylation confirmed in HLCs kept in Physiol in response to insulin by Western Blot analysis. (C) Effect of insulin in Irs2 expression in HLCs subjected to fasting, evaluated by RT-qPCR. (D) Effect of insulin in HLC gene expression. Genes involved in glycolysis (Pdk4), gluconeogenesis (Pepck and G6pase), fatty acid oxidation (Ppara, Cpt1a and Acox1), bile acid metabolism (Fxr) and mitochondrial function (Ppargc1a) were evaluated by RT-qPCR. RT- qPCR data are expressed as fold induction relative to non-treated cells (n = 3-6). *, **, *** significantly differs from the other conditions with p < 0.05, p < 0.01 and p < 0.001, respectively. $, $$ and $$$ significantly induced or repressed with p < 0.05, p < 0.01 and p < 0.001, respectively (two-way ANOVA). hpHep, human cryopreserved hepatocytes; Pdk4, pyruvate dehydrogenase kinase 4; Pepck phosphoenolpyruvate carboxylase; G6pase, glucose-6-phosphatase; Ppara, peroxisome proliferator-activated receptor α; Cpt1a, carnitine palmitoyltransferase 1α; Acox1, acyl-CoA oxidase 1; Fxr, Farnesoid X receptor; Ppargc1a, peroxisome proliferator-activated receptor γ coactivator 1-α; Irs2, insulin receptor substrate 2.
All conditions displayed glycogen storage capacity (Figure 6A and Supplementary Figure 5). Most importantly, we could only observe insulin-stimulated AKT phosphorylation in HLCs kept in Physiol (Figure 6B). Moreover, upon insulin exposure, Irs2 expression was downregulated in HLCs in Physiol (Figure 6C, p < 0.001). Likewise, HLCs in Physiol exposed to insulin presented a downregulation of Pdk4, G6pase, Ppara, Cpt1a, Acox1, Fxr and Ppargc1a, indicating an induction of glycolysis and bile acid metabolism (Pdk4 and Fxr are negative regulators of these pathways, respectively) and inhibition of gluconeogenesis and FA oxidation (Figure 6D). Ppargc1a enhances the expression of genes related to mitochondrial function and induces gluconeogenesis and, herein, its downregulation also reinforces gluconeogenesis inhibition. On the other hand, upon insulin incubation, HLCs in Diff maintained the expression of Pdk4 and G6pase and increased the expression of Cpt1a, Acox1 and Ppargc1a which is associated to FA oxidation and mitochondrial function induction. Overall, our data suggest that HLCs in Physiol were more sensitive to insulin stimulation than hpHep.
Discussion
Stem-cell based hepatic in vitro models have demonstrated potential for studying and modeling metabolic-related diseases (30, 31). However, most hepatic differentiation protocols maintain differentiated HLCs in micromolar concentrations of insulin and dexamethasone and millimolar concentrations of glucose that reduce insulin sensitivity. Thus, this work focused on the modulation of insulin signaling and the metabolism of glucose and the synthetic glucocorticoid dexamethasone towards the development of a human-based hepatic in vitro model suitable for studying insulin signaling pathway.
As such, prior to the evaluation of the insulin-regulated metabolism, the MSC-derived HLC basal hepatic phenotype and functionality in more physiological concentrations of insulin, glucose and dexamethasone was compared to Diff (4), and the typical hepatic polygonal shape morphology, overexpression of hepatic-specific genes, albumin production and mitochondrial function confirmed.
As for hepatic specific genes, the expression of the hepatic marker, Ck-18, was detected in HLCs and in hnMSCs, possibly due to the presence of early endodermal markers in umbilical cord matrix-derived MSCs populations (32); whereas the cholangiocyte marker Ck-19 was not expressed in HLCs in Physiol confirming the hepatocyte lineage commitment. Additionally, overexpression of Alb or Hnf4a in HLCs showed that the concentrations of glucose, insulin and dexamethasone herein used maintained the HLC differentiated status without interfering with HLC viability and adherence, as previously demonstrated for human primary hepatocytes (8). Likewise, albumin production was similar in HLCs in both conditions, while Physiol could improve ammonia detoxification as demonstrated by urea production. It was previously reported that lower glucose concentrations result in higher urea production in HepG2-C3A (33) and in this work, we could also observe that media with lower glucose concentrations (Physiol and Diff -glu) demonstrated the same trend (Supplementary Figure 2B). Moreover, glucagon was shown to increase urea production in hpHeps (34). Since glucagon and insulin are antagonistic hormones, media with lower insulin concentrations may have a positive impact in HLC ammonia detoxification.
As for the biotransformation ability, Cyp3a4 expression level of HLCs was increased in all Diff conditions when compared to Physiol (Physiol and Physiol +glu), which may be a consequence of the higher concentrations of dexamethasone in Diff media, a known CYP3A4 inducer (Supplementary Figure 1B) (35). In addition, phase I and phase II activities were evaluated through EROD (CYP1A1/2) and UGT assays, respectively. In Physiol, both activities were enhanced, further supporting the improvement of HLC hepatic features under these conditions. This is in accordance with previous observations showing that dexamethasone decreases CYP1A1 and CYP1A2 activity in hpHeps (12). Herein, glucose may also have negatively regulated EROD activity, given that at D34, EROD activity in HLCs kept in low glucose levels (Physiol and Diff -glu) was higher than HLCs in Physiol +glu and Diff (media with 25 mM of glucose), as seen in Figure 3A and Supplementary Figure 3A. Indeed, Davidson et al. reported that hypoglycemic conditions (~0.4 – 0.5 mM of glucose) significantly increased the expression of Cyp1a2, as compared to a normoglycemic control (~5 mM) (14). Interestingly, in our protocol, cells maintained in lower glucose concentrations also showed higher CYP1A1/2 activities.
To further validate the usefulness of our model for hepatotoxicity studies, HLCs were exposed to paracetamol, a drug known to cause hepatotoxicity in overdose (36–38) and whose toxicity is dependent on phase I and II metabolism. At high-dose paracetamol exposure, the metabolic pathway switches from the detoxifying phase II metabolism to phase I metabolism, generating the toxic intermediate N-acetyl-p-benzoquinone imine (NAPQI). Paracetamol is mainly metabolized through conjugation with sulphate and glucuronic acid and, to a lesser extent, through oxidation by CY2E1, CYP1A2 and CYP3A4 (36). Accordingly, cell viability upon paracetamol exposure was assessed as an indirect measure of HLC metabolic competence. Indeed, the higher paracetamol cytotoxicity observed in Physiol is an indicator of higher biotransformation ability. Our results demonstrate that decreased concentrations of insulin, glucose and dexamethasone improved the sensitivity of HLCs to paracetamol toxicity, suggesting a higher phase I activity, in accordance with EROD activity results, and consequently higher formation of the toxic metabolite NAPQI. Moreover, changes in the metabolic cell status can result in different drug efficacy and safety. Therefore, the observed differences between Diff and Physiol in drug metabolism suggest that our HLC model could be able to recapitulate differences in CYP450 activities observed in numerous metabolic pathologies, namely NAFLD (39, 40).
Insulin regulates glucose and lipid metabolism in hepatocytes and mitochondria are the central hub for controlling metabolic homeostasis and energy production. Disturbances in mitochondrial function mediate hepatocyte injury, affect cell viability, and are associated with NAFLD, drug-induced hepatotoxicity, and cholestasis (37, 41). Herein, Physiol maintained HLC mitochondrial functionality under basal conditions, as well as the mitochondrial contribution for ATP production, flexibility to respond to energetic demands and the maximum operation capacity when compared to Diff. These results can also confirm that Physiol could maintain the hepatic differentiation degree as it was reported that glycolysis is the main provider of ATP in stem cells while mitochondrial oxidative phosphorylation is the most predominant source of ATP in differentiated cells (42).
Finally, carbohydrate metabolism and insulin signaling were specifically assessed in HLCs as the liver regulates blood glucose levels through glycogen synthesis and gluconeogenesis. Upon insulin binding to the insulin receptor, there is a cascade of phosphorylation of downstream enzymes: insulin receptor substrate proteins, PI3K and AKT. AKT phosphorylation is an important event in the insulin transduction pathway as it will then mediate the effects of insulin on glucose, glycogen, protein and lipid metabolism (43). Herein, HLCs were indeed able to form glycogen stores in both conditions. Moreover, in response to insulin exposure, only HLCs in Physiol exhibited AKT phosphorylation. The absence of AKT phosphorylation in HLCs in Diff, a signal of insulin resistance development, may be related to the chronic exposure to high insulin concentrations (1.72 μM), as previously reported (44, 45). IRS2 plays a major role in hepatic energy homeostasis in fasting conditions, mediating insulin effects through the AKT cascade. Irs2 expression increases in the fasting state and immediately decreases after food intake which is accompanied by an increase in insulin blood levels (46). Accordingly, after subjecting HLCs to fasting and subsequent exposure to insulin, only HLCs in Physiol presented a downregulation of Irs2 as previously described (46–48). In particular, under non-pathological conditions, insulin will induce glycolysis and lipid synthesis while inhibiting gluconeogenesis and FA oxidation (49). Accordingly, a RT-qPCR analysis showed that HLCs, maintained under lower concentrations of insulin, dexamethasone and glucose throughout the maturation phase (Physiol), were more sensitive to insulin stimuli, upregulating glycolysis and bile acid metabolism and downregulating gluconeogenesis, FA oxidation and mitochondrial function-related pathways as observed in vivo. On the other hand, HLCs maintained in higher and non-physiological concentrations of insulin, dexamethasone and glucose (Diff) were not responsive to insulin insult, keeping the expression of genes involved in glycolysis and gluconeogenesis while FA oxidation is induced. Therefore, lower concentrations of those supplements are best suited for maintaining cells for energy metabolism regulation studies by maintaining insulin responsiveness.
Importantly, the activation of glycolysis and bile acid synthesis along with the inhibition of gluconeogenesis and FA oxidation accompanied by increased biotransformation activity are zonation features characteristic of perivenous hepatocytes (50). Therefore, overall, these results may suggest the modulation of HLCs towards a perivenous-like phenotype, important when studying metabolic diseases. NAFLD, in particular, has a perivenous predominance due to reduced FA oxidation gene expression that will lead to faster lipid accumulation in this region (51). In particular, we observe that our HLC model displays glycogen storage capacity and modulates gluconeogenic gene expression, which was a limitation found by Nagarajan and colleagues in different hepatocyte lines (1).
Moreover, in contrast, to other works that use FBS, insulin at micromolar concentrations, glucose concentrations above 10 mM and dexamethasone concentrations superior to 100 nM, which may affect insulin action (30, 31, 52–54), the model herein developed represents a more physiological system that can be used in the future to induce NAFLD and study disease mechanisms. Indeed, to our knowledge, it is shown for the first time the AKT phosphorylation, downregulation of Irs2 and of genes related to glucose and lipid metabolism upon insulin exposure in a HLCs in vitro model.
In sum, our data reveal that more physiological levels of insulin, glucose and dexamethasone regulate insulin signaling and energy metabolism in HLCs as it improves insulin sensitivity along with ammonia detoxification, biotransformation activity and mitochondrial function while retaining albumin production and overexpression of hepatic-specific genes. Therefore, manipulating glucose homeostasis and glucocorticoid concentration can be a strategy for developing relevant hepatic in vitro models for drug metabolism studies, hepatotoxicity assessment and disease modeling of energy metabolism-related disorders.
Data availability statement
The original contributions presented in the study are included in the article/Supplementary Material. Further inquiries can be directed to the corresponding author.
Author contributions
JM, JRu and VM developed the study concept and the study design. JRo, AF-P, SC and AS performed the experiments and data collection. JRo and AF-P performed the data analysis and interpretation under the supervision of JM and VM. JM and JRo drafted the manuscript. JRu and VM provided critical revisions. All authors contributed to the article and approved the submitted version.
Funding
The work was financially supported by Fundação para a Ciência e a Tecnologia (FCT) through SFRH/BD/144130/2019 to JRo; PD/BD/114113/2015 and IMM/BI/76-2019 to AF-P; IF/01693/2014 and IMM/CT/27-2020 to VM; PTDC/MED-TOX/29183/2017; UIDB/04138/2020; UIDP/04138/2020 and PTDC/BIACEL/31230/2017. This project has received funding from the European Horizon´s research and innovation programme HORIZON-HLTH-2022-STAYHLTH-02 under agreement No 101095679; from the European Molecular Biology Organization (EMBO-IG#3309); and was also supported by COST actions CA17112, CA20121 and CA20140.
Conflict of interest
The authors declare that the research was conducted in the absence of any commercial or financial relationships that could be construed as a potential conflict of interest.
Publisher’s note
All claims expressed in this article are solely those of the authors and do not necessarily represent those of their affiliated organizations, or those of the publisher, the editors and the reviewers. Any product that may be evaluated in this article, or claim that may be made by its manufacturer, is not guaranteed or endorsed by the publisher.
Supplementary material
The Supplementary Material for this article can be found online at: https://www.frontiersin.org/articles/10.3389/fendo.2022.1043543/full#supplementary-material
References
1. Nagarajan SR, Paul-Heng M, Krycer JR, Fazakerley DJ, Sharland AF, Hoy XAJ. Lipid and glucose metabolism in hepatocyte cell lines and primary mouse hepatocytes: A comprehensive resource for in vitro studies of hepatic metabolism. Am J Physiol - Endocrinol Metab (2019) 316(4):E578–89. doi: 10.1152/ajpendo.00365.2018
2. Afshari A, Shamdani S, Uzan G, Naserian S, Azarpira N. Different approaches for transformation of mesenchymal stem cells into hepatocyte-like cells. Stem Cell Res Ther (2020) 11(1):1–14. doi: 10.1186/s13287-020-1555-8
3. Chen C, Soto-Gutierrez A, Baptista PM, Spee B. Biotechnology challenges to In vitro maturation of hepatic stem cells. Gastroenterology (2018) 154(5):1258–72. doi: 10.1053/j.gastro.2018.01.066
4. Cipriano M, Correia JC, Camões SP, Oliveira NG, Cruz P, Cruz H, et al. The role of epigenetic modifiers in extended cultures of functional hepatocyte-like cells derived from human neonatal mesenchymal stem cells. Arch Toxicol (2017) 91(6):2469–89. doi: 10.1007/s00204-016-1901-x
5. Cipriano M, Freyer N, Knöspel F, Oliveira NG, Barcia R, Cruz PE, et al. Self-assembled 3D spheroids and hollow-fibre bioreactors improve MSC-derived hepatocyte-like cell maturation In vitro. Arch Toxicol (2017) 91(4):1815–32. doi: 10.1007/s00204-016-1838-0
6. Cipriano M, Pinheiro PF, Sequeira CO, Rodrigues JS, Oliveira NG, Antunes AMM, et al. Nevirapine biotransformation insights: An integrated in vitro approach unveils the biocompetence and glutathiolomic profile of a human hepatocyte-like cell 3D model. Int J Mol Sci (2020) 21(11):1–18. doi: 10.3390/ijms21113998
7. Fraczek J, Bolleyn J, Vanhaecke T, Rogiers V, Vinken M. Primary hepatocyte cultures for pharmaco-toxicological studies: At the busy crossroad of various anti-dedifferentiation strategies. Arch Toxicol (2013) Vol. 87:577–610 p. doi: 10.1007/s00204-012-0983-3
8. Damm G, Schicht G, Zimmermann A, Rennert C, Fischer N, Kießig M, et al. Effect of glucose and insulin supplementation on the isolation of primary human hepatocytes. EXCLI J (2019) 18:1071–91. doi: 10.17179/excli2019-1782
9. Takayama K, Inamura M, Kawabata K, Katayama K, Higuchi M, Tashiro K, et al. Efficient generation of functional hepatocytes from human embryonic stem cells and induced pluripotent stem cells by HNF4α transduction. Mol Ther (2012) 20(1):127–37. doi: 10.1038/mt.2011.234
10. Campard D, Lysy PA, Najimi M, Sokal EM. Native umbilical cord matrix stem cells express hepatic markers and differentiate into hepatocyte-like cells. Gastroenterology (2008) 134(3):833–48. doi: 10.1053/j.gastro.2007.12.024
11. Snykers S, Vanhaecke T, Papeleu P, Luttun A, Jiang Y, Vander Heyden Y, et al. Sequential exposure to cytokines reflecting embryogenesis: The key for in vitro differentiation of adult bone marrow stem cells into functional hepatocyte-like cells. Toxicol Sci (2006) 94(2):330–41. doi: 10.1093/toxsci/kfl058
12. Vrzal R, Stejskalova L, Monostory K, Maurel P, Bachleda P, Pavek P, et al. Dexamethasone controls aryl hydrocarbon receptor (AhR)-mediated CYP1A1 and CYP1A2 expression and activity in primary cultures of human hepatocytes. Chem Biol Interact (2009) 179(2–3):288–96. doi: 10.1016/j.cbi.2008.10.035
13. Ferris HA, Kahn CR, Barnes P, Cristancho A, Lazar M, Biddinger S, et al. New mechanisms of glucocorticoid-induced insulin resistance: make no bones about it. J Clin Invest. (2012) 122(11):3854–7. doi: 10.1172/JCI66180
14. Davidson MD, Ballinger KR, Khetani SR. Long-term exposure to abnormal glucose levels alters drug metabolism pathways and insulin sensitivity in primary human hepatocytes. Sci Rep (2016) 6:1–11. doi: 10.1038/srep28178
15. Martins JP, Santos JM, De AJM, MA F, De Almeida MVT, Almeida SCP, et al. Towards an advanced therapy medicinal product based on mesenchymal stromal cells isolated from the umbilical cord tissue: Quality and safety data. Stem Cell Res Ther (2014) 5(1):1–15. doi: 10.1186/scrt398
16. Santos JM, Camões SP, Filipe E, Cipriano M, Barcia RN, Filipe M, et al. Three-dimensional spheroid cell culture of umbilical cord tissue-derived mesenchymal stromal cells leads to enhanced paracrine induction of wound healing. Stem Cell Res Ther (2015) 6(1):90. doi: 10.1186/s13287-015-0082-5
17. Rajan N, Habermehl J, Coté MF, Doillon CJ, Mantovani D. Preparation of ready-to-use, storable and reconstituted type I collagen from rat tail tendon for tissue engineering applications. Nat Protoc (2007) 1(6):2753–8. doi: 10.1038/nprot.2006.430
18. Wilkening S, Stahl F, Bader A. Comparison of primary human hepatocytes and hepatoma cell line HepG2 with regard to their biotransformation properties. Drug Metab Dispos (2003) 31(8):1035–42. doi: 10.1124/dmd.31.8.1035
19. Chiarolini A, Donato MT, Gómez-Lechón MJ, Pala M, Valerio F, Ferro M. Comparison of rat hepatocyte and differentiated hepatoma cell line cultures as bio-indicators of CYP 1A1 inducers in urban air. Biomarkers (1997) 2(5):279–85. doi: 10.1080/135475097231508
20. Ács A, Liang X, Bock I, Griffitts J, Ivánovics B, Vásárhelyi E, et al. Chronic effects of carbamazepine, progesterone and their mixtures at environmentally relevant concentrations on biochemical markers of zebrafish (Danio rerio). Antioxidants (2022) 11(9):1776. doi: 10.3390/antiox11091776
21. Jönsson EM, Abrahamson A, Brunström B, Brandt I. Cytochrome P4501A induction in rainbow trout gills and liver following exposure to waterborne indigo, benzo[a]pyrene and 3,3′,4,4′,5-pentachlorobiphenyl. Aquat Toxicol (2006) 79(3):226–32. doi: 10.1016/j.aquatox.2006.06.006
22. Monostory K, Kohalmy K, Prough RA, Kóbori L, Vereczkey L. The effect of synthetic glucocorticoid, dexamethasone on CYP1A1 inducibility in adult rat and human hepatocytes. FEBS Lett (2005) 579(1):229–35. doi: 10.1016/j.febslet.2004.11.080
23. Vieira Silva A, Chu I, Feeley M, Bergman, Håkansson H, Öberg M. Dose-dependent toxicological effects in rats following a 90-day dietary exposure to PCB-156 include retinoid disruption. Reprod Toxicol (2022) 107:123–39. doi: 10.1016/j.reprotox.2021.09.012
24. Bhandari RNB, Riccalton LA, Lewis AL, Fry JR, Hammond AH, Tendler SJB, et al. Liver tissue engineering: A role for co-culture systems in modifying hepatocyte function and viability. Tissue Eng (2001) 7(3):345–57. doi: 10.1089/10763270152044206
25. Ringel M, Von Mach MA, Santos R, Feilen PJ, Brulport M, Hermes M, et al. Hepatocytes cultured in alginate microspheres: An optimized technique to study enzyme induction. Toxicology (2005) 206(1):153–67. doi: 10.1016/j.tox.2004.07.017
26. Donato MT, Gómez-Lechón MJ, Castell JV. A microassay for measuring cytochrome P450IA1 and P450IIB1 activities in intact human and rat hepatocytes cultured on 96-well plates. Anal Biochem (1993) 213(1):29–33. doi: 10.1006/abio.1993.1381
27. Miranda JP, Rodrigues A, Tostões RM, Leite S, Zimmerman H, Carrondo MJT, et al. Extending hepatocyte functionality for drug-testing applications using high-viscosity alginate–encapsulated three-dimensional cultures in bioreactors. Tissue Eng Part C Methods (2010) 16(6):1223–32. doi: 10.1089/ten.tec.2009.0784
28. Gomez-Lechon MJ, Donato MT, Ponsoda X, Fabra R, Trullenque R, Castell J. Isolation, culture and use of human hepatocytes in drug research. In: Castell JV, Gómez-Lenchón MJ, editors. In vitro methods in pharmaceutical research. California, USA: Academic Press (1997). p. 368.
29. Correia JC, Massart J, de Boer JF, Porsmyr-Palmertz M, Martínez-Redondo V, Agudelo LZ, et al. Bioenergetic cues shift FXR splicing towards FXRα2 to modulate hepatic lipolysis and fatty acid metabolism. Mol Metab (2015) 4(12):891–902. doi: 10.1016/j.molmet.2015.09.005
30. Gurevich I, Burton SA, Munn C, Ohshima M, Goedland ME, Czysz K, et al. iPSC-derived hepatocytes generated from NASH donors provide a valuable platform for disease modeling and drug discovery. Biol Open (2020) 9(12):1–9. doi: 10.1242/bio.055087
31. Collin de l’Hortet A, Takeishi K, Guzman-Lepe J, Morita K, Achreja A, Popovic B, et al. Generation of human fatty livers using custom-engineered induced pluripotent stem cells with modifiable SIRT1 metabolism. Cell Metab (2019) 30(2):385–401.e9. doi: 10.1016/j.cmet.2019.06.017
32. La Rocca G, Anzalone R, Corrao S, Magno F, Loria T, Lo Iacono M, et al. Isolation and characterization of Oct-4+/HLA-G+ mesenchymal stem cells from human umbilical cord matrix: Differentiation potential and detection of new markers. Histochem Cell Biol (2009) 131(2):267–82. doi: 10.1007/s00418-008-0519-3
33. Iyer VV, Yang H, Ierapetritou MG, Roth CM. Effects of glucose and insulin on HepG2-C3A cell metabolism. Biotechnol Bioeng (2010) 107(2):347–56. doi: 10.1002/bit.22799
34. Winther-Sørensen M, Galsgaard KD, Santos A, Trammell SAJ, Sulek K, Kuhre RE, et al. Glucagon acutely regulates hepatic amino acid catabolism and the effect may be disturbed by steatosis. Mol Metab (2020) 42:101080. doi: 10.1016/j.molmet.2020.101080
35. Pascussi JM, Drocourt L, Gerbal-Chaloin S, Fabre JM, Maurel P, Vilarem MJ. Dual effect of dexamethasone on CYP3A4 gene expression in human hepatocytes. sequential role of glucocorticoid receptor and pregnane X receptor. Eur J Biochem (2001) 268(24):6346–58. doi: 10.1046/j.0014-2956.2001.02540.x
36. Athersuch TJ, Antoine DJ, Boobis AR, Coen M, Daly AK, Possamai L, et al. Paracetamol metabolism, hepatotoxicity, biomarkers and therapeutic interventions: A perspective. Toxicol Res (Camb). (2018) 7(3):347–57. doi: 10.1039/c7tx00340d
37. Serras AS, Rodrigues JS, Cipriano M, Rodrigues AV, Oliveira NG, Miranda JP. A critical perspective on 3D liver models for drug metabolism and toxicology studies. Front Cell Dev Biol (2021) 203. doi: 10.3389/fcell.2021.626805
38. Anundi I, Lähteenmäki T, Rundgren M, Moldeus P, Lindros KO. Zonation of acetaminophen metabolism and cytochrome P450 2E1-mediated toxicity studied in isolated periportal and perivenous hepatocytes. Biochem Pharmacol (1993) 45(6):1251–9. doi: 10.1016/0006-2952(93)90277-4
39. Chalasani N, Christopher Gorski J, Asghar MS, Asghar A, Foresman B, Hall SD, et al. Hepatic cytochrome P450 2E1 activity in nondiabetic patients with nonalcoholic steatohepatitis. Hepatology (2003) 37(3):544–50. doi: 10.1053/jhep.2003.50095
40. Donato MT, Jiménez N, Serralta A, Mir J, Castell JV, Gómez-Lechón MJ. Effects of steatosis on drug-metabolizing capability of primary human hepatocytes. Toxicol Vitr. (2007) 21(2):271–6. doi: 10.1016/j.tiv.2006.07.008
41. Grattagliano I, Russmann S, Diogo C, Bonfrate L, J. Oliveira P, Q.-H. Wang D, et al. Mitochondria in chronic liver disease. Curr Drug Targets. (2011) 12(6):879–93. doi: 10.2174/138945011795528877
42. Hopkinson BM, Desler C, Kalisz M, Vestentoft PS, Juel Rasmussen L, Bisgaard HC. Bioenergetic changes during differentiation of human embryonic stem cells along the hepatic lineage. Oxid Med Cell Longev (2017) 2017:1–11. doi: 10.1155/2017/5080128
43. Haeusler RA, McGraw TE, Accili D. Metabolic signalling: Biochemical and cellular properties of insulin receptor signalling. Nat Rev Mol Cell Biol (2018) 19(1):31–44. doi: 10.1038/nrm.2017.89
44. Ning J, Hong T, Yang X, Mei S, Liu Z, Liu H-Y, et al. Insulin and insulin signaling play a critical role in fat induction of insulin resistance in mouse. Am J Physiol Metab (2011) 301(2):E391–401. doi: 10.1152/ajpendo.00164.2011
45. Kearney AL, Norris DM, Ghomlaghi M, Wong MKL, Humphrey SJ, Carroll L, et al. Akt phosphorylates insulin receptor substrate to limit pi3k-mediated pip3 synthesis. Elife (2021) 10:1–32. doi: 10.7554/eLife.66942
46. Kubota N, Kubota T, Kajiwara E, Iwamura T, Kumagai H, Watanabe T, et al. Differential hepatic distribution of insulin receptor substrates causes selective insulin resistance in diabetes and obesity. Nat Commun (2016) 7:1–16. doi: 10.1038/ncomms12977
47. Hirashima Y, Tsuruzoe K, Kodama S, Igata M, Toyonaga T, Ueki K, et al. Insulin down-regulates insulin receptor substrate-2 expression through the phosphatidylinositol 3-kinase/Akt pathway. J Endocrinol (2003) 179(2):253–66. doi: 10.1677/joe.0.1790253
48. Zhang J, Ou J, Bashmakov Y, Horton JD, Brown MS, Goldstein JL. Insulin inhibits transcription of IRS-2 gene in rat liver through an insulin response element (IRE) that resembles IREs of other insulin-repressed genes. Proc Natl Acad Sci U S A (2001) 98(7):3756–61. doi: 10.1073/pnas.071054598
49. Rui L. Energy metabolism in the liver. Compr Physiol (2014) 4(1):177–97. doi: 10.1002/cphy.c130024
50. Godoy P, Hewitt NJ, Albrecht U, Andersen ME, Ansari N, Bhattacharya S, et al. Recent advances in 2D and 3D in vitro systems using primary hepatocytes, alternative hepatocyte sources and non-parenchymal liver cells and their use in investigating mechanisms of hepatotoxicity, cell signaling and ADME. Arch Toxicol (2013) 87(8):1315–530. doi: 10.1007/s00204-013-1078-5
51. Ben-Moshe S, Itzkovitz S. Spatial heterogeneity in the mammalian liver. Nat Rev Gastroenterol Hepatol (2019) 16(7):395–410. doi: 10.1038/s41575-019-0134-x
52. Graffmann N, Ring S, Kawala M-A, Wruck W, Ncube A, Trompeter H-I, et al. Modeling nonalcoholic fatty liver disease with human pluripotent stem cell-derived immature hepatocyte-like cells reveals activation of PLIN2 and confirms regulatory functions of peroxisome proliferator-activated receptor alpha. Stem Cells Dev (2016) 25(15):1119–33. doi: 10.1089/scd.2015.0383
53. Graffmann N, Ncube A, Martins S, Fiszl AR, Reuther P, Bohndorf M, et al. A stem cell based in vitro model of NAFLD enables the analysis of patient specific individual metabolic adaptations in response to a high fat diet and AdipoRon interference. Biol Open (2021) 10(1):bio054189. doi: 10.1242/bio.054189
Keywords: alternative hepatic in vitro models, mesenchymal stem cells, hepatocyte-like cells, insulin, glucose, dexamethasone, metabolism
Citation: Rodrigues JS, Faria-Pereira A, Camões SP, Serras AS, Morais VA, Ruas JL and Miranda JP (2023) Improving human mesenchymal stem cell-derived hepatic cell energy metabolism by manipulating glucose homeostasis and glucocorticoid signaling. Front. Endocrinol. 13:1043543. doi: 10.3389/fendo.2022.1043543
Received: 13 September 2022; Accepted: 24 November 2022;
Published: 13 January 2023.
Edited by:
Carlos Guillén, Complutense University, SpainReviewed by:
Silvana Bordin, University of São Paulo, BrazilLaia Tolosa, Instituto Investigación Sanitaria La Fe, Spain
Copyright © 2023 Rodrigues, Faria-Pereira, Camões, Serras, Morais, Ruas and Miranda. This is an open-access article distributed under the terms of the Creative Commons Attribution License (CC BY). The use, distribution or reproduction in other forums is permitted, provided the original author(s) and the copyright owner(s) are credited and that the original publication in this journal is cited, in accordance with accepted academic practice. No use, distribution or reproduction is permitted which does not comply with these terms.
*Correspondence: Joana Paiva Miranda, am1pcmFuZGFAZmYudWxpc2JvYS5wdA==