 Guo-yun Li
 Xu-dong Qian
 Chun-ming Ma
 Fu-zai Yin
- 1Department of Internal Medicine, Hebei Medical University, Shijiazhuang, Hebei, China
- 2Department of Endocrinology, The First Hospital of Qinhuangdao, Qinhuangdao, Hebei, China
- 3Department of Endocrinology, Affiliated Hospital of Chengde Medical University, Chengde, Hebei, China
- 4Department of Neurology, Affiliated Hospital of Chengde Medical University, Chengde, Hebei, China
Objectives: To access the dose-response relationship between sex hormones and hyperuricemia (HUA), and to find the cut-off value in different gender.
Methods: 9,685 participants were derived from the database of National Health and Nutrition Examination Survey (NHANES). Restricted cubic spline (RCS) analysis were applied to explore the relationship between sex hormones and HUA after adjusting for confounding factors by propensity score match (PSM). Logistic regression was used to estimate the odds ratio (OR) and 95% CI.
Results: The prevalence of HUA was 15.13% in female participants and 22.30% in male participants. Logistic regression analysis showed that estradiol (E2) was independently associated with HUA for a P value of 0.003 and 0.01in female and male participants, respectively. Testosterone (T) was only independently associated with HUA in male participants (P<0.001) but not in female participants (P = 0.59). RCS analysis showed a dose-response relationship between sex hormones and HUA. The risk of HUA increased as E2 lower than 29.6pg/mL in female participants and T lower than 389.1ng/dL in male participants. E2 higher than 23.6pg/ml was an independent risk factor for HUA in male participants.
Conclusion: A dose-response relationship was found between sex hormones and HUA. The cut-off value of E2 in male and female participants was 29.6pg/mL and 23.6pg/mL, respectively, and the cut-off value of T in male participants was 389.1ng/dL. These results provide a reference for preventing HUA and hormone supplement therapy.
Introduction
The prevalence of hyperuricemia (HUA) in overall population is 13.2% to 20.2% in different countries and regions (1–3), unfortunately, it shows a significant increase in recent years, which has now become another common metabolic disease after diabetes (4–6). HUA is a risk factor for various diseases, including gout, hypertension, diabetes, cardiovascular and cerebrovascular diseases, kidney disease, and metabolic syndrome. It is also an independent risk factor for cardiovascular diseases, diabetes complications, and increased all-cause mortality (7–9). The global burden of disease study find that HUA and gout has brought a substantial economic burden to the world (9). Therefore, it is imperative to explore the risk factors for HUA.
The well-known factors were associated with serum uric acid level include diet, alcohol consumption, obesity, and gene polymorphisms (10, 11). Yet, the relationship between sex hormones and serum uric acid level is complicated. In daily clinical work, we can observe that HUA is more common in men and postmenopausal women. It has been reported that serum uric acid level in postmenopausal women increased by 0.34mg/dl compared with premenopausal women. Serum uric acid levels in men are greater than women by 1mg/dl on average (12). Furthermore, serum uric acid levels are 0.24 mg/dl lower than placebo group in postmenopausal women after hormone supplement therapy at 1-year follow-up (12), suggesting that the serum uric acid level in adults may be related to gonadal hormone concentrations. At present, some studies (13, 14) have shown that the effects of sex hormones on uric acid level differs between women and men. Testosterone (T) is negatively correlated with uric acid levels in male participants and positively associated with uric acid levels in female participants. Likewise, estradiol (E2) is negatively correlated with female uric acid and positively correlated with male uric acid. Other researchers have found that the relationship is no longer significant among postmenopausal women and men over 65, and the mechanism was still unclear (14, 15). At present, there is no objective report on the dose-response relationship between sex hormones and HUA. Therefore, the purpose of this study was to investigate the dose-response relationship between sex hormones and HUA, and to find the cut-off values of E2 and T when the risk of hyperuricemia increased. The results will provide ideas and references for the prevention and treatment of hyperuricemia.
Materials and methods
Data source
The NHANES database is a large and representative multi-stage complex sample survey project in the United States. The primary purpose is to understand American citizens’ health and nutrition status. Data were obtained through personal interviews at home, health examinations at mobile examination centers, and laboratory sample analysis. Before completing the NHANES, all participants obtained written informed consent and approved by the National Center of Health Statistics Research Ethics Review Board. The data were de-identified by the National Center for Health Statistics before publication (16). Ethical approval was not required for this study because the study was based on secondary analyses of publicly available data.
Participants aged 18-80 years from the database of NHANES 2013-2016 were enrolled in this study. We excluded the participants with missing sample weight, body mass index (BMI), waist circumference (WC), serum uric acid, E2, and T. In addition, individuals who had been treated with anti-hyperuricemia drug and used hormone replacement therapy were excluded. Eventually, 9,685 participants were included in this cross-sectional study (Figure 1).
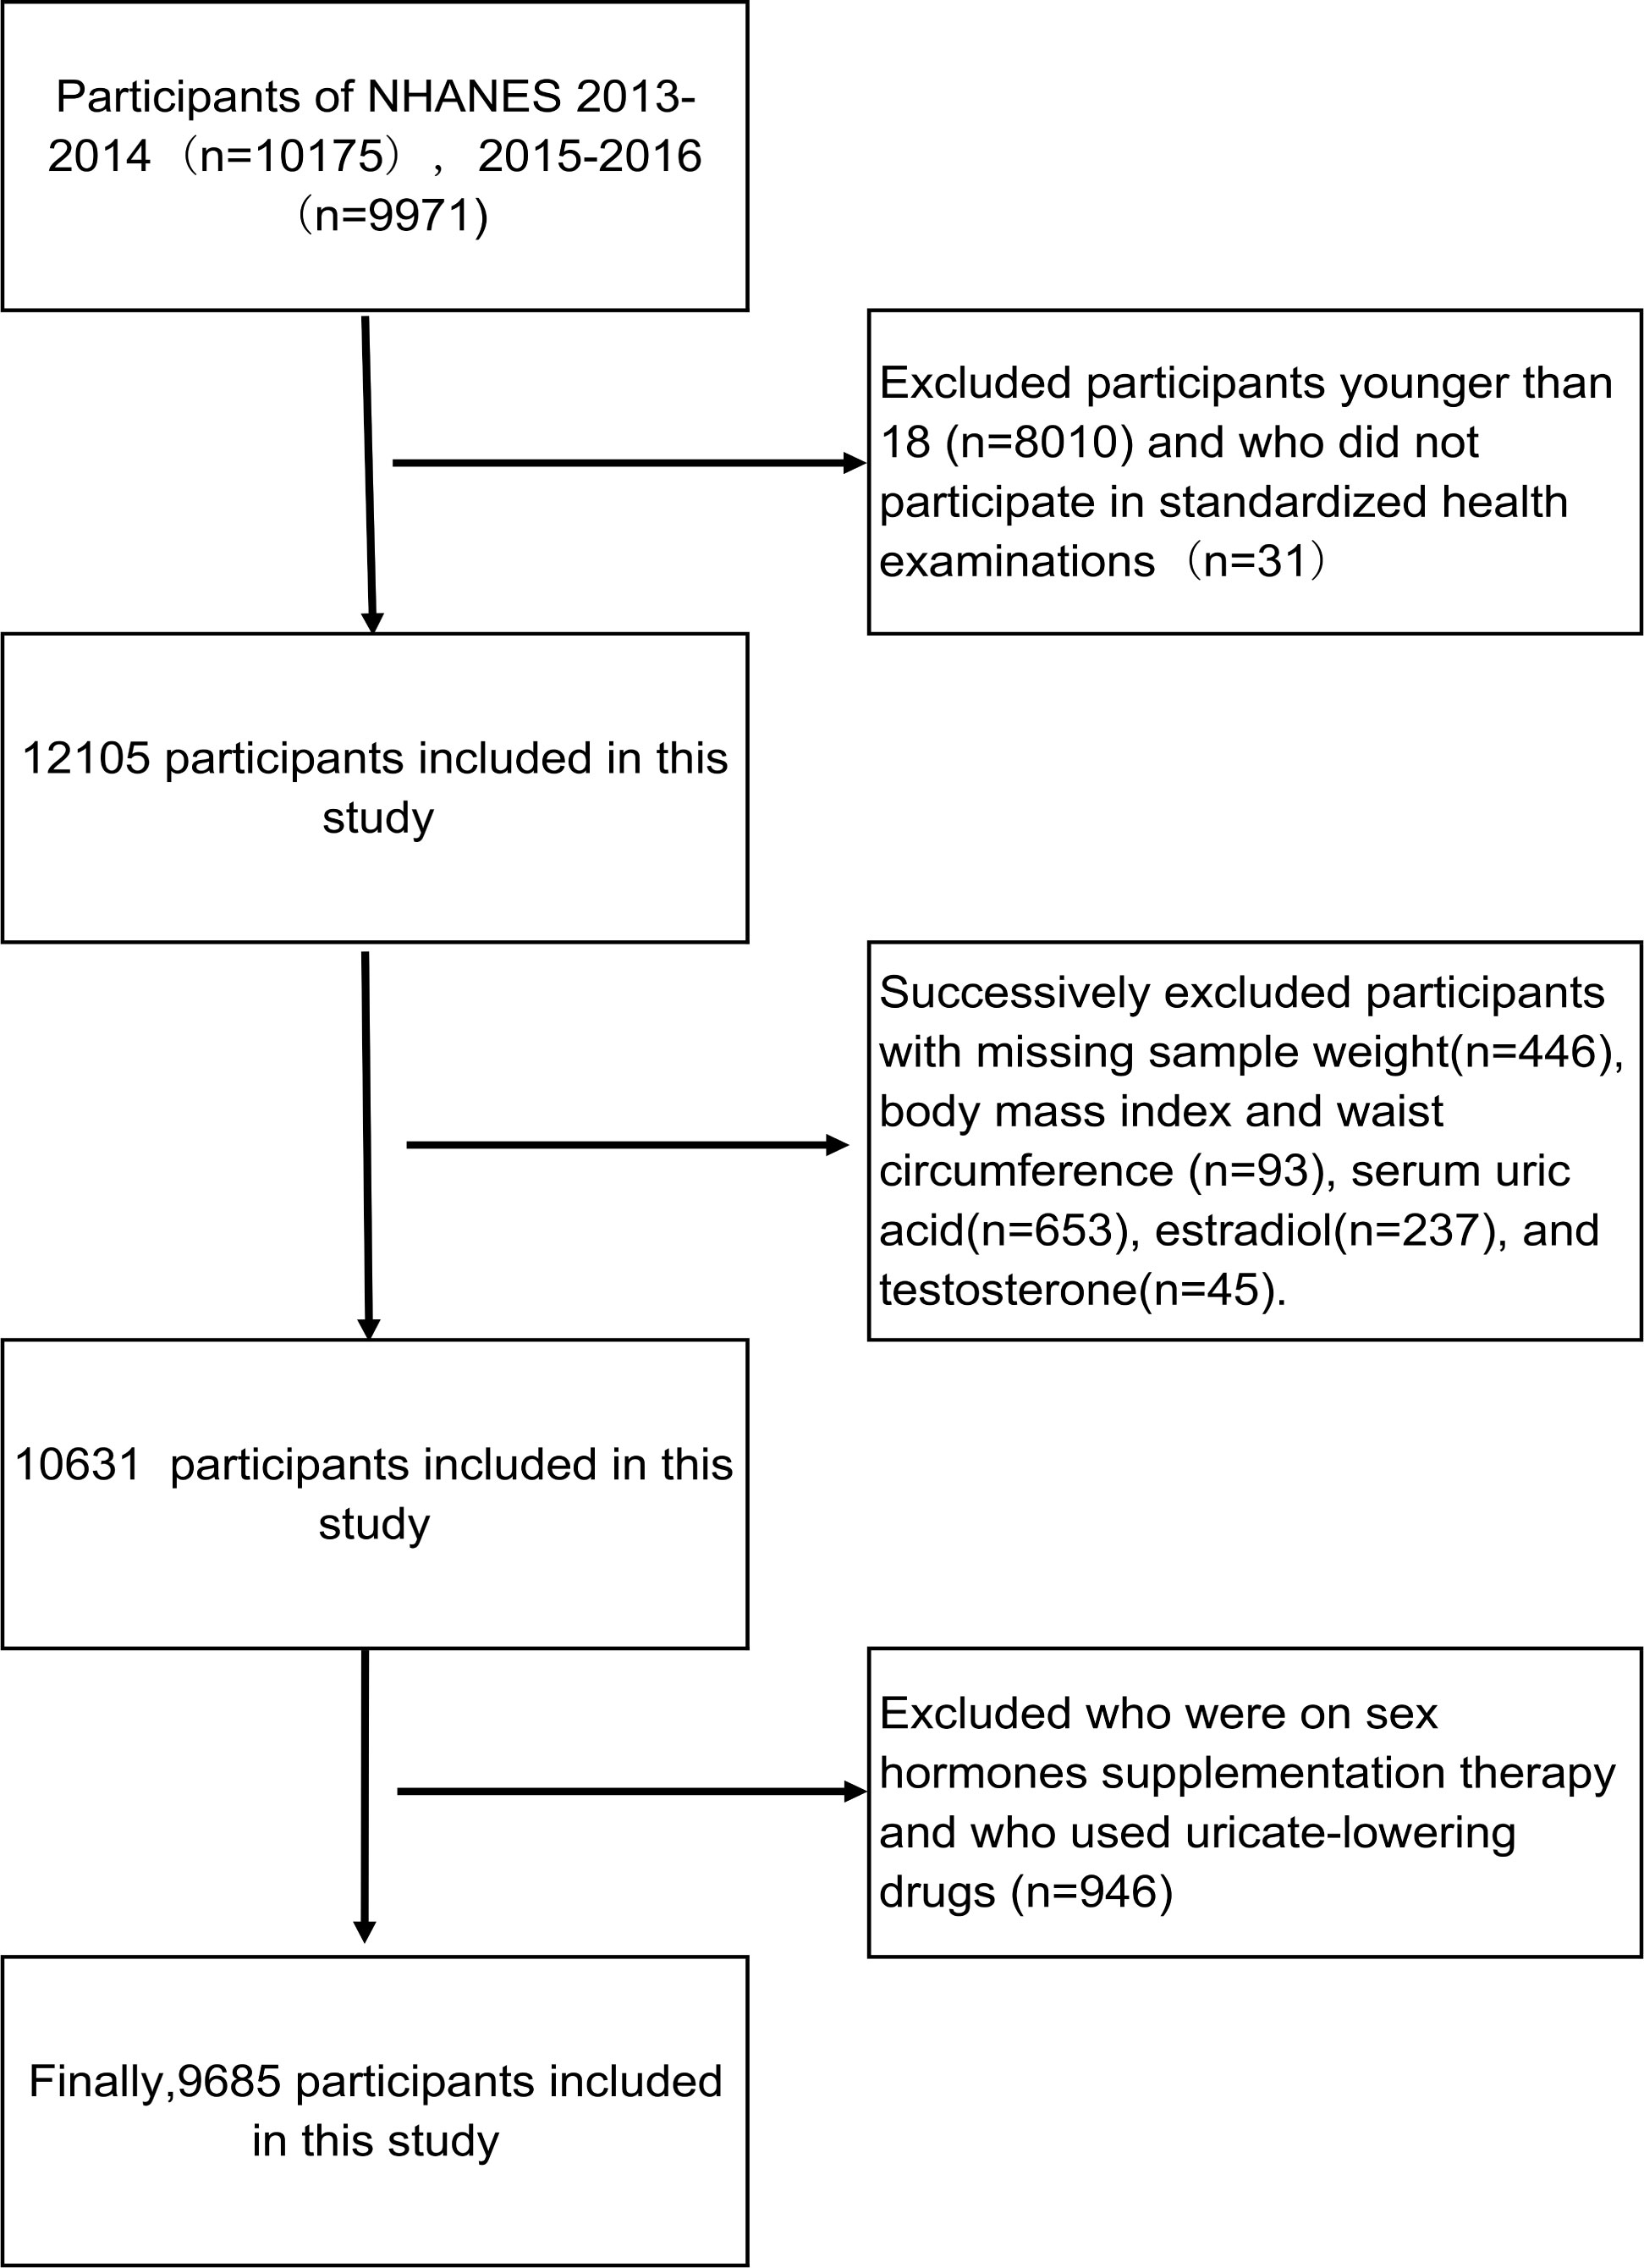
Figure 1 Flow chart of the screening process for the selection of eligible participants.
Variables
Serum uric acid concentrations were measured using the DXC800 and timing endpoint method. The lower limit of uric acid detection was 0.5mg/dL (17), and HUA was defined as uric acid greater than 6mg/dL in female participants and 7mg/dL in male participants. T and E2 were determined by isotope dilution chromatography-tandem mass spectrometry (ID-LC-MS/MS) developed by CDC. The lower limit of T detection was 0.76ng/dL and the lower limit of E2 detection was 2.994pg/mL (17).
Covariates
Potential confounding factors in this study include age, BMI, WC, ethnicity, alcohol consumption, physical activities (PA) and six diseases. Trained health technicians collect height, weight, and WC measurements at mobile screening centers. BMI is calculated by dividing weight in kilograms by height in meters squared. Alcohol consumption were obtained from alcohol use questionnaire and drinkers were classified into light alcohol consumption (≤2drinks/day) and heavy alcohol consumption (>2 drinks/day). PA were obtained from physical activity questionnaire, total time spent doing activity during a week was evaluated. At least 150min of moderate-intensity or 75min of vigorous-intensity recreational activities per week were used to identify whether adults had adequate physical activity. Six diseases include hypertension (HT), cardiovascular disease (CVD), diabetes mellitus (DM), metabolic syndrome (MS), hyperlipidemia (HLP), and chronic kidney diseases (CKD). HT was defined as any self-reported hypertension, use of an antihypertensive drug, or BP ≥140/90 mmHg. DM was defined as any self-reported diabetes mellitus or use of glucose-lowering drugs or fasting blood glucose ≥7 mmol/L. HLP was defined as any self-reported history or use of lipid-lowering drugs, or serum TC ≥200mg/dL or TG ≥150mg/dL or LDL-C ≥130mg/dL, or HDL-C <40mg/dL in female participants and HDL-C <50mg/dL. MS should meet the diagnostic criteria for MS in ATP or IDF (18, 19). The diagnose of CKD requires an eGFR< 60 mL/min/1.73m2 or urinary albumin-to-creatinine ratio (UACR)≥30 mg/g by KDIGO (20). eGFR was calculated using the CKD-EPI equation (21). CVD was determined by the self-reported history of coronary heart disease, congestive heart failure, heart attack, or stroke.
Statistical analysis
All analyses were conducted using R studio 4.2.1. A two-sided P < 0.05 was considered statistically significant. All data have taken into account the weight of samples. Following the NHANES analysis guidelines, the new sample weight is equal to 1/2 of the weight of the original two years. Continuous variables were presented as mean standard deviation (SD) or median with interquartile range, and categorical variables were presented as frequency and percentages. We used the ANOVA to compare groups of normally distributed parameters and the Kruskal-Wallis test to compare nonparametric variables.
Since the reduction of major hormones in both men and women lead to menopause symptoms, resulting in a significantly higher risk of obesity, hypertension, coronary heart disease and other metabolic diseases, which can significantly affect uric acid levels, such confounding factors may mask the true effect of sex hormones on uric acid, therefore, propensity score matching (PSM) was used to balance the differences in covariates between groups and reduce selection bias. The dependent variable in PSM were grouped on the basis of median E2 (33.1pg/ml) in women and median testosterone (394ng/dl) in men, because it was similar to the sex hormone level when menopausal symptom starts to appear. Six diseases include HT, DM, MS, HLP, CKD and CVD were set as covariate. By calculating the propensity score of samples, the method of caliper matching was used for 1:1 matching, and the matching tolerance was 0.02. Thus, every individual in the low estradiol or testosterone group could be matched with a control individual due to the most similar propensity score.
Our statistical analysis consisted of two steps to investigate the association between sex hormones and HUA. Since E2 and T had a logarithmic relationship with the dependent variable, we took the logarithms of E2 and T and changed them into lge and lgt. In the first step, we analyzed the matched data by multiple logistic regression and establish a fully adjusted regression model. Lge and lgt were independent variables, hyperuricemia was the dependent variable, age, BMI, WC,PA, ethnicity, alcohol consumption and the presence of six diseases including HT, DM, MS, HLP, CKD, and CVD were the covariates. In the second step, based on the results of logistic regression analysis in the first step, RCS model with four nodes (5th, 25th, 65th, and 95th percentiles of T and E2) was used to explore the dose-response relationship between HUA and sex hormone and to determine the cut-off value of E2 and T when the risk of HUA increased significantly. With lge or lgt as the horizontal axis and OR value as the vertical coordinate. OR (95% CI) used RCS adjusting for age, BMI, WC, HT, DM, MS, CKD, CVD, HLP and eth, PA, alcohol drinking. The point on the RCS curve where the OR value was equal to 1 was considered as cut-off value. Nonlinearity was tested using the likelihood ratio test, if Poverall<0.05 and Pnon - linearity<0.05, indicating a nonlinear dose-response relationship.
Results
General characteristics of participants
A total of 9,685 participants were enrolled in this study, including 4,632 female participants with an average age of 43.66 and 5,053 male participants with an average age of 45.93. The prevalence of HUA was 15.13% in female participants and 22.30% in male participants. As shown in Tables 1, 2, compared with group Q1, the Q4 group had a lower uric acid level, BMI, WC, and incidence of the six diseases. The differences between groups were statistically significant (P<0.001). In female participants, it is noteworthy that the serum uric acid level, BMI, WC, and the incidence of HUA and MS in group Q2 were higher than in group Q1. Line chart of sex hormones and uric acid are shown in Figure 2.
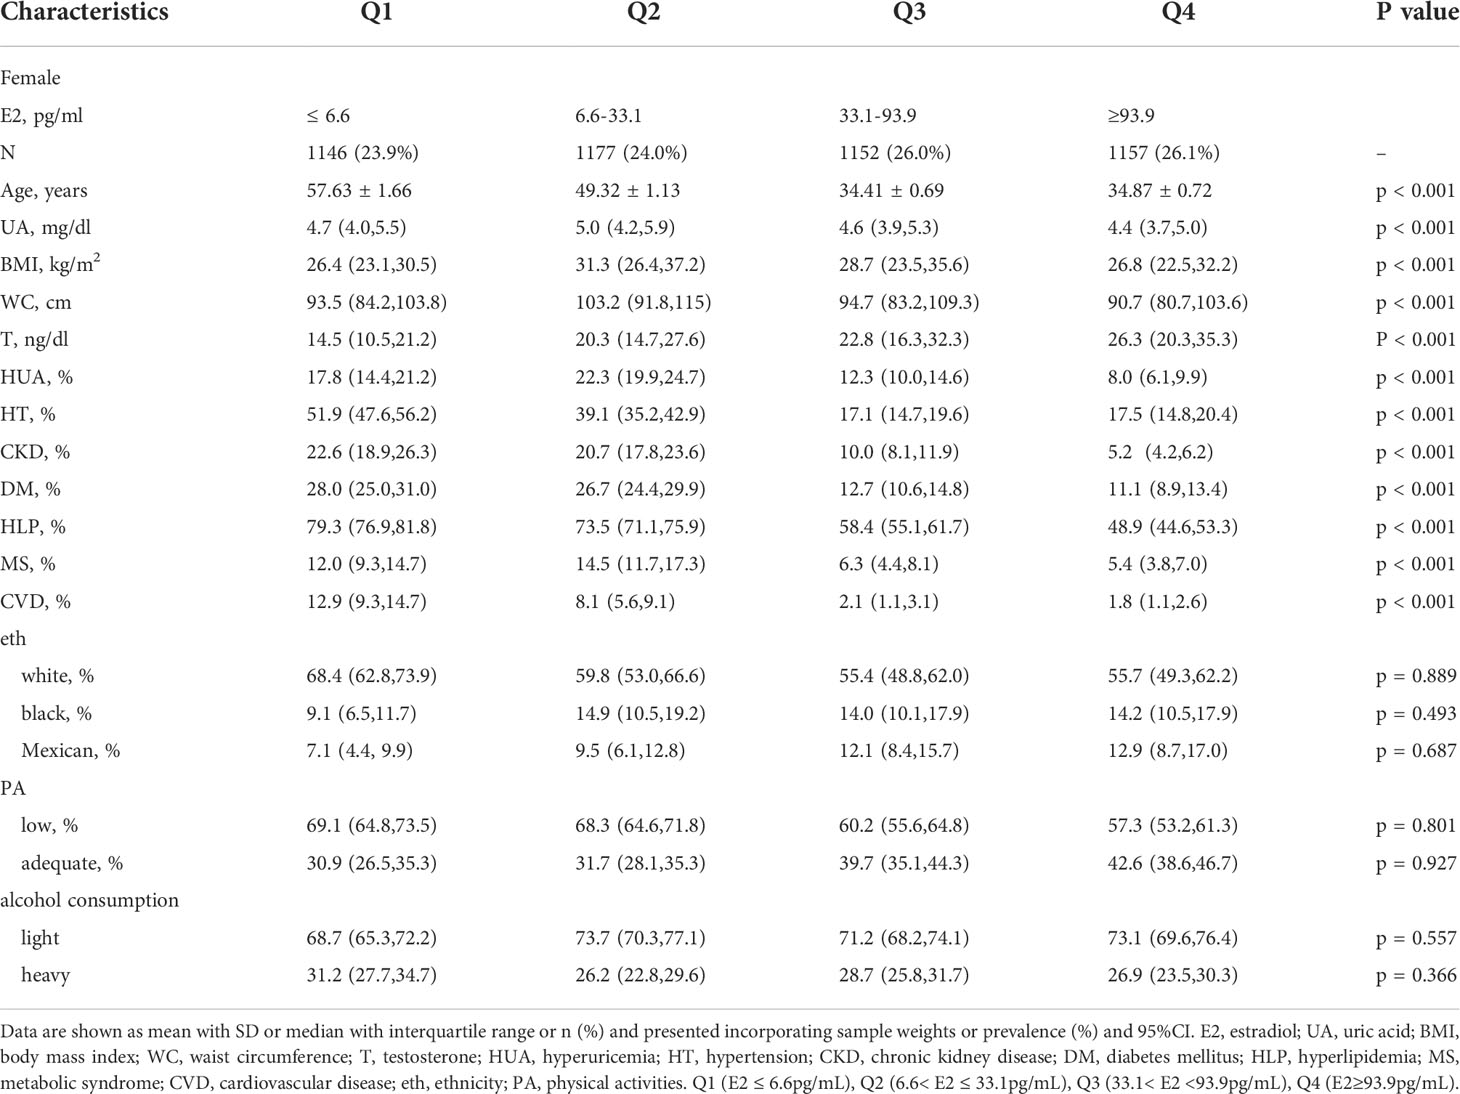
Table 1 General characteristics of female participants by E2 quartiles.
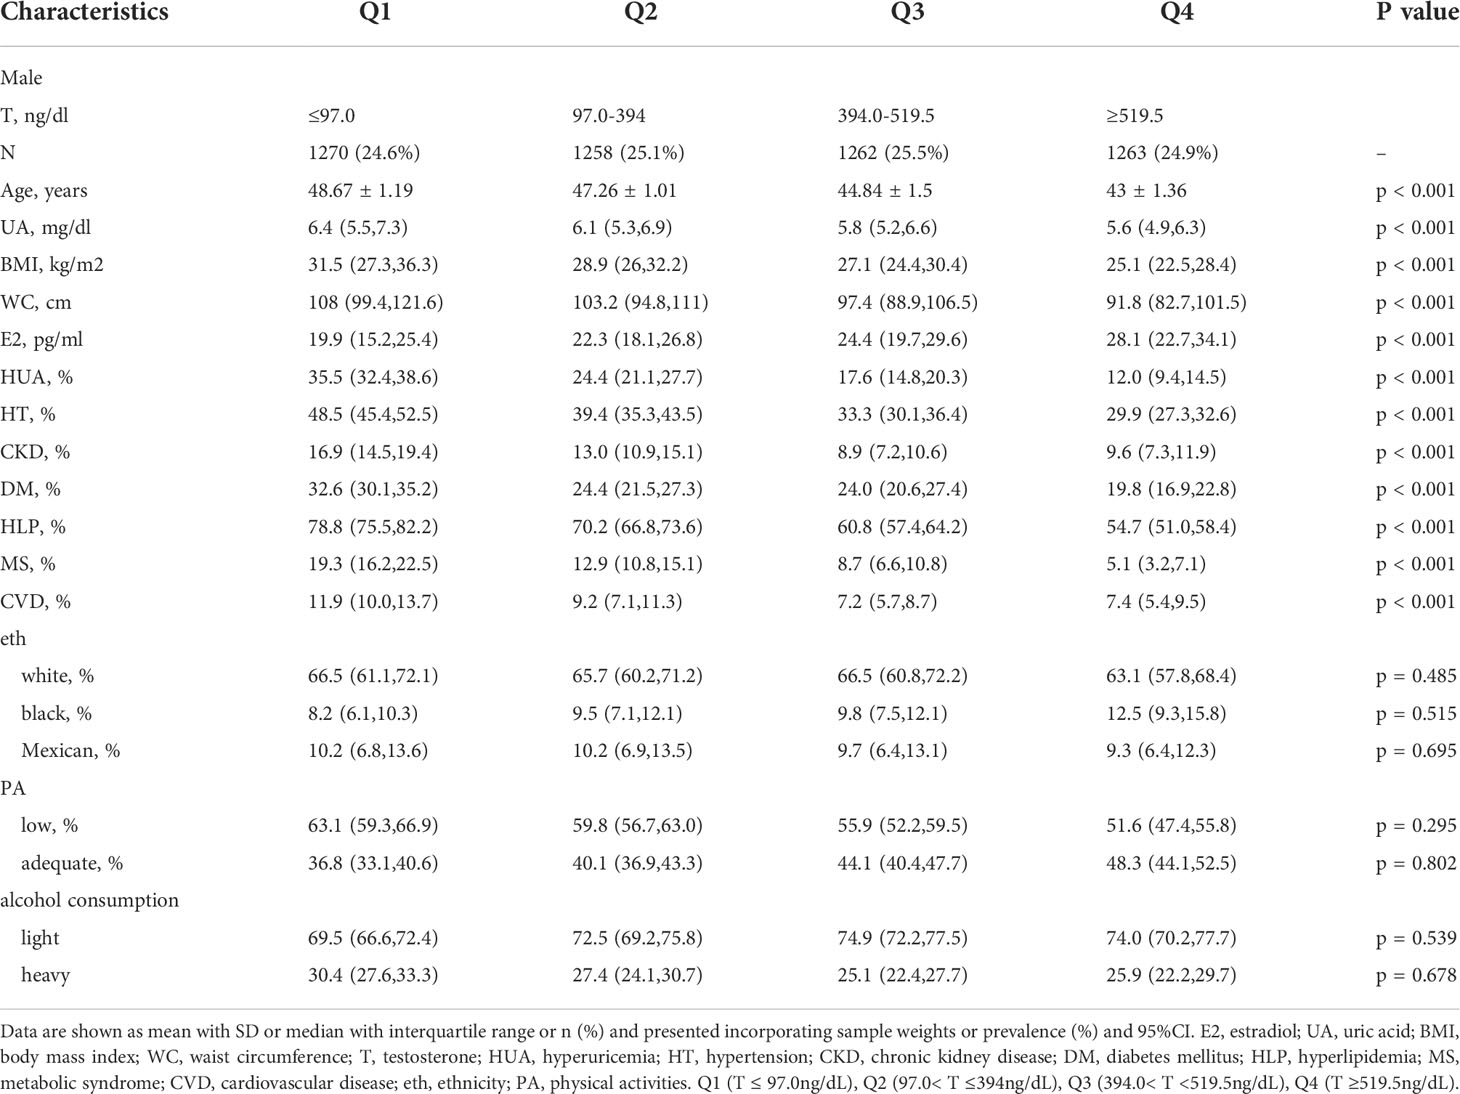
Table 2 General characteristics of male participants by T quartiles.
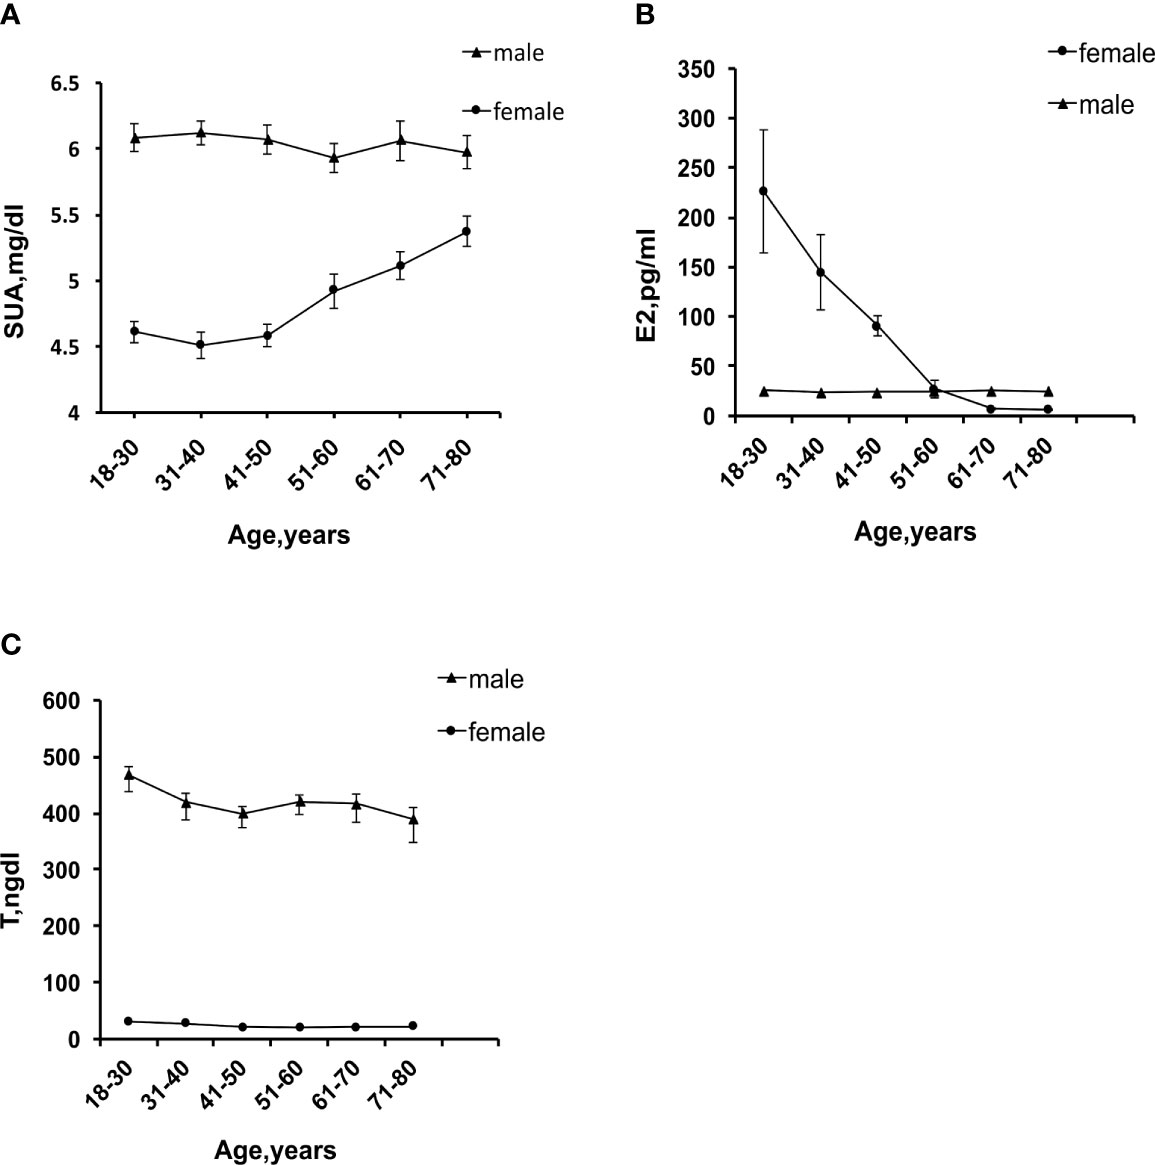
Figure 2 (A) Trend chart of serum uric acid levels with age. (B) Trend chart of E2 changes with age. (C) Trend chart of T changes with age.
Associations between sex hormones and HUA
Before PSM, the incidence of six diseases was significantly higher in the low sex hormone levels group than in the high levels group (P = < 0.001). After 1:1 PSM, 2,868 female participants and 4,030 male participants were enrolled in the analysis. There were no significant differences in the incidence of six diseases between the two groups (Table 3).
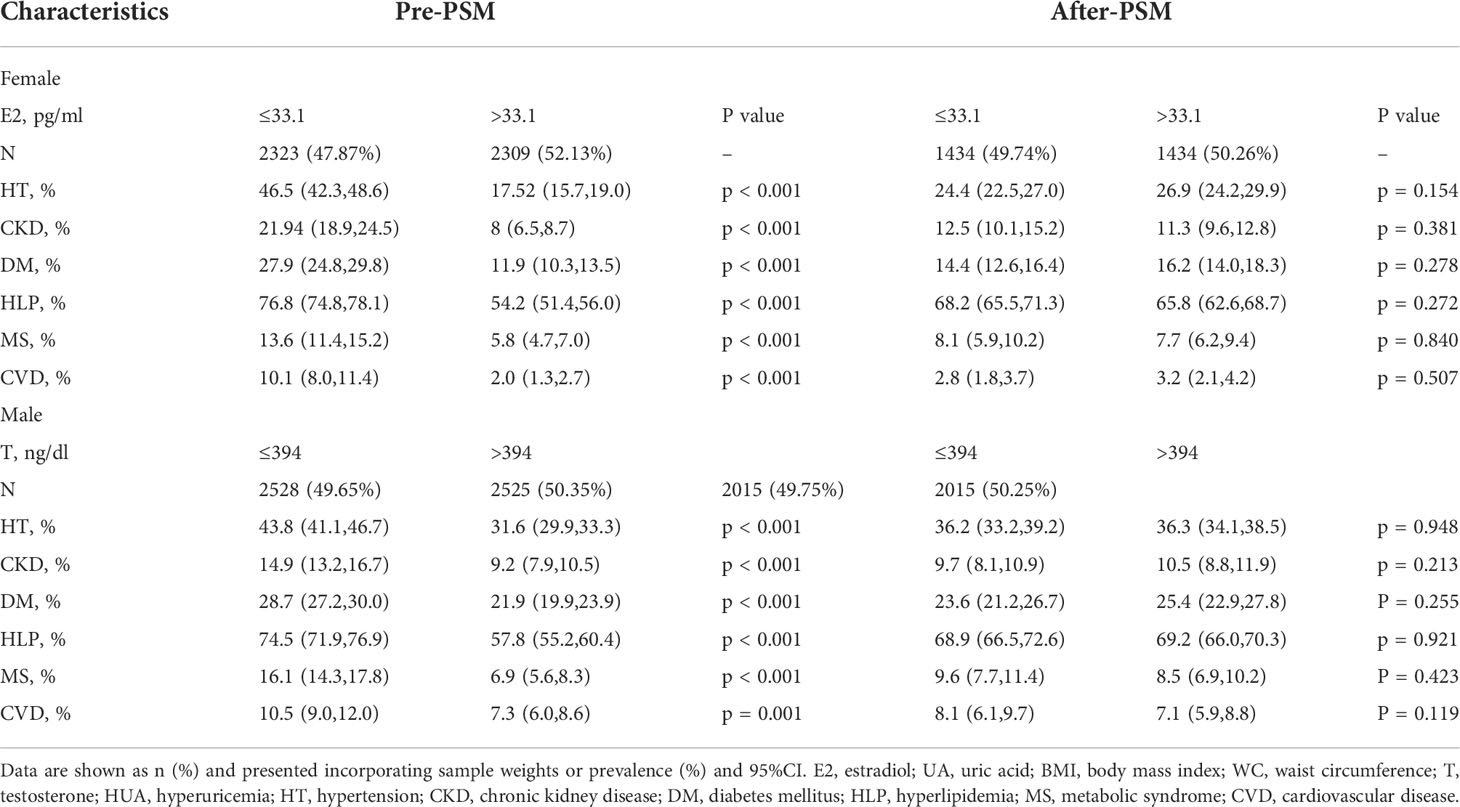
Table 3 |Baseline comparison of influencing factors before and after PSM.
We analyzed the matching data by fully adjusted multivariable logistic regression model (Figure 3). The results showed that, in female participants, E2 was a protective factor for HUA, and the prevalence of HUA decreased by 26% for every log-unit increase of E2 (OR=0.74,95%CI: 0.61-0.89, P = 0.003). Additionally, we found T was not independently associated with HUA (OR=0.91,95%CI: 0.63-1.30, P = 0.59). In the subgroup analyses, the association between E2 and HUA disappeared when the participants were older than 60 years, menopausal, or combined with HT, DM, MS, CKD, and CVD; E2 was still an independent protective factor for HUA when participants were less than 60 years or combined with HLP. In male participants, E2 was an independent risk factor for HUA, and with every log-unit increase of E2, the prevalence of HUA increased by 76% (OR=1.76,95%CI:1.12-2.76, P = 0.01). T was identified as a protective factor for HUA and with every log-unit increase of T, the prevalence of HUA decreased by 49% the prevalence of HUA (OR=0.51,95%CI:0.37-0.70, P< 0.001). Subgroup analysis showed no independent correlation between E2 and HUA in patients with HT, DM, MS, CKD, or age≥60 years; E2 was still an independent risk factor for HUA when participants were less than 60 years, or combined with HLP or CVD. Furthermore, there was no correlation between T and HUA in patients with CKD, CVD, or age≥60 years; T was still an independent protective factor for HUA when participants were less than 60 years or combined with HT, DM, MS or HLP.
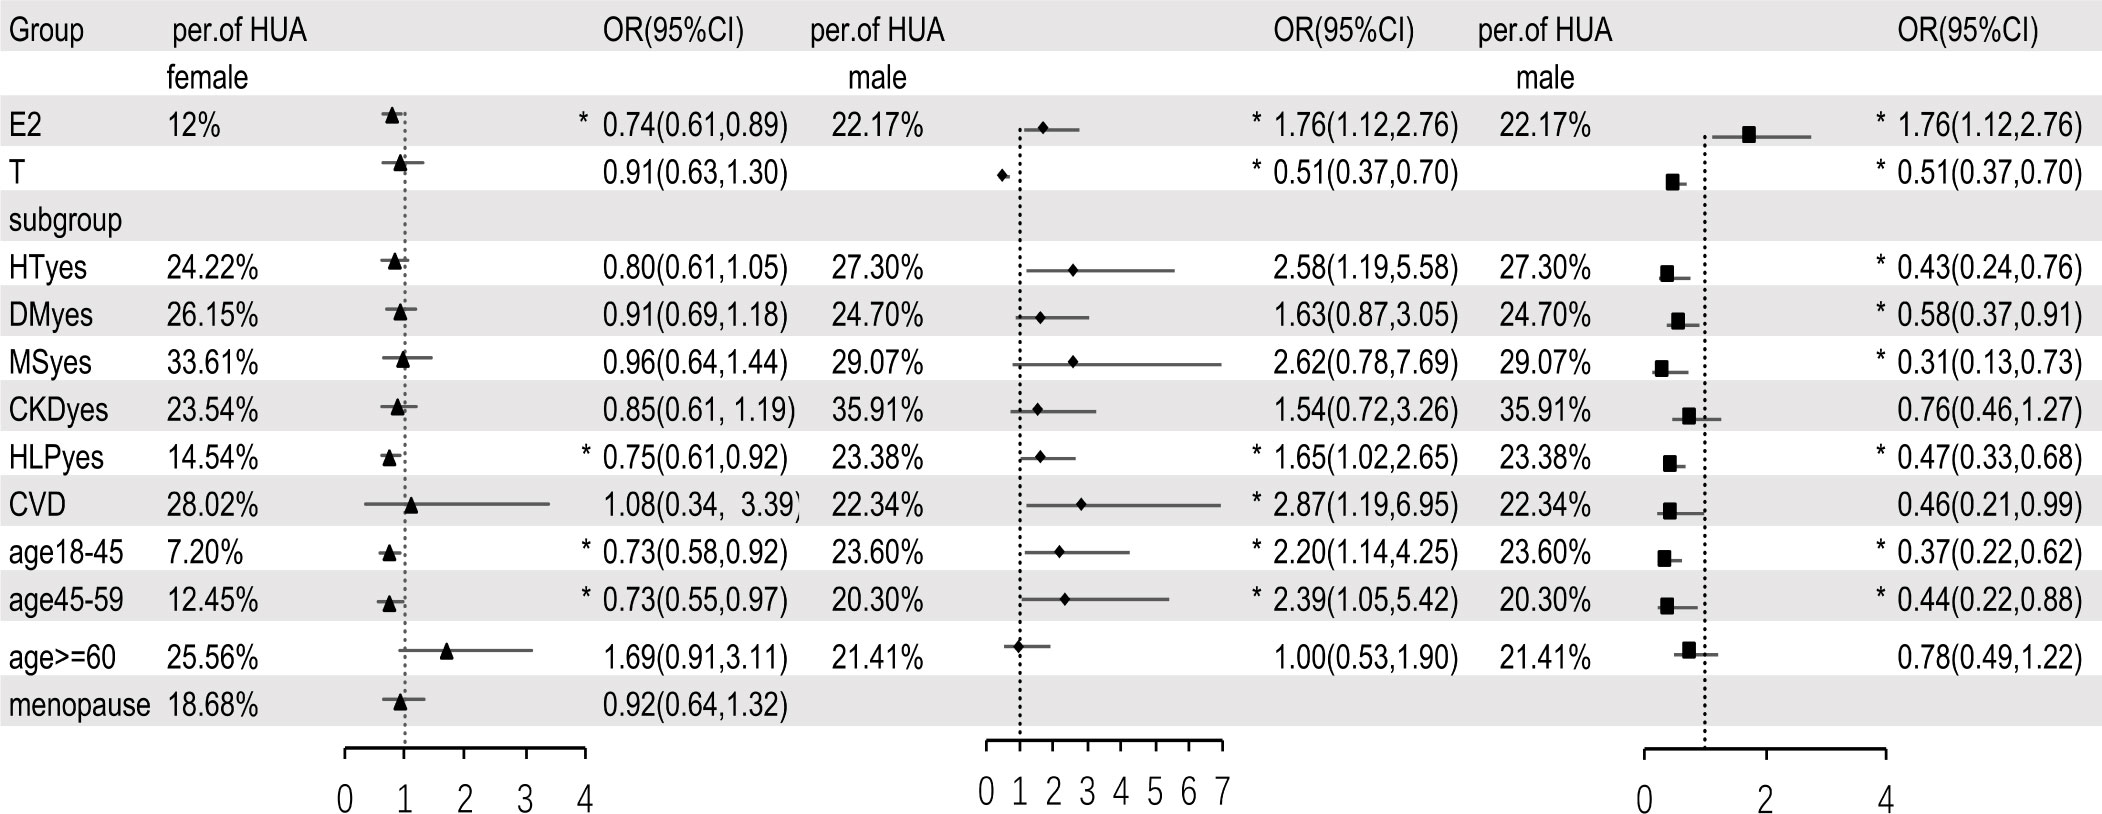
Figure 3 Multivariable logistic regression analysis between sex hormones and HUA, after adjusting for variables (except for the grouped variables) such as age, BMI, WC, HT, DM, MS, CKD, CVD, HLP, eth, PA and alcohol drinking. E2, estradiol; T, testosterone; HT, hypertension; DM, diabetes mellitus; MS, metabolic syndrome; CKD, chronic kidney disease; HLP, hyperlipidemia; CVD, cardiovascular disease; eth, ethnic; PA, physical activities; per of HUA, percentage of hyperuricemia; HT/DM/MS/CKD/HLP/CVDyes means people who have a history of hypertension/diabetes mellitus/metabolic syndrome/chronic kidney disease/hyperlipidemia/cardiovascular disease. In subgroup analysis, ▲ means estradiol in female, ◆ means estradiol in male, ■ means testosterone in male. * means P < 0.05.
Dose-response relationship between sex hormones and HUA
We embedded the statistically significant results in multivariable logistic regression analysis into the RCS model with 4 nodes (5th, 25th, 65th, and 95th percentiles of T and E2) to analyze the relationship between E2, T, and HUA. Since E2 and T have a logarithmic relationship with the dependent variable, we take the logarithms of E2 and T and change them into lge and lgt. The RCS curve was drawn with lge or lgt as the abscissa and OR value as the ordinate (Figure 4), and the shadow represents 95%CI. OR (95% CI) used RCS adjusting for age, BMI, WC, HT, DM, MS, CKD, CVD, HLP and eth, PA, alcohol drinking. As shown in Figure 4, E2 and HUA presented a nonlinear dose-response relationship in female participants (Poverall<0.001, Pnon-linearity<0.001). In male participants, E2 and HUA showed a linear dose-response relationship (Poverall<0.001, Pnon-linearity =0.2262), and T and HUA have a non-linear dose-response relationship (Poverall<0.001, Pnon - linearity<0.001). In female participants, the risk of HUA was highest when E2 was 10.90pg/mL (lge=2.38, OR=1.97,95%CI:1.53-2.53).29.6pg/mL (lge=3.38, OR=1.01,95%CI: 1.01-1.02) could be regarded as the cut-off point. In male, the cut-off point of E2 was 23.6pg/mL (lge=3.16, OR=1,95%CI:1.00-1.31) and T cut-off point was 389.1ng/dl (lgt=5.96, OR=1,95%CI:1.00-1.31)
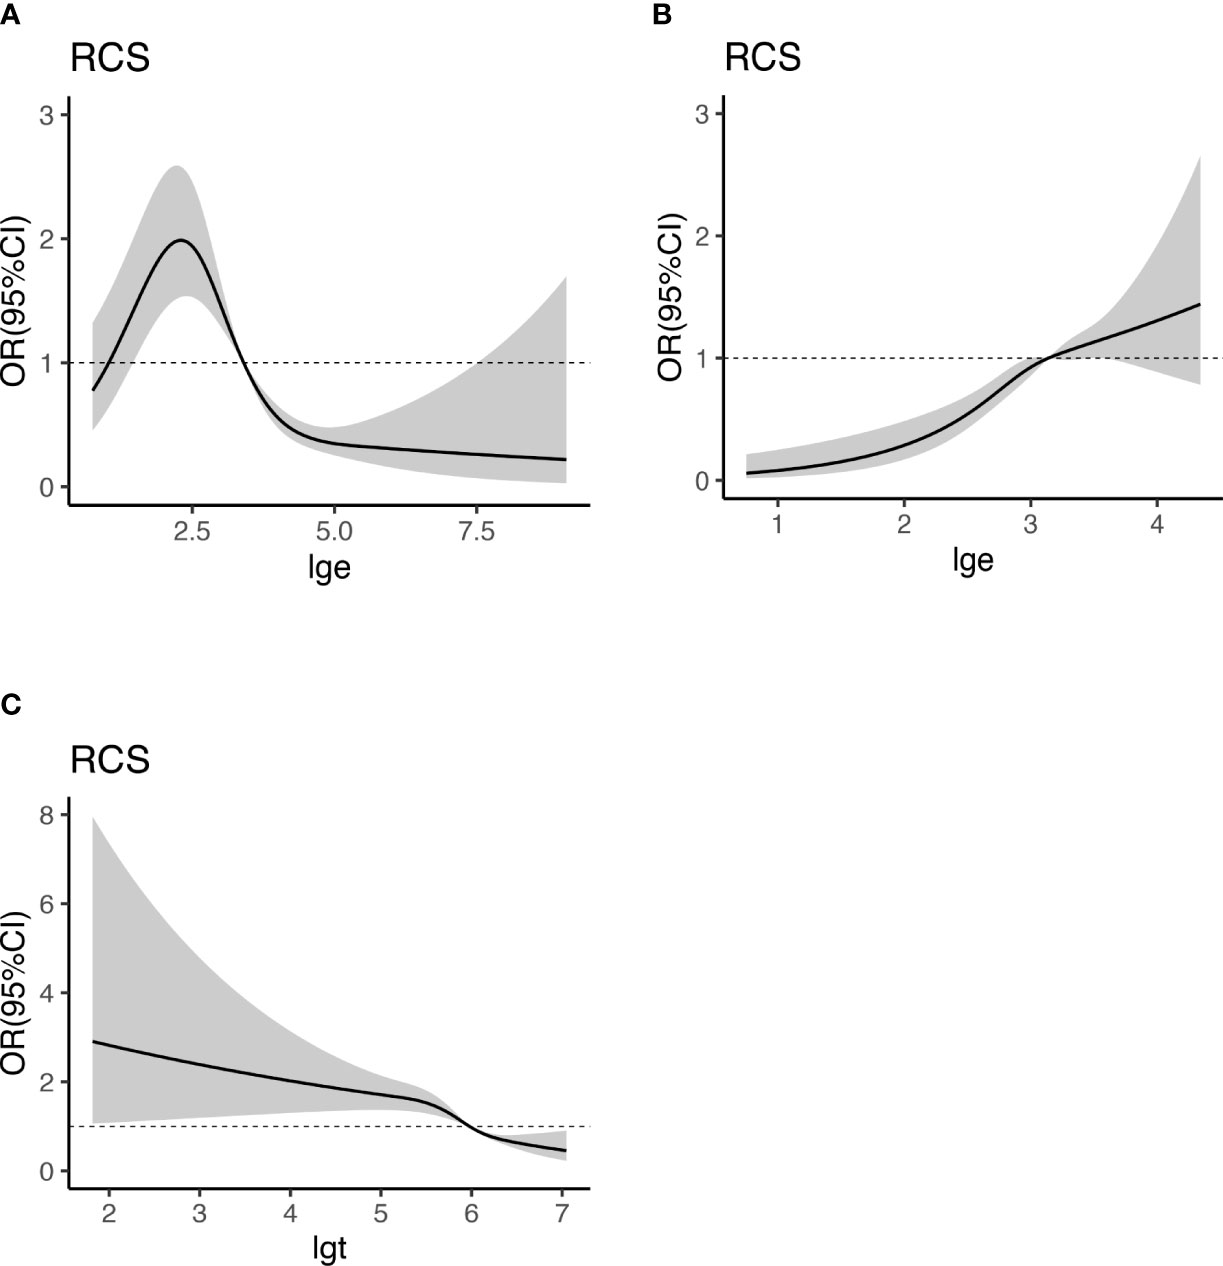
Figure 4 Dose-response relationship between E2, T, and HUA. RCS analysis shows a dose-response relationship between HUA and E2 in female (A), E2 in male (B), and T in male (C). OR were adjusted for age, BMI, WC, HT, DM, MS, CKD, CVD, HLP and eth, PA, alcohol drinking. E2, estradiol; UA, uric acid; BMI, body mass index; WC, waist circumference; T, testosterone; HUA, hyperuricemia; HT, hypertension; CKD, chronic kidney disease; DM, diabetes mellitus; HLP, hyperlipidemia; MS, metabolic syndrome; CVD, cardiovascular disease; eth, ethnic; PA, physical activities; lge, logarithms of E2; lgt, logarithms of T.
Discussion
In this study, the prevalence of HUA in male and female participants was 15.13% and 22.30%, respectively, which was consistent with previous reports. After adjusting for confounding factors, the results of multivariable regression analysis confirmed that E2 and T were independently associated with HUA in male participants, but in female participants, only E2 was independently associated with HUA. RCS analysis showed that, in female participants, E2 had a nonlinear dose-response relationship with HUA, in male participants, E2 had a linear dose-response relationship with HUA, while the T had a nonlinear dose-response relationship with HUA. Yutang Wang’s study found that E2 is positively correlated with serum uric acid in male participants (β=0.079, P<0.001) and negatively correlated with the uric acid level in female participants (β=-0.05, P=0.002) (13). Other scholars (14, 15) conducted subgroup analyses and found that the relationship between E2, T, and HUA disappeared in postmenopausal women and men over 65. The above results were consistent with the results of this study. In addition, the relationship between sex hormones and HUA was also not apparent in patients combined with DM, CKD, MS, and CVD. It can be seen that the above diseases may affect serum uric acid levels and thus conceal the effect of sex hormones on uric acid, which confirms the research results of above scholars to some extent (22, 23).
The intersection of the dotted line and RCS curve in Figure 4 (OR=1) was set as the critical point. It was considered that, in female participants, E2 greater than 29.6pg/mL (lge = 3.38) was a protective factor for HUA and that lower than 29.6pg/mL was a risk factor. In male participants, E2 higher than 23.6pg/mL(lge=3.16) was a risk factor for HUA, while E2 lower than 23.6pg/mL ((lge=3.16) was not independently associated with HUA. T was a protective factor for HUA when it was higher than 389.1ng/dL (lgt=5.96) in men, whereas it was a risk factor for HUA. This provides a reference for the prevention and hormone supplement therapy of HUA.
The Endocrine Society of America (24) recommends hormone supplementation for symptomatic postmenopausal women, and women within 10 years of menopause or younger than 60 are most likely to benefit from treatment (25). A Chinese study (26) investigated 424 perimenopause women aged 45-55 in sever major cities. The results showed that the average estradiol level of premenopausal women was 67.30pg/ml, and the estrogen level decreased to 35.14pg/ml within one year of menopause. Five years after menopause, woman’s estradiol level drops to 21.25pg/ml. Symptoms of menopausal syndrome include vasomotor symptoms, genitourinary, cardiovascular, osteoarticular and autonomic nervous systems and nervous system symptoms (27, 28). Cheng Fangping’s study (26) showed that the severity of menopausal symptoms gradually increased in the first two years of menopause, alleviated in the first two to five years of menopause, but increased again after five years of menopause. The Owens study (29) of 521 women aged 42 to 50, followed for 4 years, found that menopausal symptoms gradually worsened after 1 year of menopause. Our cut-off value was 29.6pg/ml, which was approximately equivalent to the estradiol level about 1 year after menopause. The risk of HUA increases gradually as E2 less than 29.6pg/ml. This cut-off point was similar to above thresholds According to our results, we suggested doctor should monitor the E2 level and make it reach more than 29.6 pg/mL during hormone replacement therapy, thereby reducing the risk of HUA. We also have reason to speculate when E2 levels are above 29.6 pg/mL, it can better prevent osteoporosis, improve lipid metabolism, prevent cardiovascular and cerebrovascular diseases. Of course, this needs to be confirmed in subsequent studies.
The prevalence of low testosterone (total T<11.1nmol/L) in men over 60 is about 20% (30), and low T is associated with insulin resistance, hypertension, and CVD (31, 32). The Endocrine Society guidelines suggested that clinicians could prescribe testosterone supplementation therapy for men older than 65 after an explicit discussion of the risks and benefits (33), However, different associations disagree with the total testosterone threshold for supplementation therapy (34). Loss of libido and vigour start to appear when T falls below 15nmol/L (432ng/dL) and certainly below 12nmol/L (349ng/dL) when obesity also emerges. Depressive mood, lack of concentration and sleep disturbances occur at levels below 10 nmol/L (288ng/dL) (35). The cut-off point of this study was 389.1ng/dL. which was similar to the above value. Therefore, we recommend that T falls below 389.1ng/dL, attention should be paid to the occurrence of HUA, which was similar to the above cut-off point.
In actually, lower serum uric acid levels are not better. The antioxidant effect of uric acid is protective on the nervous system, intestinal tract, and kidney (36–38). Some researchers have demonstrated that low uric acid levels are associated with an increased risk of mortality in patients (39, 40). Therefore, decreased sex hormones levels and increased uric acid levels in the elderly may be a protective mechanism that needs further exploration in subsequent studies.
The data in this study came from an extensive sample sampling survey and were all weighted. The influence of confounding factors was adjusted twice in the statistical process, so the results were reliable. However, there were still some noted limitations. 1. The research data came from the NHANES database, in which part of the home interviews was conducted by questionnaire survey, and some participants may have poor compliance. 2. This study was retrospective, and although most potential confounding factors were adjusted in the multivariable analysis, other factors, such as dietary factors, may influence the results. 3. Normal levels of sex hormones fluctuate in cycles, so the measurement timing may affect the results.
Data availability statement
The raw data supporting the conclusions of this article will be made available by the authors, without undue reservation.
Author contributions
G-YL analyzed the data and wrote the paper. X-DQ and C-MM: participated in its design and coordination. F-ZY conceived of this study. All authors contributed to the article and approved the submitted version.
Funding
This study was supported by natural Science foundation of Hebei province (grant no. 20377708D). The funders had no role in the study design, data collection and analysis, decision to publish, or preparation of the manuscript.
Acknowledgments
The authors thank AiMi Academic Services (www.aimieditor.com) for the English language editing and review services. Thanks to Zhangjing (Shanghai Tongren Hospital) and his nhanesR package.
Conflict of interest
The authors declare that the research was conducted in the absence of any commercial or financial relationships that could be construed as a potential conflict of interest.
Publisher’s note
All claims expressed in this article are solely those of the authors and do not necessarily represent those of their affiliated organizations, or those of the publisher, the editors and the reviewers. Any product that may be evaluated in this article, or claim that may be made by its manufacturer, is not guaranteed or endorsed by the publisher.
References
1. Liu R, Han C, Wu D, Xia X, Gu J, Guan H, et al. Prevalence of hyperuricemia and gout in mainland China from 2000 to 2014: A systematic review and meta-analysis. BioMed Res Int (2015) 2015:762820. doi: 10.1155/2015/762820
2. Huang XB, Zhang WQ, Tang WW, Liu Y, Ning Y, Huang C, et al. Prevalence and associated factors of hyperuricemia among urban adults aged 35-79 years in southwestern China: a community-based cross-sectional study. Sci Rep (2020) 10(1):15683. doi: 10.1038/s41598-020-72780-3
3. Chen-Xu M, Yokose C, Rai SK, Pillinger MH, Choi HK. Contemporary prevalence of gout and hyperuricemia in the united states and decadal trends: The national health and nutrition examination survey, 2007-2016. Arthritis Rheumatol (2019) 71(6):991–9. doi: 10.1002/art.40807
4. Dehlin M, Jacobsson L, Roddy E. Global epidemiology of gout: prevalence, incidence, treatment patterns and risk factors. Nat Rev Rheumatol (2020) 16(7):380–90. doi: 10.1038/s41584-020-0441-1
5. Ford ES, Li C, Cook S, Choi HK. Serum concentrations of uric acid and the metabolic syndrome among US children and adolescents. Circulation (2007) 115(19):2526–32. doi: 10.1161/CIRCULATIONAHA.106.657627
6. Song P, Wang H, Xia W, Chang X, Wang M, An L. Prevalence and correlates of hyperuricemia in the middle-aged and older adults in China. Sci Rep (2018) 8(1):4314. doi: 10.1038/s41598-018-22570-9
7. Cheng Z, Zheng T, Zhang D, Yang J, Hu X, Yin C, et al. High-level uric acid in asymptomatic hyperuricemia could be an isolated risk factor of cardio-cerebrovascular diseases: A prospective cohort study. Nutr Metab Cardiovasc Dis (2021) 31(12):3415–25. doi: 10.1016/j.numecd.2021.08.043
8. Liu J, Tao L, Zhao Z, Mu Y, Zou D, Zhang J, et al. Two-year changes in hyperuricemia and risk of diabetes: A five-year prospective cohort study. J Diabetes Res (2018) 2018:6905720. doi: 10.1155/2018/6905720
9. Safiri S, Kolahi AA, Cross M, Carson-Chahhoud K, Hoy D, Almasi-Hashiani A, et al. Prevalence, incidence, and years lived with disability due to gout and its attributable risk factors for 195 countries and territories 1990-2017: A systematic analysis of the global burden of disease study 2017. Arthritis Rheumatol (2020) 72(11):1916–27. doi: 10.1002/art.41404
10. Yang HJ, Liu M, Kim MJ, Park S. The haplotype of SLC2A9_rs3733591, PKD2_rs2725220 and ABCG2_rs2231142 increases the hyperuricaemia risk and alcohol, chicken and processed meat intakes and smoking interact with its risk. Int J Food Sci Nutr (2021) 72(3):391–401. doi: 10.1080/09637486.2020.1807474
11. Qi D, Liu J, Wang C, Wang L, Zhang X, Lin Q, et al. Sex-specific differences in the prevalence of and risk factors for hyperuricemia among a low-income population in China: a cross-sectional study. Postgrad Med (2020) 132(6):559–67. doi: 10.1080/00325481.2020.1761133
12. Hak AE, Choi HK. Menopause, postmenopausal hormone use and serum uric acid levels in US women–the third national health and nutrition examination survey. Arthritis Res Ther (2008) 10(5):R116. doi: 10.1186/ar2519
13. Wang Y, Charchar FJ. Establishment of sex difference in circulating uric acid is associated with higher testosterone and lower sex hormone-binding globulin in adolescent boys. Sci Rep (2021) 11(1):17323. doi: 10.1038/s41598-021-96959-4
14. Wan H, Zhang K, Wang Y, Chen Y, Zhang W, Xia F, et al. The associations between gonadal hormones and serum uric acid levels in men and postmenopausal women with diabetes. Front Endocrinol (Lausanne) (2020) 11:55. doi: 10.3389/fendo.2020.00055
15. Han Y, Zhang Y, Cao Y, Yin Y, Han X, Di H, et al. Exploration of the association between serum uric acid and testosterone in adult males: NHANES 2011-2016. Transl Androl Urol (2021) 10(1):272–82. doi: 10.21037/tau-20-1114
16. Centers for Disease Control and Prevention. The national health and nutritional examination survey analytic and reporting guidelines. Available at: https://www.cdc.gov/nchs/ahcd/survey_methods.htm (Accessed February 6, 2019).
17. Centers for Disease Control and Prevention. National center for health statistics (NCHS). national health and nutrition examination survey laboratory protocol. sex steroid hormone-Serum(TST_H). Available at: https://wwwn.cdc.gov/nchs/data/nhanes/2013-2014/labmethods/TST_H_MET_Total_Estradiol_and_Total_Testosterone.pdf (Accessed 20 June 2020).
18. Grundy SM, Cleeman JI, Daniels SR, Donato KA, Eckel RH, Franklin BA, et al. Diagnosis and management of the metabolic syndrome: an American heart Association/National heart, lung, and blood institute scientific statement. Circulation (2005) 112(17):2735–52. doi: 10.1161/circulationaha.105.169404
19. Alberti KG, Eckel RH, Grundy SM, Zimmet PZ, Cleeman JI, Donato KA, et al. Harmonizing the metabolic syndrome: a joint interim statement of the international diabetes federation task force on epidemiology and prevention; national heart, lung, and blood institute; American heart association; world heart federation; international atherosclerosis society; and international association for the study of obesity. Circulation (2009) 120(16):1640–5. doi: 10.1161/CIRCULATIONAHA.109.192644
20. Kidney Disease: Improving Global Outcomes Glomerular Diseases Work G. KDIGO 2021 clinical practice guideline for the management of glomerular diseases. Kidney Int (2021) 100(4S):S1–S276. doi: 10.1016/j.kint.2021.05.021
21. Delgado C, Baweja M, Crews DC, Eneanya ND, Gadegbeku CA, Inker LA, et al. A unifying approach for GFR estimation: Recommendations of the NKF-ASN task force on reassessing the inclusion of race in diagnosing kidney disease. J Am Soc Nephrol (2021) 32(12):2994–3015. doi: 10.1681/asn.2021070988
22. Techatraisak K, Kongkaew T. The association of hyperuricemia and metabolic syndrome in Thai postmenopausal women. Climacteric (2017) 20(6):552–7. doi: 10.1080/13697137.2017.1369513
23. Robinson PC. Gout - an update of aetiology, genetics, co-morbidities and management. Maturitas (2018) 118:67–73. doi: 10.1016/j.maturitas.2018.10.012
24. Cobin RH, Goodman NF. American Association of clinical endocrinologists and american college of endocrinology position statement on menopause-2017 update. Endocr Pract (2017) 23(7):869–80. doi: 10.4158/ep171828.Ps
25. Pinkerton JV. Hormone therapy for postmenopausal women. N Engl J Med (2020) 382(5):446–55. doi: 10.1056/NEJMcp1714787
26. Fangping Cheng XW, Zhang C, Yang H. Correlation analysis of endocrine hormone levels and menopausal symptoms in different menopausal states. Maternal Child Health Care China (2010) 25(30):4424–26. Available at: https://kns.cnki.net/kcms/detail/detail.aspx?dbcode=CJFD&dbname=CJFD2010&filename=ZFYB201030041&uniplatform=NZKPT&v=y3lLqW5crJPSZI8OxItp4C2gkXAp-tfoClPUaZwCFd-SyoEbbzhMHd6KqfxSmXKJ.
27. Hill DA, Crider M, Hill SR. Hormone therapy and other treatments for symptoms of menopause. Am Fam Physician (2016) 94(11):884–9. Available at: https://www.aafp.org/pubs/afp/issues/2016/1201/p884.html.
28. Rietjens I, Louisse J, Beekmann K. The potential health effects of dietary phytoestrogens. Br J Pharmacol (2017) 174(11):1263–80. doi: 10.1111/bph.13622
29. Jane F, Owens KAM. Sleep disturbance in healthy middle-aged women. Maturitas (1998) 30(1):41–50. doi: 10.1016/s0378-5122(98)00039-5
30. Harman SM, Metter EJ, Tobin JD, Pearson J, Blackman MR. Longitudinal effects of aging on serum total and free testosterone levels in healthy men. Baltimore longitudinal study of aging. J Clin Endocrinol Metab (2001) 86(2):724–31. doi: 10.1210/jcem.86.2.7219
31. Ottarsdottir K, Nilsson AG, Hellgren M, Lindblad U, Daka B. The association between serum testosterone and insulin resistance: a longitudinal study. Endocr Connect (2018) 7(12):1491–500. doi: 10.1530/EC-18-0480
32. Qu M, Feng C, Wang X, Gu Y, Shang X, Zhou Y, et al. Association of serum testosterone and luteinizing hormone with blood pressure and risk of cardiovascular disease in middle-aged and elderly men. J Am Heart Assoc (2021) 10(7):e019559. doi: 10.1161/JAHA.120.019559
33. Bhasin S, Brito JP, Cunningham GR, Hayes FJ, Hodis HN, Matsumoto AM, et al. Testosterone therapy in men with hypogonadism: An endocrine society clinical practice guideline. J Clin Endocrinol Metab (2018) 103(5):1715–44. doi: 10.1210/jc.2018-00229
34. Qaseem A, Horwitch CA, Vijan S, Etxeandia-Ikobaltzeta I, Kansagara D, Forciea MA, et al. Testosterone treatment in adult men with age-related low testosterone: A clinical guideline from the American college of physicians. Ann Intern Med (2020) 172(2):126–33. doi: 10.7326/m19-0882
35. Zitzmann M, Faber S, Nieschlag E. Association of specific symptoms and metabolic risks with serum testosterone in older men. J Clin Endocrinol Metab (2006) 91(11):4335–43. doi: 10.1210/jc.2006-0401
36. Domínguez-Zambrano E, Pedraza-Chaverri J, López-Santos AL, Medina-Campos ON, Cruz-Rivera C, Bueno-Hernández F, et al. Association between serum uric acid levels, nutritional and antioxidant status in patients on hemodialysis. Nutrients (2020) 12(9). doi: 10.3390/nu12092600
37. Cutler RG, Camandola S, Feldman NH, Yoon JS, Haran JB, Arguelles S, et al. Uric acid enhances longevity and endurance and protects the brain against ischemia. Neurobiol Aging (2019) 75:159–68. doi: 10.1016/j.neurobiolaging.2018.10.031
38. Wada A, Higashiyama M, Kurihara C, Ito S, Tanemoto R, Mizoguchi A, et al. Protective effect of luminal uric acid against indomethacin-induced enteropathy: Role of antioxidant effect and gut microbiota. Dig Dis Sci (2022) 67(1):121–33. doi: 10.1007/s10620-021-06848-z
39. Zhang J, Lu X, Li H, Wang S. Serum uric acid and mortality in patients with chronic kidney disease: A systematic review and meta-analysis. Blood Purif (2021) 50(6):758–66. doi: 10.1159/000513944
40. You H, Chen K, Han P, Yue C, Zhao X. U-Shaped relationship between cardiovascular mortality and serum uric acid may be attributed to stroke- and heart-specific mortality, respectively, among hypertensive patients: A nationally representative cohort study. Med Sci Monit (2021) 27:e928937. doi: 10.12659/msm.928937
Keywords: hyperuricemia, estradiol, testosterone, NHANES, dose-response
Citation: Li G-y, Qian X-d, Ma C-m and Yin F-z (2022) The dose-response relationship between sex hormones and hyperuricemia in different gender: NHANES 2013-2016. Front. Endocrinol. 13:1035114. doi: 10.3389/fendo.2022.1035114
Received: 02 September 2022; Accepted: 19 October 2022;
Published: 01 November 2022.
Edited by:
Rodrig Marculescu, Medical University of Vienna, AustriaReviewed by:
Thomas Waldhoer, Medical University of Vienna, AustriaMaria Wakolbinger, Medical University of Vienna, Austria
Hongbin Qiu, Jiamusi University, China
Copyright © 2022 Li, Qian, Ma and Yin. This is an open-access article distributed under the terms of the Creative Commons Attribution License (CC BY). The use, distribution or reproduction in other forums is permitted, provided the original author(s) and the copyright owner(s) are credited and that the original publication in this journal is cited, in accordance with accepted academic practice. No use, distribution or reproduction is permitted which does not comply with these terms.
*Correspondence: Fu-zai Yin, eWluZnV6YWk2MkAxNjMuY29t