
94% of researchers rate our articles as excellent or good
Learn more about the work of our research integrity team to safeguard the quality of each article we publish.
Find out more
ORIGINAL RESEARCH article
Front. Endocrinol., 11 January 2023
Sec. Bone Research
Volume 13 - 2022 | https://doi.org/10.3389/fendo.2022.1016321
This article is part of the Research TopicQuantitative Bone Imaging MethodsView all 9 articles
 S. Oliviero1,2,3
 E. Millard1Z. Chen2
 A. Rayson2B.C. Roberts1,2
 H.M.S. Ismail4,5
 I. Bellantuono2,5
 E. Dall’Ara1,2,5*
Osteoarthritis (OA) is one of the most common musculoskeletal diseases. OA is characterized by degeneration of the articular cartilage as well as the underlying subchondral bone. Post-traumatic osteoarthritis (PTOA) is a subset of OA caused by mechanical trauma. Mouse models, such as destabilization of the medial meniscus (DMM), are useful to study PTOA. Ex vivo micro-Computed Tomography (microCT) imaging is the predominant technique used to scan the mouse knee in OA studies. Nevertheless, in vivo microCT enables the longitudinal assessment of bone microstructure, reducing measurement variability and number of animals required. The effect of image resolution in measuring subchondral bone parameters was previously evaluated only for a limited number of parameters. The aim of this study was to evaluate the ability of in vivo microCT imaging in measuring the microstructural properties of the mouse tibia trabecular and cortical subchondral bone, with respect to ex vivo high resolution imaging, in a DMM model of PTOA. Sixteen male C57BL/6J mice received DMM surgery or sham operation at 14 weeks of age (N=8 per group). The right knee of each mouse was microCT scanned in vivo (10.4μm voxel size) and ex vivo (4.35μm voxel size) at the age of 26 weeks. Each image was aligned to a reference image using rigid registration. The subchondral cortical bone plate thickness was measured at the lateral and medial condyles. Standard morphometric parameters were measured in the subchondral trabecular bone. In vivo microCT imaging led to significant underestimation of bone volume fraction (-14%), bone surface density (-3%) and trabecular number (-16%), whereas trabecular thickness (+3%) and separation (+5%) were significantly overestimated. Nevertheless, most trabecular parameters measured in vivo were well correlated with ex vivo measurements (R2 = 0.69-0.81). Degree of anisotropy, structure model index and connectivity density were measured in vivo with lower accuracy. Excellent accuracy was found for cortical thickness measurements. In conclusion, this study identified what bone morphological parameters can be reliably measured by in vivo microCT imaging of the subchondral bone in the mouse tibia. It highlights that this approach can be used to study longitudinal effects of diseases and treatments on the subchondral cortical bone and on most subchondral trabecular bone parameters, but systematic over- or under-estimations should be considered when interpreting the results.
Osteoarthritis (OA) is one of the most common musculoskeletal diseases, affecting more than 240 million people worldwide (1). OA is characterized by degeneration and thinning of the articular cartilage, joint inflammation, alterations of the underlying subchondral bone and formation of osteophytes, causing joint pain and reduced mobility (1). Post-traumatic osteoarthritis (PTOA) is a subset of OA caused by mechanical trauma, such as rupture of the anterior cruciate ligament and meniscal tears (2).
Mouse models of spontaneous or surgically-induced OA are important to investigate the disease mechanisms with rapid and relatively low cost studies (3). Different types of models have been developed, that include chemically-induced cartilage degeneration, surgical models and genetic models (3). Among those, surgical models are those most used to investigate PTOA as they mimic clinical injuries, e.g. transection of the anterior cruciate ligament, meniscectomy and destabilization of the medial meniscus (DMM). In these studies, it is important to accurately measure subchondral bone parameters, which are considered important targets for evaluating the disease progression and the efficacy of drugs and interventions.
The gold standard for measuring bone parameters in mouse models is micro-Computed Tomography (microCT) imaging (4). Ex vivo microCT is the predominant technique used to scan the mouse knee in OA studies (2, 5–10). However, in a cross-sectional design disease progression can only be evaluated by using multiple groups of mice sacrificed at different time points. In vivo microCT enables the longitudinal assessment of the joint of the same mouse over time, reducing the measurement variability and the number of animals required for the experiments (11), in line with the principles of the 3Rs (replacement, refinement and reduction of the usage of animals in research). However, to the authors’ knowledge, only three previous studies applied in vivo imaging for the characterization of subchondral bone in OA mice (12–14). This is probably because in vivo microCT is characterized by lower resolution and signal-to-noise ratio, due to the need of reducing scanning time and radiation exposure to the animal, which may impair the reliability and reproducibility of the measurements (15, 16). However, in the above-mentioned studies the accuracy in measuring the morphometric bone parameters was not reported for the applied scanning procedures, and very limited information about radiation effects were reported only in one of the studies [non-significant reduction in proximal tibia bone volume fraction (12)].
In order to increase the uptake of in vivo microCT imaging, reducing the group measurement variability by normalizing for baseline measurements, and decreasing the number of mice used in this research area, it is important to assess its accuracy in measuring subchondral bone morphological properties against the gold standard ex vivo microCT approach which allows to scan at higher resolution. The effect of image resolution in measuring subchondral bone parameters has been evaluated in a previous study for 10-week-old male C57BL/6 mice (N=5; no DMM surgery) (5). In particular, ex vivo images (5μm voxel size) were used as reference to assess the measurement accuracy in images acquired using an in vivo scanning procedure (10μm voxel size). Nevertheless, only a limited number of parameters (trabecular and cortical bone volume, subchondral plate thickness and trabecular BV/TV) were assessed in this study. Moreover, while good to weak correlations were found for some parameters of the subchondral bone measured with the two procedures (0.66<R2<0.88), surprisingly no correlation was found for trabecular bone volume in the medial and lateral compartments and for the bone volume fraction in the lateral compartment. It should be noted that this assessment depends dramatically on the quality of the images acquired in vivo, which depends on the used scanning parameters. In another study the accuracy of in vivo-microCT-based morphometric parameters measured in the L5 vertebra of C57BL/6N mice has been reported (17). The effect of the voxel size (from 6 to 30 μm) and segmentation method on trabecular morphometric parameters led to differences of up to 126% for measurements of trabecular thickness compared to high resolution images. Finally, in a previous study from our group, an optimal in vivo microCT scanning procedure was developed for imaging the whole mouse tibia, in order to minimize the effect of ionizing radiation on the bone remodelling (18) and maximizing the accuracy of the assessment of morphometric and densitometric parameters (19). Nevertheless, this assessment was performed only on the metaphyseal trabecular bone and it remains to be investigated what is the accuracy of in vivo microCT imaging to assess the tibia subchondral bone.
The aim of this study was to evaluate the ability of in vivo microCT imaging in measuring the microstructural properties of the mouse proximal tibia trabecular and cortical subchondral bone, with respect to ex vivo high-resolution imaging, in a DMM model of PTOA.
Sixteen 14-weeks-old C57BL/6 (BL6) male mice were purchased from Charles River UK Ltd., Margate, UK. They were housed at the University of Sheffield’s Biological Services Unit with a twelve-hour light/dark cycle at 22°C and free access to food and water. All procedures were performed under a British Home Office project license and in compliance with the UK Animals (Scientific Procedures) Act 1986. This study was reviewed and approved by the local Research Ethics Committee of the University of Sheffield (Sheffield, UK). At 14-weeks-old DMM surgery was performed on the right knee joints for eight of the 16 mice. SHAM-operation (SHAM) on the right knee joint was performed on the remaining mice (n=8). At 26-weeks-old, mice were culled, and the legs were dissected from the body.
In this study, in vivo and ex vivo microCT scans of the right knee for DMM and SHAM operated mice, were compared. The ex vivo microCT images were used as a gold standard to quantify the measurement uncertainties from the lower resolution in vivo microCT images.
A baseline scan of the right knee of each mouse before surgeries was performed at weeks 14 of age with in vivo microCT (VivaCT 80, Scanco Medical, Bruettisellen, Switzerland). The scanning parameters and the image processing procedure were optimized in previous studies to have a reproducible measurement yet minimizing the effect of the radiation dose on bone adaptation (18, 19). The following scanning parameters were used: 55 kVp, 145µA, 10.4 µm voxel size, 100 ms integration time, 32 mm field of view, 750 projections/180°, no frame averaging, 0.5 mm Al beam hardening filter. Afterwards, the right knee of each mouse was scanned with the same parameters at week 18, 22, and 26 of age. Each image was reconstructed using the software provided by the manufacturer using a polynomial beam hardening correction function based on the scans of a wedge phantom with 1200 mg HA/cc density, as recommended by (20).
At week 26 of age each mouse was culled and the right knee was imaged with ex vivo microCT (SkyScan 1172, Bruker, Belgium; 49 kV, 179 µA, 4.35 µm voxel size, 1180 ms exposure time, 180° rotation, 0.7° rotation step, frame averaging x2, 0.5 mm A1 filter) (19). Each ex vivo microCT image was reconstructed by using the software provided by the manufacturer (NRecon, Bruker; ring artifacts reduction factor 10, dynamic range 0–0.13) (19).
Scans of the right proximal tibia acquired at week 26 of age ex vivo and in vivo were compared in this study. Three-dimensional morphometric analyses were performed on ex vivo and in vivo microCT images of the proximal tibia after alignment. The femur, fibula and menisci were removed from each image (Figure 1) by applying a connectivity filter (connectivity rule = 6, bwlabeln function, MATLAB). Disconnections between adjacent bones were created manually where necessary. The in vivo microCT image of one tibia (age of 26 weeks) was randomly chosen and used as a reference. The reference tibia was rotated (Amira 6.3.0, FEI Visualization Sciences Group, France) in order to approximately align its longitudinal axis with the Z-axis of a global reference system. Rigid image registration was then applied to align the other images to the same reference system by using Normalized Mutual Information as optimization criterion and Lanczos interpolation for resampling (19, 21).
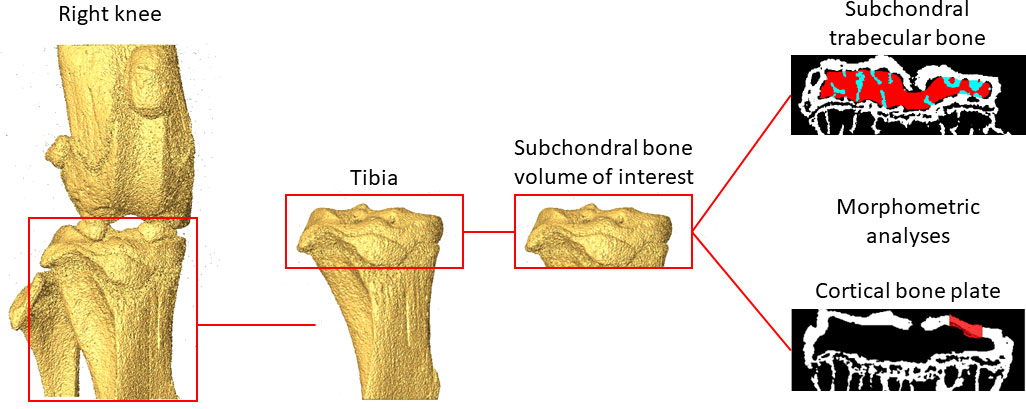
Figure 1 Example of the analysed regions of interest in the subchondral trabecular bone and cortical bone plate.
A Gaussian filtration (convolution kernel [3x3x3], standard deviation = 0.65, smooth3 function, MATLAB) was applied to reduce the high-frequency noise. Bone voxels were defined using a global threshold (MATLAB), which was calculated as the average of the grey levels corresponding to the bone and background peaks in each image histogram (19, 21). This approach was used to avoid operator-dependent selection of the threshold value and was found to be optimal from previous studies performed on the mouse tibia metaphysis [Supplementary material of (19)].
Binary datasets were imported in CTAn (Bruker, Belgium) for 3D morphometric analyses.
Trabecular bone regions of interest (ROIs) were identified by manually contouring the trabecular bone between the subchondral plate and growth plate in 2D cross-sections (Figure 1), from the in vivo microCT images every 5 slices. In order to match the analysed volumes, the same ROIs identified from the in vivo microCT images were used to analyze the morphometric properties of the subchondral trabecular bone in the ex vivo images. Two additional ROIs were generated for each image by dividing the trabecular ROI into medial and lateral compartments. Trabecular analyses were performed for the whole subchondral trabecular bone, for the medial compartment and for the lateral compartment. A despeckling filter was applied to remove the isolated bone regions with volume lower than 10 voxels. The following parameters were evaluated: trabecular bone volume fraction (BV/TV), trabecular thickness (Tb.Th), trabecular separation (Tb.Sp), trabecular number (Tb.N), bone surface density (BS/BV), degree of anisotropy (DA), structure model index (SMI) and connectivity density (Conn.D) (4).
For the cortical subchondral plate analysis, two ROIs were identified, one in the medial and one in the lateral portions of the tibia plateau, after removing the underlying trabecular bone (Figure 1). Each ROI, centered in each condyle, was identified with the same size (500 µm x 500 µm) and same spatial position for all images. Pores within the subchondral bone plate were removed by applying a closing operation in 2D (kernel = round, radius = 10 pixels). The subchondral bone cortical plate thickness (Ct.Th) was calculated for the medial (Ct.Th.Med.) and the lateral (Ct.Th.Lat.) ROIs (4).
Statistical analysis was performed in MATLAB (R2020a, MathWorks, USA). Paired T-tests (ttest function) were used to evaluate the differences between in vivo imaging resolution (10.4 µm voxel size) and ex vivo imaging resolution (4.35 µm voxel size). Differences were considered statistically significant when p-value was < 0.05. Linear regression analyses and Bland-Altman plots were used to assess the agreement between the morphometric properties measured from the in vivo or the ex vivo microCT images, for both pooled data (including both DMM and SHAM groups) or for separate groups. For each statistically significant relationship the coefficient of determination (R2) and the regression equation have been reported. For each parameter, normality of the differences between ex vivo and in vivo measurements was tested using the Lilliefors test (lillietest function, MATLAB).
The effect of DMM on the morphometric properties was evaluated both from ex vivo and in vivo microCT images. The differences between the DMM and SHAM mice were compared with two-tails T-tests (ttest2 function, MATLAB).
Examples of microCT images acquired in vivo and ex vivo are reported in Figure 2 for both SHAM and DMM groups. The descriptive statistics for the different microstructural properties calculated from the in vivo and ex vivo microCT scans are reported in Table 1. Regression analyses for each morphometric parameter are reported in Figures 3–5, while Bland-Altman plots are shown in Figure 6.
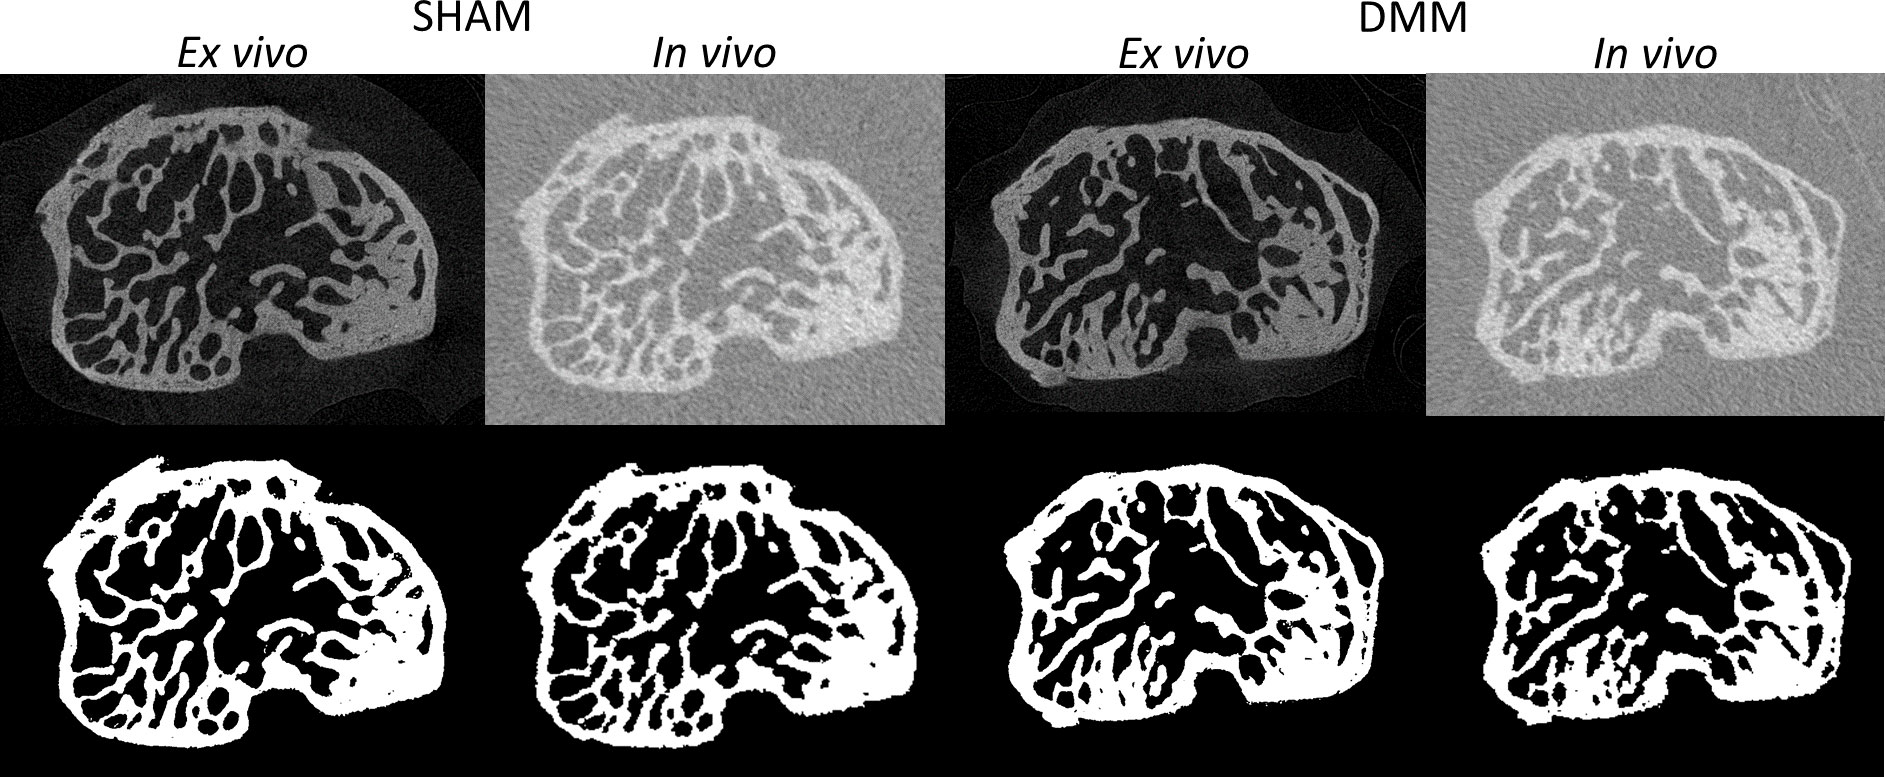
Figure 2 Examples of microCT cross-sections acquired in vivo and ex vivo (top), for a mouse in the SHAM group (left) and a mouse in the DMM group (right). Binary images after image segmentation are reported below each image.
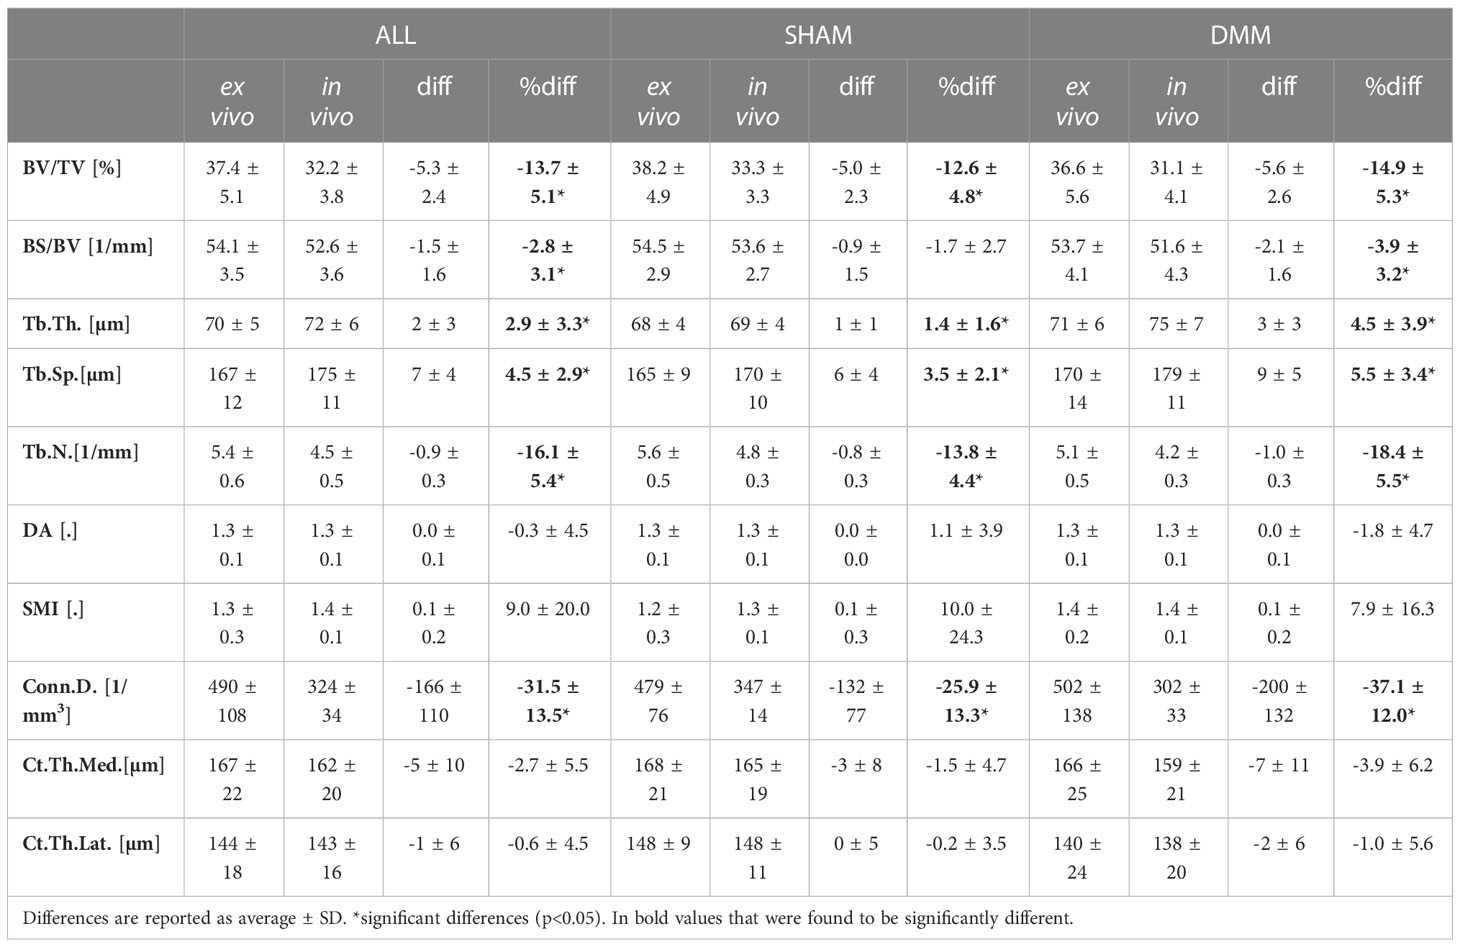
Table 1 Morphometric parameters measured with in vivo and ex vivo microCT for the pooled (ALL) data and for each group (SHAM or DMM).
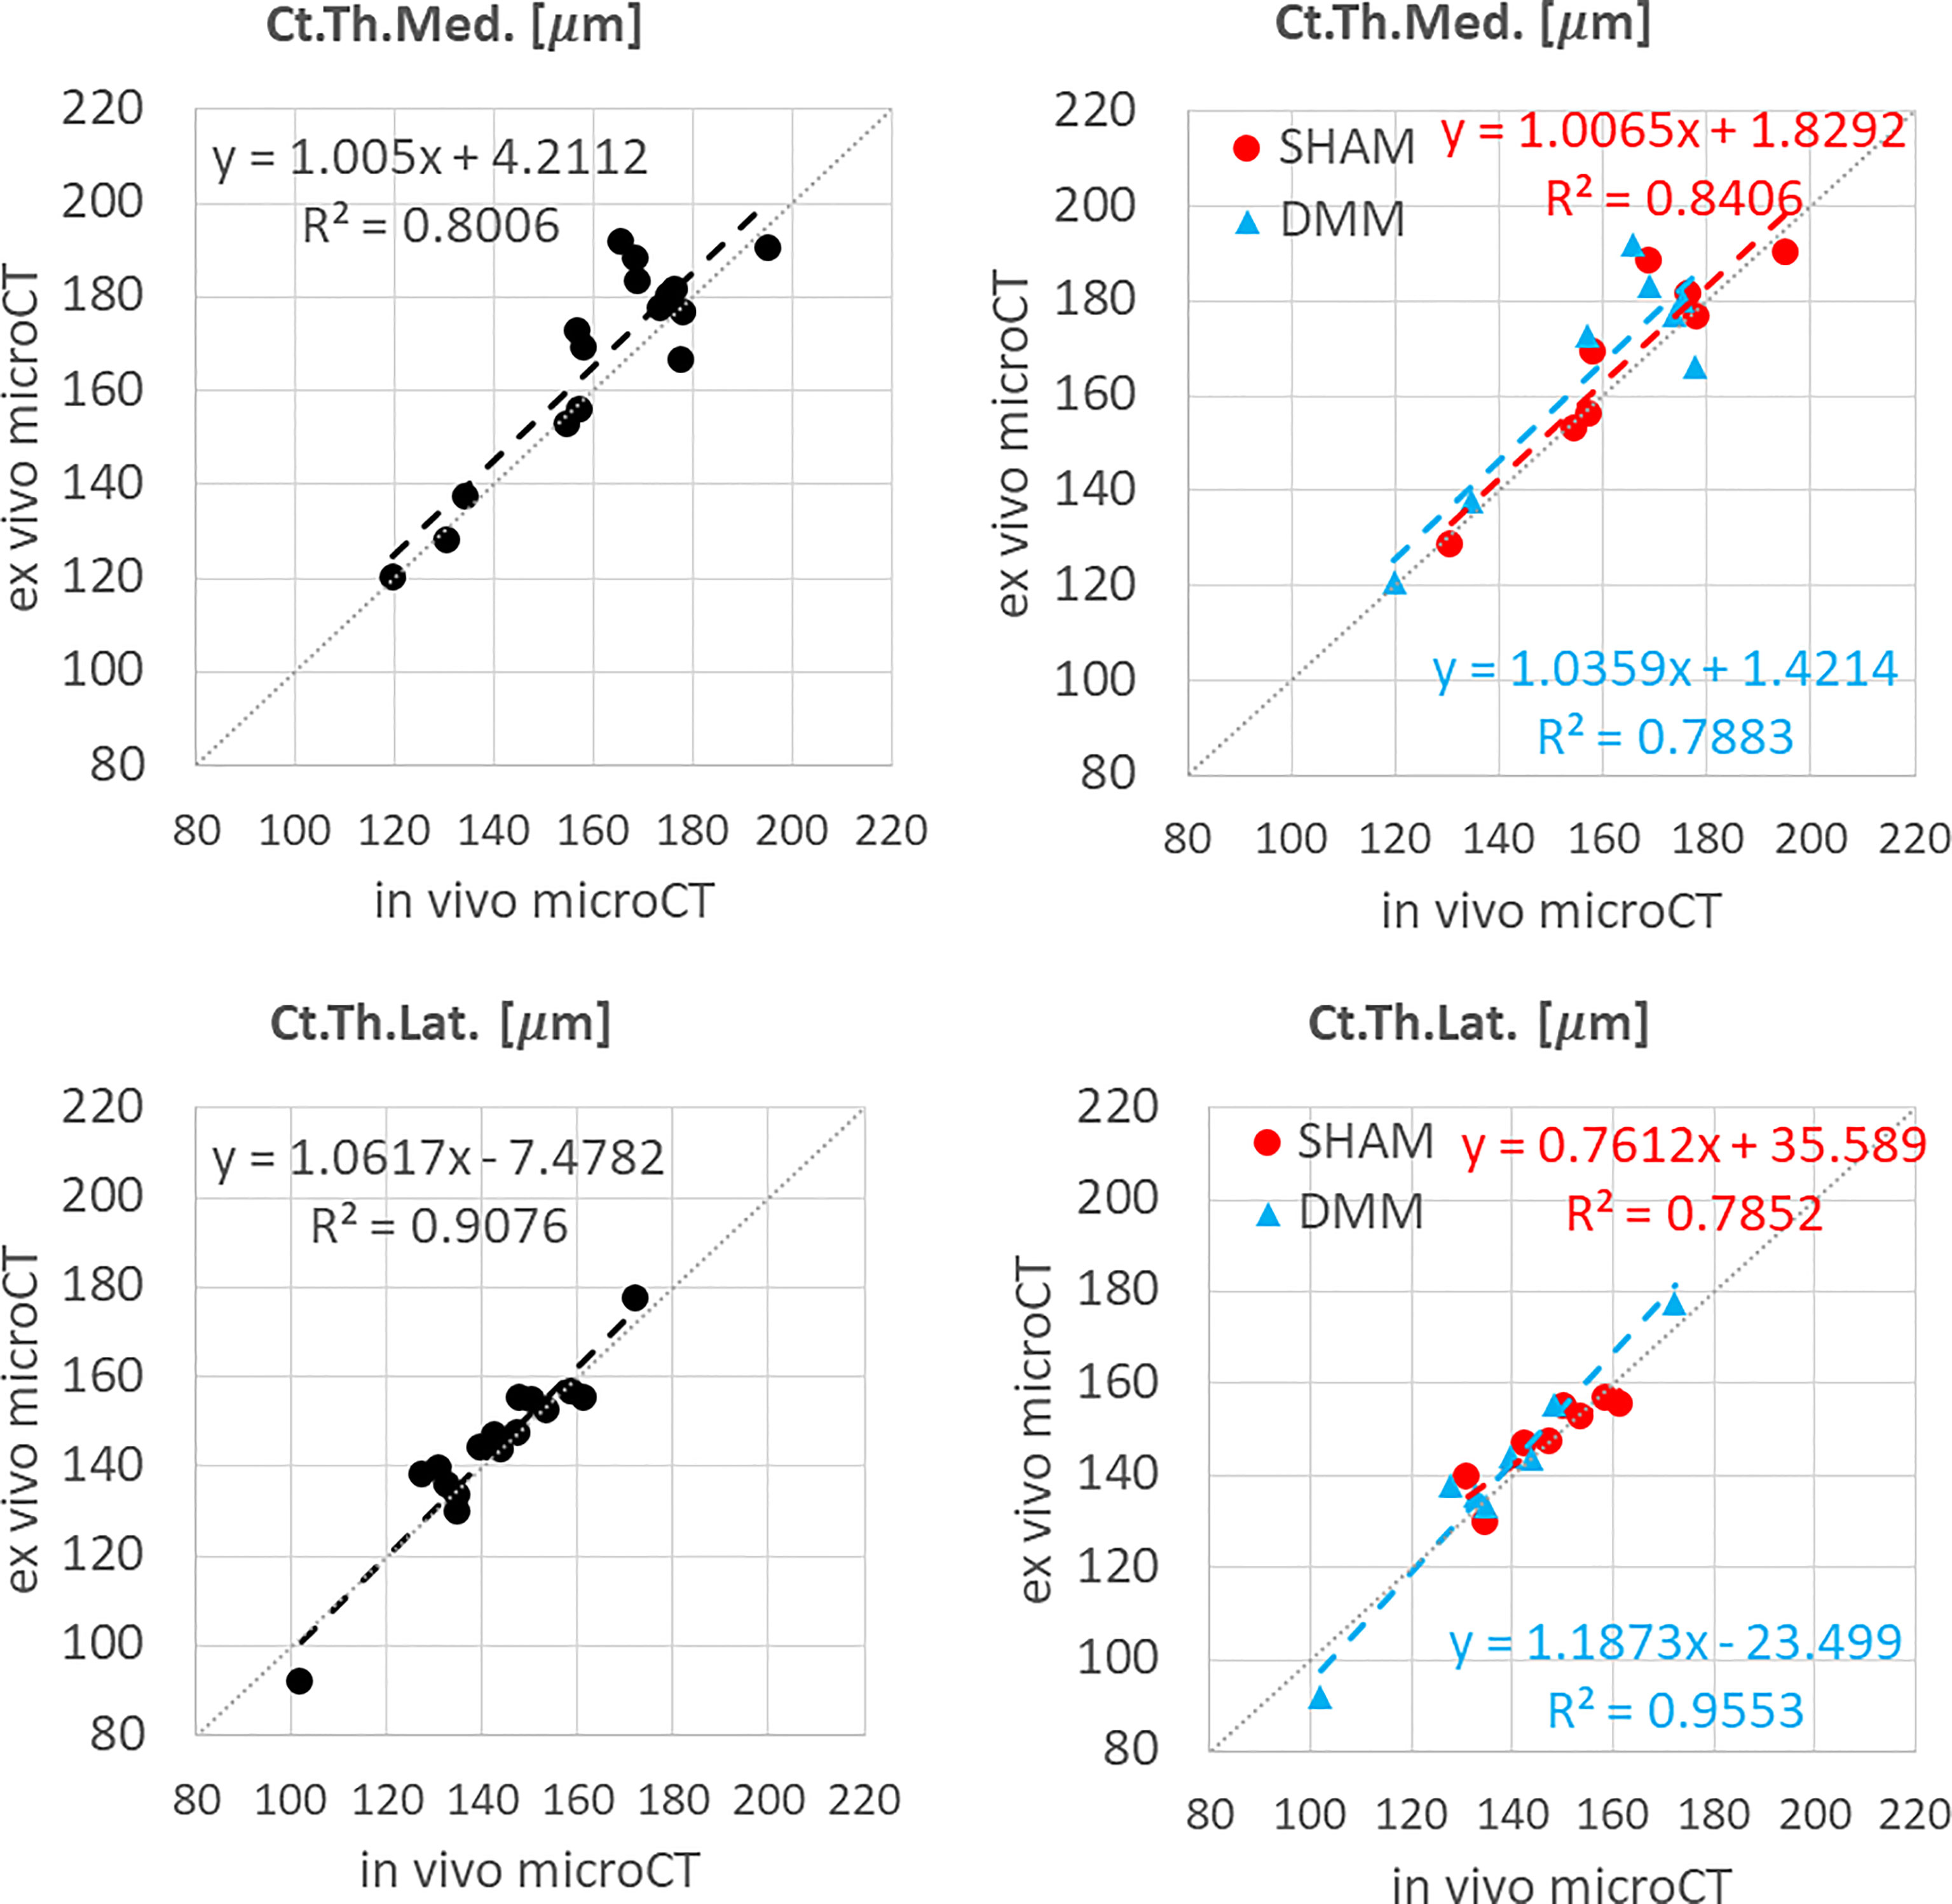
Figure 3 Regression analyses between in vivo and ex vivo measurements for cortical thickness (Ct.Th) at the medial and lateral side.
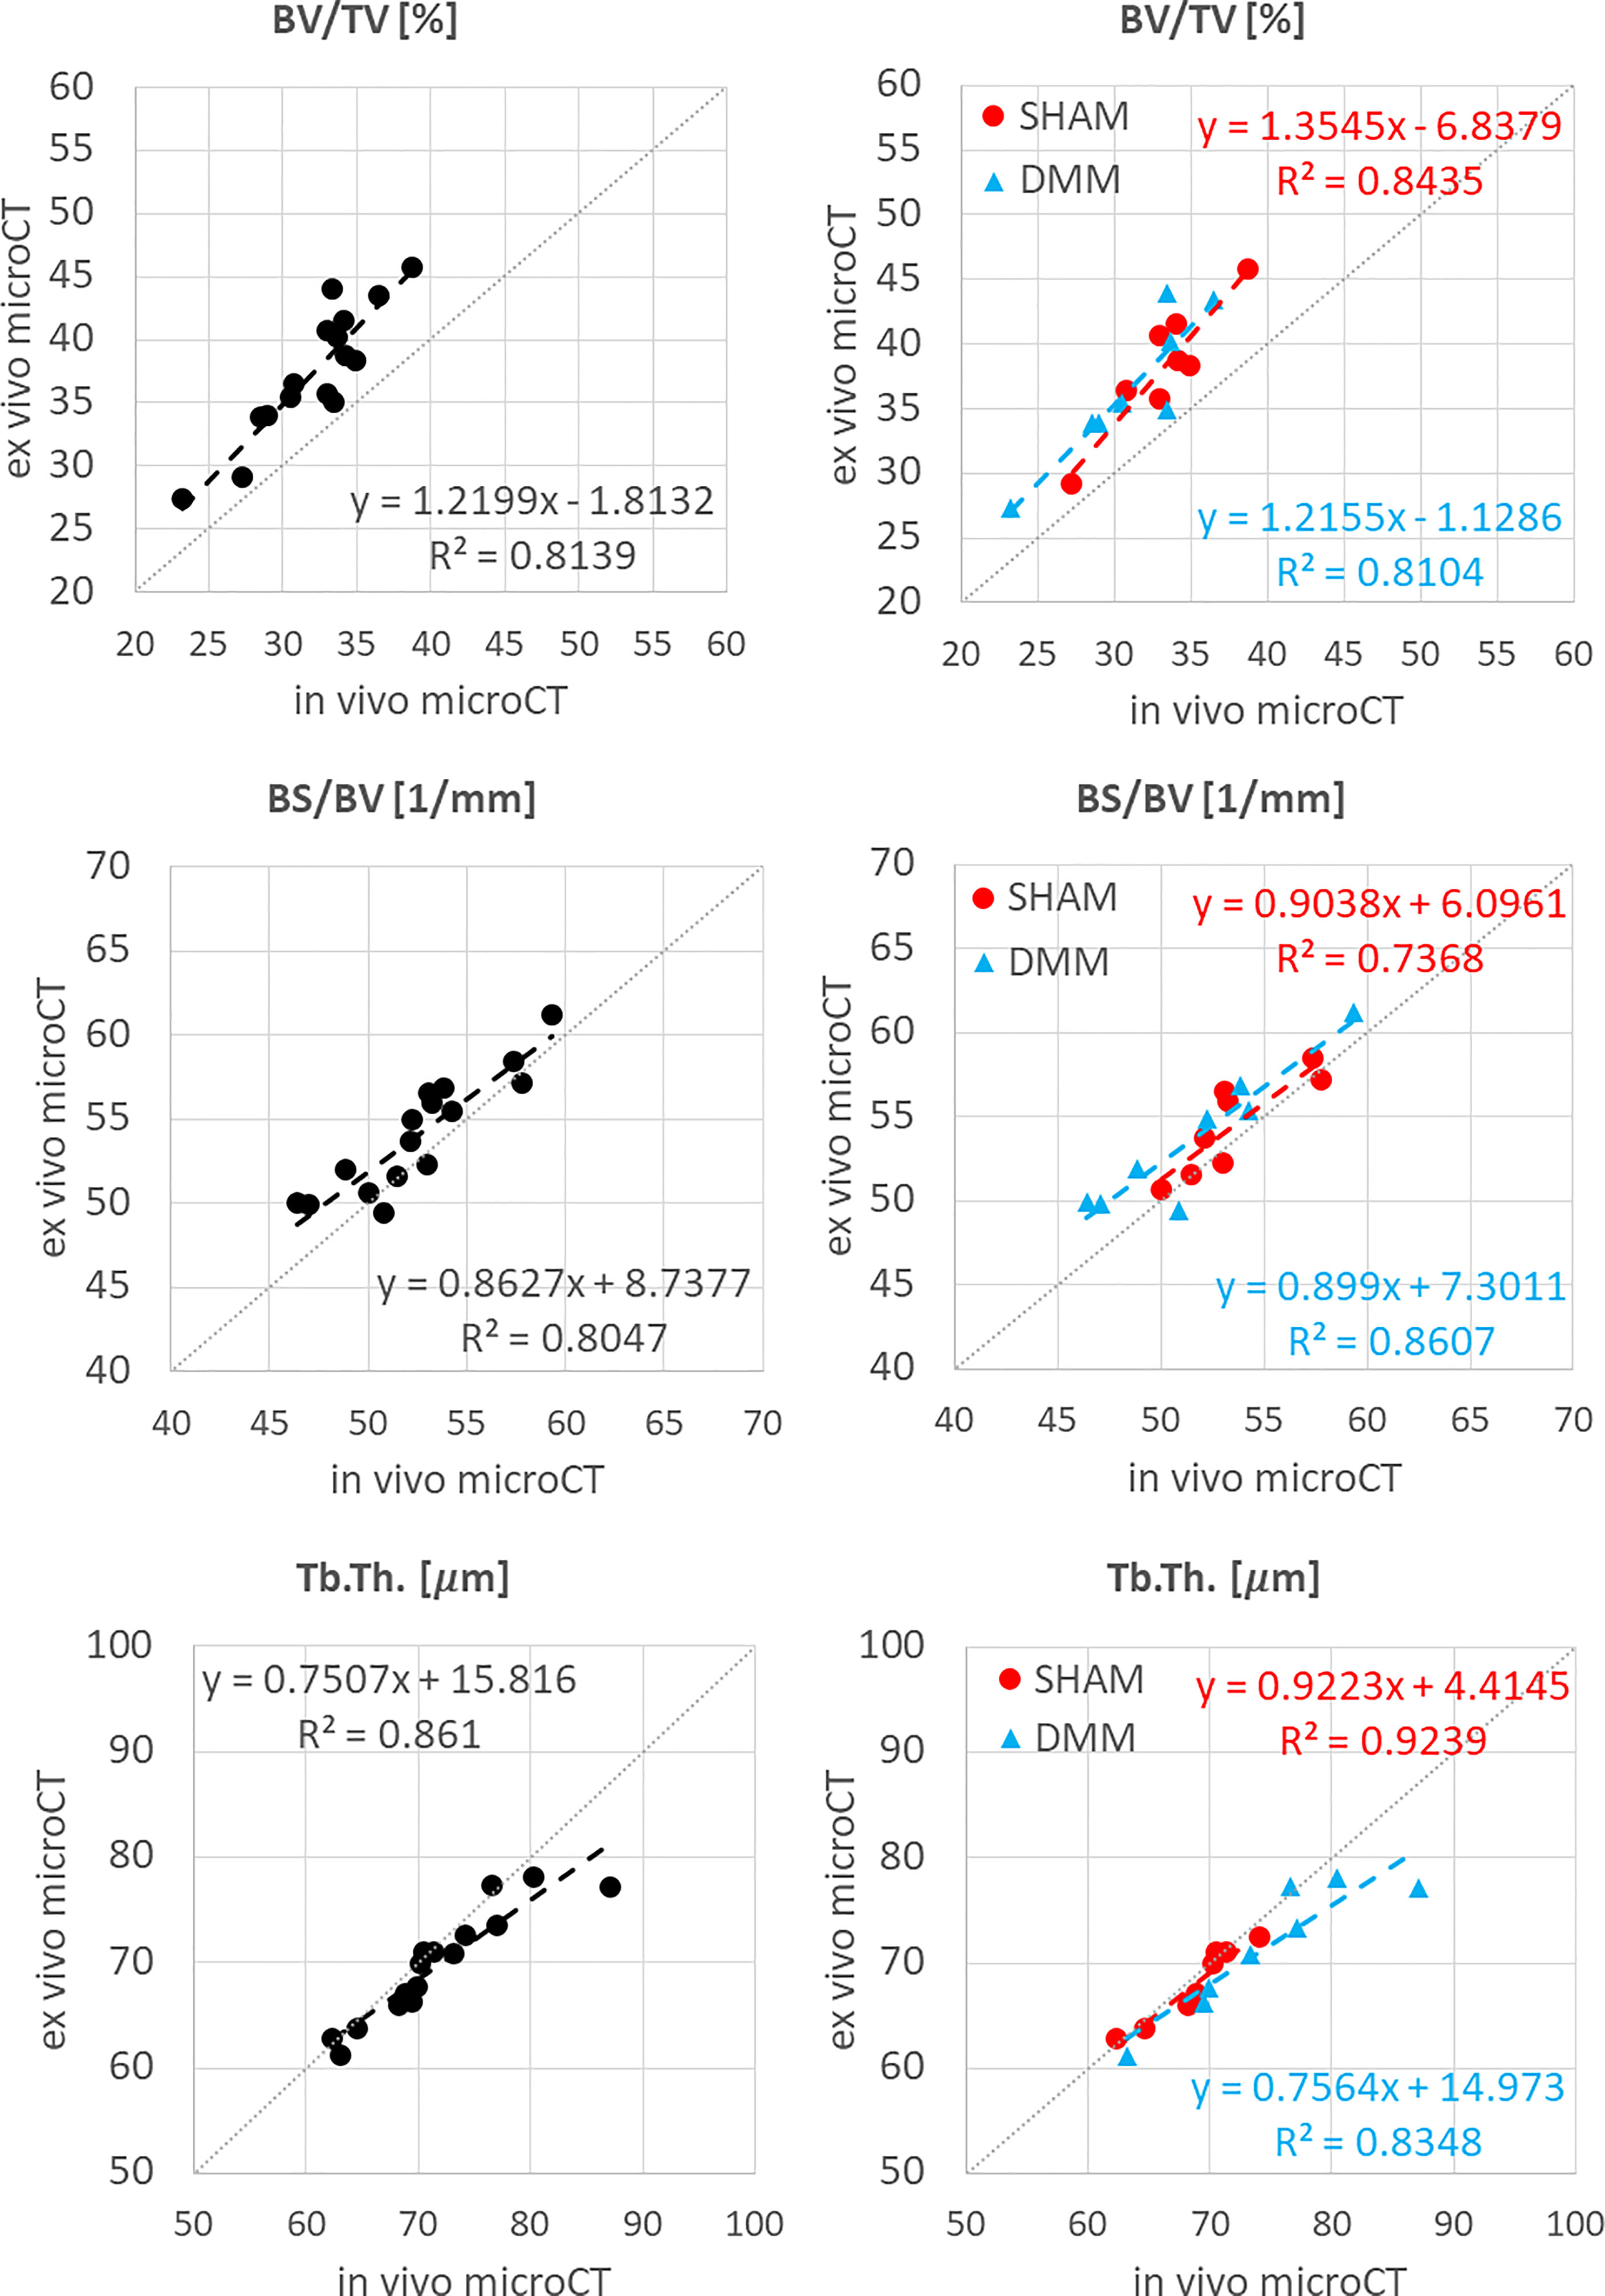
Figure 4 Regression analyses between in vivo and ex vivo measurements for bone volume fraction (BV/TV), bone surface fraction (BS/BV) and trabecular thickness (Tb.Th).
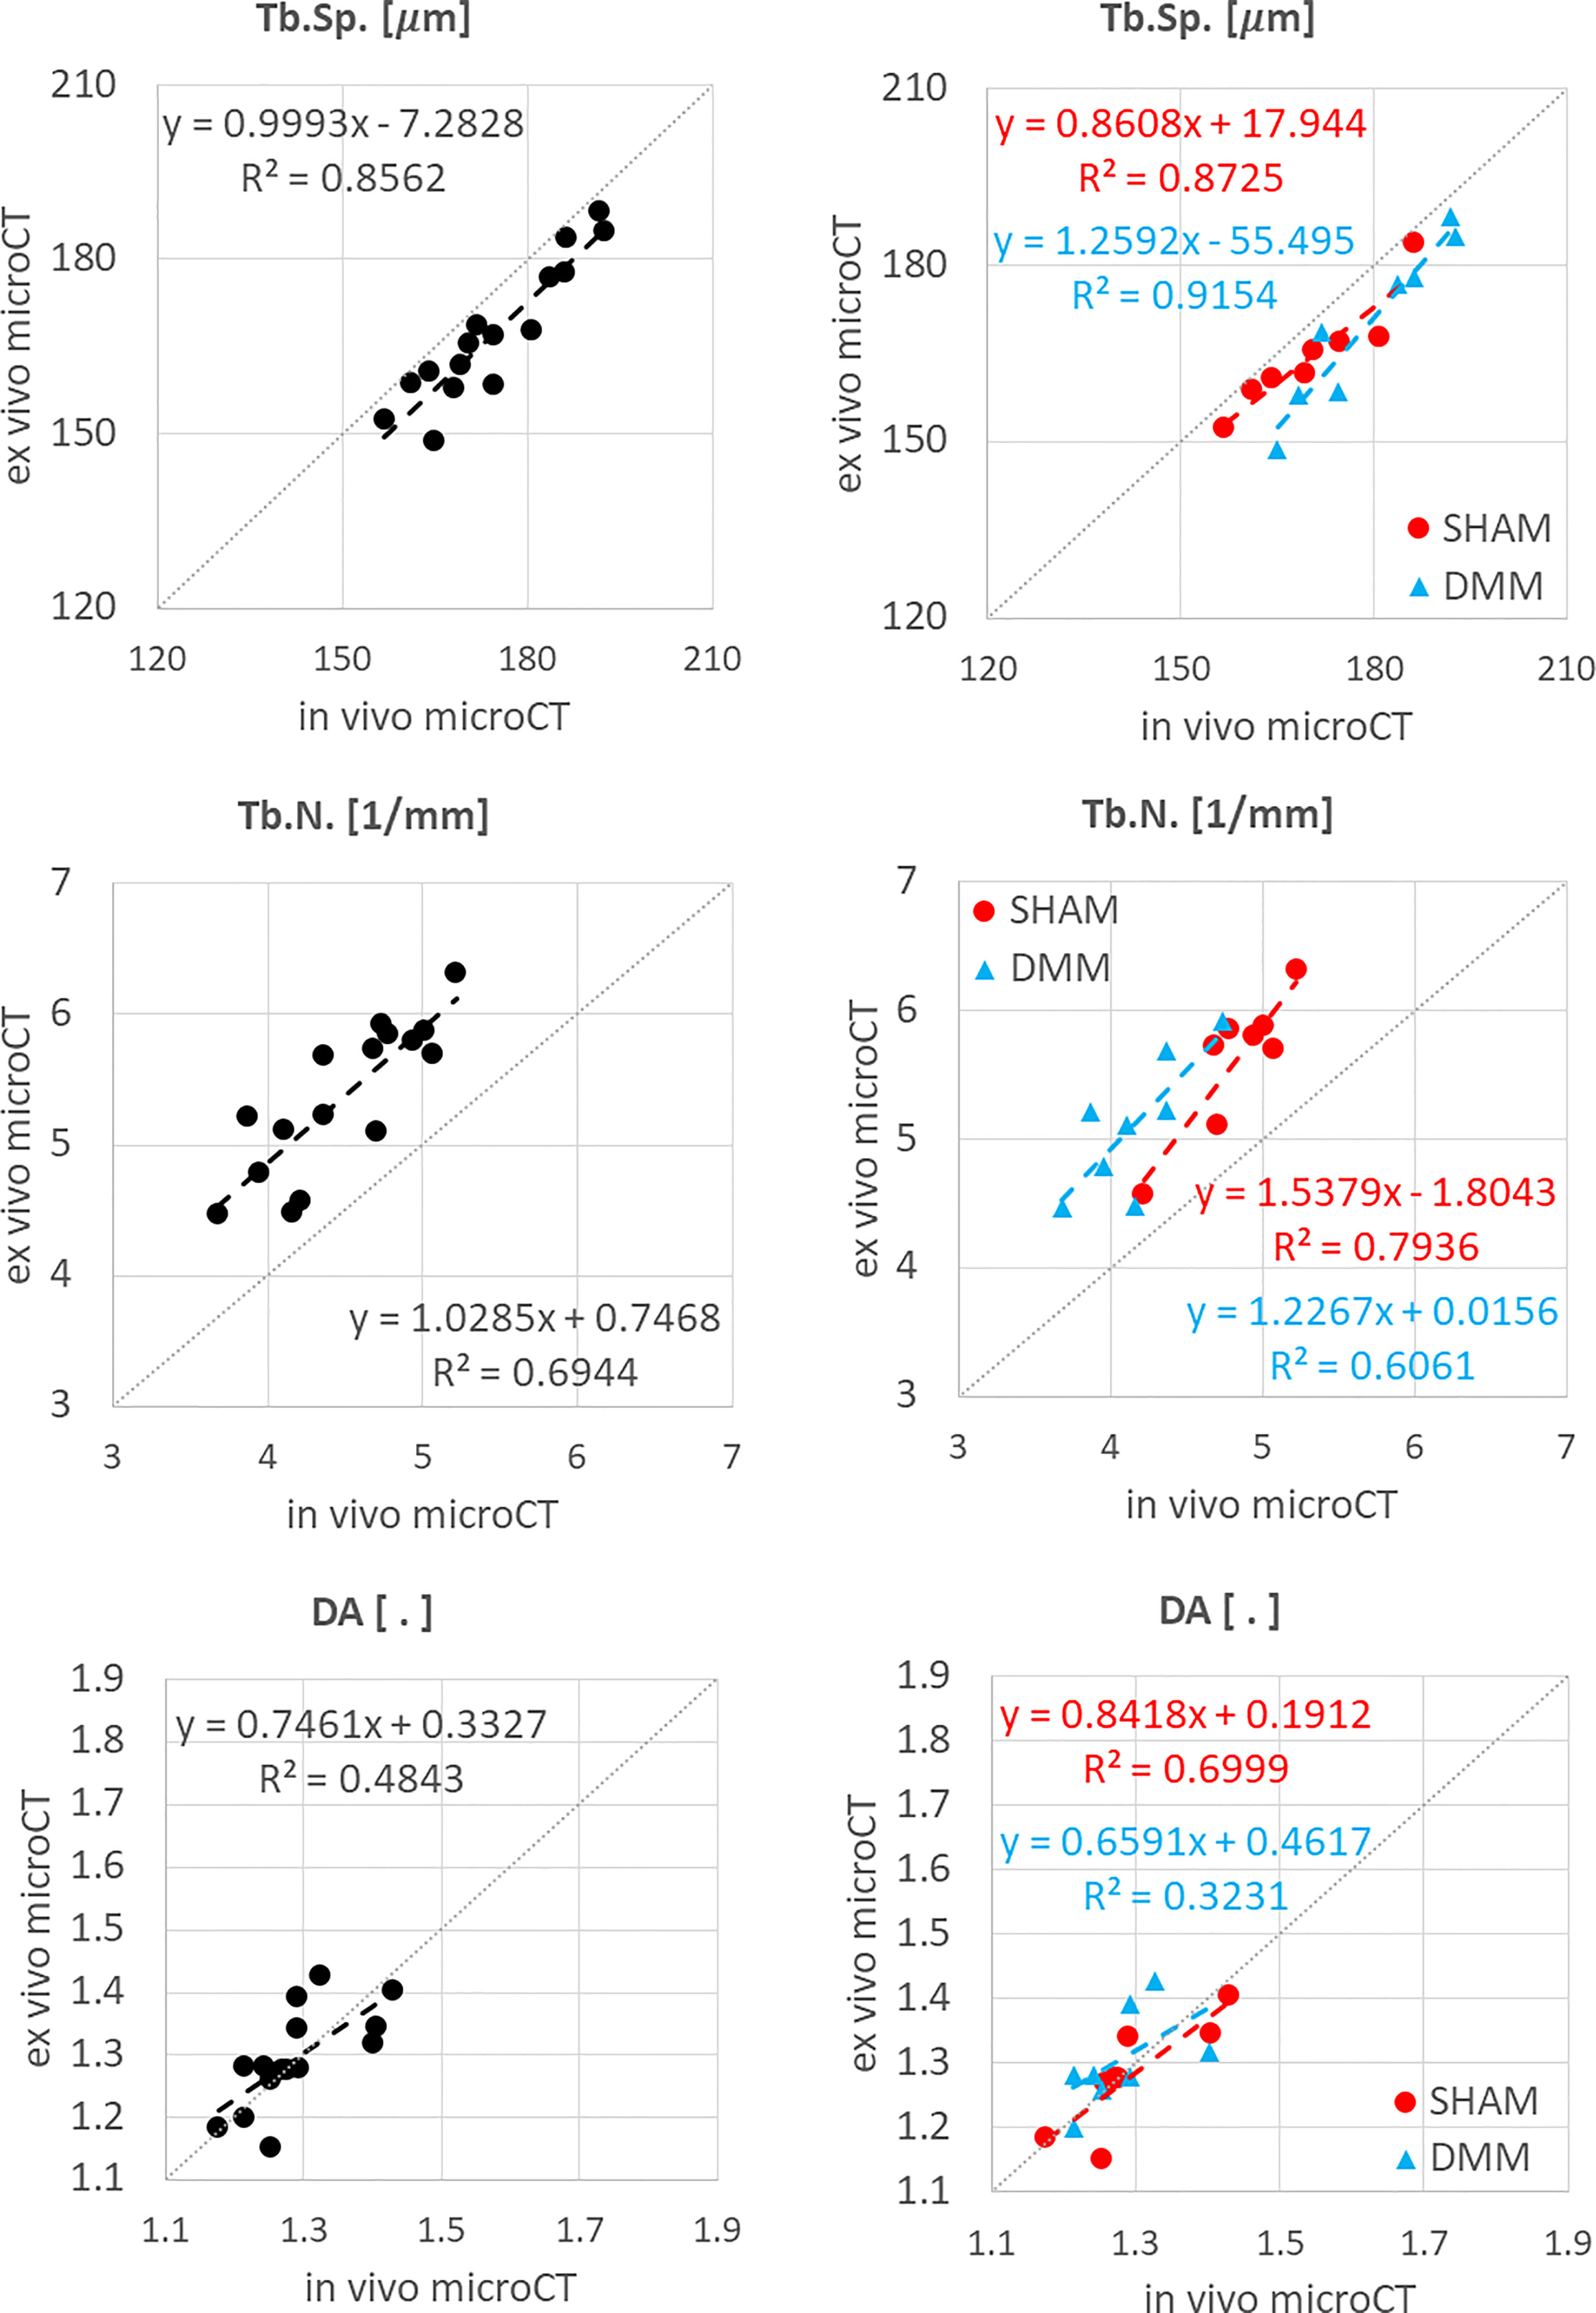
Figure 5 Regression analyses between in vivo and ex vivo measurements for trabecular separation (Tb.Sp), number (Tb.N) and degree of anisotropy (DA).
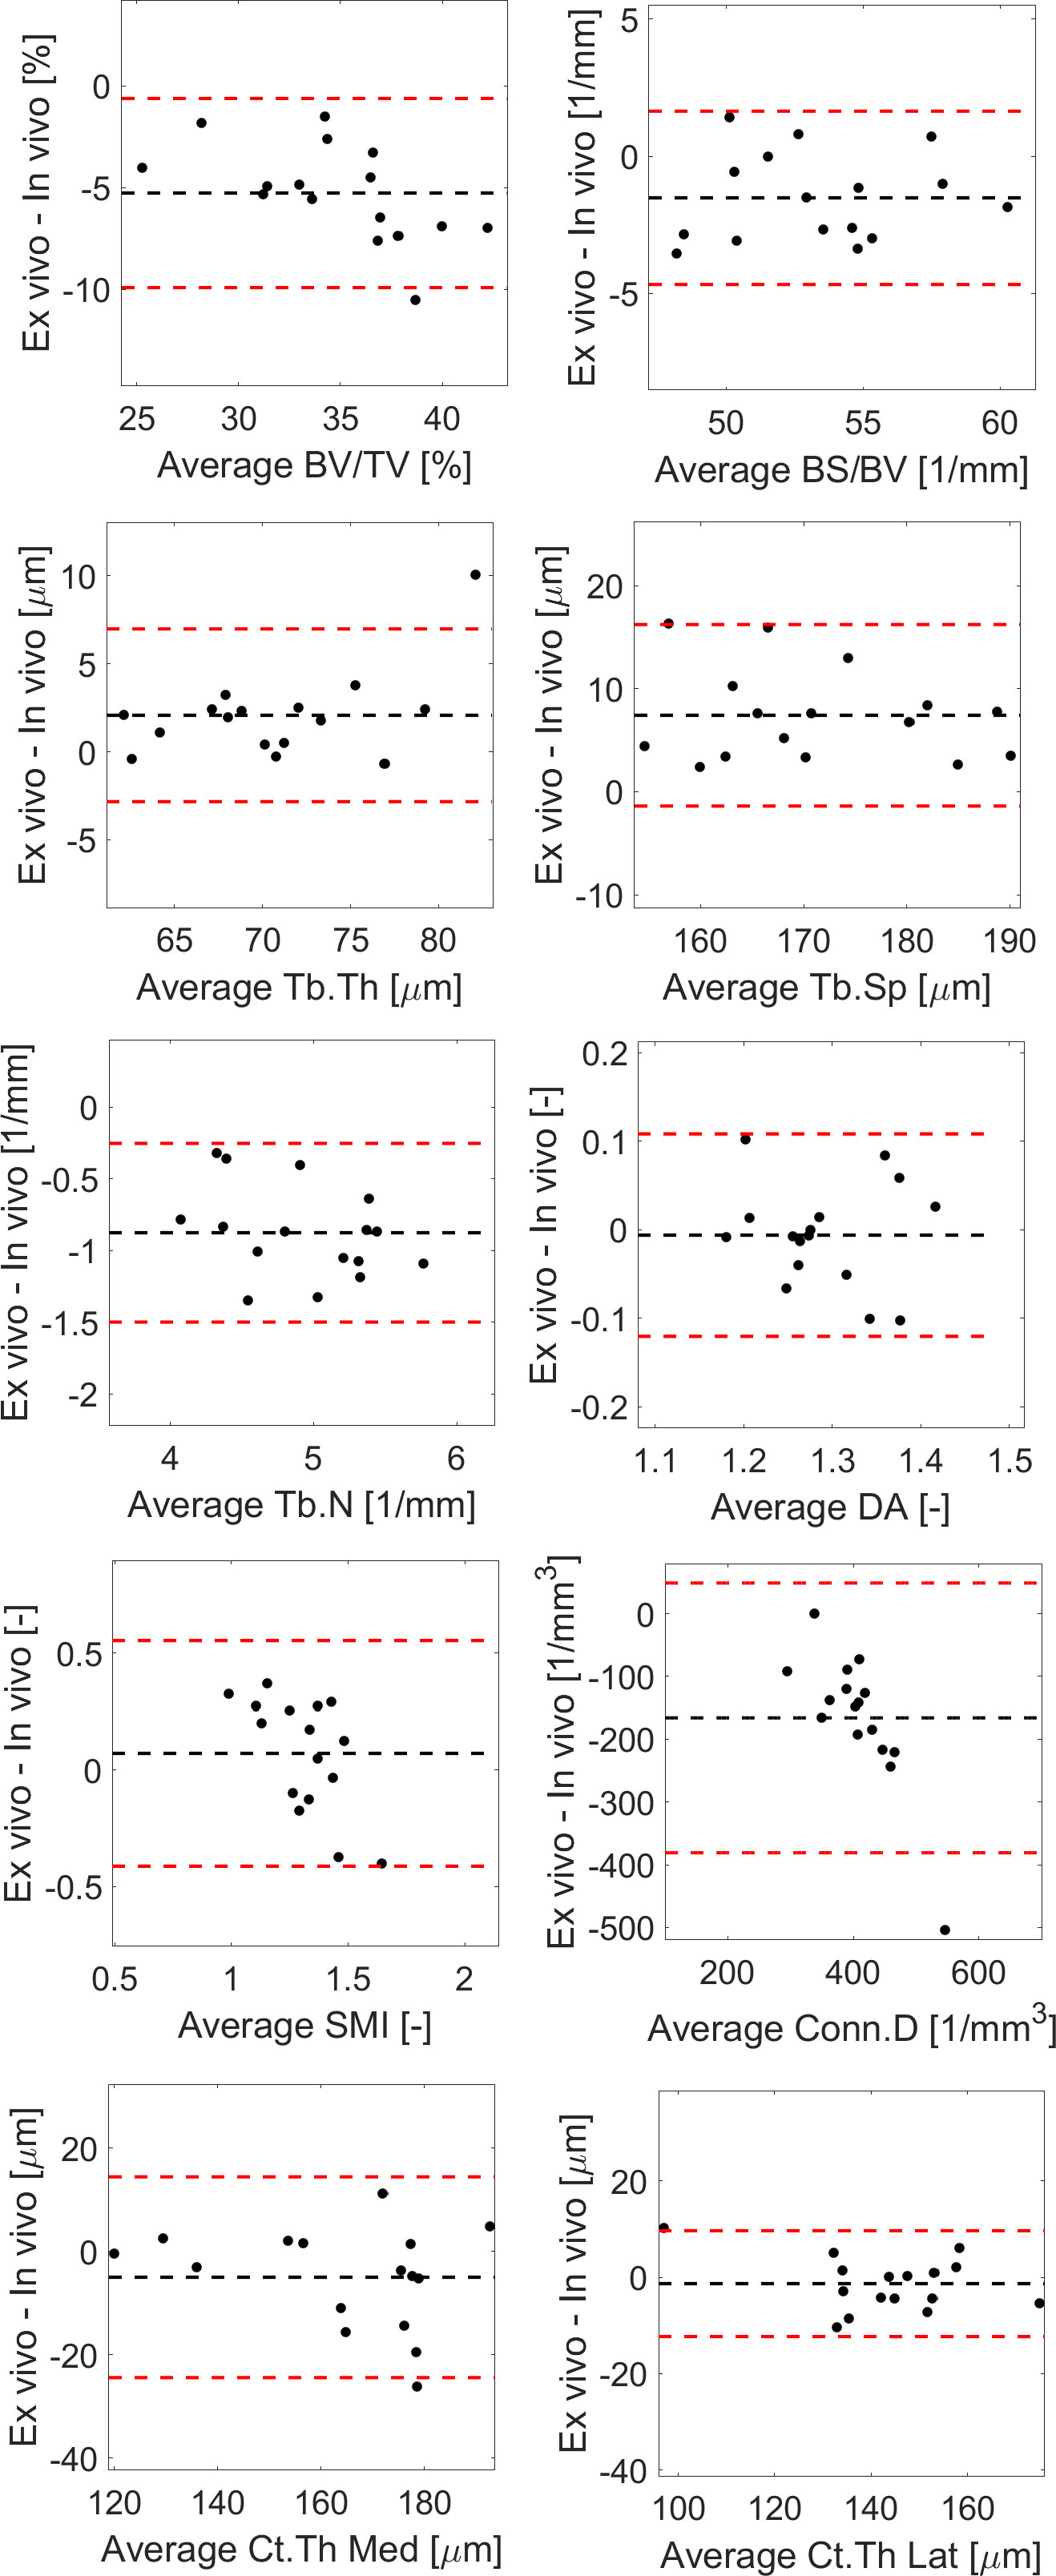
Figure 6 Bland-Altman plots between in vivo and ex vivo measurements for trabecular bone volume fraction (BV/TV), bone surface fraction (BS/BV), trabecular thickness (Tb.Th), separation (Tb.Sp), number (Tb.N) and degree of anisotropy (DA), structure model index (SMI), connectivity density (Conn.D), and cortical thickness (Ct.Th) in the medial or lateral side.
In vivo and ex vivo microCT measurements of cortical thickness were strongly correlated at both medial (R2 = 0.80) and lateral (R2 = 0.91) sides (Figure 3), with no significant differences between the two imaging modalities (Table 1).
The total trabecular BV/TV and the BS/TV calculated with in vivo or ex vivo microCT imaging were strongly correlated for pooled data (R2 = 0.81 for BV/TV and R2 = 0.80 for BS/TV) and for each group (SHAM group: R2 = 0.84 for BV/TV and R2 = 0.74 for BS/TV; DMM: R2 = 0.81 for BV/TV and R2 = 0.86 for BS/TV) (Figure 4). Nevertheless, the BV/TV was systematically underestimated (mean difference of -13.7% ± 5.1%, p<0.001) by the in vivo microCT analyses. Underestimation was similar for the SHAM and DMM groups (Table1).
Similarly, Tb.Th. and Tb.Sp. calculated in the whole trabecular ROI with in vivo or ex vivo microCT imaging were strongly correlated for pooled data (R2 = 0.86 for both Tb.Th. and Tb.Sp.) and for each group (SHAM group: R2 = 0.92 for Tb.Th. and R2 = 0.87 for Tb.Sp.; DMM group: R2 = 0.83 for Tb.Th. and R2 = 0.92 for Tb.Sp.) (Figure 4, 5). Nevertheless, the Tb.Th. was slightly overestimated (mean difference of 2.9% ± 3.3%, p=0.005) by the in vivo microCT analyses, with a little higher difference for the DMM group (4.5% ± 3.9%, p=0.021) than for the SHAM group (1.4% ± 1.6%, p=0.039) (Table 1). Similarly, the Tb.Sp. was overestimated (mean difference of 4.5% ± 2.9%, p<0.001) by the in vivo microCT analyses, with higher differences for the DMM group (5.5% ± 3.4%, p=0.001), compared to the SHAM group (3.5% ± 2.1%, p=0.002) (Table 1).
Significant but worse correlations were found for Tb.N calculated in the whole trabecular ROI (R2 = 0.69 for pooled data, R2 = 0.79 for SHAM, R2 = 0.61 for DMM) (Figure 5), which was systematically underestimated by the in vivo microCT images (ALL: -16.1% ± 5.4%; SHAM: -13.8% ± 4.4%; DMM: -18.4% ± 5.5%, all with p<0.001) (Table 1).
No significant differences were found between in vivo and ex vivo measurements of DA and SMI calculated in the whole subchondral trabecular bone. A weak correlation between in vivo and ex vivo microCT data was found for DA for pool data (R2 = 0.48 for pooled data), with stronger correlations for the individual groups (R2 = 0.79 for SHAM, R2 = 0.61 for DMM) (Figure 5). Conn.D was systematically underestimated by in vivo microCT imaging (differences between -37.1% and -25.9%, Table 1). No significant correlation was found between in vivo and ex vivo microCT measurements for SMI and Conn.D (p>0.05).
Most results in the Bland-Altman plots lied within ±2 SD of the mean difference, indicating good agreement between the two methods (22). Differences between the two methods were normally distributed for all parameters except Tb.Th (however distribution was normal when removing one outlier, Figure 6). A bias was found for the two parameters that were not significantly linearly correlated (Conn.D and SMI).
The descriptive statistics for the trabecular parameters calculated for the sub-ROIs in the medial or lateral compartments are reported in Tables 2, 3 (detailed regression analyses are reported in Appendix A1, Figure A1 and Figure A2). Results were consistent with those found for the whole trabecular ROI, with in vivo microCT imaging underestimating BV/TV (-12% to -15%) and Tb.N (-14% to -20%), and overestimating Tb.Sp (3% to 7%). BS/BV was slightly underestimated only in the lateral region (-3.1%). Tb.Th was slightly overestimated only in the medial compartment (+3.6%).
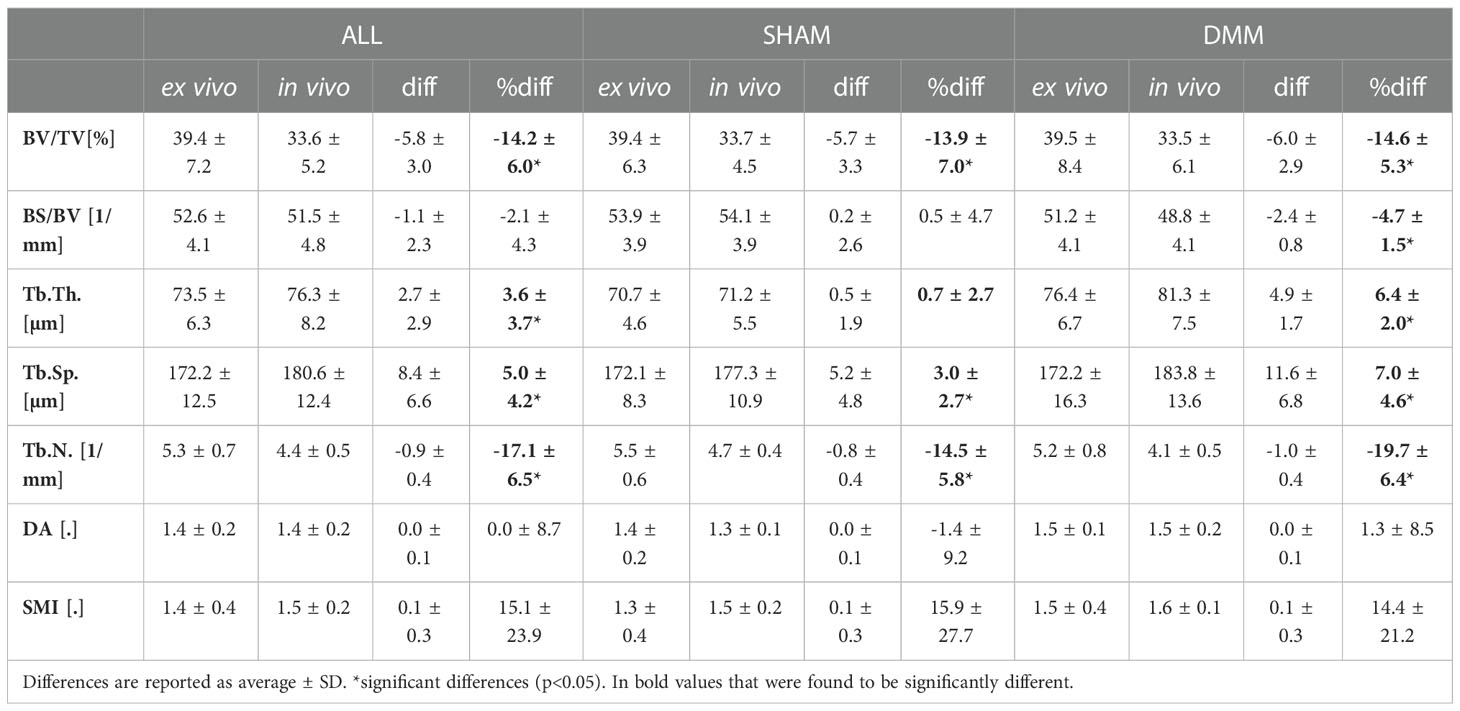
Table 2 Trabecular parameters measured in the medial compartment with in vivo and ex vivo microCT for the pooled (ALL) data and for each group (SHAM or DMM).
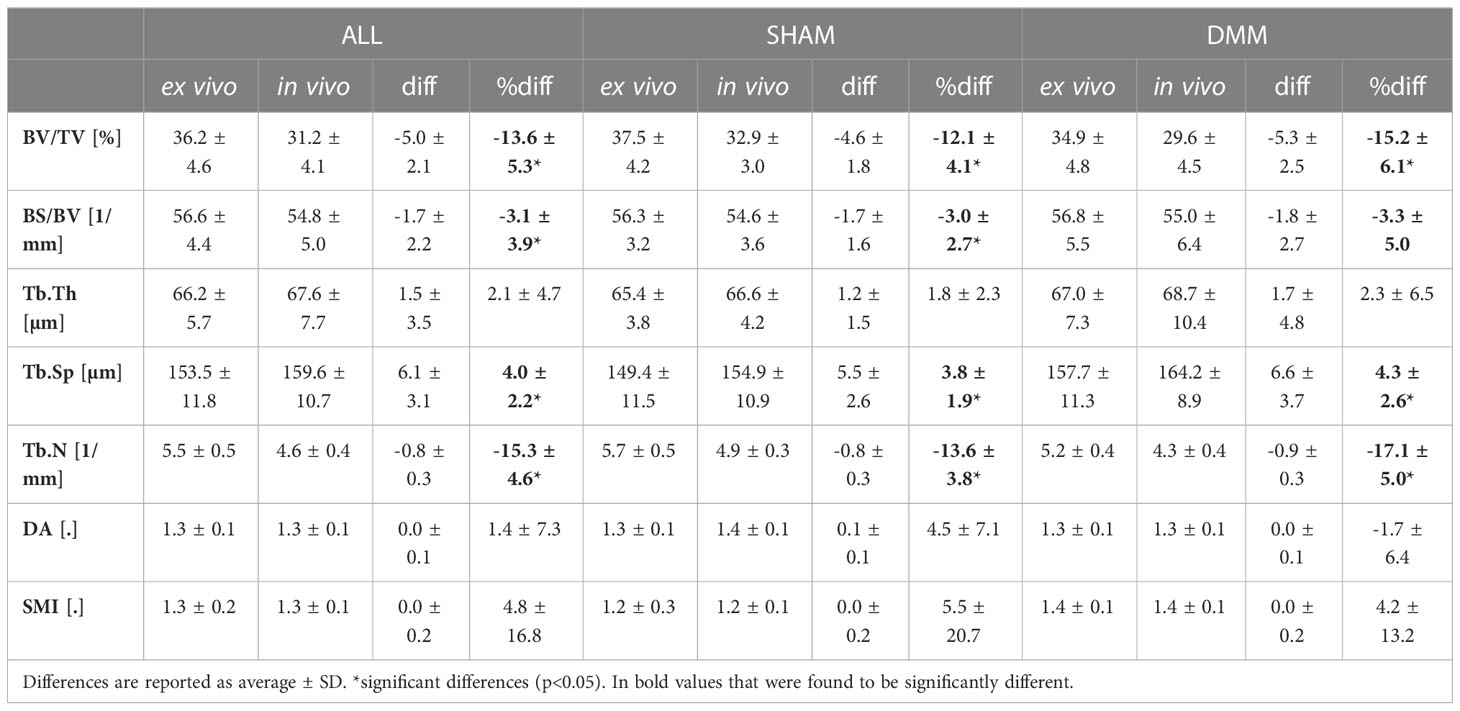
Table 3 Trabecular parameters measured in the lateral compartment with in vivo and ex vivo microCT for the pooled (ALL) data and for each group (SHAM or DMM).
Differences between SHAM and DMM groups when evaluated from in vivo and ex vivo microCT images are reported in Figures 7 (analysis in the whole trabecular ROI) and Figure 8 (analyses in the medial or lateral compartments). No significant differences were found in trabecular or cortical parameters measured with ex vivo microCT between the two groups. Tb.N, SMI and Conn.D measured with in vivo microCT were significantly different between SHAM and DMM groups. Differences were similar to those measured ex vivo for two of the measurements (-9.0% difference in Tb.N with ex vivo vs -13.9% with in vivo, +13.6% difference in SMI with ex vivo vs +14.5% with in vivo). A larger difference was found for Conn.D (+4.8% with ex vivo vs -12.8% with in vivo).
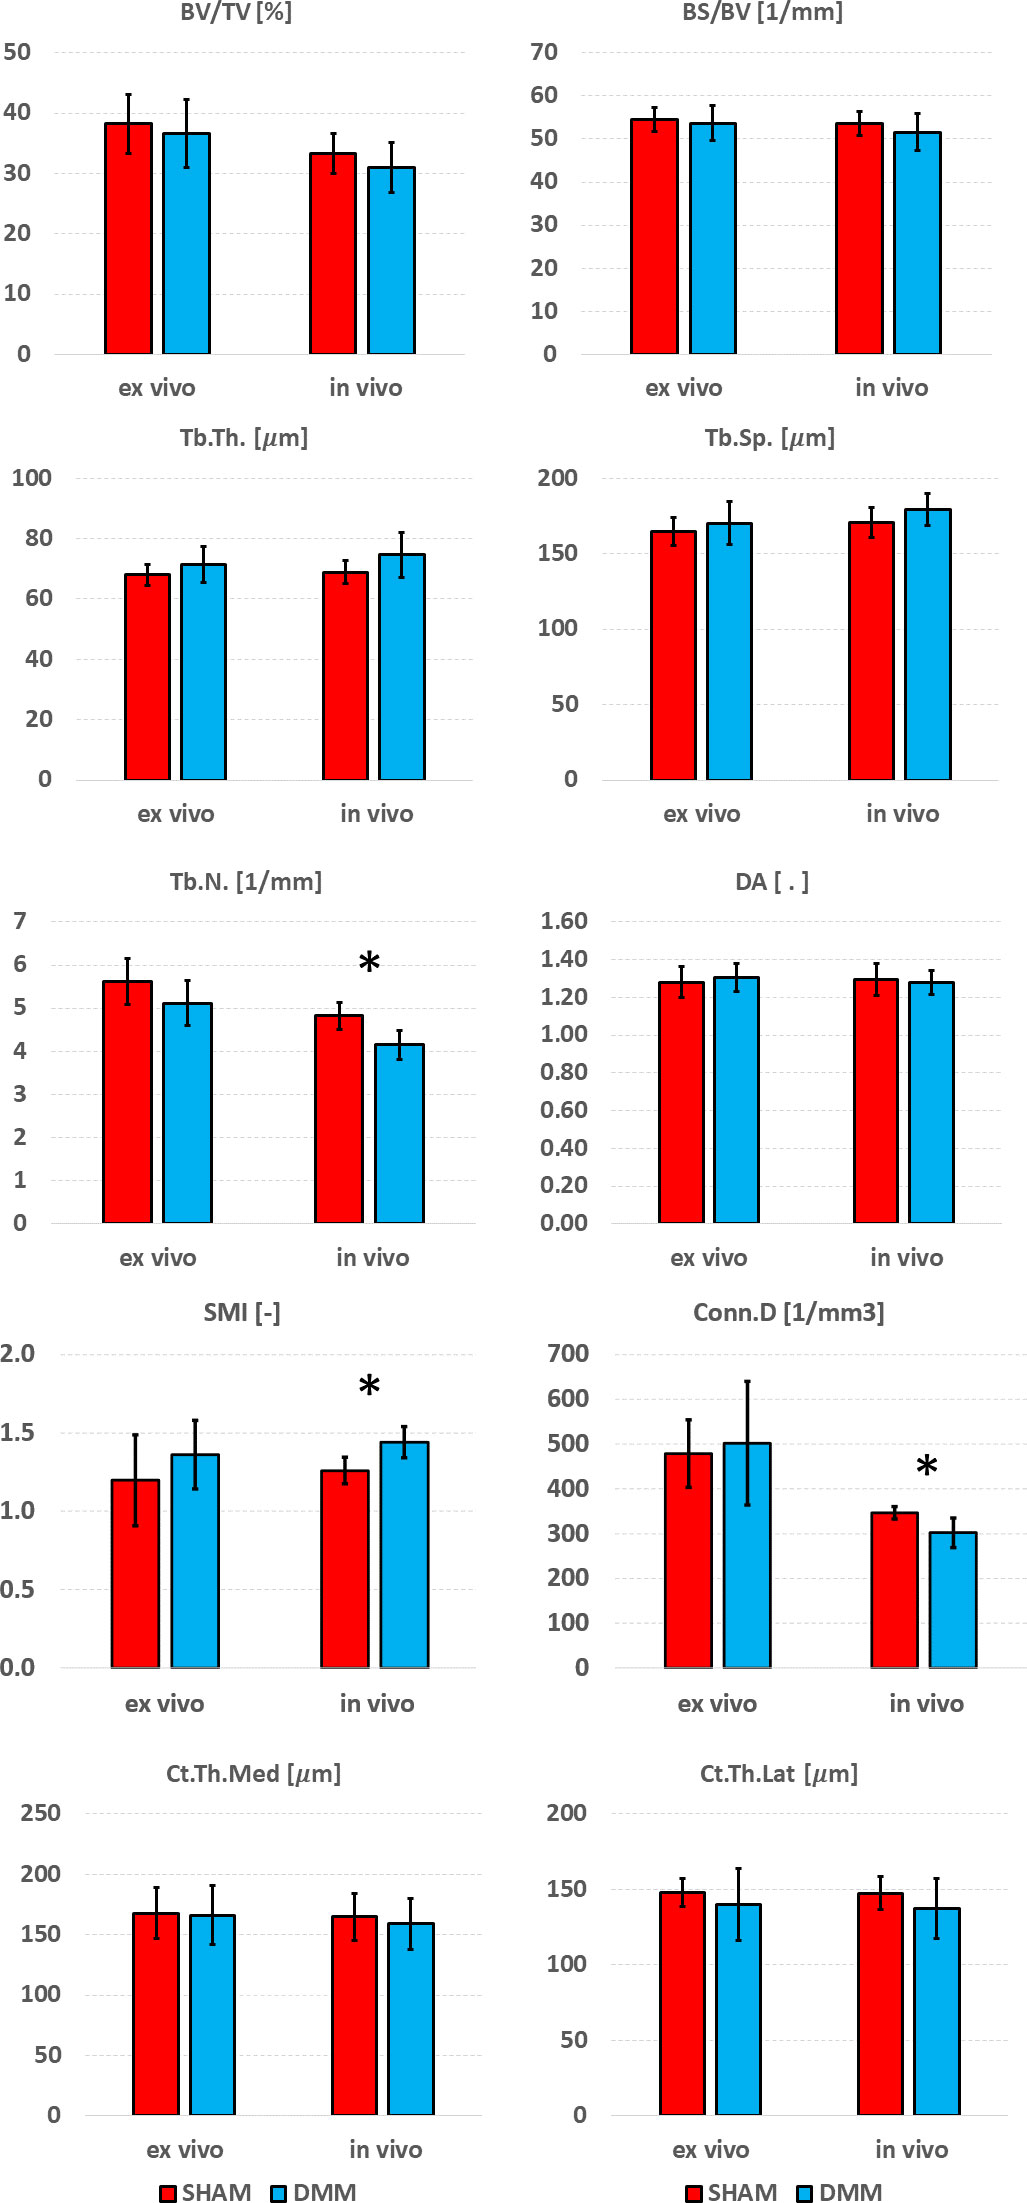
Figure 7 Effect of DMM surgery measured with in vivo and ex vivo microCT. Trabecular bone volume fraction (BV/TV), bone surface fraction (BS/BV), trabecular thickness (Tb.Th), trabecular separation (Tb.Sp), trabecular number (Tb.N), degree of anisotropy (DA), structure model index (SMI) and connectivity density (Conn.D), and cortical thickness (Ct.Th) at medial and lateral side. *significant differences (p<0.05).
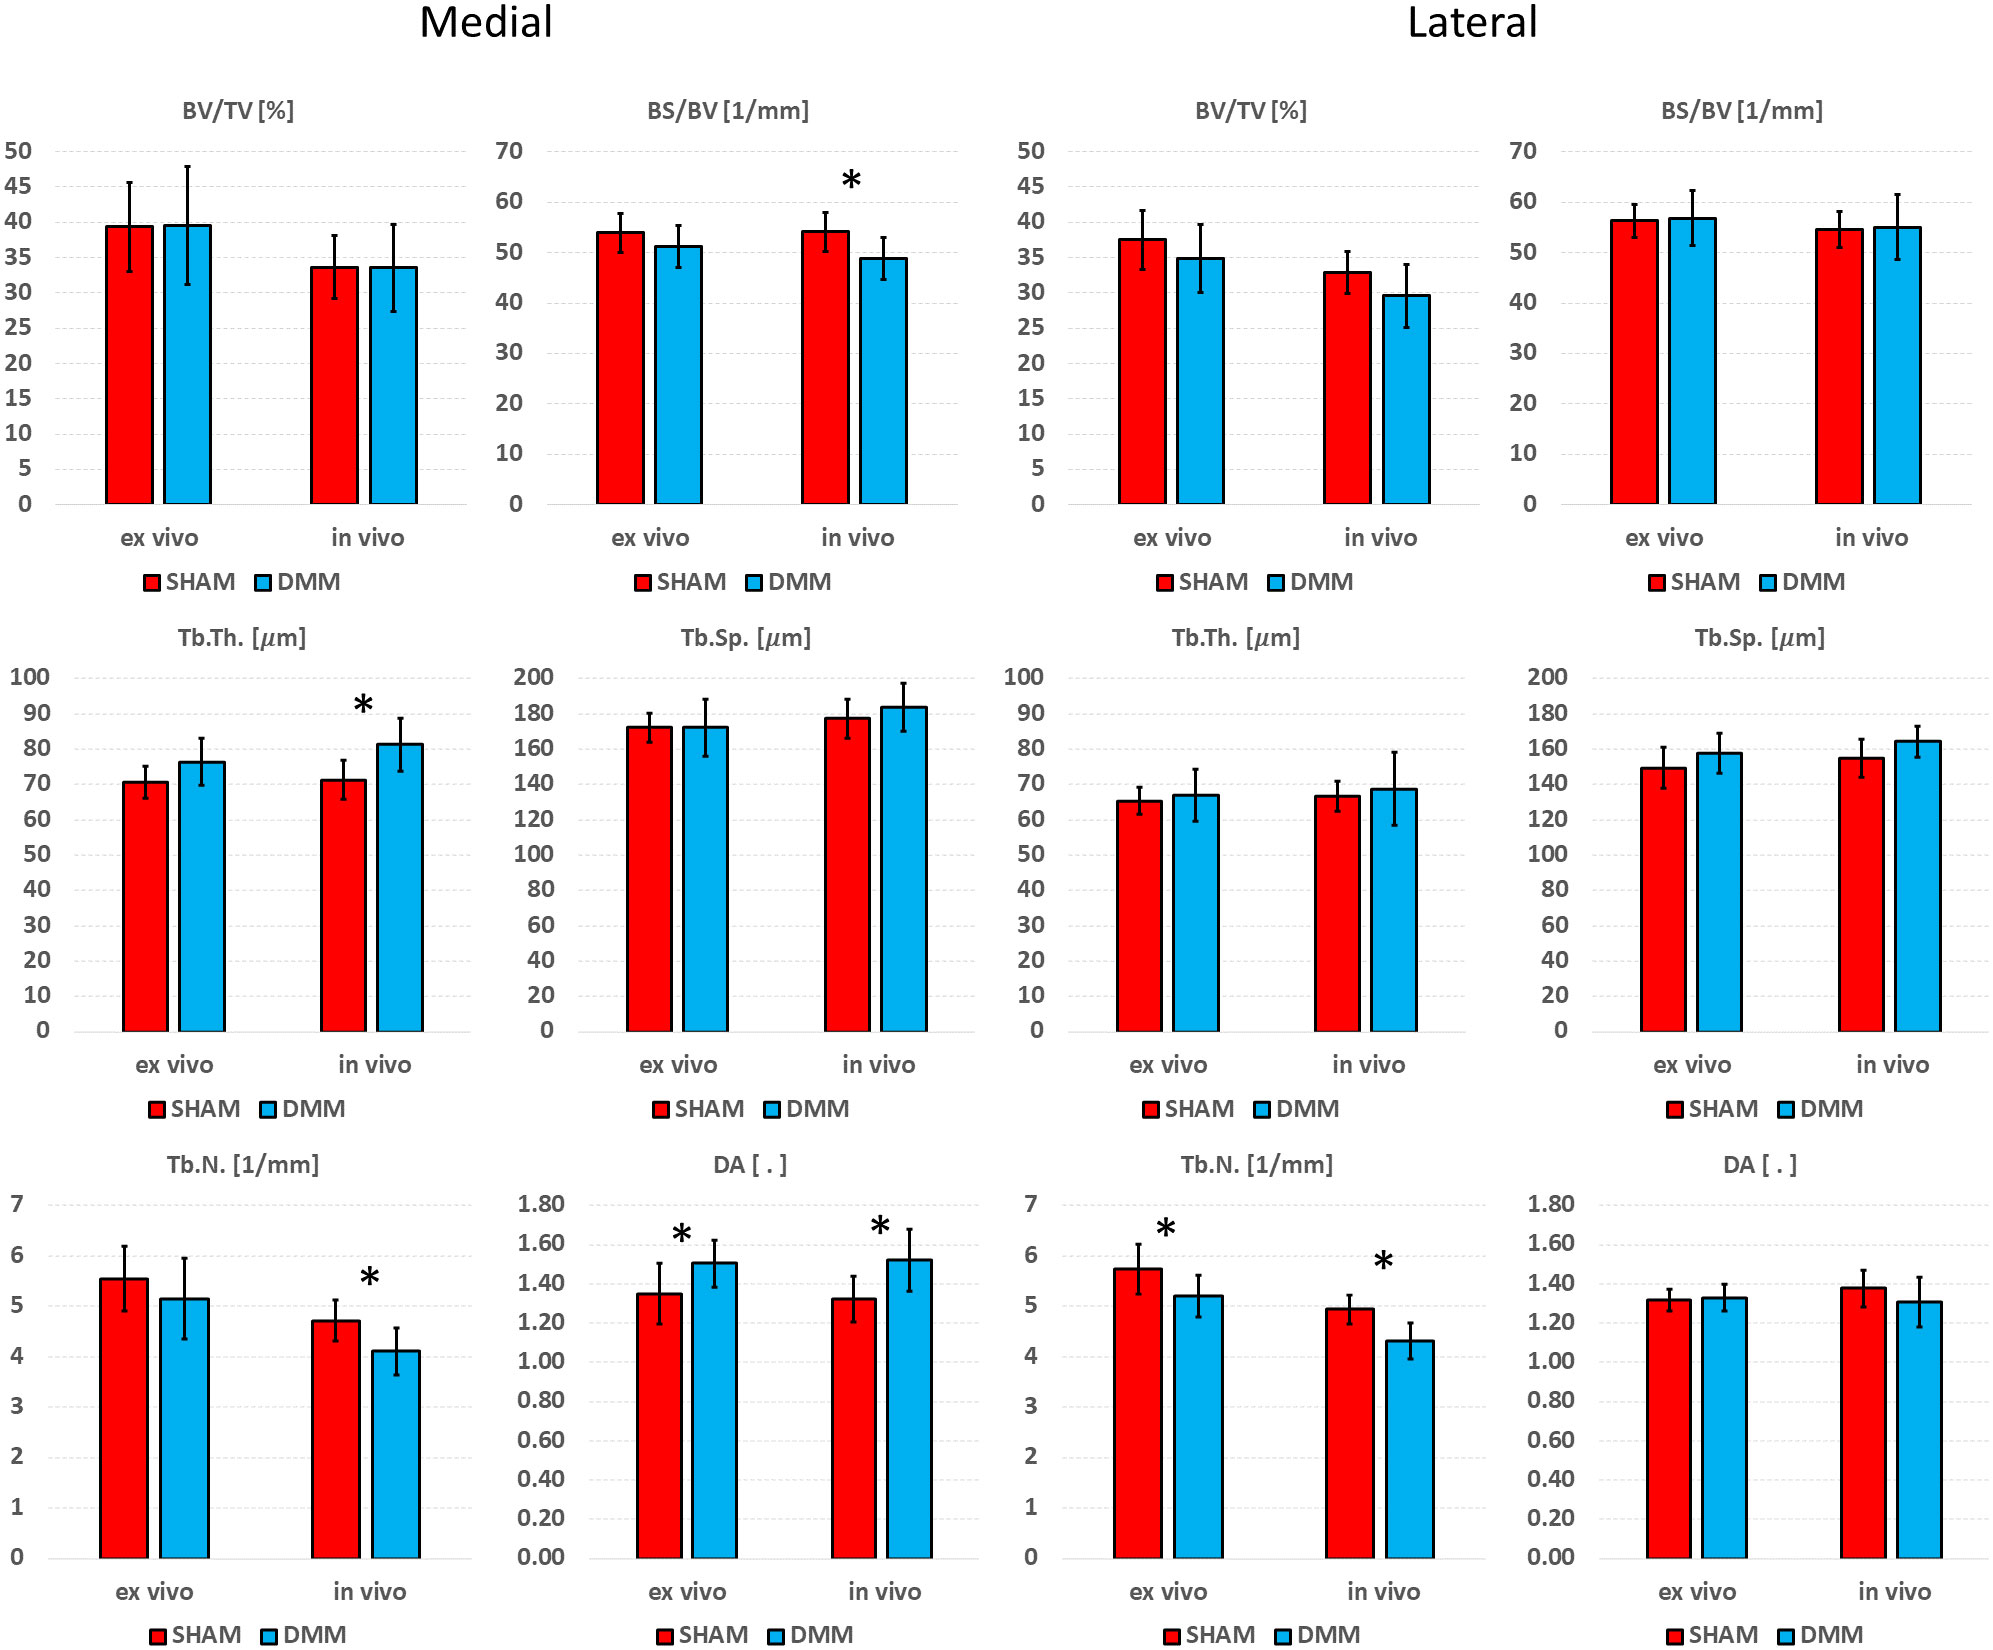
Figure 8 Effect of DMM surgery measured with in in vivo and ex vivo microCT in the medial and lateral trabecular compartments. Trabecular bone volume fraction (BV/TV), bone surface fraction (BS/BV), trabecular thickness (Tb.Th), trabecular separation (Tb.Sp), trabecular number (Tb.N), degree of anisotropy (DA). *significant differences (p<0.05).
In the medial compartment, a significant difference in DA between SHAM and DMM groups was found with both ex vivo (+11.4%) and in vivo (+15.1%) microCT imaging. Differences in BS/BV (-5.0% ex vivo vs -9.9% in vivo), Tb.Th (+8.0% vs +14.1%) and Tb.N (-7.1% vs -13.0%) were only significant when measured in vivo. In the lateral compartment, a significant decrease in Tb.N was found for DMM mice both ex vivo (-9.1%) and in vivo (-12.7%).
The goal of this study was to quantify the accuracy of in vivo microCT imaging to measure trabecular and cortical morphometric parameters in the subchondral bone of the proximal mouse tibia. The results show that in vivo and ex vivo measurements were highly correlated for most trabecular parameters, even though in vivo microCT over- or under-estimated some of them. Cortical plate thickness was accurately measured with in vivo imaging.
Lower resolution imaging led to significant underestimation of bone volume fraction (-13.7%), bone surface density (-2.8%) and trabecular number (-16.1%), whereas trabecular thickness (+2.9%) and separation (+4.5%) were significantly overestimated. No significant differences between degree of anisotropy measured in vivo and ex vivo were found. The underestimation of BV/TV and Tb.N were likely due to the fact that smaller trabeculae or thin connections are not visible at lower resolution, which also leads to underestimation of Conn.D and overestimation of Tb.Sp. On the other hand, the overestimation of trabecular thickness could be due to the partial volume effect linked to the larger voxel size (10.4 µm in vivo vs 4.35 µm ex vivo). Nevertheless, the high correlation between in vivo and ex vivo measurements for most microstructural parameters indicates that variations are adequately captured by in vivo imaging, which therefore can be used to measure morphometric parameters over time, especially considering that in a longitudinal design systematic over- or under-estimations are compensated by measuring changes from baseline. Nevertheless, Conn.D and SMI values calculated with in vivo or ex vivo microCT were not correlated, showing that these two parameters should not be used when assessing the morphology of the subchondral trabecular bone from in vivo microCT images.
The results obtained in this study for some of the parameters are in contrast with those obtained for the vertebral and distal femur trabecular bone, for which it has been reported that increasing voxel size led to overestimation of bone volume fraction and trabecular thickness (17, 23). Nevertheless, these measurements depend from the threshold value used for segmentation (17). In this study thresholds were specimen-specific and calculated automatically, thus assuring measurement repeatability. Additionally, the voxel size of reference images (6 µm in (17), 8 µm in (23), 4.35 µm in this study) used as gold standard high resolution images plays a role in the measured errors.
Scanning method minimally affected cortical thickness measurements, which was consistent with previous studies (17, 19) and likely due to the simplified structure of cortical plate and higher ratio between thickness and voxel size.
Significant differences between SHAM and DMM groups were found with in vivo images for trabecular number (-13.9% in DMM) and structure model index (+14.5% in DMM), even though the measured differences were consistent with those obtained ex vivo which however were not statistically significant (-9.0% and +13.7%, respectively). When measuring trabecular parameters separately in the medial and lateral compartments, a significant increase in DA was observed in the DMM group at the medial side (+11.4% ex vivo and +15.1% in vivo) and a significant decrease in trabecular number at the lateral side (-9.1% vs -12.7%). BS/BV and Tb.N were consistently lower in the DMM group at the medial side, while Tb.Th was consistently higher, nevertheless these differences were only significant when measured in vivo. While it is surprising that most significant differences were found from in vivo microCT measurements, this may be due to the relatively low sample size considered in this study. Nevertheless, when the DMM model has been assessed in the literature, most differences occurred on the cartilage and on the osteophyte formation and volume. Little differences were found for some of the microstructural parameters. For example, using an approach similar to the in vivo microCT imaging used in this study (~10µm voxel size) on SHAM-operated and DMM mice (4 months old, 2 months after DMM) Huang et al. (24) did not find any differences in cortical plate properties but found differences in osteophyte volume and density. In another study using a microCT imaging similar to the ex vivo approach used in this study (~5µm voxel size) Das Neves Borges found differences at 12 weeks post DMM in the medial subchondral plate, and in the lateral trabecular TV, but no other morphometric parameters were studied. However, in that study the contralateral not-operated bone was used as control, which may as well be affected by the change in gait due to the surgery on the contralateral leg, making it unclear to isolate the effect of the DMM. Therefore, more research is required to assess early effects of DMM on the local microstructural properties of the trabecular subchondral bone.
A limitation of this study is that a simple global thresholding was used for trabecular bone segmentation, while in vivo measurements may be improved with more advanced segmentation methods (25, 26). Even though only one mouse strain was included in this analysis and results may vary for different strains, nevertheless C57BL/6 mice are most commonly used for DMM studies (2, 5, 8, 9, 27). Lastly, the in vivo scanning procedure used in this study was optimized in previous work aiming to minimize the effects of the ionizing radiation on bone adaptation over time at different time points (19). In fact, the image quality from the in vivo scans could be increased by increasing the scanning time (and therefore the radiation), which may be acceptable in in vivo studies where the animals are scanned only twice after several weeks. Nevertheless, the effect of the radiation on the bone adaptation in the subchondral bone should be quantified.
In conclusion, in vivo microCT was able to measure cortical morphometric parameters with excellent accuracy and most trabecular parameters with very good accuracy in the subchondral bone of the mouse tibia. In vivo imaging can be applied to study disease (e.g. OA) onset and progression, as well as the effects of treatments over time, providing important longitudinal information. Ex vivo scanning is recommended at the end of the study for more accurate microstructural characterization and confirm the in vivo results at that time point.
The original contributions presented in the study are included in the article/supplementary material. Further inquiries can be directed to the corresponding author.
Conceptualisation: SO, HI, IB, ED; Data curation: SO, ED; Formal analysis: SO, EM, ED; Funding acquisition: IB, ED; Investigation: SO, EM, ZC, AR, BR, HI; Methodology: SO, EM, ZC, AR, BR, HI; Project administration: SO, ED; Resources: IB, ED; Software: SO, EM; Supervision: IB, HI, ED; Visualisation: SO, ED; Writing – Original Draft Preparation: SO; Writing – Review & Editing: ALL. All authors contributed to the article and approved the submitted version.
The study was partially funded by the UK National Centre for the Replacement, Refinement and Reduction of Animals in Research (NC3Rs, Grant number: NC/R001073/1) and by the Engineering and Physical Sciences Research Council (EPSRC) Frontier Multisim Grant (EP/K03877X/1 and EP/S032940/1).
The authors declare that the research was conducted in the absence of any commercial or financial relationships that could be construed as a potential conflict of interest.
All claims expressed in this article are solely those of the authors and do not necessarily represent those of their affiliated organizations, or those of the publisher, the editors and the reviewers. Any product that may be evaluated in this article, or claim that may be made by its manufacturer, is not guaranteed or endorsed by the publisher.
1. Katz JN, Arant KR, Loeser RF. Diagnosis and treatment of hip and knee osteoarthritis: A review. JAMA (2021) 325(6):568–78. doi: 10.1001/jama.2020.22171
2. Holyoak DT, Chlebek C, Kim MJ, Wright TM, Otero M, van der Meulen MCH. Low-level cyclic tibial compression attenuates early osteoarthritis progression after joint injury in mice. Osteoarthritis Cartilage (2019) 27(10):1526–36. doi: 10.1016/j.joca.2019.06.005
3. Adebayo OO, Holyoak DT, van der Meulen MCH. Mechanobiological mechanisms of load-induced osteoarthritis in the mouse knee. J Biomechanical Eng (2019) 141(7):070806. doi: 10.1115/1.4043970
4. Bouxsein ML, Boyd SK, Christiansen BA, Guldberg RE, Jepsen KJ, Müller R. Guidelines for assessment of bone microstructure in rodents using micro–computed tomography. J Bone Mineral Res (2010) 25(7):1468–86. doi: 10.1002/jbmr.141
5. Das Neves Borges P, Vincent TL, Marenzana M. Automated assessment of bone changes in cross-sectional micro-CT studies of murine experimental osteoarthritis. PloS One (2017) 12(3):e0174294. doi: 10.1371/journal.pone.0174294
6. Adebayo OO, Ko FC, Wan PT, Goldring SR, Goldring MB, Wright TM, et al. Role of subchondral bone properties and changes in development of load-induced osteoarthritis in mice. Osteoarthritis Cartilage (2017) 25(12):2108–18. doi: 10.1016/j.joca.2017.08.016
7. Duan X, Sandell LJ, Chinzei N, Holguin N, Silva MJ, Schiavinato A, et al. Therapeutic efficacy of intra-articular hyaluronan derivative and platelet-rich plasma in mice following axial tibial loading. PloS One (2017) 12(4):e0175682. doi: 10.1371/journal.pone.0175682
8. Vachhani K, Prodeus A, Nakamura S, Rockel JS, Hopfgartner A, Kapoor M, et al. Can CD200R1 agonists slow the progression of osteoarthritis secondary to injury. Front Immunol 13:836837. doi: 10.3389/fimmu.2022.836837
9. Liu B, Ji C, Shao Y, Liang T, He J, Jiang H, et al. Etoricoxib decreases subchondral bone mass and attenuates biomechanical properties at the early stage of osteoarthritis in a mouse model. Biomedicine Pharmacotherapy (2020) 127:110144. doi: 10.1016/j.biopha.2020.110144
10. Ko FC, Dragomir C, Plumb DA, Goldring SR, Wright TM, Goldring MB, et al. In vivo cyclic compression causes cartilage degeneration and subchondral bone changes in mouse tibiae. Arthritis Rheumatism (2013) 65(6):1569–78. doi: 10.1002/art.37906
11. Dall’Ara E, Boudiffa M, Taylor C, Schug D, Fiegle E, Kennerley AJ, et al. Longitudinal imaging of the ageing mouse. Mech Ageing Dev (2016) 160:93–116. doi: 10.1016/j.mad.2016.08.001
12. Botter SM, van Osch GJVM, Clockaerts S, Waarsing JH, Weinans H, van Leeuwen JPTM. Osteoarthritis induction leads to early and temporal subchondral plate porosity in the tibial plateau of mice: An in vivo microfocal computed tomography study. Arthritis Rheumatism (2011) 63(9):2690–9. doi: 10.1002/art.30307
13. Lorenz J, Seebach E, Hackmayer G, Greth C, Bauer RJ, Kleinschmidt K, et al. Melanocortin 1 receptor-signaling deficiency results in an articular cartilage phenotype and accelerates pathogenesis of surgically induced murine osteoarthritis. PloS One (2014) 9(9):e105858. doi: 10.1371/journal.pone.0105858
14. Kim BJ, Choi BH, Jin LH, Park SR, Min B-H. Comparison between subchondral bone change and cartilage degeneration in collagenase- and DMM- induced osteoarthritis (OA) models in mice. Tissue Eng Regenerative Med (2013) 10(4):211–7. doi: 10.1007/s13770-013-1080-2
15. Willie BM, Birkhold AI, Razi H, Thiele T, Aido M, Kruck B, et al. Diminished response to in vivo mechanical loading in trabecular and not cortical bone in adulthood of female C57Bl/6 mice coincides with a reduction in deformation to load. Bone (2013) 55(2):335–46. doi: 10.1016/j.bone.2013.04.023
16. Klinck RJ, Campbell GM, Boyd SK. Radiation effects on bone architecture in mice and rats resulting from in vivo micro-computed tomography scanning. Med Eng Physics (2008) 30(7):888–95. doi: 10.1016/j.medengphy.2007.11.004
17. Christiansen BA. Effect of micro-computed tomography voxel size and segmentation method on trabecular bone microstructure measures in mice. Bone Rep (2016) 5:136–40. doi: 10.1016/j.bonr.2016.05.006
18. Oliviero S, Giorgi M, Laud PJ, Dall’Ara E. Effect of repeated in vivo microCT imaging on the properties of the mouse tibia. PloS One (2019) 14(11):e0225127. doi: 10.1371/journal.pone.0225127
19. Oliviero S, Lu Y, Viceconti M, Dall'Ara E. Effect of integration time on the morphometric, densitometric and mechanical properties of the mouse tibia. J Biomechanics (2017) 65(Supplement C):203–11. doi: 10.1016/j.jbiomech.2017.10.026
20. Kazakia GJ, Burghardt AJ, Cheung S, Majumdar S. Assessment of bone tissue mineralization by conventional x-ray microcomputed tomography: comparison with synchrotron radiation microcomputed tomography and ash measurements. Med Phys (2008) 35(7):3170–9. doi: 10.1118/1.2924210
21. Roberts BC, Giorgi M, Oliviero S, Wang N, Boudiffa M, Dall'Ara E. The longitudinal effects of ovariectomy on the morphometric, densitometric and mechanical properties in the murine tibia: A comparison between two mouse strains. Bone (2019) 127:260–70. doi: 10.1016/j.bone.2019.06.024
22. Giavarina D. Understanding bland altman analysis. Biochemia Medica (2015) 25(2):141–51. doi: 10.11613/BM.2015.015
23. Verdelis K, Lukashova L, Atti E, Mayer-Kuckuk P, Peterson MGE, Tetradis S, et al. MicroCT morphometry analysis of mouse cancellous bone: Intra- and inter-system reproducibility. Bone (2011) 49(3):580–7. doi: 10.1016/j.bone.2011.05.013
24. Huang H, Skelly JD, Ayers DC, Song J. Age-dependent changes in the articular cartilage and subchondral bone of C57BL/6 mice after surgical destabilization of medial meniscus. Sci Rep (2017) 7(1):42294. doi: 10.1038/srep42294
25. Waarsing JH, Day JS, Weinans H. An improved segmentation method for In vivo μCT imaging. J Bone Mineral Res (2004) 19(10):1640–50. doi: 10.1359/JBMR.040705
26. Buie HR, Campbell GM, Klinck RJ, MacNeil JA, Boyd SK. Automatic segmentation of cortical and trabecular compartments based on a dual threshold technique for in vivo micro-CT bone analysis. Bone (2007) 41(4):505–15. doi: 10.1016/j.bone.2007.07.007
27. Loeser RF, Olex AL, McNulty MA, Carlson CS, Callahan M, Ferguson C, et al. Disease progression and phasic changes in gene expression in a mouse model of osteoarthritis. PloS One (2013) 8(1):e54633. doi: 10.1371/journal.pone.0054633
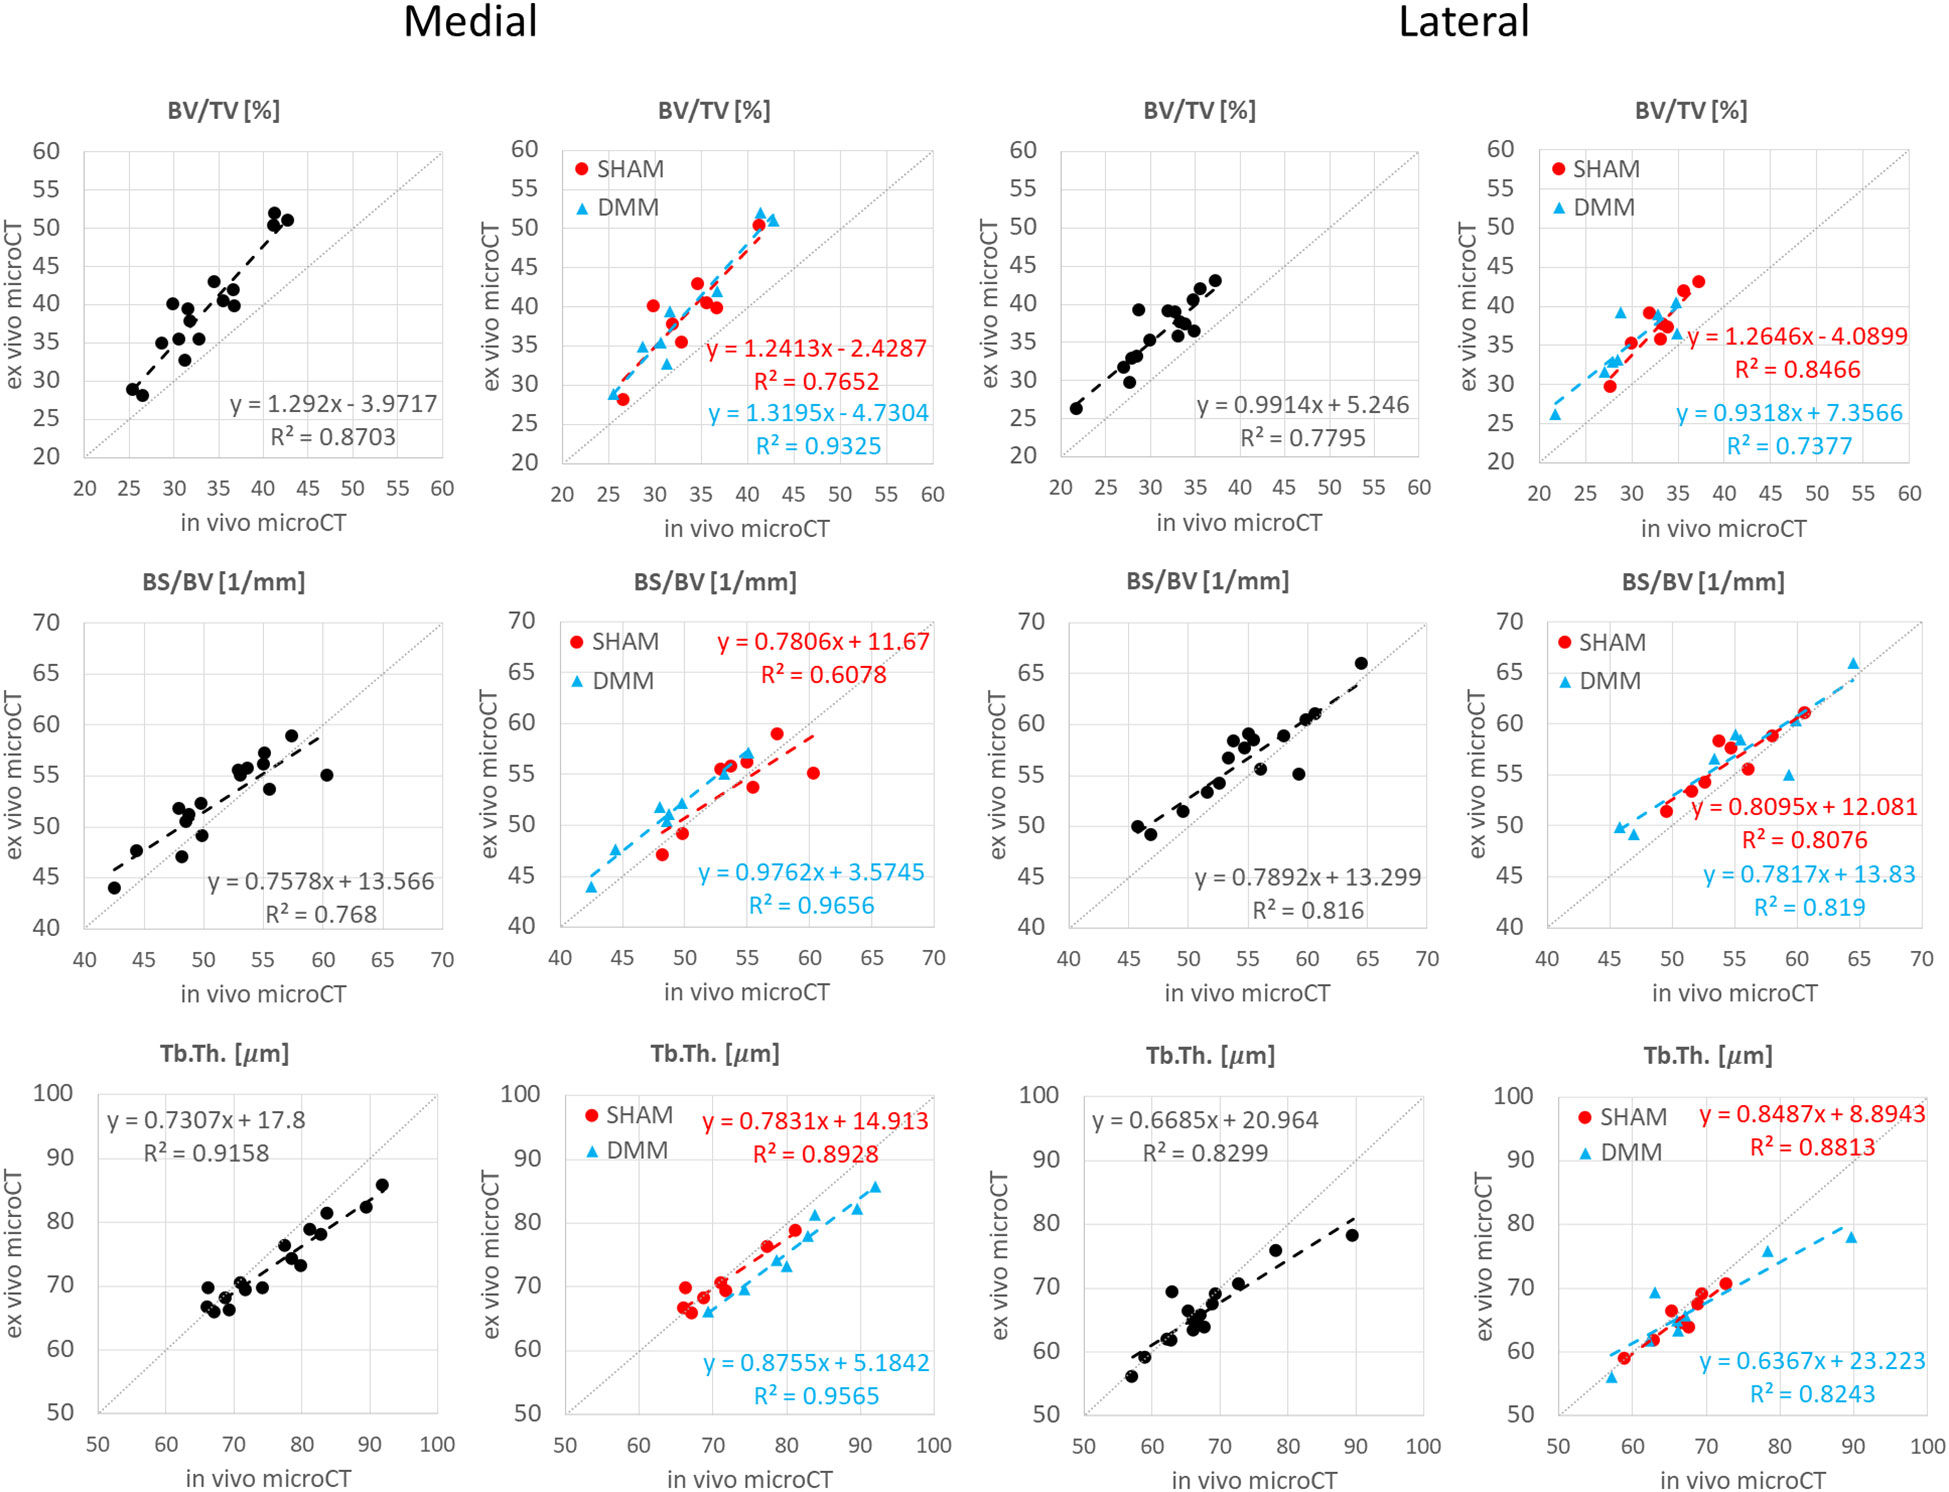
Figure A1 Regression analyses between in vivo and ex vivo measurements for bone volume fraction (BV/TV), bone surface fraction (BS/BV) and trabecular thickness (Tb.Th) in the medial and lateral compartments.
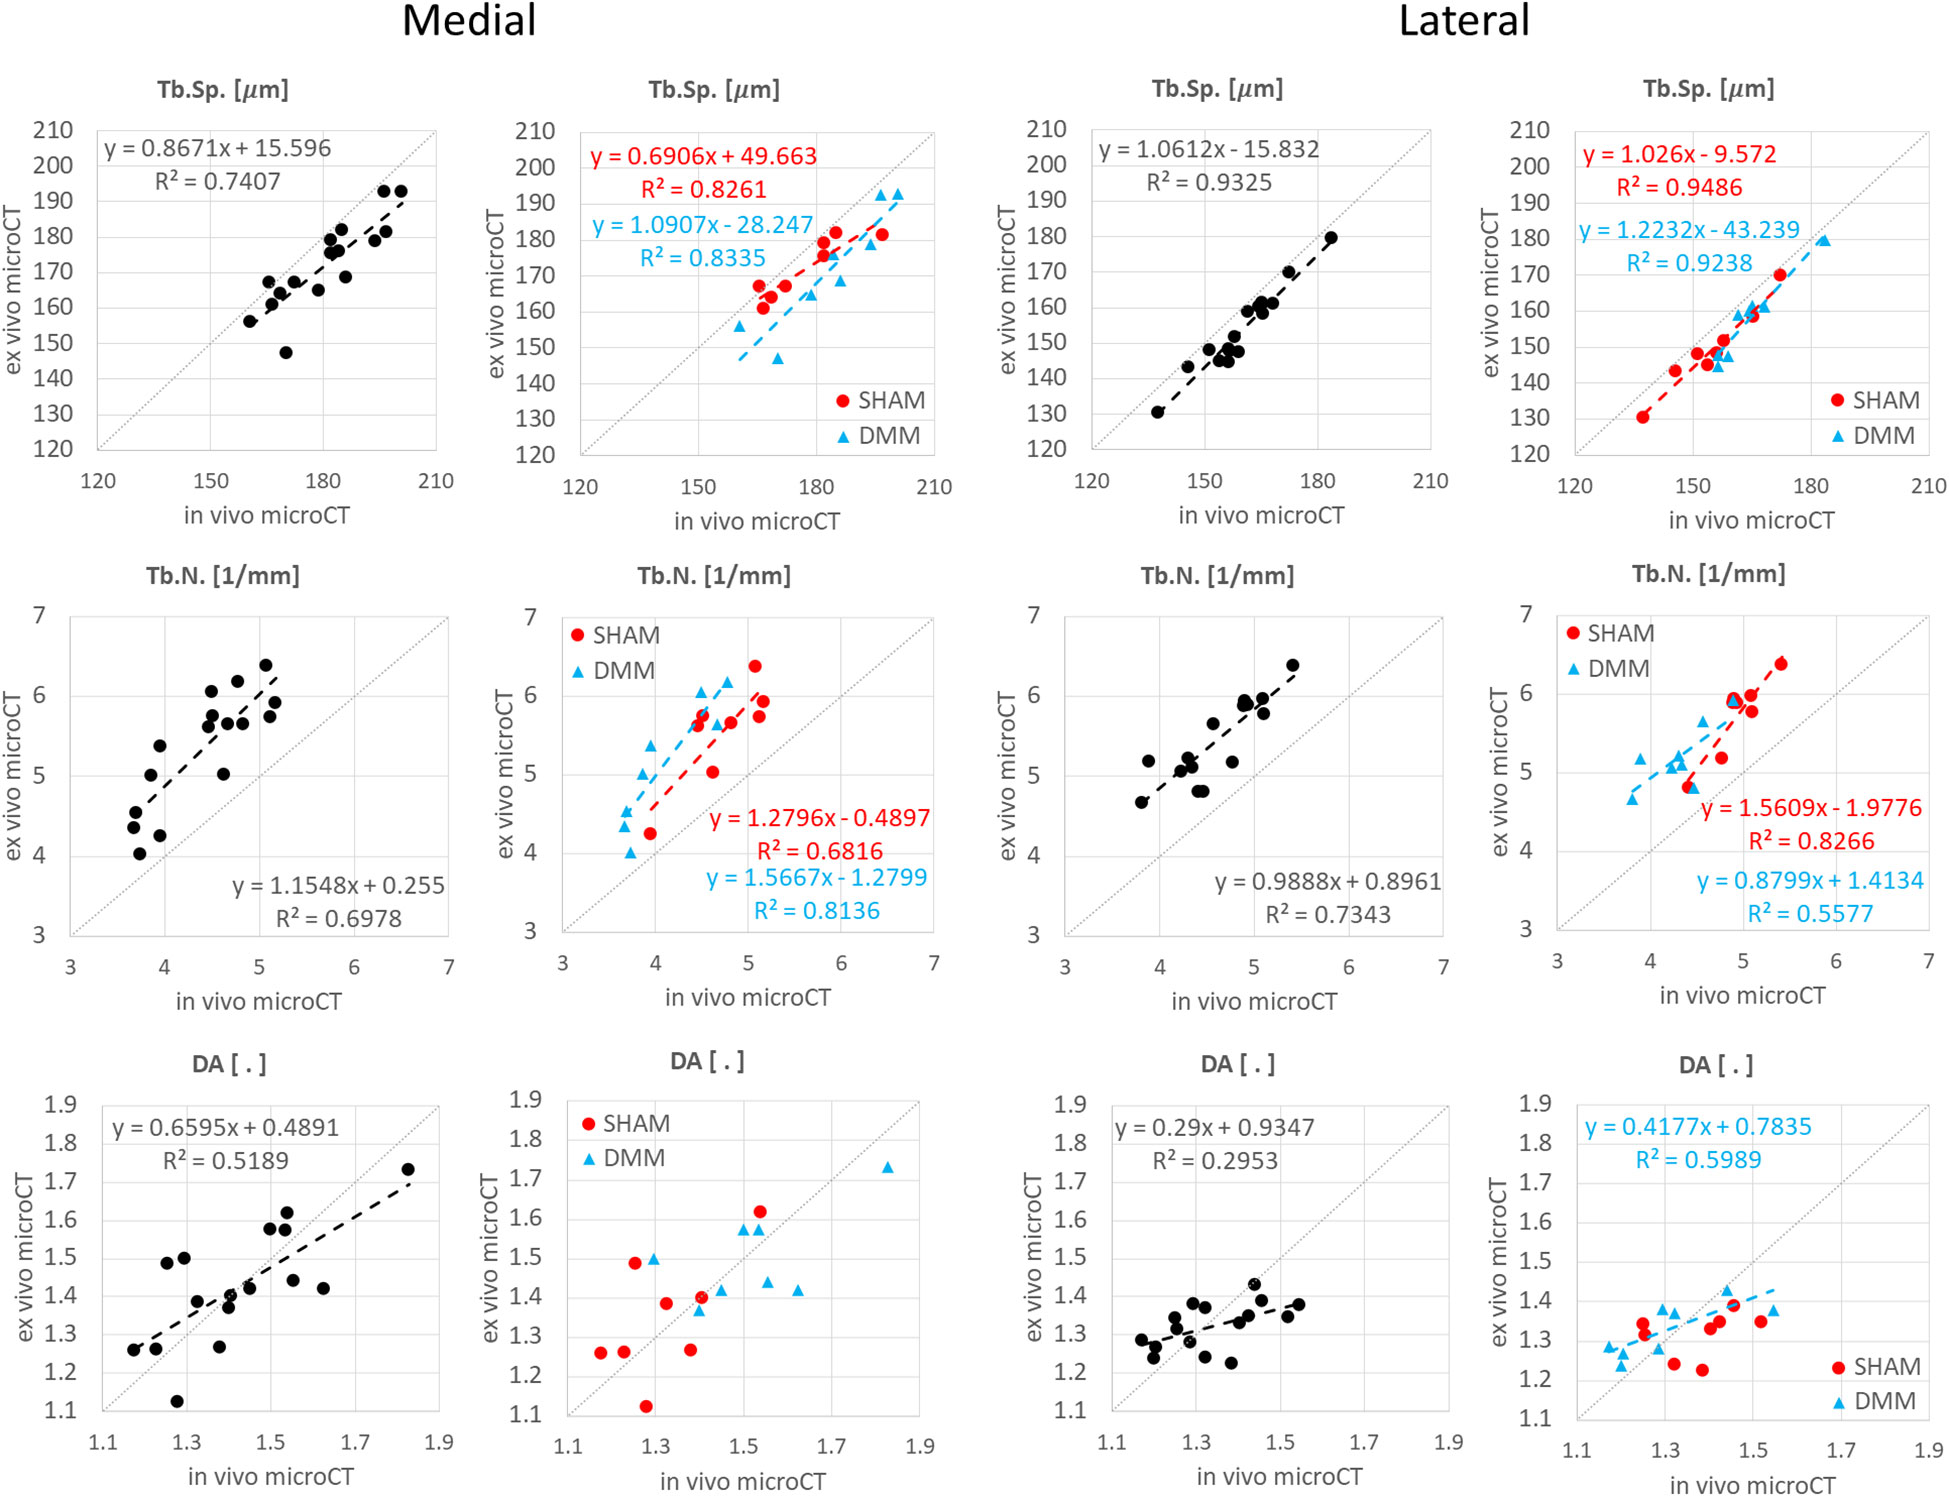
Figure A2 Regression analyses between in vivo and ex vivo measurements for trabecular separation (Tb.Sp), number (Tb.N) and degree of anisotropy (DA) in the medial and lateral compartments.
Keywords: osteoarthritis, mouse models, DMM, microCT, subchondral bone
Citation: Oliviero S, Millard E, Chen Z, Rayson A, Roberts BC, Ismail HMS, Bellantuono I and Dall’Ara E (2023) Accuracy of in vivo microCT imaging in assessing the microstructural properties of the mouse tibia subchondral bone. Front. Endocrinol. 13:1016321. doi: 10.3389/fendo.2022.1016321
Received: 10 August 2022; Accepted: 19 December 2022;
Published: 11 January 2023.
Edited by:
Phil Salmon, Bruker microCT, BelgiumReviewed by:
Carmen Huesa, University of Edinburgh, United KingdomCopyright © 2023 Oliviero, Millard, Chen, Rayson, Roberts, Ismail, Bellantuono and Dall’Ara. This is an open-access article distributed under the terms of the Creative Commons Attribution License (CC BY). The use, distribution or reproduction in other forums is permitted, provided the original author(s) and the copyright owner(s) are credited and that the original publication in this journal is cited, in accordance with accepted academic practice. No use, distribution or reproduction is permitted which does not comply with these terms.
*Correspondence: E. Dall’Ara, ZS5kYWxsYXJhQHNoZWZmaWVsZC5hYy51aw==
Disclaimer: All claims expressed in this article are solely those of the authors and do not necessarily represent those of their affiliated organizations, or those of the publisher, the editors and the reviewers. Any product that may be evaluated in this article or claim that may be made by its manufacturer is not guaranteed or endorsed by the publisher.
Research integrity at Frontiers
Learn more about the work of our research integrity team to safeguard the quality of each article we publish.