 Min Wang
 Jie Xu
 Na Yang
 Tianqi Zhang
 Huaijun Zhu
 Jing Wang
95% of researchers rate our articles as excellent or good
Learn more about the work of our research integrity team to safeguard the quality of each article we publish.
Find out more
ORIGINAL RESEARCH article
Front. Endocrinol. , 18 January 2022
Sec. Diabetes: Molecular Mechanisms
Volume 12 - 2021 | https://doi.org/10.3389/fendo.2021.807318
This article is part of the Research Topic Insights in Diabetes: Molecular Mechanisms 2021 View all 10 articles
Post-transplantation diabetes mellitus (PTDM) is a common metabolic complication after solid organ transplantation, which not only results in elevated microvascular morbidity, but also seriously impacts graft function and recipient survival. However, its underlying mechanism is not yet fully understood. In this study, an integrated liquid chromatography- mass spectrometry (LC-MS) and gas chromatography-mass spectrometry (GC-MS) based-metabolomics approach was adopted to dissect the metabolic fluctuations and deduce potential mechanism associated with PTDM. 68 adult liver transplant recipients were recruited and classified as 32 PTDM and 36 non-PTDM subjects. PTDM group and non-PTDM group were well matched in gender, age, BMI, family history of diabetes, alcohol drinking history, ICU length of stay and hepatitis B infection. Peripheral blood samples from these recipients were collected and prepared for instrument analysis. Data acquired from LC-MS and GC-MS demonstrated significant metabolome alterations between PTDM and non-PTDM subjects. A total of 30 differential metabolites (15 from LC-MS, 15 from GC-MS) were screened out. PTDM patients, compared with non-PTDM subjects, were characterized with increased levels of L-leucine, L-phenylalanine, LysoPE (16:0), LysoPE (18:0), LysoPC (18:0), taurocholic acid, glycocholic acid, taurochenodeoxycholic acid, tauroursodeoxycholic acid, glycochenodeoxycholic acid, glycoursodeoxycholic acid, etc, and with decreased levels of LysoPC (16:1), LysoPC (18:2), LysoPE (22:6), LysoPC (20:4), etc. Taken collectively, this study demonstrated altered metabolites in patients with PTDM, which would provide support for enhancing mechanism exploration, prediction and treatment of PTDM.
Solid organ transplantation (SOT), with more than 110,000 transplantations performed worldwide annually (1), is the treatment of choice for patients with end-stage organ failure. The short-term outcome of SOT improved remarkably due to advances in organ preservation (2), surgical techniques (3), immunosuppression regimens (4) and so on. However, metabolic complications, such as diabetes mellitus, hypertension and dyslipidemia, severely impact the long-term survival (5, 6).
Diabetes mellitus after SOT, defined as post-transplantation diabetes mellitus (PTDM), is considered to be a variant of type 2 diabetes mellitus (T2DM). PTDM is formally diagnosed at least 45 days post-transplantation and has a sudden onset within the first year post-transplantation (7). The reported prevalence of PTDM varies from 30% to 40% in liver recipients, 10% to 40% in renal recipients and 20% to 40% in other SOT recipients (8). PTDM is one of the major risk factors for diabetes-associated microvascular complications and infections, contributing to 1.63 times higher risk of graft failure and 1.87 times higher risk of mortality in SOT recipients (9).
Despite the prevalence and unfavorable outcomes associated with PTDM, the mechanism underlying PTDM is not entirely known. Over the past few decades, scientists devoted to evaluate factors affecting PTDM occurrence, such as age, gender, hepatitis infection, family history of type II diabetes mellitus, body mass index and immunosuppressive agents (10–12). Since PTDM is a serious frequent metabolic complication characterized by hepatic glucose overproduction, insulin hyposecretion and resistance, it is reasonably assumed that many metabolites and pathways are quite likely to be interrupted and play a critical role in the whole-body metabolic dysfunction. Thus, the comprehensive measurement and characterization of altered metabolites could give insights into the metabolic mechanism of PTDM.
Metabolomics is an invaluable tool for reflecting a series of biological processes underlying metabolic homeostasis and their complex association with peculiar disease, lifestyle, or genetic modifications, etc (13). Compared to targeted metabolomics focusing on well-defined metabolites, untargeted metabolomics aims at the qualitative or quantitative monitoring of all low-molecular-weight metabolites in a biological fluid and has been widely used to discover specific metabolic patterns of diseases (14). A range of analytical platforms including gas chromatography-mass spectrometry (GC-MS) (15), liquid chromatography-MS (LC-MS) (16), nuclear magnetic resonance (NMR) spectroscopy (17) and direct infusion MS (18) have been widely applied in metabolomics area. Among these, GC-MS and LC-MS are the two most powerful and commonly used analytical techniques owing to their high resolution of the chromatographic system, high sensitivity of MS detector and wide detection magnitude during the qualification and quantification of metabolites. Moreover, since no single analytical platform can cover the entire metabolome in a biological sample, the integration of GC-MS and LC-MS would serve as an appropriate strategy to capture a broader spectrum of metabolites (19, 20).
In this study, we aimed to primarily screen out the differentially expressed metabolites in PTDM and explore its potential pathophysiological mechanism by analyzing the metabolomic characteristics of PTDM recipients with the aid of the integrated liquid chromatography- mass spectrometry (LC-MS) and gas chromatography-mass spectrometry (GC-MS) based-metabolomics. For the first time to our knowledge, the metabolic profiles involved in PTDM were explored, which would provide novel insights into the underlying mechanisms of PTDM from the perspective of metabolomics.
Adult (age ≥ 18 years) liver transplant recipients who had undergone primary liver transplantation between July 2019 and June 2020 at the Affiliated Drum Tower Hospital of Nanjing University Medical School, China were enrolled in this study. Patients were excluded if they were followed up less than one year after transplantation, underwent ABO incompatible transplantation, received a multi-organ transplantation, had diabetes mellitus prior to transplantation or developed acute rejection. The receipts received a standard triple-drug immunosuppression regimen including tacrolimus, mycophenolate mofetil and corticosteroids.
The experimental protocol was reviewed and approved by the Ethics Committee of the Affiliated Drum Tower Hospital of Nanjing University Medical School (No. 2020-053-01). Signed informed consent was exempted due to the deidentified data provided to researchers and residual biosamples used.
According to the International Consensus Meeting on PTDM (7), PTDM is diagnosed at least 45 days post-transplantation using the American Diabetes Association (ADA) criteria for type 2 diabetes mellitus: with symptoms of diabetes plus random plasma glucose ≥ 200 mg/dL (11.1 mmol/L) or fasting plasma glucose ≥126 mg/dL (7.0 mmol/L) or 2-h plasma glucose after an oral glucose ≥200 mg/dL (11.1 mmol/L) during an OGTT or glycated hemoglobin (HbA1c) ≥6.5%. In this study, 32 and 36 recipients were assigned into the PTDM group and the non-PTDM group, respectively. Peripheral blood samples from these recipients were collected after overnight fasting at time of PTDM diagnosis and centrifugated at 1760 g for 10 min to prepare plasma. All the plasma samples were then divided into aliquots and stored at -80°C until analysis.
Plasma was thawed in a refrigerator at 4°C and thoroughly vortexed with seven times pure ice-cold acetonitrile for 5 min. The mixture was then centrifuged two times at 18407 g for 10 min at 4°C prior to injection into LC-MS system.
Chromatographic separation was achieved on Shimadzu Prominence series ultra-fast liquid chromatography (UFLC) system equipped with Phenomenex Kinetex C18 column (100×2.1 mm, 2.6μm; Phenomenex, Torrance, CA, USA) and a guard column, SecurityGuard ULTRA cartridge UHPLC C18 for 2.1 mm ID column (Phenomenex, Torrance, CA, USA). The column and autosampler were set at 40°C and 4°C, respectively. The gradient elution involved a mobile phase consisting of acetonitrile (mobile phase A) and 0.1% formic acid (mobile phase B) with a gradient program as follows: 5%-95% A, 0-20 min and 95%A, 20-23 min. The mobile phase was directly delivered into mass spectrometer at 0.4 mL/min, and the injection volume was 5 μL.
Mass spectrometry was performed on an ion trap/time-of-flight hybrid mass spectrometry with an electrospray ionization (ESI) source (IT/TOF-MS, Shimadzu, Japan). The mass spectrometer was operated simultaneously in positive and negative electrospray ionization modes by switching the interface voltage between 4.5 kV and -3.5 kV. The other parameters were set as follows: curved desorption line (CDL) temperature, 200°C; heat block temperature, 200°C; microchannel plate detector voltage, 1.65 kV; nebulizer gas (N2), 1.5 L/min; drying gas (N2), 10.0 L/min; collision energy, 10%, 30% and 60%. MS/MS analyses were conducted in data dependent acquisition, in which precursor ions are serially fragmented to generate their corresponding product-ion spectra. Product-ion spectra were acquired automatically in advance for a large number of ions. Furthermore, if the MS/MS information of the selected discriminating variables was missing, the product ion spectrum for these variables were acquired independently in manual mode. External calibration using the sodium trifluoroacetate was adopted to regulate the MS and MS/MS data.
The plasma was prepared with a two-step derivatization procedure, that is, alkylation and silylation, according to previous reports with a few modifications (21, 22). Briefly speaking, a 10 µL aliquot of plasma was thoroughly vortexed with ten times methanol followed by centrifuged at 18047g at 4°C for 10 min in two cycles. Then 80 μL supernatant was transferred to a brown glass vial and oximated with 25 μL methoxyamine hydrochloride (10 mg/mL in pyridine) at 4°C for 90 min. Finally, the mixture was vacuum-dried and silylated with 120 μL N-methyl-N-(trimethylsilyl) trifluoroacetamide (MSTFA) at 27°C for 120 min to separate for GC-MS analysis.
GC-MS analysis was performed using GC/MS-QP2010 Ultra (Shimadzu Inc., Kyoto, Japan) equipped with an electron impact source operating in positive mode with the energy of 70 eV. Separation was achieved on a fused silica capillary column (Rtx-5MS; 30.0 m× 0.25 mm, 0.25 µm, Restek, USA) with a programmed temperature vaporization. The initial oven temperature was held at 70°C for 3 min, ramped to 320°C at a rate of 10°C/min, and finally held at 320°C for 2 min. The injection was performed in split mode (1: 50). Helium (>99.999%) was used as the carrier gas at a constant flow rate of 1.0 mL/min. For mass detection, full scan with a mass range of m/z 45-600 was adopted, and the ion source temperature was set at 200°C.
To assure the robustness of analytical system and an acceptable level of data quality for non-targeted metabolomics, pooled QC samples, prepared by mixing equal volumes of each analyzed sample (23), were injected at the beginning of the batch to condition the analytical platform and then almost every six samples to monitor the system. The metabolic features that are detected in < 80% of QC samples (80% rule) and those with a relative standard deviation (RSD), as calculated for the QC samples, of > 30% (RSD 30% rule) were removed (20). The quality assurance procedure was performed to remove metabolic features with poor repeatability.
The obtained LC-MS and GC-MS raw data files were processed using Profiling Solution version 1.1 (Shimadzu, Japan) for peak detection, matching, and alignment. After filtered by “80% rule” and “RSD 30% rule”, missing values replacement and total ion intensity normalization, the resulting data was imported to SIMCA software 13.0 package (version 13.0; Umetrics, Umeå, Sweden) for multivariate statistical analysis including principal component analysis (PCA) and orthogonal partial least squares discriminant analysis (OPLS-DA). Ions with variable importance in the projection (VIP) exceeding 1.0 in the OPLS-DA model and P-value adjusted by Benjamini-Hochberg method (pFDR) below 0.05 (24) were retained for further identification. Spearman correlation analysis was then applied to explore the correlations between differential metabolites and clinical indices of recipient.
The differential ions generated from LC-MS were tentatively identified based on the public online databases, such as the Human Metabolome Database (http://www.hmdb.ca) and the Metlin database (http://metlin.scripps.edu) and confidently annotated by matching retention time and mass characteristics with those of in-house standards (25); meanwhile, those from GC-MS were characterized by comparing the standard mass fragments in National Institute of Standards and Technology Research Library based on >70% similarity index (26) and confirmed with the characteristics of the authentic standards available in our lab.
To visualize and interpret the metabolic pathways related to PTDM, the differential metabolites were imported into MetaboAnalyst 5.0, which is a free web-based tool that uses the high-quality KEGG metabolic pathway database as the backend knowledge-base. Meanwhile, Cytoscape (http://www.cytoscape.org), a highly popular Java-based open source software tool, was adopted to visualize and analyze metabolite, gene and protein interaction networks. The list of differential metabolites (compound names or KEGG IDs) were first loaded in the Metscape, a plugin for Cytoscape, to construct the compound-reaction-enzyme-gene network. Then, the network centrality parameters, such as degree, betweenness, and centroid value, were computed by CentiScaPe, another plugin for Cytoscape, to extract the core subnetwork.
A total of 68 recipients, including 32 PTDM subjects and 36 non-PTDM subjects were recruited. The baseline demographic characteristics and clinical data of the two groups were presented in Table 1. PTDM group and non-PTDM group were well matched with no significant difference in gender, age, BMI, family history of diabetes, alcohol drinking history, ICU length of stay and hepatitis B infection.
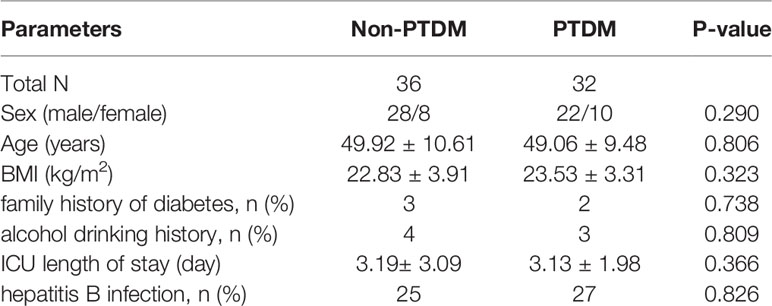
Table 1 Clinical characteristics of the recruited PTDM and non-PTDM recipients.
Typical total ion chromatograms (TICs) of PTDM and non-PTDM recipients were presented in Supplementary Figure 1. However, there was no visual difference in metabolic profiles between PTDM group and non-PTDM group. Therefore, PCA, an unsupervised method of multivariate analysis, was first performed to get an overview of the difference on the metabolic profiles. Outliers were checked using the Hotelling T2 range, adopting 95% and 99% confidence limits for suspect and strong outliers, respectively. Two patients from the PTDM group appeared out of Hotelling’s ellipse at the 99% confidence. These two outliers shared the common feature that their liver function parameters, i.e. aspartate aminotransferase and alanine aminotransferase, were abnormal, and one of them died at the third year post-operation. Since then, the two outliers were removed, multivariate analysis was re-performed. As shown in Supplementary Figure 2, except two samples which lay between 95% and 99% Hotelling T2 ellipse, all of the remaining samples lay inside the 95% Hotelling T2 ellipse. Tight clustering of QC samples was observed in PCA score plots (Figures 1A, D, G), giving some confidence that the analytical process was running robustly providing reproducible metabolic profiles.
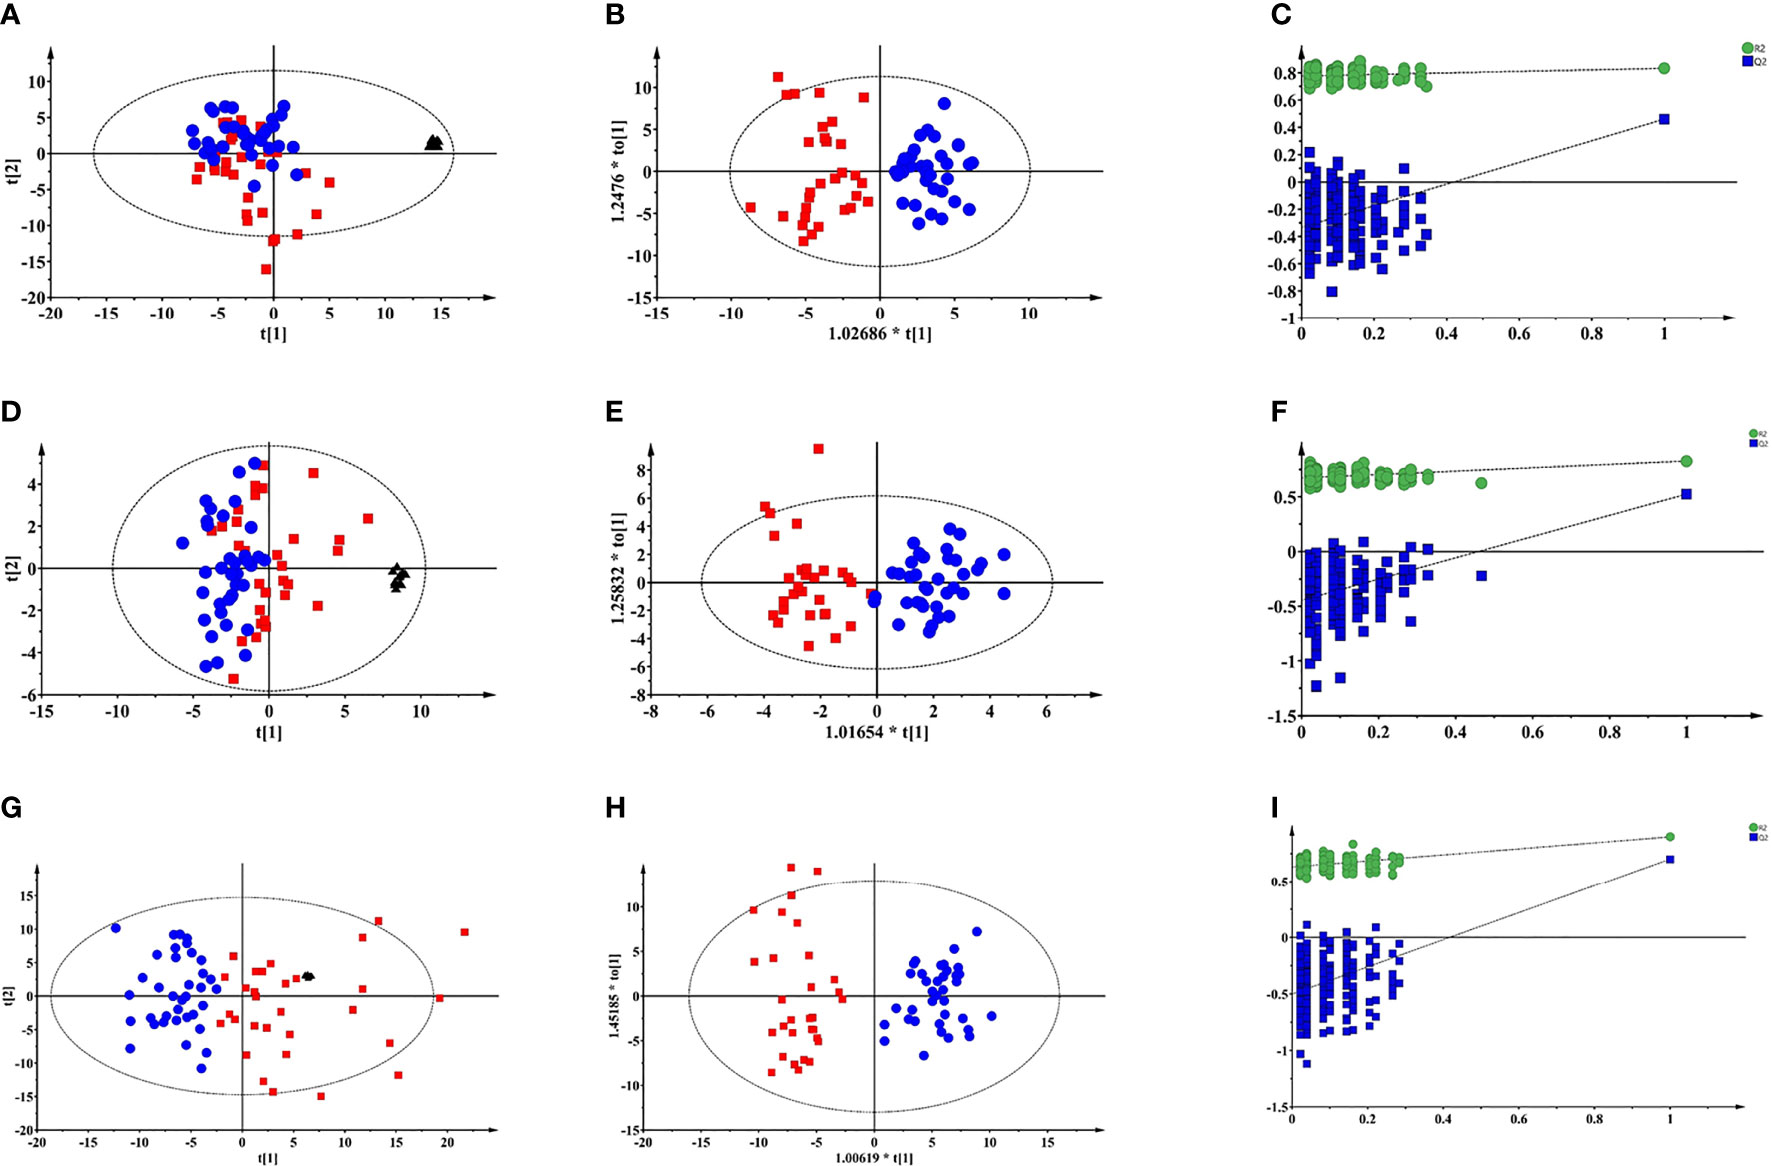
Figure 1 Multivariate modelling of LC-MS and GC-MS data after log transformation and pareto scaling. (A) PCA score plot of LC-MS (+) data: R2X=0.527, Q2 = 0.322; (B) OPLS-DA score plot of LC-MS (+) data: R2X=0.131, R2Y=0.782, Q2 = 0.502, CV-ANOVA p value = 1.0e-10; (C) the 200-permutation test of LC-MS (+) data; (D) PCA score plot of LC-MS (-) data: R2X=0.613, Q2 = 0.255; (E) OPLS-DA score plot of LC-MS (-) data: R2X=0.165, R2Y=0.816, Q2 = 0.535, CV-ANOVA p value =2.4 e-9; (F) the 200-permutation test of LC-MS (-) data; (G) PCA score plot of GC-MS data: R2X=0.681, Q2 = 0.458; (H) OPLS-DA score plot of GC-MS data: R2X=0.301, R2Y=0.899, Q2 = 0.701, CV-ANOVA p value =8.0e-14; (I) the 200-permutation test of LC-MS (+) data:. Blue circles: non-PTDM; red squares: PTDM; black triangles: QC.
As depicted in PCA score plots (Figures 1A, D, G), there was a visual separation between PTDM and non-PTDM groups, indicating metabolic disorders in PTDM. Furthermore, supervised OPLS-DA was introduced to maximize the separation and dig out differential metabolites. All the three models produced a goodness of prediction with Q2 > 0.5 and the differences between R2Y and Q2 <0.3 (27) (Figures 1B, E, H). Furthermore, permutation test (200 times) and CV-ANOVA were performed to validate the generated models (28). For the permuted R2 and Q2, all the values were lower than their corresponding original ones, the intercepted value of Q2 in the vertical axis was below 0 and p-values of CV-ANOVA for all models were below 0.05 (Figures 1C, F, I), demonstrating high goodness of fit for the generated OPLS-DA models.
Moreover, the combination of VIP>1 and pFDR<0.05 was applied to screen out the differential metabolites between PTDM and non-PTDM. As a result, a total of 37 differential metabolites (21 from LC-MS, 16 from GC-MS) were identified. Furthermore, Spearman correlation analysis was adopted to explore the correlations between these differential metabolites and fasting plasma glucose. Based on the correlation coefficients, L-valine, LysoPE (20:4), LysoPE (18:2), LysoPC (20:2), LysoPC (18:1), LysoPC (16:0) and LysoPC (14:0) were removed because of the weak correlation (-0.3 < Spearman correlation coefficients < 0.3) (Supplementary Figure 3). Finally, a total of 30 differential metabolites (15 from LC-MS, 15 from GC-MS) were retained for further analysis. The detailed information including compound name, molecular formula, retention time and fold change value were shown in Table 2 (GC-MS data) and Table 3 (LC-MS data). These 30 differential metabolites annotated six main classes, including eight amino acids, seven glycerophospholipids, six bile acids (BAs), three carbohydrates, three long-chain fatty acids and others (Figure 2A). Furthermore, the contents variations of differential metabolites were depicted as a heatmap (rows correspond to metabolites, columns to samples, red and green denote increased and decreased signals in PTDM group compared with non-PTDM group) in Figure 2B.
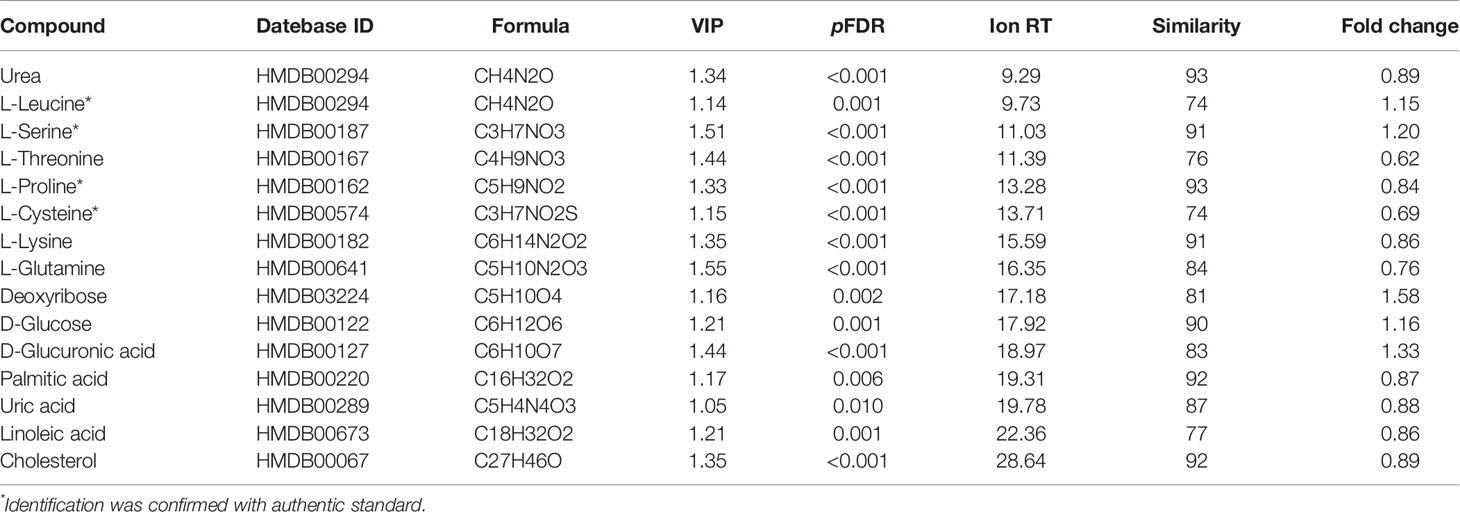
Table 2 Differential metabolites identified by GC-MS.
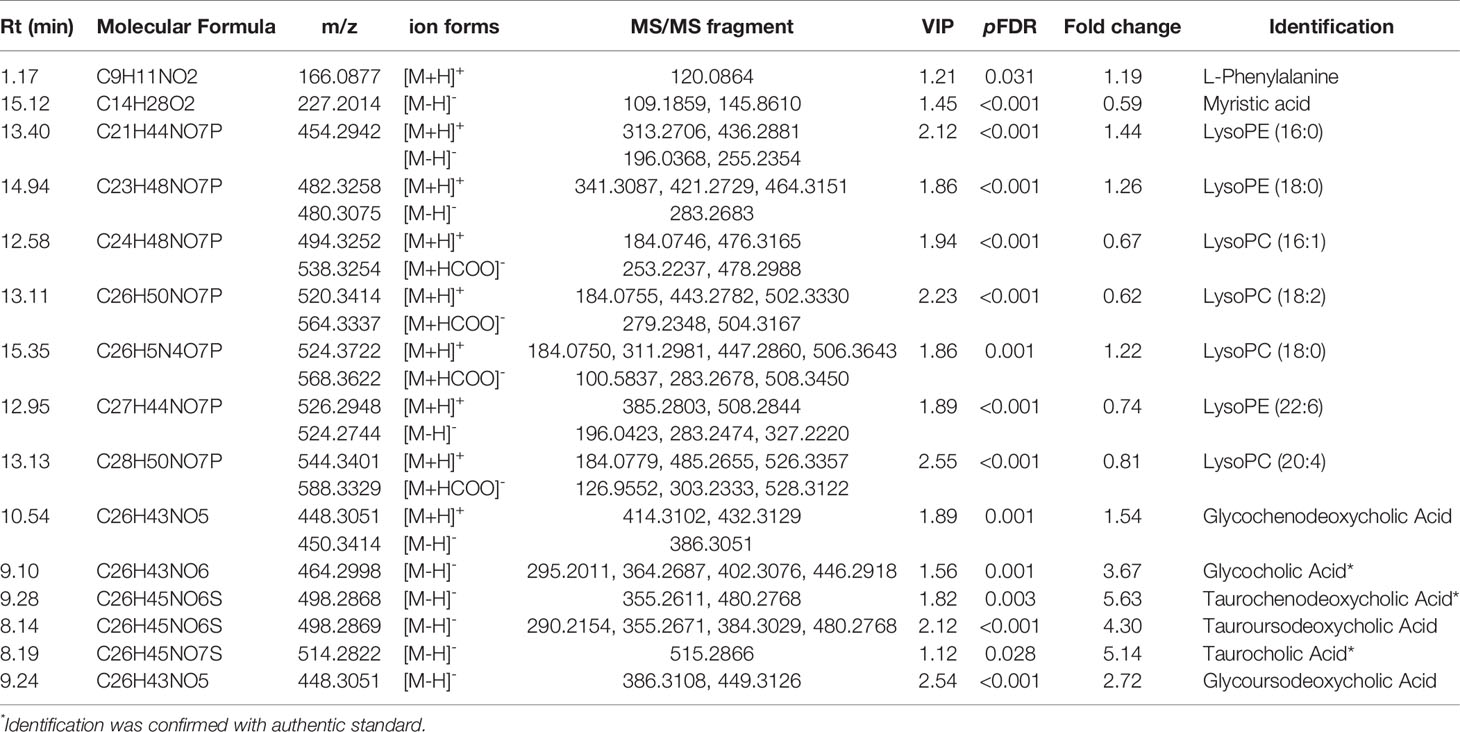
Table 3 Differential metabolites identified by LC-MS.
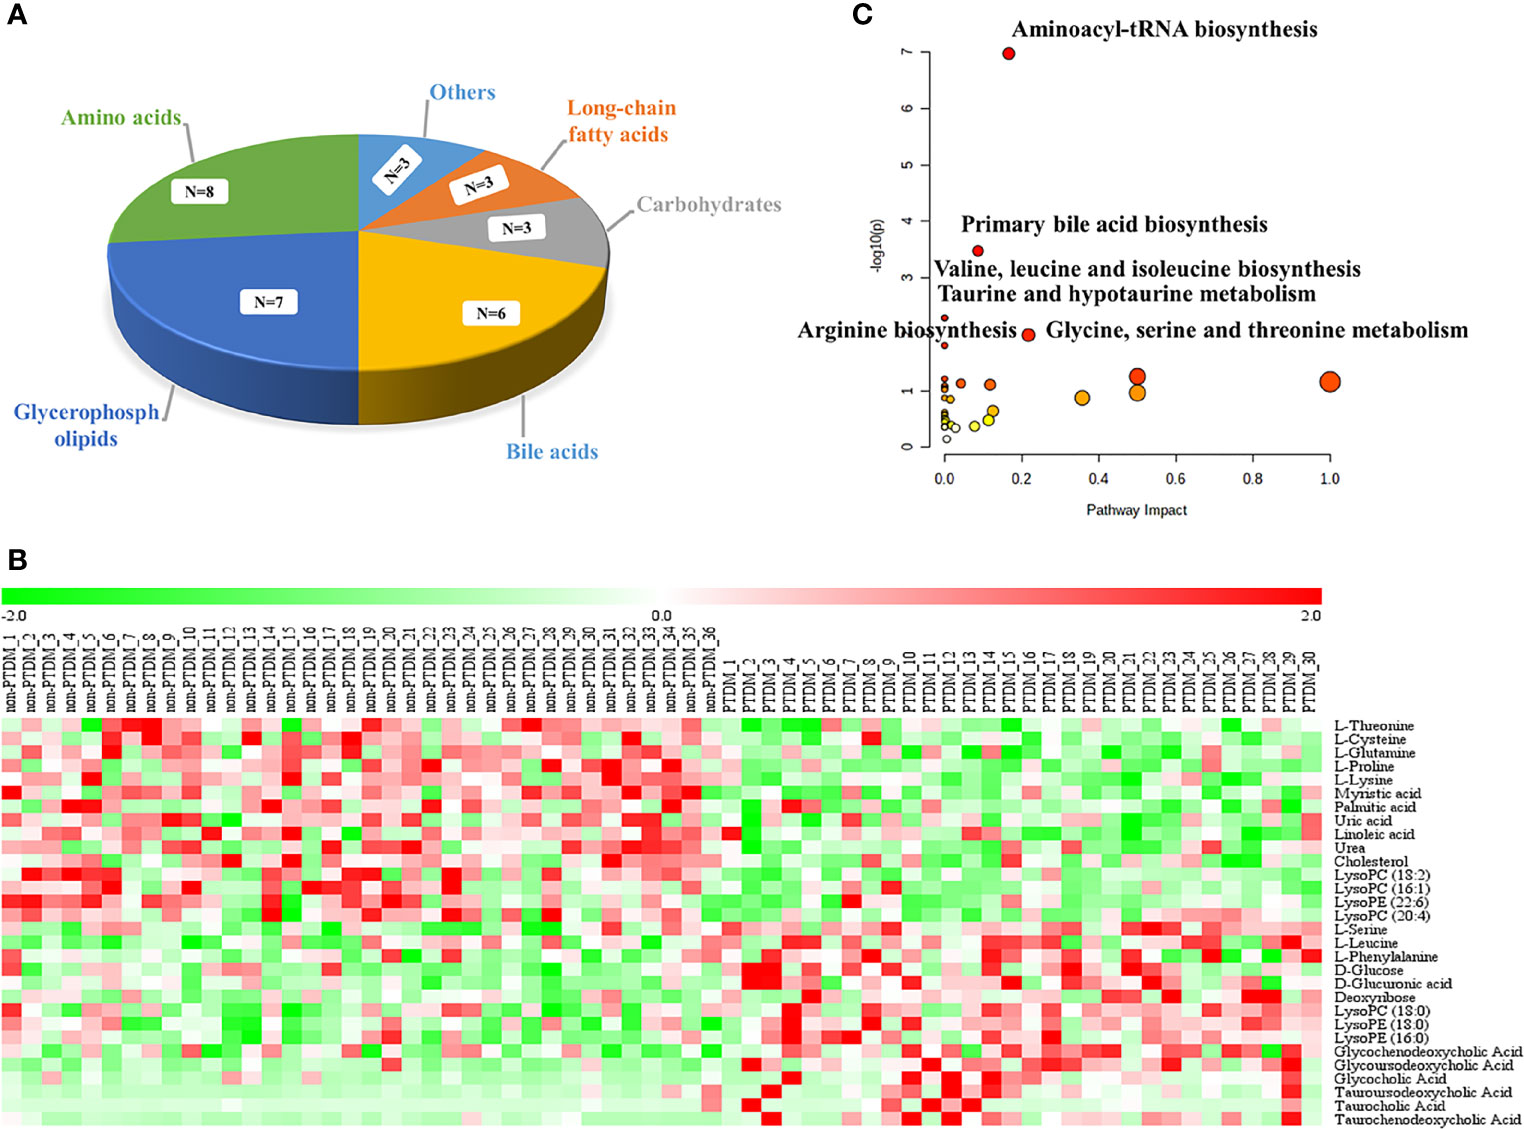
Figure 2 Analysis of the differentially expressed metabolites. (A) classification of the 30 identified differentially expressed metabolites; (B) Heat map of the differentially expressed metabolites in each group. Rows, samples; columns, metabolites. The red band indicates an increased level of metabolites, while the green band indicates a decreased level of metabolites in PTDM group compared with non-PTDM group; (C) Summary of the altered metabolism pathways determined with MetaboAnalyst v. 5.0.
To explore potential metabolic pathways involved in PTDM, the differential metabolites were imported into MetaboAnalyst for functional enrichment analysis and network topology analysis. Results (Figure 2C) indicated that aminoacyl-tRNA biosynthesis, valine, leucine and isoleucine biosynthesis, primary bile acid biosynthesis, taurine and hypotaurine metabolism, glycine, serine and threonine metabolism, arginine biosynthesis with p-value less than 0.05 were the critical disturbed pathways involved in progression of PTDM (29, 30). To clearly elucidate the possible underlying mechanism of PTDM, a hypothetical metabolic network was reconstructed by using these differential metabolites, with the direction of the content change labeled (Figure 3A).
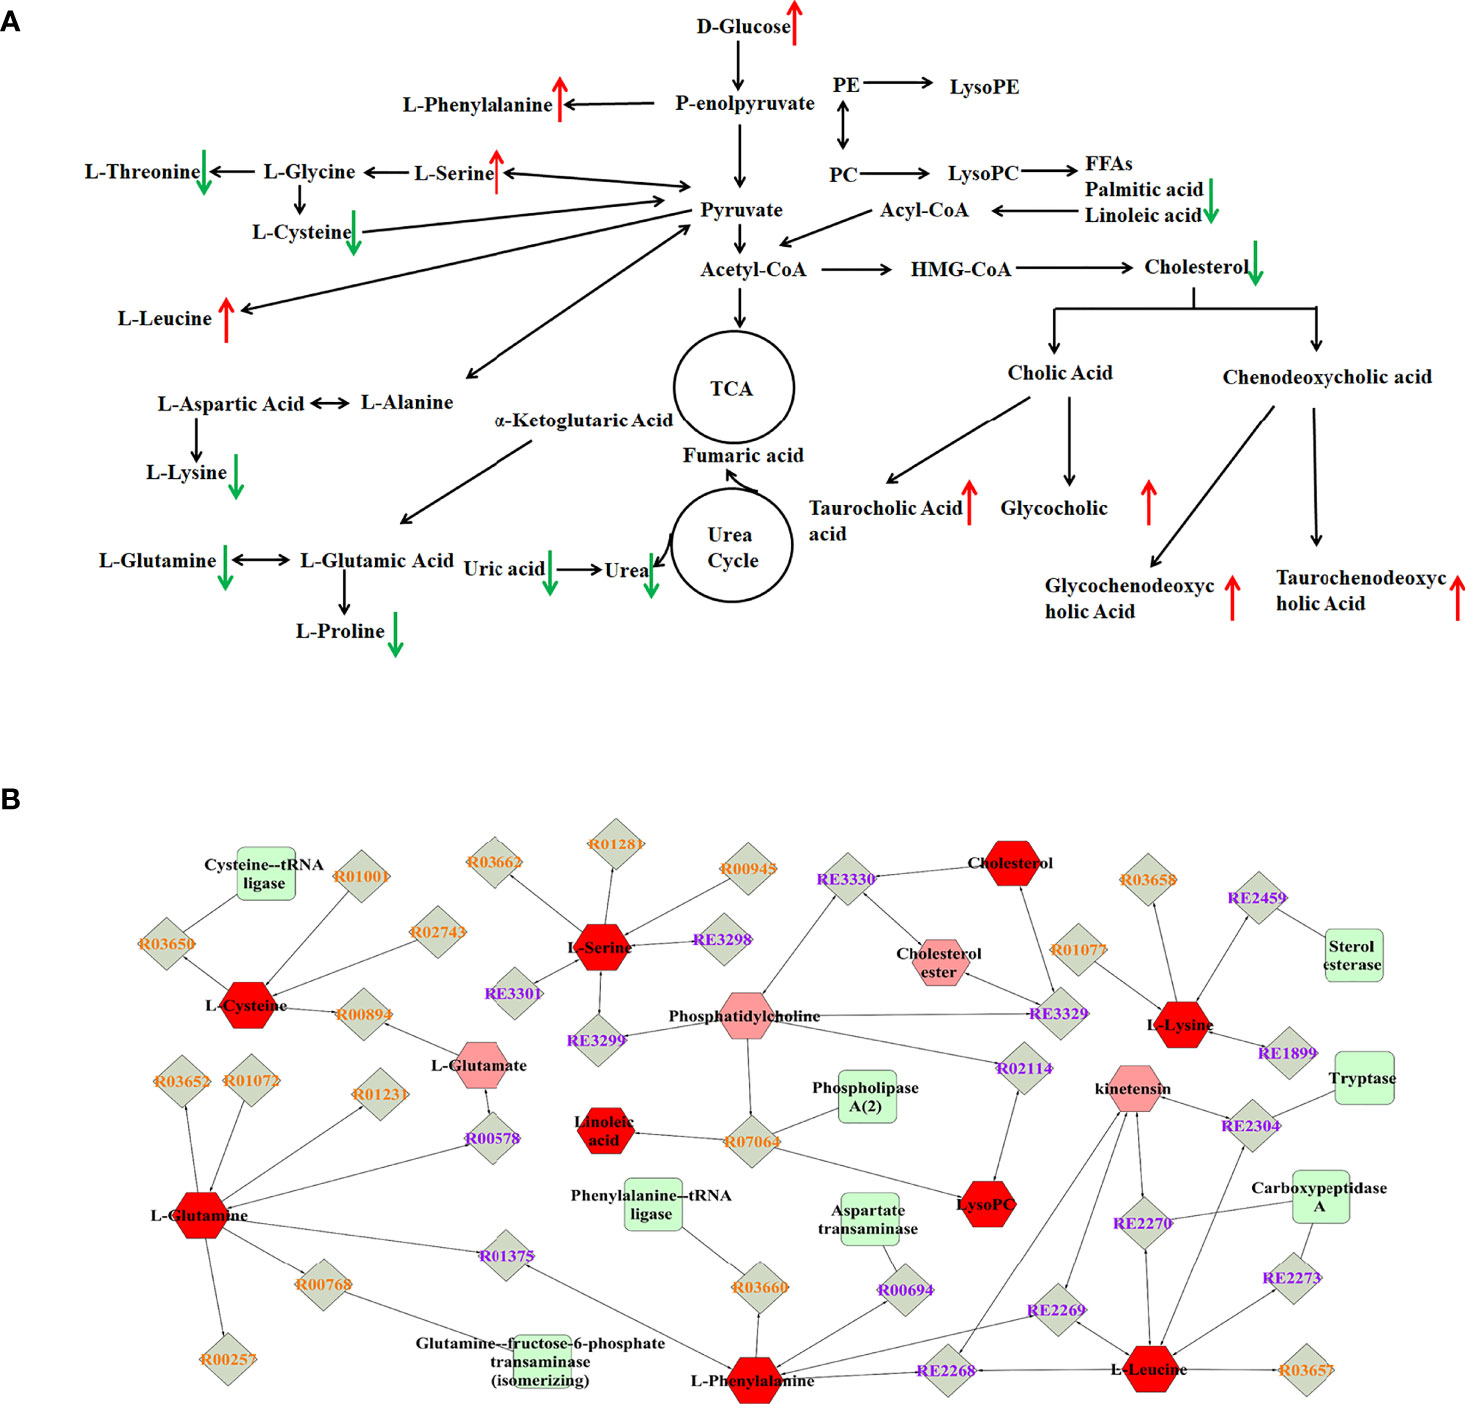
Figure 3 Analysis of potential biomarkers and related pathways. (A) Schematic overview of metabolic pathways based on the differentially expressed metabolites. The metabolites indicated with red or green arrows represent increased or decreased levels, respectively, in PTDM group. (B) The compound-reaction-enzyme-gene subnetwork. Red hexagons represent the identified differentially expressed metabolites. Green squares represent enzymes which might regulate the identified metabolites. Grey diamonds represent reactions catalyzed by those enzymes.
Moreover, the MetScape plugin for Cytoscape was used to construct the compound-reaction-enzyme-gene network based on the 30 differential metabolites (31). Among them, LysoPCs, and LysoPEs were regarded as category IDs. Additionally, for some metabolites, such as tauroursodeoxycholic acid (TUDCA), glycoursodeoxycholic acid (GUDCA) and glycochenodeoxycholic acid (GCDCA) were not retrieved in the MetScape plugin or KEGG database. Hence, there were 542 nodes containing 154 compounds, 112 reactions, 87 enzymes and 189 genes in the network (Supplementary Figure 4). Then, the node centrality indexes, namely degree, betweenness, and centroid value, were calculated to extract the core subnetwork displaying a critical role in the process of PTDM (32). As shown in Figure 3B, nine metabolites, namely linoleic acid, L-leucine, L-glutamine, L-phenylalanine, L-cysteine, cholesterol, L-serine, L-lysine, and LysoPC, were selected as hub metabolites. Meanwhile, eight enzymes, such as aspartate transaminase, phospholipase A2 and tryptase, were involved in this subnetwork.
As a frequent metabolic complication, PTDM seriously affects the life quality and long-term survival of recipients. However, data on the mechanism of PTDM are scarce. Beyond this, the treatment is based on expert experience rather than research-based evidence at the current stage. Metabolomics, encompassing the comprehensive and systematic profiling of multiple metabolites, is a promising approach to provide an understanding of physiological and pathological status of the living organism. Nevertheless, reports on the adoption of metabolomics to describe the metabolic profiles and pathways involved in PTDM have not been published. In this study, for the first time to our knowledge, the metabolic profiles and pathways involved in PTDM were explored by the integrated LC-MS and GC-MS based-metabolomics, which aimed to provide novel insights into the underlying pathophysiological mechanisms of PTDM. All individuals enrolled in our study were free of diabetes pre-transplantation and matched on gender, age, BMI, family history of diabetes, alcohol drinking history, ICU stay length and hepatitis to minimize confounding factors.
The integrated untargeted metabolomics revealed that 30 significantly changed metabolites, among which 15 decreased and 15 increased, possibly contributed to the development of PTDM. Based on their chemical structure, these significantly changed metabolites mainly belongs to the classes of amino acids, bile acids, glycerophospholipids and others.
Our findings highlighted several amino acids, particularly the branched-chain amino acids (BCAAs) and aromatic amino acids (AAAs), were noteworthy and might be served as biomarkers of PTDM. BCAAs (leucine, isoleucine and valine) and AAAs (tyrosine, phenylalanine and tryptophan) have been proven to be potential contributors to the development of insulin resistance and diabetes in both humans (33) and rodent models (34). A nested case-control study in the Framingham Offspring Study comprising 2422 normoglycemic individuals followed for 12 years indicated that plasma levels of three BCAAs (isoleucine, leucine, valine) and two AAAs (tyrosine and phenylalanine) exhibited highly significant associations with the future development of T2DM (35). Furthermore, a meta-analysis focusing on dietary BCAAs intake and T2DM showed that oral BCAAs supplementation is positively associated with T2DM risk (36). The same result was found in double AAAs intake to mice (37). Our results also suggested L-phenylalanine and L-leucine increased in participants with PTDM. Since BCAAs and AAAs (expect tyrosine) are essential amino acid which must be obtained from the diet, their elevated circulating levels might be the result of excess intake and/or disruption of their catabolic process. However, epidemiological results are controversial, with some indicating that a diet high in BCAAs were positively associated with circulating levels (38), while others not (35). Since then, we inferred that the elevated circulating levels of BCAAs might arise from the hindrances to their downstream catabolism. Unlike most amino acids, whose catabolism take place in the liver, BCAAs are initially catabolized by branched-chain-amino-acid aminotransferase (BCAT) in extrahepatic tissues (such as skeletal muscle) to form branched chain α-keto acids (BCKAs) and then by branched chain α-keto acid dehydrogenase (BCKD), the rate-limiting enzyme in BCAA catabolism. Zhou M et al. (39) revealed that the enhancement of BCKD activity by administration of BT2 to BCKD deficiency obese (ob/ob) mice reduced the abundance of BCAAs and BCKAs, resulting in markedly attenuated insulin resistance. The BCAA catabolism was suggested as a potential therapeutic target for insulin resistance and T2DM. In addition, recent work revealed that elevated circulating BCAAs levels correlated with intestinal microbiota dysbiosis of the host. Prevotella copri and Bacteroides vulgatus were proven to be the main species associated with the biosynthesis of BCAAs and insulin resistance (40). Gavage with Prevotella copri would induce insulin resistance, aggravate glucose intolerance and augment circulating levels of BCAAs (38), while Gavage with Bacteroides vulgatus exerted the opposite effect (41). Similar to previous studies, the levels of L-leucine and L-phenylalanine were significantly higher in PTDM recipients than in non-PTDM ones, which might be due to BCAAs catabolism hindrance and/or host intestinal microbiota dysbiosis.
Significant variations in specific BAs species were found in our study. Simply put, the levels of taurocholic acid (TCA), TUDCA, taurochenodeoxycholic acid (TCDCA), glycocholic acid (GCA), GUDCA and GCDCA were significantly higher in PTDM receipts than in non-PTDM ones. As the most frequent etiology of liver transplantation (76.5%) in our study, hepatitis B virus has been proven to alter the expression of CYP7A1, a key enzyme involved in bile acid synthesis (42). Thus, the disturbance in BA profiles has been repeated observed in hepatitis B virus-infected patients for decades (43, 44). To minimize the influence from this confounding factor, case and control subjects were well-matched in hepatitis B virus infection. What’s more, in terms of aspartate aminotransferase, alanine aminotransferase, hepatic function of liver transplant recipients normally recovered within a few days, which was consistent with previous research (45). Two participants with hepatic disfunction were excluded from data analysis. Over the last few decades, BAs have attracted considerable attention in the field of diabetes, obesity, nonalcoholic fatty liver disease and so on. BAs are synthesized in hepatocytes and then undergo enterohepatic circulation with six to eight times per day in humans. Thus, BAs are detected at relatively lower levels in plasma compared with them in the liver, bile and intestine. In human, most bile acids are conjugated to glycine (G) and taurine (T) at a ratio of about 3:1. To date, it is still uncertain whether and what circulating BAs alter in patients with T2DM. For instance, a cross-sectional study including 224 T2DM patients and 102 nondiabetic individuals indicated that patients with T2DM possessed increased plasma levels of TCDCA, GCDCA, deoxycholic acid (DCA), taurodeoxycholic acid (TDCA) and glycodeoxycholic acid (GDCA), and decreased levels of CA and TCA (46). Another case-control study of age- and gender-matched T2DM versus control demonstrated elevated levels of TCA, TDCA, GDCA and DCA in T2DM subjects (47). Furthermore, a nested case-control study of 1,707 matched T2DM-control subject pairs within the China Cardiometabolic Disease and Cancer Cohort Study showed that conjugated primary BAs (GCA, TCA, GCDCA and TCDCA) and secondary BA (TUDCA) were positively related with T2DM risk, while unconjugated BAs (CA, CDCA and DCA) were inversely associated with T2DM risk (48). Accordingly, the currently human studies provided conflicting results, with some reporting certain BAs species increased in T2DM and others reporting those decreased in T2DM. Beyond this problem, considering the relatively small number of participants, the variation of BAs in PTDM recipients need to be verified in a large cohort.
What’s more, we found a series of LysoPCs and LysoPEs expressed differentially in PTDM recipients. The concentration of lysoPCs in plasma, up to 100μM in healthy subjects (49), is much higher than that of lysoPEs. In plasma, LysoPCs, representing 5%-20% of total phospholipids, are mainly formed by lecithin-cholesterol acyltransferase (LCAT) in the process of transferring fatty acyl residues in sn-2 position of phosphatidylcholine to free cholesterol for the formation of cholesteryl esters, or by endothelial lipase, or by direct hepatic secretion (50). The alterations of LysoPCs species linked to T2DM have been widely studied. Significant lower levels of LysoPC (18:2), LysoPC (18:1), LysoPC (18:0), and LysoPC (17:0) were found in T2DM and impaired glucose tolerance (IGT) cohort in the population-based Cooperative Health Research in the Region of Augsburg (KORA) study. Among them, LysoPC (18:2) served as a predictor for T2DM, which was independently confirmed in the European Prospective Investigation into Cancer and Nutrition (EPIC)-Potsdam study (51). A global lipidomics analysis of 293 Chinese individuals has also shown that LysoPC (18:0), LysoPC (18:1), and LysoPC (18:2) were all negatively correlated with HOMA-IR (52). Our finding was in agreement with above findings that LysoPC (18:2) exhibited significantly lower level in PTDM than non-PTDM recipients. Several other studies have reported inconsistent findings, i.e. diabetic men exhibited higher levels of centain LysoPCs, including LysoPC (14:0), LysoPC (16:1), LysoPC (18:1), LysoPC (22:6), LysoPC (20:5) and LysoPC (18:3), but not including LysoPC (18:2), LysoPC (16:0) and LysoPC (18:0) (53). Our study exhibited inverse change trends of different LysoPC species with increased expression in LysoPC (18:0) and decreased expression in LysoPC (18:2), LysoPC (16:1) and LysoPC (20:4), which might be due to the opposite effects of saturated and unsaturated acyl LysoPC. Park JY et al. (54) reported that lysoPC and lysoPE species containing unsaturated fatty acids were associated with an increased risk of coronary artery disease, whereas those containing saturated fatty acids were associated with a decreased risk. Saturated LysoPCs, such as LysoPC (16:0), are a potent inflammatory mediator, while polyunsaturated acyl LysoPCs, including LysoPC (20:4) and LysoPC (22:6), can serve as an anti-inflammatory lipid mediator and inhibit the inflammation induced by saturated LysoPCs (55). In mouse models, Yea K et al. (56) have reported that the blood glucose lowering effect of LysoPCs were found to be sensitive to variations in lysoPC acyl chain length, which may elucidate the divisive findings in our study. Therefore, lysoPCs play a complex role in T2DM, especially special type of T2DM like PTDM, which needs further work to clarify.
Our study recruited liver transplant recipients to address the “real-world” problem in PTDM. The metabolomic results help to give a new sight in the mechanism of PTDM. Since the analyzed sample size was small, we speculate that PTDM might be associated with the perturbation in amino acids, bile acids and glycerophospholipids. This hypothesis provides possible research direction in the field of PTDM. In addition, a major limitation of plasma metabolomics is that all of the differential metabolites are detected in plasma, their actual origins are unclear. Further studies should investigate the highlighted pathways in relevant tissues (such as muscle and liver) and their relations to PTDM for a comprehensive understanding of its underlying mechanism.
In summary, the integrated LC-MS and GC-MS based-metabolomics was adopted to dig out differentially changed metabolites associated with PTDM. A total of 30 metabolites (15 from LC-MS, 15 from GC-MS) significantly altered in PTDM recipients were identified. Findings indicated that alterations in plasma metabolites, particularly amino acids, BAs and LysoPCs may contribute to the progression of PTDM. Our study offered a novel insight into the pathological mechanism of PTDM. Further studies are needed to verify these findings and to unravel the underlying mechanisms involved in PTDM.
The original contributions presented in the study are included in the article/Supplementary Material. Further inquiries can be directed to the corresponding authors.
The studies involving human participants were reviewed and approved by the Ethics Committee of the Affiliated Drum Tower Hospital of Nanjing University Medical School (No. 2020-053-01). Written informed consent for participation was not required for this study in accordance with the national legislation and the institutional requirements.
MW, HZ, and JW designed the study protocol. MW, JX, and NY acquired the data and interpreted the results. JX and TZ wrote the original draft. MW, NY, and TZ recruited subjects. HZ and JW supervised the project and revised the original draft. All authors contributed to the article and approved the submitted version.
This study was supported by the Natural Science Foundation of Jiangsu Province (No. BK20180129; BK20190122), Aosaikang Hospital Pharmacy Foundation of JiangSu Pharmaceutical Association (No. A201906) and Nangjing Medical Center for Clinical Pharmacy.
The authors declare that the research was conducted in the absence of any commercial or financial relationships that could be construed as a potential conflict of interest.
All claims expressed in this article are solely those of the authors and do not necessarily represent those of their affiliated organizations, or those of the publisher, the editors and the reviewers. Any product that may be evaluated in this article, or claim that may be made by its manufacturer, is not guaranteed or endorsed by the publisher.
The Supplementary Material for this article can be found online at: https://www.frontiersin.org/articles/10.3389/fendo.2021.807318/full#supplementary-material
1. Avila JD, Živković S. The Neurology of Solid Organ Transplantation. Curr Neurol Neurosci Rep (2015) 15(7):38. doi: 10.1007/s11910-015-0560-2
2. Weissenbacher A, Vrakas G, Nasralla D, Ceresa CDL. The Future of Organ Perfusion and Re-Conditioning. Transpl Int (2019) 32(6):586–97. doi: 10.1111/tri.13441
3. Ingraham CR, Montenovo M. Interventional and Surgical Techniques in Solid Organ Transplantation. Radiol Clin North Am (2016) 54(2):267–80. doi: 10.1016/j.rcl.2015.09.008
4. Black CK, Termanini KM, Aguirre O, Hawksworth JS, Sosin M. Solid Organ Transplantation in the 21(St) Century. Ann Transl Med (2018) 6(20):409. doi: 10.21037/atm.2018.09.68
5. Lieber SR, Lee RA, Jiang Y, Reuter C, Watkins R, Szempruch K, et al. The Impact of Post-Transplant Diabetes Mellitus on Liver Transplant Outcomes. Clin Transplant (2019) 33(6):e13554. doi: 10.1111/ctr.13554
6. Anagnostis P, Paschou SA, Spartalis E, Sarno G, De Rosa P, Muscogiuri G. Metabolic Complications and Kidney Transplantation: Focus on Glycaemia and Dyslipidaemia. Curr Vasc Pharmacol (2020) 18(3):273–81. doi: 10.2174/1570161117666190619143005
7. Sharif A, Hecking M, de Vries AP, Porrini E, Hornum M, Rasoul-Rockenschaub S, et al. Proceedings From an International Consensus Meeting on Posttransplantation Diabetes Mellitus: Recommendations and Future Directions. Am J Transplant (2014) 14(9):1992–2000. doi: 10.1111/ajt.12850
8. Jenssen T, Hartmann A. Post-Transplant Diabetes Mellitus in Patients With Solid Organ Transplants. Nat Rev Endocrinol (2019) 15(3):172–88. doi: 10.1038/s41574-018-0137-7
9. Yates CJ, Fourlanos S, Hjelmesaeth J Colman PG, Cohney SJ. New-Onset Diabetes After Kidney Transplantation-Changes and Challenges. Am J Transplant (2012) 12(4):820–8. doi: 10.1111/j.1600-6143.2011.03855.x
10. Baid S, Cosimi AB, Farrell ML, Schoenfeld DA, Feng S, Chung RT, et al. Posttransplant Diabetes Mellitus in Liver Transplant Recipients: Risk Factors, Temporal Relationship With Hepatitis C Virus Allograft Hepatitis, and Impact on Mortality. Transplantation (2001) 72(6):1066–72. doi: 10.1097/00007890-200109270-00015
11. Munshi VN, Saghafian S, Cook CB, Werner KT, Chakkera HA. Comparison of Post-Transplantation Diabetes Mellitus Incidence and Risk Factors Between Kidney and Liver Transplantation Patients. PloS One (2020) 15(1):e0226873. doi: 10.1371/journal.pone.0226873
12. Dedinská I, Graňák K, Vnučák M, Skálová P, Kováčiková L, Laca Ľ, et al. Role of Sex in Post-Transplant Diabetes Mellitus Development: Are Men and Women Equal? J Diabetes Complicat (2019) 33(4):315–22. doi: 10.1016/j.jdiacomp.2018.12.017
13. Jacob M, Lopata AL, Dasouki M, Abdel Rahman AM. Metabolomics Toward Personalized Medicine. Mass Spectrom Rev (2019) 38(3):221–38. doi: 10.1002/mas.21548
14. Ribbenstedt A, Ziarrusta H, Benskin JP. Development, Characterization and Comparisons of Targeted and Non-Targeted Metabolomics Methods. PloS One (2018) 13(11):e0207082. doi: 10.1371/journal.pone.0207082
15. Zhang YY, Zhang Q, Zhang YM, Wang WW, Zhang L, Yu YJ, et al. A Comprehensive Automatic Data Analysis Strategy for Gas Chromatography-Mass Spectrometry Based Untargeted Metabolomics. J Chromatogr A (2020) 1616:460787. doi: 10.1016/j.chroma.2019.460787
16. Gika H, Virgiliou C, Theodoridis G, Plumb RS, Wilson ID. Untargeted LC/MS-Based Metabolic Phenotyping (Metabonomics/Metabolomics): The State of the Art. J Chromatogr B Analyt Technol BioMed Life Sci (2019) 1117:136–47. doi: 10.1016/j.jchromb.2019.04.009
17. Neto FTL, Marques RA, Filho AFC, Araujo LCN, Lima SVC, Pinto L, et al. 1h NMR-Based Metabonomics for Infertility Diagnosis in Men With Varicocele. J Assist Reprod Genet (2020) 37(9):2233–47. doi: 10.1007/s10815-020-01896-2
18. Zhang K, Liu WJ, Song QQ, Wan JB, Yu J, Gong XC, et al. Integrated Strategy Drives Direct Infusion-Tandem Mass Spectrometry as an Eligible Tool for Shotgun Pseudo-Targeted Metabolomics of Medicinal Plants. Anal Chem (2021) 93(4):2541–50. doi: 10.1021/acs.analchem.0c04602
19. Zeki ÖC, Eylem CC, Reçber T, Kır S, Nemutlu E. Integration of GC-MS and LC-MS for Untargeted Metabolomics Profiling. J Pharm BioMed Anal (2020) 190:113509. doi: 10.1016/j.jpba.2020.113509
20. Dunn WB, Broadhurst D, Begley P, Zelena E, Francis-McIntyre S, Anderson N, et al. Procedures for Large-Scale Metabolic Profiling of Serum and Plasma Using Gas Chromatography and Liquid Chromatography Coupled to Mass Spectrometry. Nat Protoc (2011) 6(7):1060–83. doi: 10.1038/nprot.2011.335
21. Pu X, Gao YQ, Li RT, Li W, Tian Y, Zhang ZJ, et al. Biomarker Discovery for Cytochrome P450 1a2 Activity Assessment in Rats, Based on Metabolomics. Metabolites (2019) 9(4):77. doi: 10.3390/metabo9040077
22. Dai D, Chen JC, Jin M, Zhang ZJ, Chen WH, Xu FG. Dynamic Metabolomic Analysis of Intestinal Ischemia-Reperfusion Injury in Rats. IUBMB Life (2020) 72(5):1001–11. doi: 10.1002/iub.2238
23. Dudzik D, Barbas-Bernardos C, García A, Barbas C. Quality Assurance Procedures for Mass Spectrometry Untargeted Metabolomics. A Review J Pharm BioMed Anal (2018) 147:149–73. doi: 10.1016/j.jpba.2017.07.044
24. Shin J, Hsin MK, Baciu C, Chen Y, Zamel R, Machuca T, et al. Use of Metabolomics to Identify Strategies to Improve and Prolong Ex Vivo Lung Perfusion for Lung Transplants. J Heart Lung Transplant (2021) 40(6):525–35. doi: 10.1016/j.healun.2021.02.002
25. Huang WQ, Xu YZ, Zhang YX, Zhang P, Zhang QQ, Zhang ZJ, et al. Metabolomics-Driven Identification of Adenosine Deaminase as Therapeutic Target in a Mouse Model of Parkinson’s Disease. J Neurochem (2019) 150(3):282–95. doi: 10.1111/jnc.14774
26. Wang Y, Xu L, Shen H, Wang J, Liu W, Zhu X, et al. Metabolomic Analysis With GC-MS to Reveal Potential Metabolites and Biological Pathways Involved in Pb &Cd Stress Response of Radish Roots. Sci Rep (2015) 5:18296. doi: 10.1038/srep18296
27. Li CY, Song HT, Wang XX, Wan YY, Ding XS, Liu SJ, et al. Urinary Metabolomics Reveals the Therapeutic Effect of HuangQi Injections in Cisplatin-Induced Nephrotoxic Rats. Sci Rep (2017) 7(1):3619. doi: 10.1038/s41598-017-03249-z
28. Yuan ZY, Li J, Zhou XJ, Wu MH, Li L, Pei G, et al. HS-GC-IMS-Based Metabonomics Study of Baihe Jizihuang Tang in a Rat Model of Chronic Unpredictable Mild Stress. J Chromatogr B (2020) 1148:122143. doi: 10.1016/j.jchromb.2020.122143
29. Zhao R, An ZL, Sun Y, Xia LY, Qiu L, Yao AM, et al. Metabolic Profiling in Early Pregnancy and Associated Factors of Folate Supplementation: A Cross-Sectional Study. Clin Nutr (2021) 40(9):5053–61. doi: 10.1016/j.clnu.2021.01.012
30. Ren F, Chen Q, Meng C, Chen H, Zhou Y, Zhang H, et al. Serum Metabonomics Revealed the Mechanism of Ganoderma Amboinense Polysaccharides in Preventing Non-Alcoholic Fatty Liver Disease (NAFLD) Induced by High-Fat Diet. J Funct Foods (2021) 82:104496. doi: 10.1016/j.jff.2021.104496
31. Wang X, Gao YQ, Tian Y, Liu X, Zhang GH, Wang Q, et al. Integrative Serum Metabolomics and Network Analysis on Mechanisms Exploration of Ling-Gui-Zhu-Gan Decoction on Doxorubicin-Induced Heart Failure Mice. J Ethnopharmacol (2020) 250:112397. doi: 10.1016/j.jep.2019.112397
32. Karnovsky A, Weymouth T, Hull T, Tarcea VG, Scardoni G, Laudanna C, et al. Metscape 2 Bioinformatics Tool for the Analysis and Visualization of Metabolomics and Gene Expression Data. Bioinformatics (2012) 28(3):373–80. doi: 10.1093/bioinformatics/btr661
33. Alqudah A, Wedyan M, Qnais E, Jawarneh H, McClements L. Plasma Amino Acids Metabolomics’ Important in Glucose Management in Type 2 Diabetes. Front Pharmacol (2021) 12:695418. doi: 10.3389/fphar.2021.695418
34. Chen HH, Nie QX, Hu JL, Huang XJ, Yin JY, Nie SP. Multiomics Approach to Explore the Amelioration Mechanisms of Glucomannans on the Metabolic Disorder of Type 2 Diabetic Rats. J Agric Food Chem (2021) 69(8):2632–45. doi: 10.1021/acs.jafc.0c07871
35. Wang TJ, Larson MG, Vasan RS, Cheng S, Rhee EP, McCabe E, et al. Metabolite Profiles and the Risk of Developing Diabetes. Nat Med (2011) 17(4):448–53. doi: 10.1038/nm.2307
36. Okekunle AP, Zhang M, Wang Z, Onwuka JU, Wu X, Feng R, et al. Dietary Branched-Chain Amino Acids Intake Exhibited a Different Relationship With Type 2 Diabetes and Obesity Risk: A Meta-Analysis. Acta Diabetol (2019) 56(2):187–95. doi: 10.1007/s00592-018-1243-7
37. Ma Q, Chen J, Zhou X, Hu L, Sun Y, Wang Z, et al. Dietary Supplementation With Aromatic Amino Acids Decreased Triglycerides and Alleviated Hepatic Steatosis by Stimulating Bile Acid Synthesis in Mice. Food Funct (2021) 12:267–77. doi: 10.1039/d0fo02364g
38. Ramzan I, Taylor M, Phillips B, Wilkinson D, Smith K, Hession K, et al. A Novel Dietary Intervention Reduces Circulatory Branched-Chain Amino Acids by 50%: A Pilot Study of Relevance for Obesity and Diabetes. Nutrients (2021) 13:95. doi: 10.3390/nu13010095
39. Zhou M, Shao J, Wu C, Shu L, Dong W, Liu Y, et al. Targeting BCAA Catabolism to Treat Obesity-Associated Insulin Resistance. Diabetes (2019) 68(9):1730–46. doi: 10.2337/db18-0927
40. Pedersen HK, Gudmundsdottir V, Nielsen HB, Hyotylainen T, Nielsen T, Jensen BA, et al. Human Gut Microbes Impact Host Serum Metabolome and Insulin Sensitivity. Nature (2016) 535:376–81. doi: 10.1038/nature18646
41. Zeng SL, Li SZ, Xiao PT, Cai YY, Chu C, Chen BZ, et al. Citrus Polymethoxyflavones Attenuate Metabolic Syndrome by Regulating Gut Microbiome and Amino Acid Metabolism. Sci Adv (2020) 6:eaax6208. doi: 10.1126/sciadv.aax6208
42. Patman G. HBV Infection Alters Bile Acid Metabolism Gene Profile. Nat Rev Gastroenterol Hepatol (2014) 11:332. doi: 10.1038/nrgastro.2014.62
43. Yang J, Zhao X, Liu X, Wang C, Gao P, Wang J, et al. High Performance Liquid Chromatography-Mass Spectrometry for Metabonomics: Potential Biomarkers for Acute Deterioration of Liver Function in Chronic Hepatitis B. J Proteome Res (2006) 5(3):554–61. doi: 10.1021/pr050364w
44. Sun Z, Huang C, Shi Y, Wang R, Fan J, Yu Y, et al. Distinct Bile Acid Profiles in Patients With Chronic Hepatitis B Virus Infection Reveal Metabolic Interplay Between Host, Virus and Gut Microbiome. Front Med (2021) 8:708495. doi: 10.3389/fmed.2021.708495
45. Jochum C, Beste M, Penndorf V, Farahani MS, Testa G, Nadalin S, et al. Quantitative Liver Function Tests in Donors and Recipients of Living Donor Liver Transplantation. Liver Transpl (2006) 12(4):544–9. doi: 10.1002/lt.20627
46. Mantovani A, Dalbeni A, Peserico D, Cattazzo F, Bevilacqua M, Salvagno GL, et al. Plasma Bile Acid Profile in Patients With and Without Type 2 Diabetes. Metabolites (2021) 11(7):453. doi: 10.3390/metabo11070453
47. Choucair I, Nemet I, Li L, Cole MA, Skye SM, Kirsop JD, et al. Quantification of Bile Acids: A Mass Spectrometry Platform for Studying Gut Microbe Connection to Metabolic Diseases. J Lipid Res (2020) 61(2):159–77. doi: 10.1194/jlr.RA119000311
48. Lu J, Wang S, Li M, Gao Z, Xu Y, Zhao Z, et al. Association of Serum Bile Acids Profile and Pathway Dysregulation With the Risk of Developing Diabetes Among Normoglycemic Chinese Adults: Findings From the 4C Study. Diabetes Care (2021) 44(2):499–510. doi: 10.2337/dc20-0884
49. Kabarowski JH, Zhu K, Le LQ, Witte ON, Xu Y. Lysophosphatidylcholine as a Ligand for the Immunoregulatory Receptor G2A. Science (2001) 293(5530):702–5. doi: 10.1126/science.1061781
50. Paapstel K, Kals J, Eha J, Tootsi K, Ottas A, Piir A, et al. Inverse Relations of Serum Phosphatidylcholines and Lysophosphatidylcholines With Vascular Damage and Heart Rate in Patients With Atherosclerosis. Nutr Metab Cardiovasc Dis (2018) 28(1):44–52. doi: 10.1016/j.numecd.2017.07.011
51. Wang-Sattler R, Yu Z, Herder C, Messias AC, Floegel A, He Y, et al. Novel Biomarkers for Pre-Diabetes Identified by Metabolomics. Mol Syst Biol (2012) 8:615. doi: 10.1038/msb.2012.43
52. Zhong H, Fang C, Fan Y, Lu Y, Wen B, Ren H, et al. Lipidomic Profiling Reveals Distinct Differences in Plasma Lipid Composition in Healthy, Prediabetic and Type 2 Diabetic Individuals. Gigascience (2017) 6(7):1–12. doi: 10.1093/gigascience/gix036
53. Ha CY, Kim JY, Paik JK, Kim OY, Paik YH, Lee EJ, et al. The Association of Specific Metabolites of Lipid Metabolism With Markers of Oxidative Stress, Inflammation and Arterial Stiffness in Men With Newly Diagnosed Type 2 Diabetes. Clin Endocrinol (2012) 76(5):674–82. doi: 10.1111/j.1365-2265.2011.04244.x
54. Park JY, Lee SH, Shin MJ, Hwang GS. Alteration in Metabolic Signature and Lipid Metabolism in Patients With Angina Pectoris and Myocardial Infarction. PloS One (2015) 10(8):e0135228. doi: 10.1371/journal.pone.0135228
55. Liu P, Zhu W, Chen C, Yan B, Zhu L, Chen X, et al. The Mechanisms of Lysophosphatidylcholine in the Development of Diseases. Life Sci (2020) 247:117443. doi: 10.1016/j.lfs.2020.117443
Keywords: post-transplant diabetes mellitus, metabolomic characteristics, LC-MS, GC-MS, potential mechanism
Citation: Wang M, Xu J, Yang N, Zhang T, Zhu H and Wang J (2022) Insight Into the Metabolomic Characteristics of Post-Transplant Diabetes Mellitus by the Integrated LC-MS and GC-MS Approach- Preliminary Study. Front. Endocrinol. 12:807318. doi: 10.3389/fendo.2021.807318
Received: 02 November 2021; Accepted: 29 December 2021;
Published: 18 January 2022.
Edited by:
Undurti Narasimha Das, UND Life Sciences LLC, United StatesReviewed by:
Joanna Barbara Godzien, Medical University of Bialystok, PolandCopyright © 2022 Wang, Xu, Yang, Zhang, Zhu and Wang. This is an open-access article distributed under the terms of the Creative Commons Attribution License (CC BY). The use, distribution or reproduction in other forums is permitted, provided the original author(s) and the copyright owner(s) are credited and that the original publication in this journal is cited, in accordance with accepted academic practice. No use, distribution or reproduction is permitted which does not comply with these terms.
*Correspondence: Huaijun Zhu, aHVhaWp1bi56aHVAZ21haWwuY29t; Jing Wang, d2FuZ2ppbmcxOTg5MDEyNkAxMjYuY29t
Disclaimer: All claims expressed in this article are solely those of the authors and do not necessarily represent those of their affiliated organizations, or those of the publisher, the editors and the reviewers. Any product that may be evaluated in this article or claim that may be made by its manufacturer is not guaranteed or endorsed by the publisher.
Research integrity at Frontiers
Learn more about the work of our research integrity team to safeguard the quality of each article we publish.