 Yu Sun1,2
 Shuhang Xu
 Chao Liu
95% of researchers rate our articles as excellent or good
Learn more about the work of our research integrity team to safeguard the quality of each article we publish.
Find out more
ORIGINAL RESEARCH article
Front. Endocrinol. , 29 October 2021
Sec. Clinical Diabetes
Volume 12 - 2021 | https://doi.org/10.3389/fendo.2021.757088
This article is part of the Research Topic Advances in the Research of Diabetic Retinopathy View all 20 articles
Backgrounds: Diabetic retinopathy (DR), the main retinal vascular complication of DM, is the leading cause of visual impairment and blindness among working-age people worldwide. The aim of this study was to investigate the difference of plasma metabolic profiles in patients with DR to better understand the mechanism of this disease and disease progression.
Methods: We used ultrahigh-performance liquid Q-Exactive mass spectrometry and multivariate statistical analyses to conduct a comprehensive analysis of plasma metabolites in a population with DR and proliferative DR (PDR). A risk score based on the level of the selected metabolite was established and evaluated using the least absolute shrinkage and selection operator regularization logistic regression (LASSO-LR) based machine learning model.
Results: 22 differentially expressed metabolites which belonged to different metabolic pathway were identified and confirmed to be associated with the occurrence of DR. A risk score based on the level of the selected metabolite pseudouridine was established and evaluated to strongly associated with the occurrence of DR. Four circulating plasma metabolites (pseudouridine, glutamate, leucylleucine and N-acetyltryptophan) were identified to be differentially expressed between patients with PDR and other patients, and a risk score formula based on these plasma metabolites was developed and assessed to be significantly related to PDR.
Conclusions: Our work highlights the possible use of the risk score assessment based on the plasma metabolites not only reveal in the early diagnosis of DR and PDR but also assist in enhancing current therapeutic strategies in the clinic.
In both developing and developed countries, the prevalence of diabetes mellitus (DM) is rising. By 2045, it is estimated that 629 million people worldwide will have DM (1). The proportion was reported to be less than 1% in the 1980s in China, while a series of large-scale and well-conducted population surveys have shown that the prevalence has risen sharply to 9-12% in the past few years, with more than one million persons affected (2, 3). Diabetic retinopathy (DR), the main retinal vascular complication of DM, is the leading cause of visual impairment and blindness among working-age people worldwide (4). In addition, the existence of DR also suggests an increased risk of life-threatening systemic vascular complications (5, 6). By 2010, worldwide, DM-related eye disease contributed to the fifth most common cause of moderate-to-severe vision loss and blindness, accounting for nearly four million cases of visual impairment and more than eight hundred thousand cases of blindness (7).
DR is a progressive and devastating disease, and much of the blindness associated with DR can be prevented with early diagnosis and therapy. DR is classified according to its severity as nonproliferative DR (NPDR) in the early stages and proliferative DR (PDR) in the later stages; while PDR is often associated with visual impairment, NPDR is often asymptomatic (8). Therefore, profiling and early detection of DR are specifically vital in preventing NPDR from progressing to PDR. One challenge associated with the use of common retinal imaging methods widely utilized to screen and diagnose DR is training primary healthcare workers to assess these retinal images (9). However, an exciting area of research is the diagnosis and assessment of the occurrence, development and prognosis of disease based on liquid biopsy and the identification of easily accessible biomarkers; notably, plasma/serum multiomics can disclose systemic changes associated with biological dysfunction (10, 11). Thus, the development of DR diagnosis and PDR monitoring biomarkers must be advanced from a modern perspective so that treatment efforts for DR can be enhanced in the clinic.
Metabolomics research has been applied to qualitatively and quantitatively analyze all low-molecular-weight metabolites in a sample, identify metabolites with significant differences and important biological significance between different groups, and further clarify the metabolic processes and pathophysiological changes in an organism during the disease process (12, 13). This type of research moves from the genome to providing a complete illustration of the phenotype (14). Metabolomics is a powerful technology that can be leveraged to study biomarkers of various diseases, including DM. Several recent studies have revealed that the development of DM is closely related to amino acid metabolism, including that of branched chain amino acids, aromatic amino acids, tyrosine and other aromatic amino-containing acids, glycine, glutamine and glutamic acid (15). Despite the biological function of DM becoming increasingly apparent, the role of metabolites in regulating microvascular complications of DM such as DR remains under investigation.
In our work, we investigated plasma metabolomic biomarker profiling of DR patients and disease progression. We used ultrahigh-performance liquid Q-Exactive mass spectrometry (UPLC-QE-MS) and multivariate statistical analyses to conduct a comprehensive analysis of plasma metabolites in a population with DR and PDR. A risk score based on the level of the selected metabolite pseudouridine was established and evaluated using the least absolute shrinkage and selection operator regularization logistic regression (LASSO-LR) based machine learning method, and this score was strongly associated with the occurrence of DR. Subsequently, four circulating plasma metabolites (pseudouridine, glutamate, leucylleucine and N-acetyltryptophan) were identified to be differentially expressed between patients with PDR and other patients, and a risk score formula based on these plasma metabolites was developed and assessed to be significantly related to the severity of DR.
HPLC-grade methanol was supplied by Tedia Company, Inc. (Fairfield, OH, USA). Formic acid (FA) was provided by Sigma-Aldrich Co., Ltd (St. Louis, MO, USA).
This study was managed at the The Affiliated Suqian Hospital of Xuzhou Medical University between August 2019 and January 2021, and the ethics committee of The Affiliated Suqian Hospital of Xuzhou Medical University (2019–102–07) approved the study, which was conducted according to the ethical standards for human experimentation and the World Medical Association (WMA) Declaration of Helsinki. The cases were T2DM patients with DR, and the controls were T2DM patients without DR. T2DM was diagnosed according to standard criteria recommended by WHO since 1999. All participants received detailed ophthalmic examinations and were separately assessed based on digital retinal photographs, while different stages of DR was diagnosed with fundus fluorescence angiography method (16). The inclusion criteria were as follows (1): T2DM (2); ≥18 years old (3); following the same therapy programs consists of basal insulin (Insulin Degludec) and metformin. Participants with following situation would be excluded (1): any other eye diseases or history of eye surgery (2); acute or chronic inflammatory disease, cardiovascular diseases, malignancy, liver or renal dysfunction and any other severe chronic systemic disease (3); poor quality of fundus photographs, which were not clear for DR diagnosis. According to inclusion criteria and exclusion criteria, 42 patients with clinical and histopathology-confirmed DR, including 21 PDR and 21 NPDR patients, and 32 age- and sex-matched T2DM patients without DR, were recruited between August 2019 and January 2021 at the Hospital of The Affiliated Suqian Hospital of Xuzhou Medical University. According to diabetic nephropathy diagnostic criteria (17), 6.25% (2/32) in T2DM group, 19.0 (4/21) in DR group and 61.9% (13/21) in PDR group were assessed to diabetic nephropathy.
Peripheral venous blood samples including 42 DR patients and 32 T2DM patients without DR, were drawn from the elbow vein in the fasting state in the morning and stored in ethylenediaminetetraacetic acid vacuum tubes (BD Vacutainer, Franklin Lakes, NJ, USA) and then centrifuged at 1300 g for 10 min at 4°C. Plasma was immediately separated and stored at -80°C. Sample preparation for nontargeted metabolomics was performed according to the manufacturer’s instructions. One hundred microliters of each sample were slowly lysed at 4°C, 400 µL of precooled methanol was added, vortexed for 60 s, and incubated at -80°C for 8 hours, and the protein was precipitated by centrifugation at 16,000 g for 10 min at 4°C. The supernatant was used for UHPLC analysis.
The samples were separated by UHPLC and then analyzed by a Thermo QE HF-X mass spectrometer carried out by Clinical Mass Company (Nanjing, China). Electrospray ionization (ESI) positive and negative ion modes were applied. The ESI source conditions after C18 chromatographic separation were as follows: sheath gas flow rate: 50; Aux gas flow rate: 13; sweep gas flow rate: 0; capillary temperature: 300°C; spray voltage: ± 3.5 kV; scan m/z range: 67-1000 Da; and product ion scan m/z range: 67-1000 Da. Secondary mass spectra were obtained using information-dependent acquisition (IDA) and high sensitivity mode, with an N collision energy of 15, 30, 45 eV. Aliquots of samples were mixed for the preparation of QC samples. QC samples were inserted in the sample cohort throughout the analysis to monitor and evaluate system stability. The MSdial program was used for peak extraction of the data, and the SIMCA program was used for principal component analysis (PCA) and orthogonal partial least-squares discriminant analysis (OPLS-DA). Then, metabolite structure identification was performed by exact mass number matching and secondary spectrum matching by searching public databases.
The MS signal intensities confirmed that significantly changed metabolites were converted by log transformation and autoscaling and applied to calculate Pearson’s correlation coefficient, followed by correlation-based metabolic networking analysis using Cytoscape 3.7. Variable metabolites were imported and analyzed using MetaboAnalyst software (http://www.metaboanalyst.ca) to perform pathway analysis to display the role of disturbed metabolic pathways.
All patients’ medical histories were acquired, and age, sex, body mass index (BMI), and duration were obtained after a physical examination. Patients underwent blood and urine laboratory tests that included fasting plasma glucose (FPG), glycated hemoglobin |glycosylated hemoglobin (HbA1c), urine Albumin to creatinine (UACR), triglycerides, high-density lipoprotein cholesterol (HDL-c), low-density lipoprotein cholesterol (LDL-c) and total cholesterol (TC).
Data are presented as the mean ± SD. Continuous data were analyzed with Student’s t-test or the Mann-Whitney U test using SPSS 22.0 software (SPSS, Chicago, IL, USA). As the association of HbA1c level with severity of retinopathy has been investigated and assessed, Pearson correlation and partial correlation were used to analyze the relationships between plasma HbA1c level and risk score (GraphPad Prism). LASSO-LR based machine learning model was then performed to derive an DR or PDR diagnosis risk score. Receiver operating characteristic (ROC) analysis was utilized to estimate the sensitivity and specificity by the standard method. The general acceptance level of significance was P < 0.05.
In the present work, we explored the association between the plasma metabolite fingerprint and proliferative retinopathy in DM patients. Detailed demographic characteristics of the enrolled participants are shown in Table 1, FPG, HbA1c and UACR levels were markedly higher in DR patients (P < 0.001). In addition, no significant differences were found for BMI, or levels of triglycerides, HDL-c, LDL-c and TC between the DR and control groups (P > 0.05).
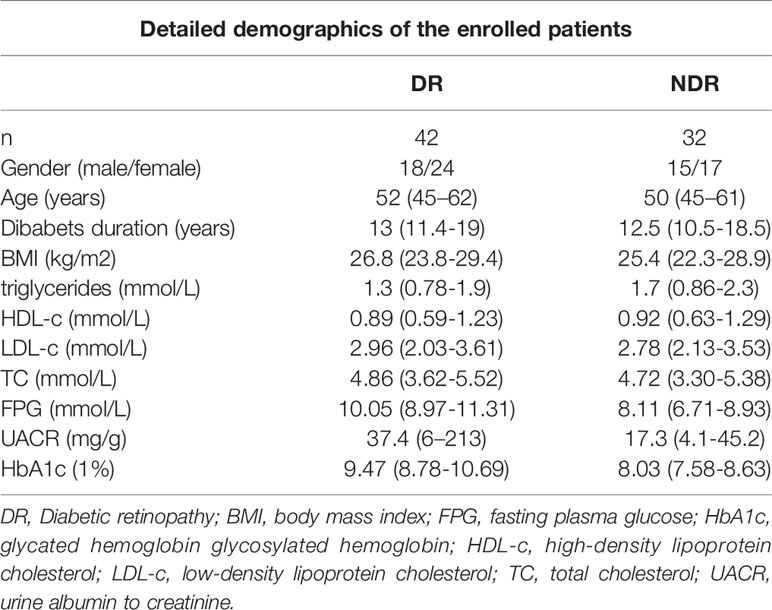
Table 1 Detailed demographics of the enrolled patient.
The study workflow is shown in Figure 1. Plasma samples were collected from subjects and analyzed with the UHPLC-QE MS platform with both the electrospray ionization positive (ESI+) and negative (ESI-) modes. Raw data were normalized using Pareto scaling for subsequent data analysis after extraction of the background and alignment of the metabolic peaks. Different metabolic features and metabolites were extracted by combining the criteria of fold change (FC) >1.2 and P<0.05 and visualized with volcano plots and heat maps. Thirty significantly different metabolites were screened by the threshold of variable important in projection (VIP) value >1 and P value <0.05, of which correlation analysis and pathway analysis were performed. The LASSO-LR was utilized to select diagnostic markers to predict DR and PDR among the subjects via penalized maximum likelihood. Evaluation of the risk score formula was performed using ROC analysis, and the relationship between the risk score and HbA1c level was investigated.
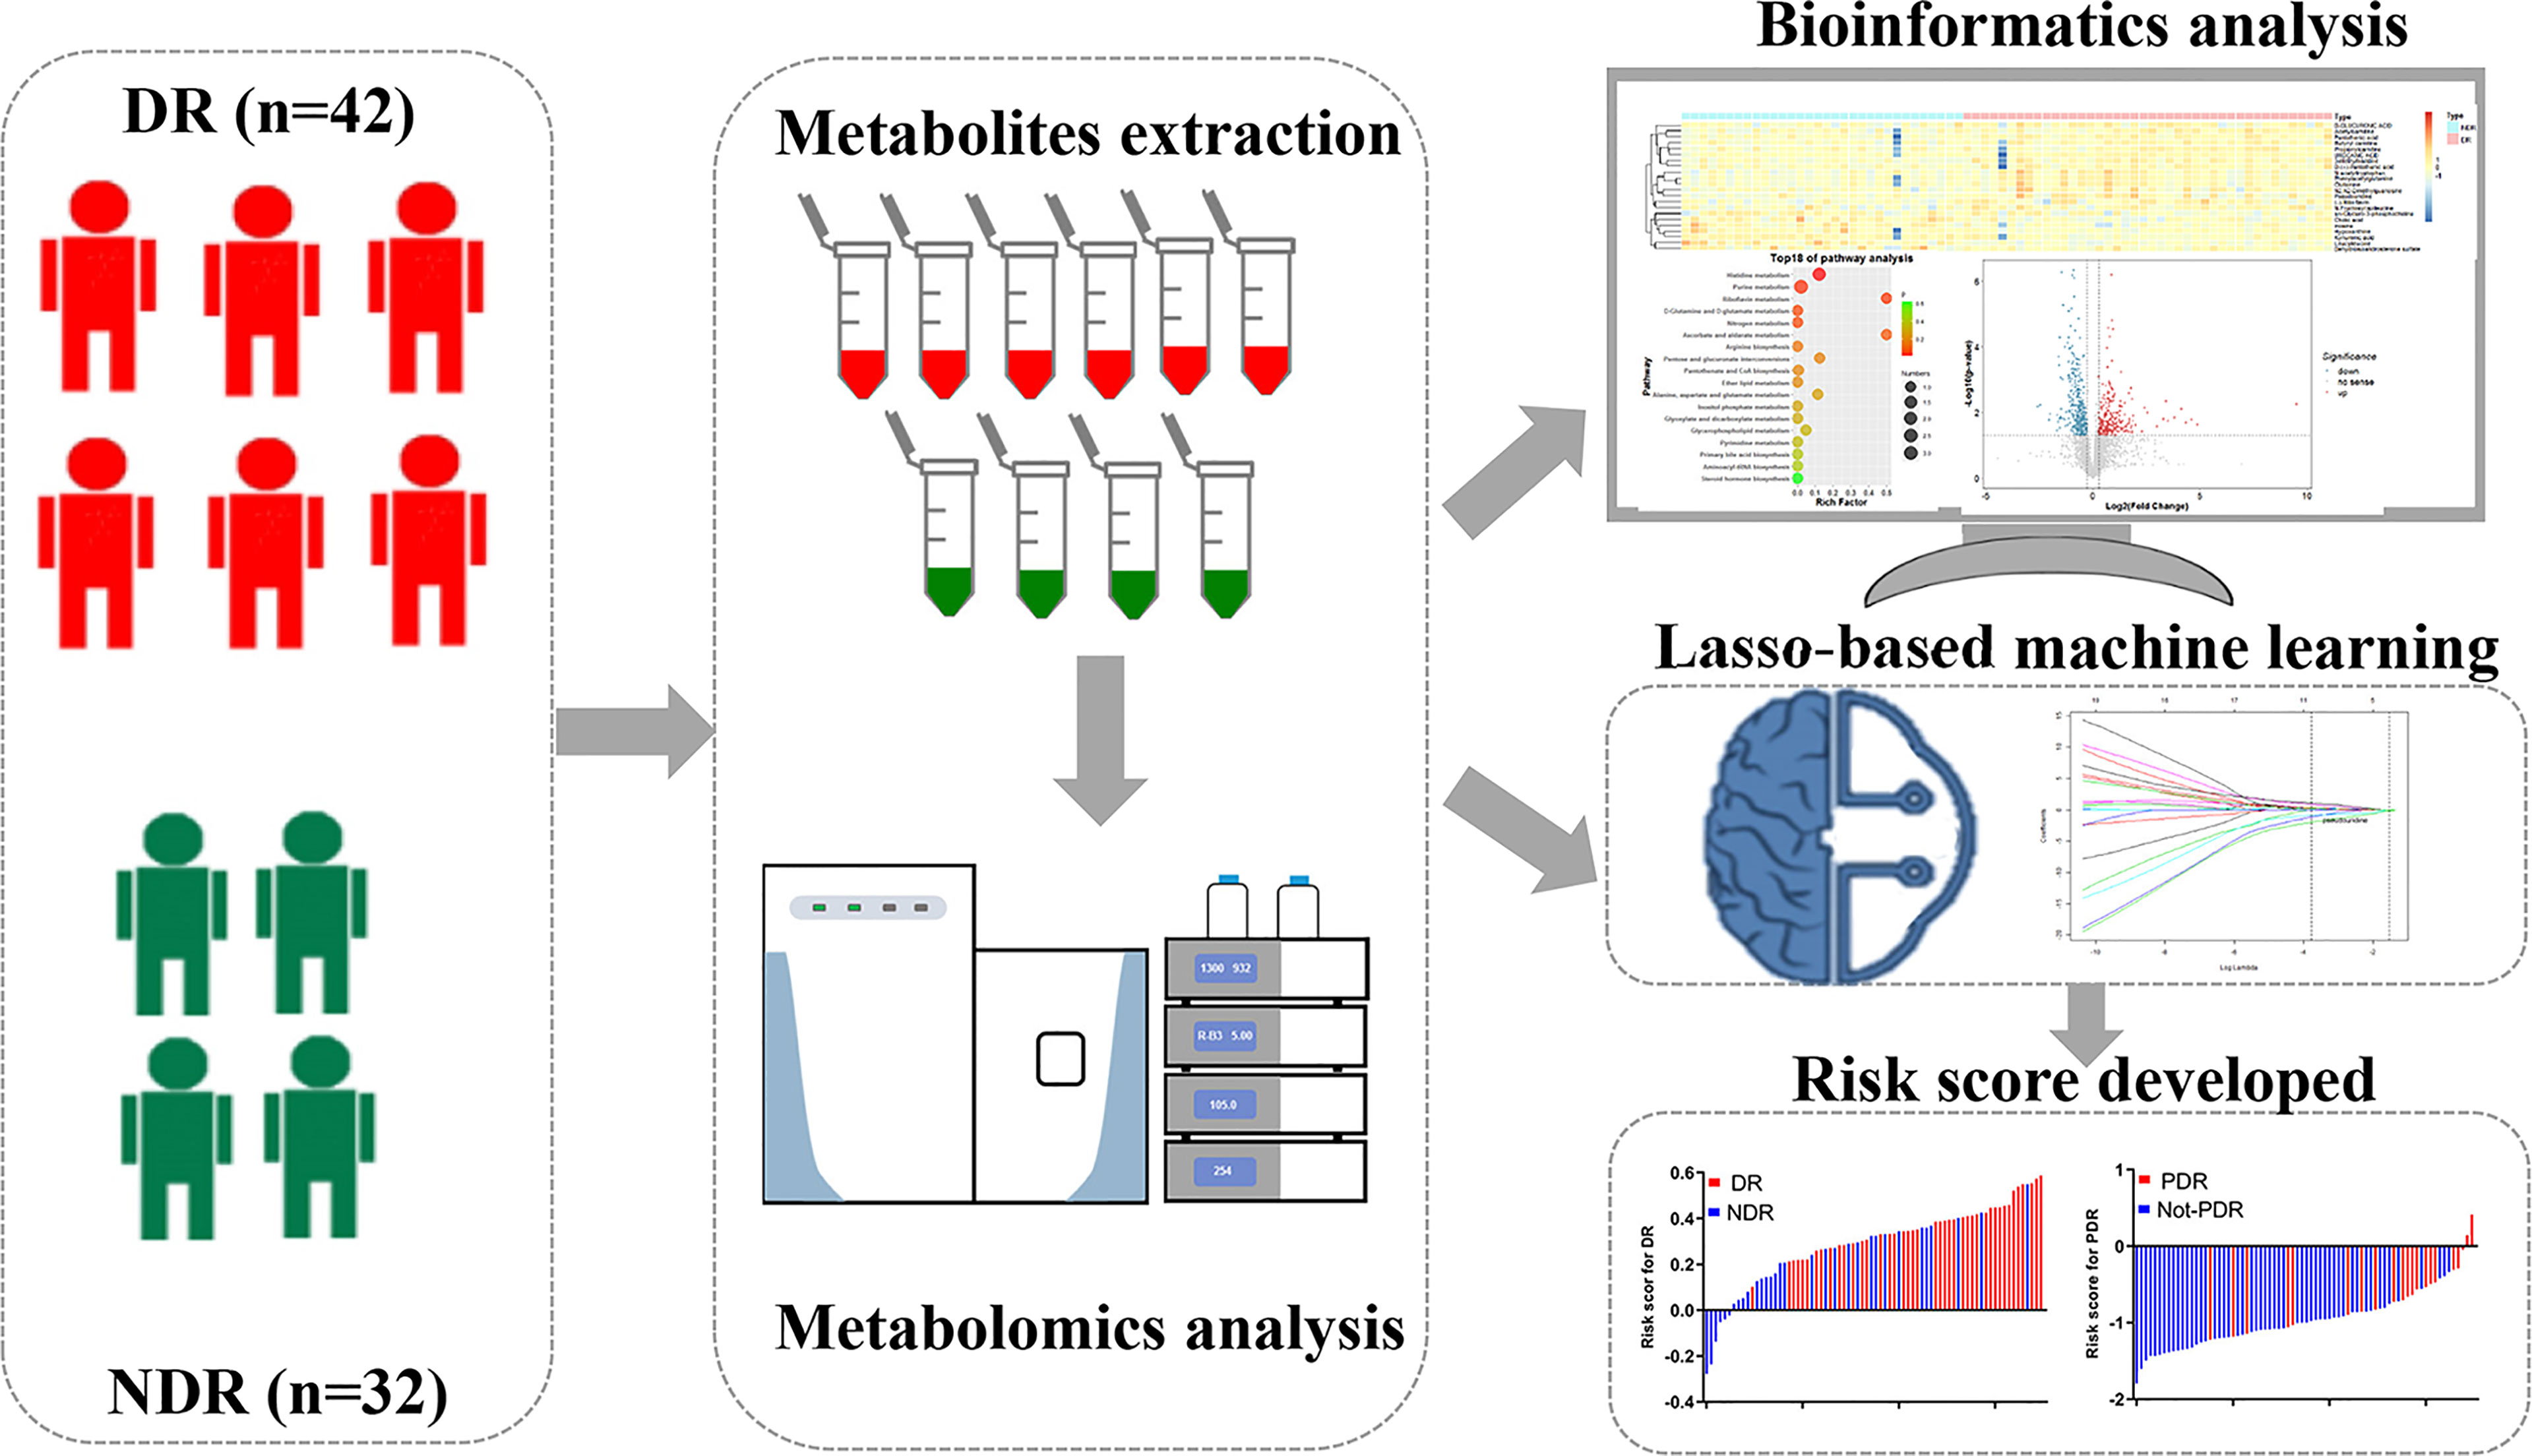
Figure 1 Workflow of metabolomics for metabolomic profiling and data interpretation of plasma samples from DR and NDR.
We first compared the metabolic signatures between DR and control T2DM patients in both ESI+ and ESI− modes of untargeted metabolomics. In total, more than 50,000 metabolic features were consistently found in all plasma samples from the discovery cohort, including 25742 features in ESI+ mode and 31374 features in ESI- mode. QC samples were tightly clustered in principal component analysis (PCA), validating the stability and reproducibility of the instrumental analysis (Figures 2A, B). The OPLS-DA score plot displays a clear demarcation between the DR group and the control group in ESI+ mode with R2Y = 0.939 and in ESI- mode with R2Y = 0.991, suggesting significant changes in plasma metabolites in the DR group (Figures 2C, D).
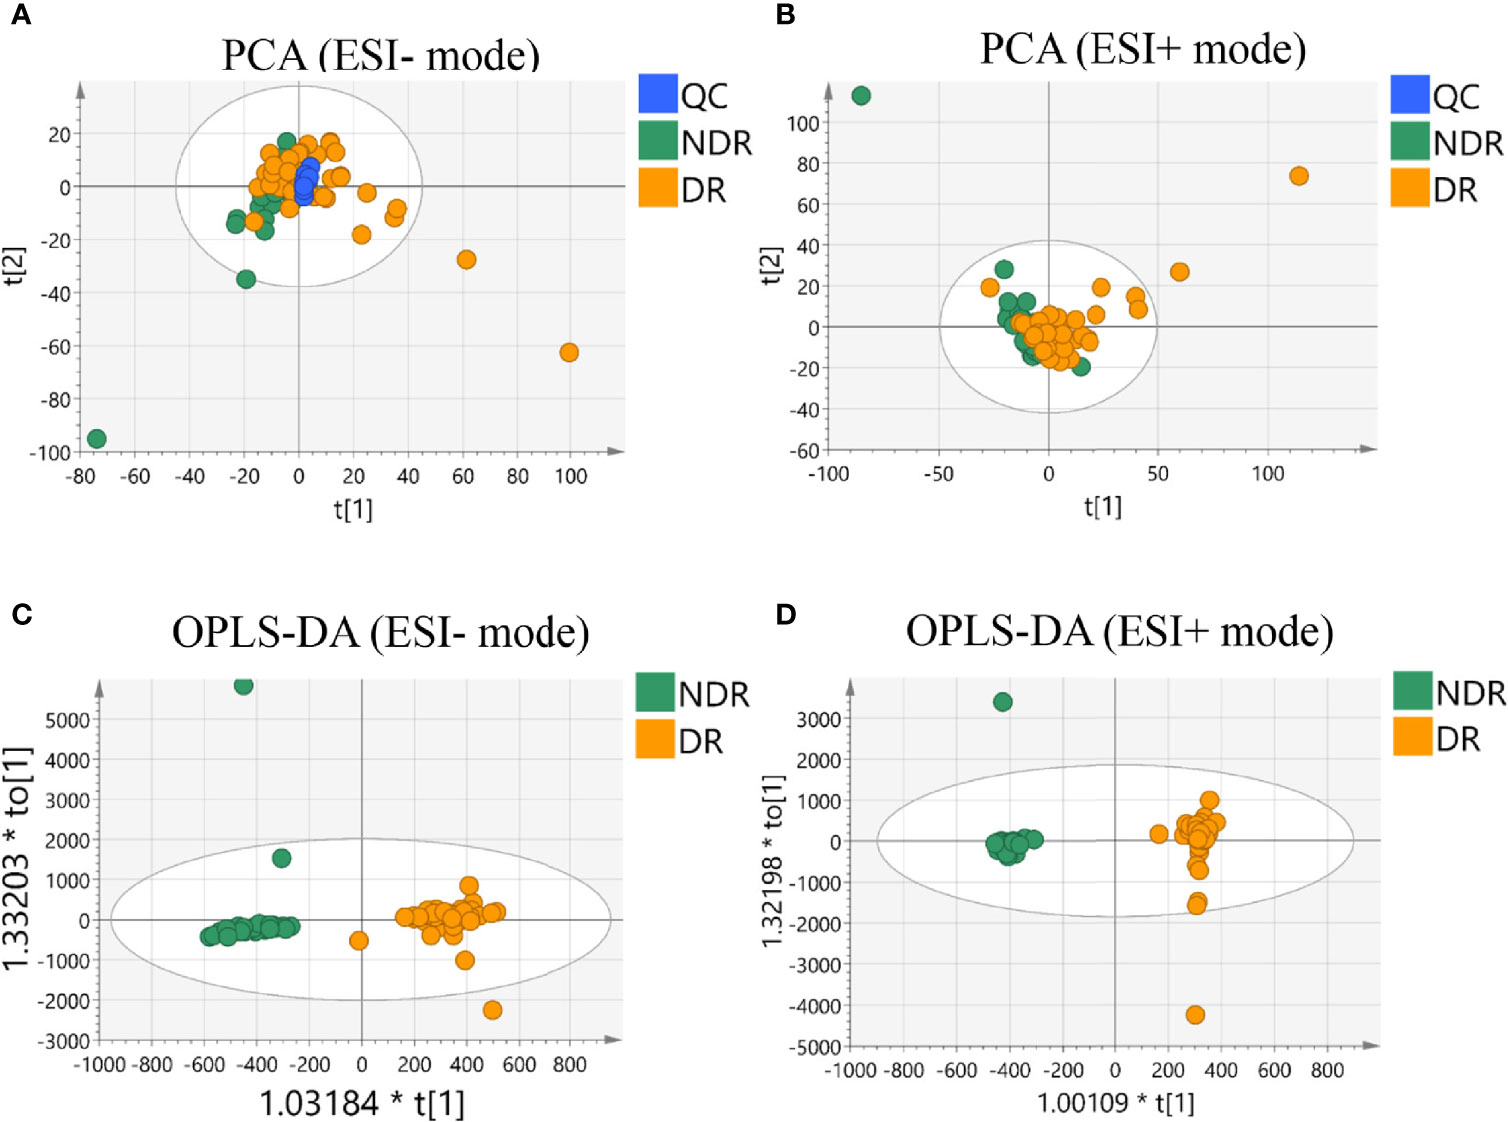
Figure 2 Multivariate statistical analysis results. PCA score plot of the analysis in ESI (–) mode (A) and ESI (+) mode (B). OPLS-DA score plot of the analysis in ESI (–) mode (C) and ESI (+) mode (D).
To reveal the plasma metabolic characteristics in DR patients and identify and confirm high-confidence metabolites that contribute to DR, we distinguished the differences by ESI+ and ESI- based on the criteria of FC>1.2 and P<0.05, respectively. In addition, a VIP value greater than 1.0, which was calculated by OPLS-DA scoring, was selected as a significantly different metabolic feature for analysis. Thus, metabolic characteristics with significant differences were extracted and visualized by volcano plots (Figures 3A, B). According to a public metabolite library, 22 metabolites were identified and confirmed after inputting the refined significant metabolic features, containing 13 and 5 metabolites from the ESI+ and ESI- models, respectively, and 4 metabolites with dual mode. They were classified into 13 subcategories according to the chemical taxonomy in the Human Metabolome Database (HMDB) with the largest proportion of the significantly different metabolites which was classified as amino acid (7/22) (Table 2). Hierarchical clustering analysis also revealed differentially expressed metabolites between DR and NDR (Figure 3C).

Figure 3 Representative Volcano plot (fold change >1.2 and p-value < 0.05) in ESI (+) mode (A) and ESI (+) mode (B) metabolomics data. (C) Representative heatmap of significant different metabolites (fold change >1.2, VIP>1 and p-value < 0.05). (D) Correlation-based metabolic network analysis. (E) Metabolic pathway analysis.
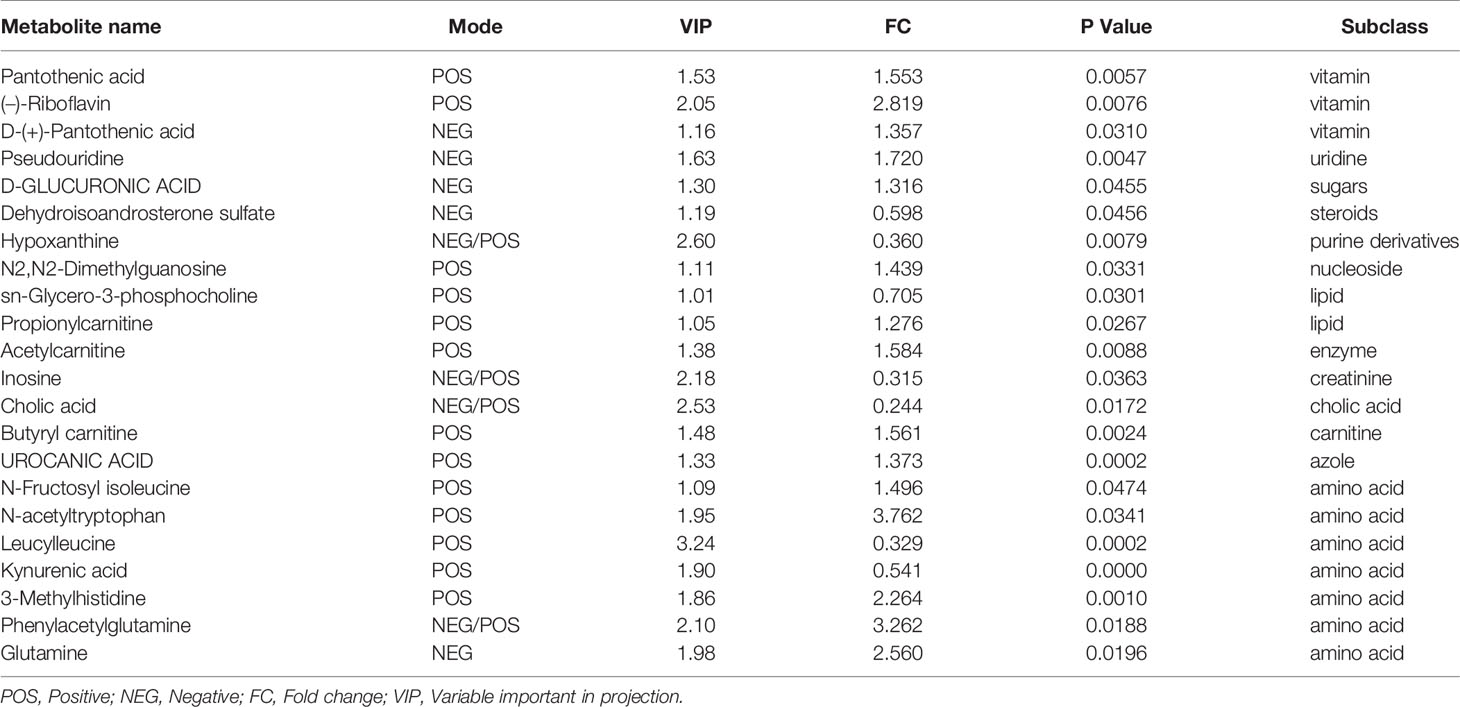
Table 2 Differential metabolites identified from metabolomics profiling.
To further investigate the interrelationships between the significantly different metabolites, we utilized the Metscape plugin (http://metscape.ncibi.org/) in Cytoscape (https://cytoscape.org/), a tool available for interactive exploration and visualization of metabolic networks in metabolite changes, and constructed the metabolic network (Figure 3D). We identified 45 pairs of correlations with correlation coefficients ≥0.4 or ≤-0.4 among the 22 significantly different metabolites. KEGG pathway enrichment analysis was performed for 22 dysregulated metabolites involving 18 metabolic pathways. Based on the enrichment factor and P-value, histidine metabolism, purine metabolism, riboflavin metabolism, d-glutamine metabolism and nitrogen metabolism were the five most significantly enriched metabolic pathways (Figure 3E).
To further elucidate the metabolite signature for DR, a LASSO-LR model was utilized to select diagnostic metabolites to predict DR among the subjects via penalized maximum likelihood, which gives the most normalized model for the application of one or ten markers (Figure 3A). The normalization path was calculated for the LASSO-LR model at a grid of values for the normalization parameter lambda, which identified one (pseudouridine) or ten differentially expressed metabolites (Figure 4A). The OPLS-DA score plot displays a clear demarcation between the DR group and the control group at the level of pseudouridine with R2Y = 0.867 (Figure 4B). According to the levels of the selected metabolites, the following formula was derived to calculate the DR risk score for each patient: risk score (DR) = -0.23× Ln (pseudouridine) + 1.88. Based on the study of the relationship between the risk score distribution and DR status, the results showed that the rate of DR in the low-risk score party was primarily lower than that in the high-risk score party (Figure 4C). In addition, the risk scores for the DR group were predominantly higher than those for the NDR group (Figure 4D). The sensitivity and specificity of the risk score for DR were 97.6% and 53.1%, respectively, with an AUC of 0.80 (95% CI = 0.70 to 0.90) (Figure 4E). Then, it was also shown that the risk score was positively correlated with the level of HbA1c according to a linear correlation analysis (R = 0.603, P < 0.001) (Figure 4F).
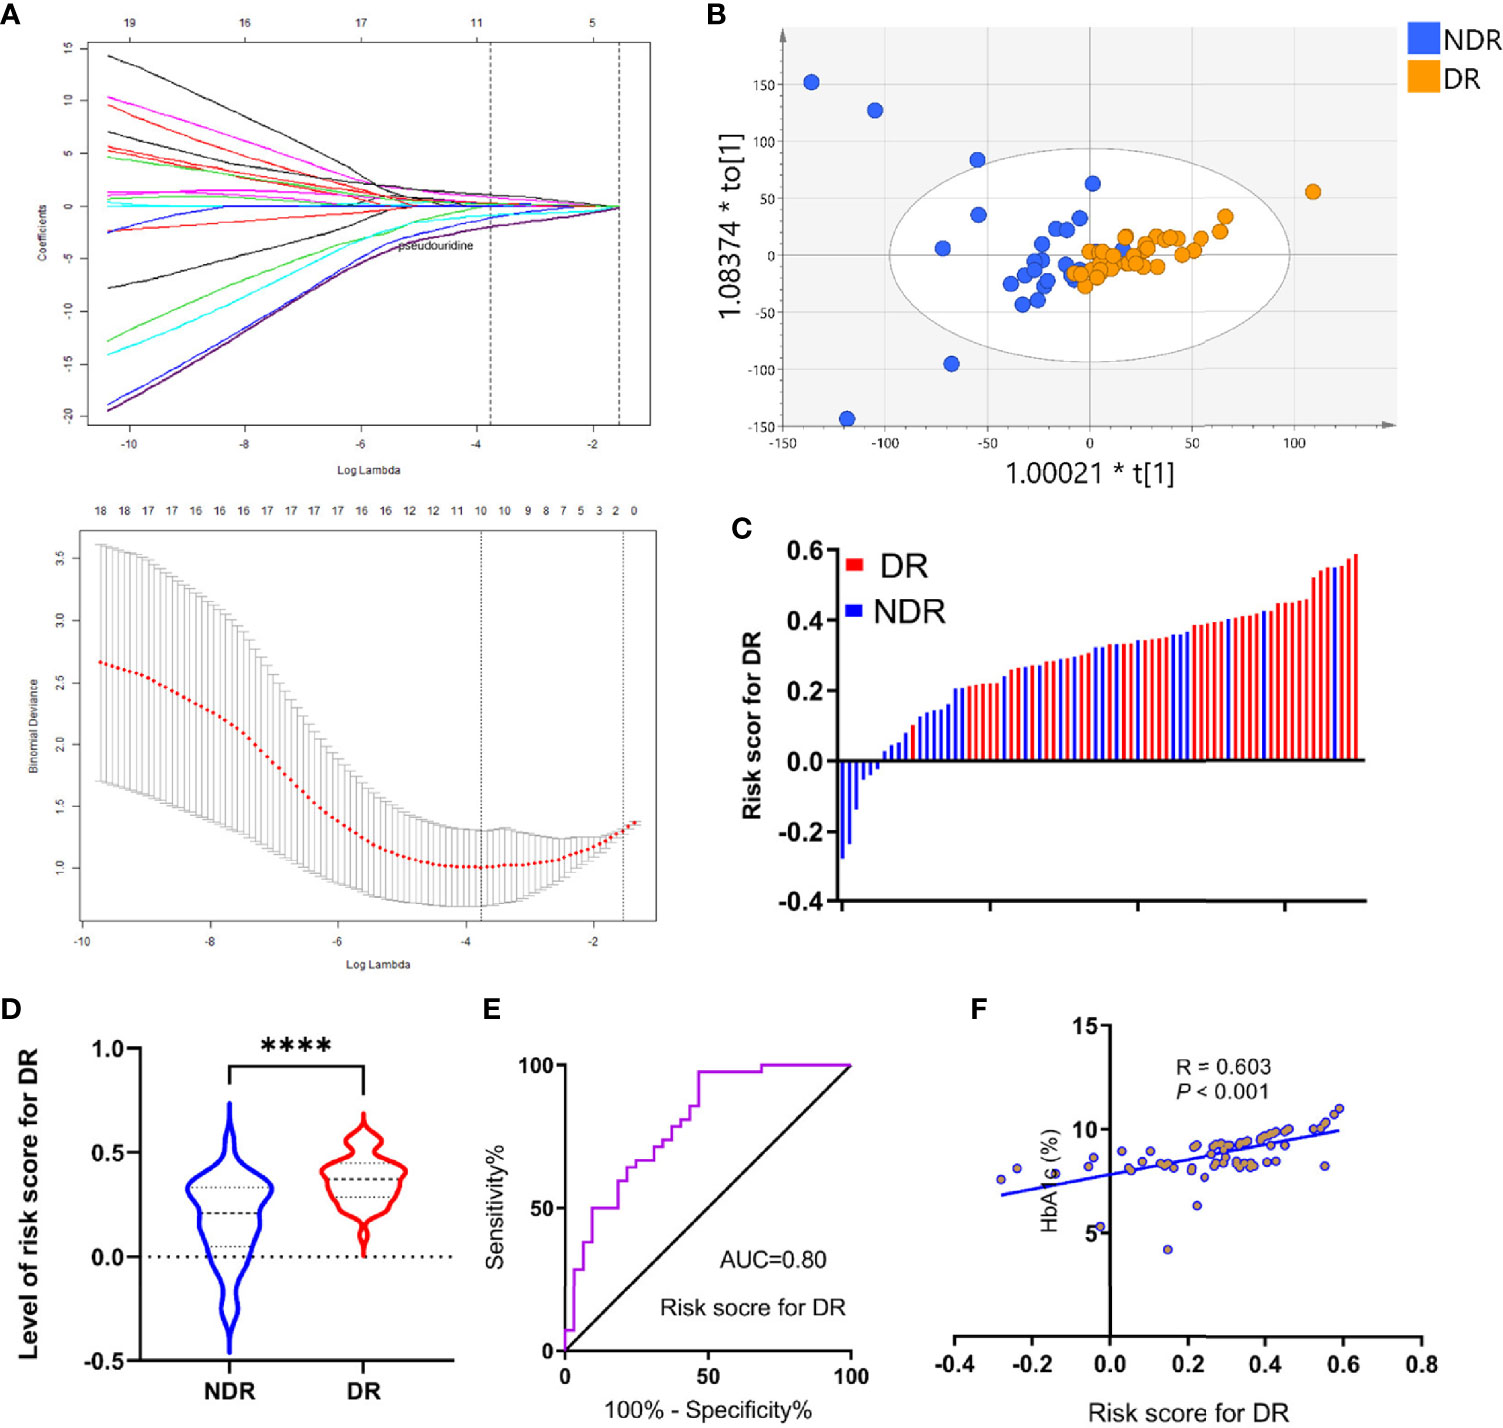
Figure 4 Development of risk score for DR using the least absolute shrinkage and selection operator regularization (LASSO-LR) model. (A) Dotted vertical lines were drawn at the optimal values with Lambda (log), by using the minimum criteria and the 1 standard error of the minimum criteria (the 1-SE criteria). (B) OPLS-DA score plot of the analysis using selected metabolite. (C) Distribution of the risk score in the group. (D) Statistical analysis for distribution of risk score between DR and NDR (****p<0.0001). (E) ROC curves were created to evaluate the power of risk score. (F) A linear correlation analysis between risk score and HbA1c levels.
According to the International Clinical DR and Diabetic Macular Edema Disease Severity Scale, 21 PDR patients and 53 non-PDR patients, including 32 control cases and 21 NPDR patients, were distinguished. Then, the same procedure of LASSO-LR analysis was performed to select metabolites to monitor PDR. The normalization path was calculated for the LASSO-LR model at a grid of values for the normalization parameter lambda, which identified four (pseudouridine, glutamate, leucylleucine and N-acetyltryptophan) differentially expressed metabolites (Figure 5A). As shown in Figure 5B, the plasma concentrations of pseudouridine, N-acetyltryptophan and glutamate were predominantly upregulated, whereas that of leucylleucine was found to be downregulated in PDR patients. According to the levels of the four selected metabolites, the following formula was derived to calculate the PDR risk score for each patient: risk score = 0.23 × Ln(pseudouridine) + 0.16 × Ln(N-acetyltryptophan) - 0.065 × Ln(leucylleucine) + 0.11 × Ln(glutamate) -3.63. Based on the relationship between the risk score distribution and DR status, the results showed that the rate of PDR cases in the low-risk score party was primarily lower than that in the high-risk score party (Figure 5C). Statistical analysis showed that the risk scores of the PDR group were significantly higher than those of the non-PDR group (Figure 5D). The sensitivity and specificity of the risk score for DR were 76.2% and 77.4%, respectively, with an AUC of 0.82 (95% CI = 0.71 to 0.90) (Figure 5E). Ultimately, it was also shown that the risk score was positively correlated with the level of HbA1c according to a linear correlation analysis (R = 0.36, P < 0.01) (Figure 5F).

Figure 5 Development of risk score for PDR using the least absolute shrinkage and selection operator regularization (LASSO-LR) model. (A) Dotted vertical lines were drawn at the optimal values with Lambda (log), by using the minimum criteria and the 1 standard error of the minimum criteria (the 1-SE criteria). (B) Statistical analysis of pseudouridine, glutamate, leucylleucine and N-acetyltryptophan between PDR and not-PDR group (**p < 0.01; ***p < 0.001; ****p < 0.0001). (C) Distribution of the risk score in the group. (D) Statistical analysis for distribution of risk score between PDR and not-PDR group (****p < 0.0001). (E) ROC curves were created to evaluate the power of risk score. (F) A linear correlation analysis between risk score and HbA1c levels.
DR, the main retinal vascular complication of DM, is the leading cause of visual impairment and blindness among working-age people worldwide. Therefore, early and accurate identification of DR and disease progression among T2DM patients is essential for clinicians when evaluating the disease status of patients and formulating suitable therapy efforts such as anti-vascular endothelial growth-factor agents, intraocular injection of steroids or timely laser therapy for preservation of sight in DR patients. In our work, we demonstrated that the levels of circulating plasma metabolites were significantly differentially expressed between the DR and NDR groups. A risk score based on the level of pseudouridine was established and evaluated using the LASSO-LR model, which was strongly associated with the occurrence of DR. Subsequently, four circulating plasma metabolites, including pseudouridine, glutamate, leucylleucine and N-acetyltryptophan, were identified to be differentially expressed between PDR and not-PDR, and a risk score formula based on these four plasma metabolites was developed in the same way and assessed to be significantly related to the severity of DR. Our work highlights the possible use of plasma metabolites in the early diagnosis of DR and PDR in the clinic.
A panel of differentially expressed plasma metabolites was first identified after comparing DR and NDR subjects and was found to be significantly enriched in histidine metabolism, purine metabolism, riboflavin metabolism, d-glutamine/d-glutamate metabolism and others. Histidine, an essential amino acid (EAA) in mammals, is derived from growth and amino acid composition in tissues. An increasing number of studies have revealed the effect of histidine catabolism on carnosine synthesis, which contributes to strong antioxidant effects (18) and the efficiency of chemotherapy agents (19), preventing cataracts (20). The major pathway of histidine catabolism could proceed in four steps to yield glutamate, with many functions, including the development of DM (21). Our data are in accordance with previous studies showing that purine metabolism plays a role in the development of DR (22). Purines, the basic composition of nucleotides in the process of cell proliferation, are associated with various molecular functions, such as cell cycle regulation, signal transduction and immune function. Uric acid, the final product of purine metabolism, is an independent predictor of cardiac allograft vasculopathy after heart transplantation (23). Additionally, uric acid has been reported to be a risk factor related to extremity vasculopathy in T2DM (24). Riboflavin, a water-soluble vitamin, is an essential nutrient in higher organisms and is involved in oxidation-reduction reactions in many metabolic pathways and in energy production in the respiratory chain that occurs in the mitochondria. Impairment of flavin homeostasis may lead to multisystem dysfunction, including neuromuscular disorders and cardiovascular disease (25). Moreover, diabetic patients have been reported to suffer from riboflavin deficiency, and flavin imbalance plays a vital role in the appearance of DR (26). The above evidence indicates that metabolic pathways may contribute to the process of DR.
Our results also showed that the pseudouridine gradient increased in DR and PDR subjects. From screening and fitting results based on LASSO-LR analysis, variable selection and regularization were performed when fitting a generalized linear curve. The variable profiling here mentions not setting all the variables into the model for fitting but to selectively set the variables into the model to obtain better performance parameters to avoid overfitting (27). Through LASSO-LR based machine learning methods, the optimal number of metabolites can be screened from a large number of variables, and equations based on these metabolites can be established. To our knowledge, there has been no metabolomics research on the impact of pseudouridine in patients who have undergone DR and disease progression. It has generally been acknowledged that pseudouridine, a fundamental metabolite, is a c-glycosyl pyrimidine that consists of uracil having a beta-D-ribofuranosyl residue attached at position 5. Pseudouridine is also associated with RNA modification (28), owing to the relative abundance and inertness of the isomer compared with other mNS in cells, and comprises approximately 5% of all cellular RNA nucleotides (29). The unique structural properties of pseudouridine contribute to the folding of tRNAs and rRNA, and recent research suggests that pseudouridylation influences the coding potential of mRNA. Recently, pseudouridine has been identified and observed in the plasma, urine or tissue of cancer patients with multiple malignancies, including prostate cancer (30), hepatocellular carcinoma lymphoma (31), colorectal cancer (32) and chronic kidney disease (33). Pseudouridine has also been shown to be a novel diagnostic metabolic marker of heart failure, which is similar to the observation of the Alexander D team, who found that pseudouridine was elevated in dilated cardiomyopathy patients (34). Besides, the relationship of pseudouridine and the risk of diabetes had been disclosed. Pseudouridine inhibits glucose utilization at the postreceptor level through lowering the intracellular Ca concentration to affect the progression of T2DM (35), and plasma pseudouridine predict both the risk and prevalence (36) and insulin resistance of T2DM (37). Moreover, plasma pseudouridine has been shown to be correlated with declining renal function and albuminuria in diabetic kidney disease (38, 39), suggesting a close relationship between the level of plasma pseudouridine and diabetic microangiopathy.
Glutamate, another metabolite that was shown to be associated with DR and PDR in our work, is the most abundant and versatile amino acid in the body. Under normal conditions, glutamate is the principal excitatory neurotransmitter in the brain and is involved in learning and memory (40). In addition, glutamate may play a role in acute brain damage after traumatic brain injury, cerebral ischemia and status epilepticus (41, 42), immune system (43), the endocrine system (44), kidney and coronary artery disease (45) and others. The roles of plasma glutamine acid in DR and disease progression have not yet been illustrated. However, some evidence has revealed their effect on the development of DM and DM-related complications. Glutamate is significantly associated with the risk of developing T2DM (45, 46). In addition, other studies have suggested that DM is accompanied by an accumulation of glutamate in the retina, which causes neurotoxicity and the development of DR (47, 48), while glutamine is regarded as the most individual metabolite for the presence of DR (49).
There were a few limitations in our study, one of which is its small sample size with only 78 plasma samples applicable for metabolomic analysis, which is unfavorable for investigating the robustness of the model. Therefore, the sensitivity and specificity of the diagnostic model should be assessed with an expanded number of patients as well as in a prospective cohort. In addition, the absolute concentration of candidate metabolites was not quantified and validated in our study, making them difficult to apply in the clinic.
In brief, liquid biopsy metabolomics could be applied to discriminate metabolic subphenotypes of DR and disease progression, with the identification and validation of specific circulating discriminant metabolites. Based on the aforementioned results, we were able to develop a risk score according to the level of metabolites for DR and PDR. Further investigations are required to quantitatively detect candidate metabolites in an expanded cohort. Nevertheless, our work demonstrated that this risk score based on molecular signatures should enable the monitoring of the appearance of disease and disease progression at an early stage.
The original contributions presented in the study are included in the article/supplementary material. Further inquiries can be directed to the corresponding authors.
Written informed consent was obtained from the individual(s) for the publication of any potentially identifiable images or data included in this article.
CL and SX conceived of and designed the experiments. YS, HZ, and XL performed the experiments. YS and HZ analyzed the data and YS wrote the manuscript. All authors contributed to the article and approved the submitted version.
The authors declare that the research was conducted in the absence of any commercial or financial relationships that could be construed as a potential conflict of interest.
All claims expressed in this article are solely those of the authors and do not necessarily represent those of their affiliated organizations, or those of the publisher, the editors and the reviewers. Any product that may be evaluated in this article, or claim that may be made by its manufacturer, is not guaranteed or endorsed by the publisher.
Suqian Key Research and Development Program (No. S201807) is gratefully acknowledged. The authors would also like to thank American Journal Experts for proofreading the article.
1. Ogurtsova K, da Rocha Fernandes JD, Huang Y, Linnenkamp U, Guariguata L, Cho NH, et al. IDF Diabetes Atlas: Global Estimates for the Prevalence of Diabetes for 2015 and 2040. Diabetes Res Clin Pract (2017) 128:40–50. doi: 10.1016/j.diabres.2017.03.024
2. Wang L, Gao P, Zhang M, Huang Z, Zhang D, Deng Q, et al. Prevalence and Ethnic Pattern of Diabetes and Prediabetes in China in 2013. JAMA (2017) 317:2515–23. doi: 10.1001/jama.2017.7596
3. Xu Y, Wang L, He J, Bi Y, Li M, Wang T, et al. Prevalence and Control of Diabetes in Chinese Adults. JAMA (2013) 310:948–59. doi: 10.1001/jama.2013.168118
4. Song P, Yu J, Chan KY, Theodoratou E, Rudan I. Prevalence, Risk Factors and Burden of Diabetic Retinopathy in China: A Systematic Review and Meta-Analysis. J Glob Health (2018) 8:010803. doi: 10.7189/jogh.08.010803
5. Sabanayagam C, Banu R, Chee ML, Lee R, Wang YX, Tan G, et al. Incidence and Progression of Diabetic Retinopathy: A Systematic Review. Lancet Diabetes Endocrinol (2019) 7:140–9. doi: 10.1016/S2213-8587(18)30128-1
6. Xu XH, Sun B, Zhong S, Wei DD, Hong Z, Dong AQ. Diabetic Retinopathy Predicts Cardiovascular Mortality in Diabetes: A Meta-Analysis. BMC Cardiovasc Disord (2020) 20:478. doi: 10.1186/s12872-020-01763-z
7. Leasher JL, Bourne RR, Flaxman SR, Jonas JB, Keeffe J, Naidoo K, et al. Global Estimates on the Number of People Blind or Visually Impaired by Diabetic Retinopathy: A Meta-Analysis From 1990 to 2010. Diabetes Care (2016) 39:1643–9. doi: 10.2337/dc15-2171
8. Wong TY, Cheung CM, Larsen M, Sharma S, Simo R. Diabetic Retinopathy. Nat Rev Dis Primers (2016) 2:16012. doi: 10.1038/nrdp.2016.12
9. Wang LZ, Cheung CY, Tapp RJ, Hamzah H, Tan G, Ting D, et al. Availability and Variability in Guidelines on Diabetic Retinopathy Screening in Asian Countries. Br J Ophthalmol (2017) 101:1352–60. doi: 10.1136/bjophthalmol-2016-310002
10. Mader S, Pantel K. Liquid Biopsy: Current Status and Future Perspectives. Oncol Res Treat (2017) 40:404–8. doi: 10.1159/000478018
11. Drabovich AP, Saraon P, Drabovich M, Karakosta TD, Dimitromanolakis A, Hyndman ME, et al. Multi-Omics Biomarker Pipeline Reveals Elevated Levels of Protein-Glutamine Gamma-Glutamyltransferase 4 in Seminal Plasma of Prostate Cancer Patients. Mol Cell Proteomics (2019) 18:1807–23. doi: 10.1074/mcp.RA119.001612
12. Bujak R, Struck-Lewicka W, Markuszewski MJ, Kaliszan R. Metabolomics for Laboratory Diagnostics. J Pharm BioMed Anal (2015) 113:108–20. doi: 10.1016/j.jpba.2014.12.017
13. Wishart DS. Metabolomics for Investigating Physiological and Pathophysiological Processes. Physiol Rev (2019) 99:1819–75. doi: 10.1152/physrev.00035.2018
14. Evangelatos N, Bauer P, Reumann M, Satyamoorthy K, Lehrach H, Brand A. Metabolomics in Sepsis and Its Impact on Public Health. Public Health Genomics (2017) 20:274–85. doi: 10.1159/000486362
15. Chen T, Ni Y, Ma X, Bao Y, Liu J, Huang F, et al. Branched-Chain and Aromatic Amino Acid Profiles and Diabetes Risk in Chinese Populations. Sci Rep (2016) 6:20594. doi: 10.1038/srep20594
16. American Diabetes A. 2. Classification and Diagnosis of Diabetes: Standards of Medical Care in Diabetes-2021. Diabetes Care (2021) 44:S15–33. doi: 10.2337/dc21-S002
17. American Diabetes A. 11. Microvascular Complications and Foot Care: Standards of Medical Care in Diabetes-2021. Diabetes Care (2021) 44:S151–67. doi: 10.2337/dc21-S011
18. Taylor RG, Levy HL, McInnes RR. Histidase and Histidinemia. Clinical and Molecular Considerations. Mol Biol Med (1991) 8:101–16.
19. Kanarek N, Keys HR, Cantor JR, Lewis CA, Chan SH, Kunchok T, et al. Histidine Catabolism is a Major Determinant of Methotrexate Sensitivity. Nature (2018) 559:632–6. doi: 10.1038/s41586-018-0316-7
20. Remo SC, Hevroy EM, Olsvik PA, Fontanillas R, Breck O, Waagbo R. Dietary Histidine Requirement to Reduce the Risk and Severity of Cataracts is Higher Than the Requirement for Growth in Atlantic Salmon Smolts, Independently of the Dietary Lipid Source. Br J Nutr (2014) 111:1759–72. doi: 10.1017/S0007114513004418
21. Brosnan ME, Brosnan JT. Histidine Metabolism and Function. J Nutr (2020) 150:2570S–5S. doi: 10.1093/jn/nxaa079
22. Zhu XR, Yang FY, Lu J, Zhang HR, Sun R, Zhou JB, et al. Plasma Metabolomic Profiling of Proliferative Diabetic Retinopathy. Nutr Metab (Lond) (2019) 16:37. doi: 10.1186/s12986-019-0358-3
23. Asleh R, Prasad M, Briasoulis A, Nardi V, Adigun R, Edwards BS, et al. Uric Acid is an Independent Predictor of Cardiac Allograft Vasculopathy After Heart Transplantation. J Heart Lung Transplant (2018) 37:1083–92. doi: 10.1016/j.healun.2018.04.017
24. Xu J, Wang G, Fu D, Su N, Wang L, Gao F, et al. High-Resolution Color Doppler Ultrasound Examination and Related Risk Factor Analysis of Lower Extremity Vasculopathy in Type 2 Diabetes Patients. Genet Mol Res (2015) 14:3939–47. doi: 10.4238/2015.April.27.8
25. Balasubramaniam S, Christodoulou J, Rahman S. Disorders of Riboflavin Metabolism. J Inherit Metab Dis (2019) 42:608–19. doi: 10.1002/jimd.12058
26. Sinha T, Al-Ubaidi MR, Naash MI. Flavin Imbalance as an Important Player in Diabetic Retinopathy. Adv Exp Med Biol (2019) 1185:575–9. doi: 10.1007/978-3-030-27378-1_94
27. Merdan S, Subramanian K, Ayer T, Van Weyenbergh J, Chang A, Koff JL, et al. Gene Expression Profiling-Based Risk Prediction and Profiles of Immune Infiltration in Diffuse Large B-Cell Lymphoma. Blood Cancer J (2021) 11:2. doi: 10.1038/s41408-020-00404-0
28. Helm M. Post-Transcriptional Nucleotide Modification and Alternative Folding of RNA. Nucleic Acids Res (2006) 34:721–33. doi: 10.1093/nar/gkj471
30. Stockert JA, Weil R, Yadav KK, Kyprianou N, Tewari AK. Pseudouridine as a Novel Biomarker in Prostate Cancer. Urol Oncol (2021) 39:63–71. doi: 10.1016/j.urolonc.2020.06.026
31. Amuro Y, Nakaoka H, Shimomura S, Fujikura M, Yamamoto T, Tamura S, et al. Serum Pseudouridine as a Biochemical Marker in Patients With Hepatocellular Carcinoma. Clin Chim Acta (1988) 178:151–8. doi: 10.1016/0009-8981(88)90221-5
32. Feng B, Zheng MH, Zheng YF, Lu AG, Li JW, Wang ML, et al. Normal and Modified Urinary Nucleosides Represent Novel Biomarkers for Colorectal Cancer Diagnosis and Surgery Monitoring. J Gastroenterol Hepatol (2005) 20:1913–9. doi: 10.1111/j.1440-1746.2005.03888.x
33. Sekula P, Dettmer K, Vogl FC, Gronwald W, Ellmann L, Mohney RP, et al. From Discovery to Translation: Characterization of C-Mannosyltryptophan and Pseudouridine as Markers of Kidney Function. Sci Rep (2017) 7:17400. doi: 10.1038/s41598-017-17107-5
34. Alexander D, Lombardi R, Rodriguez G, Mitchell MM, Marian AJ. Metabolomic Distinction and Insights Into the Pathogenesis of Human Primary Dilated Cardiomyopathy. Eur J Clin Invest (2011) 41:527–38. doi: 10.1111/j.1365-2362.2010.02441.x
35. Eldin WS, Ragheb A, Klassen J, Shoker A. Evidence for Increased Risk of Prediabetes in the Uremic Patient. Nephron Clin Pract (2008) 108:c47–55. doi: 10.1159/000112529
36. Yu D, Moore SC, Matthews CE, Xiang YB, Zhang X, Gao YT, et al. Plasma Metabolomic Profiles in Association With Type 2 Diabetes Risk and Prevalence in Chinese Adults. Metabolomics (2016) 12:3. doi: 10.1007/s11306-015-0890-8
37. Papandreou C, Bullo M, Ruiz-Canela M, Dennis C, Deik A, Wang D, et al. Plasma Metabolites Predict Both Insulin Resistance and Incident Type 2 Diabetes: A Metabolomics Approach Within the Prevencion Con Dieta Mediterranea (PREDIMED) Study. Am J Clin Nutr (2019) 109:626–34. doi: 10.1093/ajcn/nqy262
38. Niewczas MA, Sirich TL, Mathew AV, Skupien J, Mohney RP, Warram JH, et al. Uremic Solutes and Risk of End-Stage Renal Disease in Type 2 Diabetes: Metabolomic Study. Kidney Int (2014) 85:1214–24. doi: 10.1038/ki.2013.497
39. Solini A, Manca ML, Penno G, Pugliese G, Cobb JE, Ferrannini E. Prediction of Declining Renal Function and Albuminuria in Patients With Type 2 Diabetes by Metabolomics. J Clin Endocrinol Metab (2016) 101:696–704. doi: 10.1210/jc.2015-3345
40. Zhou Y, Danbolt NC. Glutamate as a Neurotransmitter in the Healthy Brain. J Neural Transm (Vienna) (2014) 121:799–817. doi: 10.1007/s00702-014-1180-8
41. Meldrum BS. Glutamate as a Neurotransmitter in the Brain: Review of Physiology and Pathology. J Nutr (2000) 130:1007S–15S. doi: 10.1093/jn/130.4.1007S
42. Iovino L, Tremblay ME, Civiero L. Glutamate-Induced Excitotoxicity in Parkinson’s Disease: The Role of Glial Cells. J Pharmacol Sci (2020) 144:151–64. doi: 10.1016/j.jphs.2020.07.011
43. Marazziti D, Albert U, Mucci F, Piccinni A. The Glutamate and the Immune Systems: New Targets for the Pharmacological Treatment of OCD. Curr Med Chem (2018) 25:5731–8. doi: 10.2174/0929867324666171108152035
44. Maechler P. Glutamate Pathways of the Beta-Cell and the Control of Insulin Secretion. Diabetes Res Clin Pract (2017) 131:149–53. doi: 10.1016/j.diabres.2017.07.009
45. Ottosson F, Smith E, Melander O, Fernandez C. Altered Asparagine and Glutamate Homeostasis Precede Coronary Artery Disease and Type 2 Diabetes. J Clin Endocrinol Metab (2018) 103:3060–9. doi: 10.1210/jc.2018-00546
46. Sriboonvorakul N, Pan-Ngum W, Poovorawan K, Winterberg M, Tarning J, Muangnoicharoen S. Assessment of the Amino Acid Profile in Thai Patients With Type 2 Diabetes Mellitus Using Liquid Chromatography-Mass Spectrometry. Int Health (2020) 13:367–73. doi: 10.1093/inthealth/ihaa083
47. Kowluru RA, Engerman RL, Case GL, Kern TS. Retinal Glutamate in Diabetes and Effect of Antioxidants. Neurochem Int (2001) 38:385–90. doi: 10.1016/S0197-0186(00)00112-1
48. Li Q, Puro DG. Diabetes-Induced Dysfunction of the Glutamate Transporter in Retinal Muller Cells. Invest Ophthalmol Vis Sci (2002) 43:3109–16.
Keywords: diabetic retinopathy, plasma metabolomics, biomarkers, diabetes mellitus, machine learning
Citation: Sun Y, Zou H, Li X, Xu S and Liu C (2021) Plasma Metabolomics Reveals Metabolic Profiling For Diabetic Retinopathy and Disease Progression. Front. Endocrinol. 12:757088. doi: 10.3389/fendo.2021.757088
Received: 11 August 2021; Accepted: 29 September 2021;
Published: 29 October 2021.
Edited by:
Lei Ye, National Heart Centre Singapore, SingaporeReviewed by:
Xiaocen Kong, Nanjing Medical University, ChinaCopyright © 2021 Sun, Zou, Li, Xu and Liu. This is an open-access article distributed under the terms of the Creative Commons Attribution License (CC BY). The use, distribution or reproduction in other forums is permitted, provided the original author(s) and the copyright owner(s) are credited and that the original publication in this journal is cited, in accordance with accepted academic practice. No use, distribution or reproduction is permitted which does not comply with these terms.
*Correspondence: Chao Liu, cHJvZmxpdWNoYW9AMTYzLmNvbQ==; Shuhang Xu, c2h1aGFuZ3h1QDE2My5jb20=
Disclaimer: All claims expressed in this article are solely those of the authors and do not necessarily represent those of their affiliated organizations, or those of the publisher, the editors and the reviewers. Any product that may be evaluated in this article or claim that may be made by its manufacturer is not guaranteed or endorsed by the publisher.
Research integrity at Frontiers
Learn more about the work of our research integrity team to safeguard the quality of each article we publish.