
95% of researchers rate our articles as excellent or good
Learn more about the work of our research integrity team to safeguard the quality of each article we publish.
Find out more
ORIGINAL RESEARCH article
Front. Endocrinol. , 08 November 2021
Sec. Obesity
Volume 12 - 2021 | https://doi.org/10.3389/fendo.2021.739277
This article is part of the Research Topic Endocrine and Metabolic Consequences of Childhood Obesity View all 16 articles
 Xijie Wang1,2,3
 Yanjun Chen4
 Jun Ma3
 Bin Dong3*Yanhui Dong3*
 Zhiyong Zou3Yinghua Ma3Luke Arnold5Wannian Liang1,2
Introduction: To ascertain the possible cut point of tri-ponderal mass index (TMI) in discriminating metabolic syndrome (MetS) and related cardio-metabolic risk factors in Chinese and American children and adolescents.
Methods: A total of 57,201 Chinese children aged 7-18 recruited in 2012 and and 10,441 American children aged 12-18 from National Health and Nutrition Examination Survey (NHANES 2001-2014) were included to fit TMI percentiles. Participants were randomly assigned to a derivation set (75%) and validation set (25%). The cut points of TMI with the lowest misclassification rate under the premise of the highest area under curves (AUC) were selected for each sex, which were additionally examined in the validation set. All of data analysis was conducted between September and December in 2019.
Results: TMI showed good capacity on discriminating MetS, with AUC of 0.7658 (95% CI: 0.7544-0.7770) to 0.8445 (95% CI: 0.8349-0.8537) in Chinese and 0.8871 (95% CI: 0.8663-0.9056) to 0.9329 (95% CI: 0.9166-0.9469) in American children. The optimal cut points were 14.46 kg/m3 and 13.91 kg/m3 for Chinese boys and girls, and 17.08 kg/m3 and 18.89 kg/m3 for American boys and girls, respectively. The corresponding misclassification rates were 17.1% (95% CI: 16.4-17.8) and 11.2% (95% CI: 9.9-12.6), respectively. Performance of these cut points were also examined in the validation set (sensitivity 67.7%, specificity 82.4% in Chinese; sensitivity 84.4%, specificity 88.7% in American children).
Conclusions: A sex- and ethnicity- specific single cut point of TMI could be used to distinguish MetS and elevated risk of cardio-metabolic factors in children and adolescents.
Metabolic syndrome (MetS), specified by the National Cholesterol Education Program Adult Treatment Panel III (ATP III), is a strong and independent predictor of all-cause and cardiovascular disease (CVD) mortality (1, 2). Its prevalence has increased from approximately 2% in the mid-1990s to a current estimate of 10% in American children and adolescents (3–5). It was also estimated that nearly two thirds (63.4%) of American adolescents had at least 1 metabolic abnormality (5). In Chinese children aged 10-16, the prevalence of MetS ranged from 5.5% to 10.9%, depending on the definition used in the study (6, 7). Results from The China Health and Nutrition Survey suggested an overall prevalence of 3.37% in children aged 7-18, using ATP III definition (8). Since childhood MetS is likely to track into adulthood, early identification could help to prevent definitive lesions (9) and target interventions to improve future cardiovascular health (5, 10).
In consideration of the great importance of early identification, an accessible screening tool is needed for daily public health practice (11), especially in the less developed areas where professional pediatricians are deficient. Body mass index (BMI), calculated as weight(kg)/height2 (m2) has been the most widely used indicator in screening obesity and related diseases, including MetS (12). In recent decades, given the fact that central obesity is the biggest risk factor of MetS (13), waist circumference has been accepted as another efficient screening tool for MetS in young population (14–16). However, as children’s body shape changes dramatically during puberty, both measures required multiple cut-off values to fit age and sex subgroups of children.
Tri-ponderal mass index (TMI), calculated as weight(kg)/height3 (m3), has been reported to be a satisfactory adiposity indicator with good age-stability during adolescence (17, 18). Studies have also proven it to be an efficient indicator in screening obesity related cardio-metabolic risks including dyslipidemia, insulin resistance and other cardiovascular diseases (19–21). However, few studies have evaluated TMI cut point for screening of MetS and cardio-metabolic risks in pediatric populations. Although one study conducted in Colombian children and adolescents suggested that TMI could be a satisfying indicator to discriminate MetS, the authors gave age- and sex- specific screening thresholds (22), which didn’t take the best advantage of its age-stability.
Using cross-sectional baseline data from the Chinese school-based Health Life Intervention and United States National Health and Nutrition Examination Survey (NHANES 2001-2014), the present study aimed to ascertain the optimal TMI cut point for identifying MetS and cardio-metabolic risk factors in Chinese and American children and adolescents.
Data for Chinese participants were obtained from baseline data of a Chinese school-based Health Life Intervention study, which was a national school-based multi-centered cluster randomized controlled trial against obesity in Chinese children and adolescents conducted in 2012. The sampling procedure of this study has been published elsewhere in detail (23). Briefly, more than 60,000 children and adolescents from 7 provinces, including Liaoning, Tianjin, Ningxia, Shanghai, Chongqing, Hunan, and Guangdong, participated in the study. In each province, 12-16 primary and secondary schools totaling around 10,000 participants were randomly selected. Of each selected school, two classes were randomly selected from each grade and students in those classes were invited for blood sample collection. Of the 59,916 participants aged 7 to 18 years, 2,715 were excluded due to missing sex, height or weight data. The remaining sample size for TMI derivation and analysis was 57,201, including 15,045 participants with blood samples. The original study was approved by Ethical Committee of the university. All participants and their parents provided signed informed consent.
Data for American participants were obtained from 7 cycles of National Health and Nutrition Examination Survey (NHANES 2001-2014) public release data, for which collection methods had been described in detail elsewhere (24). NHANES is an American national representative and continuous cross-sectional survey conducted every 2 years. In this study, only adolescents aged between 12 and 18 were included, as serum glucose and lipid profiles were unavailable for those younger than 12. Among those aged 12 to 18 years old, 667 participants with missing data of height and weight were excluded. Thus, the sample size for TMI analysis in this study was 10,441, and the sample size for the following analysis was 2,910.
Within each population, participants were randomly allocated to derivation set (75%) and validation set (25%) by a random number table in Stata. Participants with full records of height, weight and age were recruited in fitting TMI percentiles, while only those with complete records of all 5 risk components of MetS were recruited in the following analysis. Basically, the optimal TMI cut points were developed from derivation set and were validated in validation set.
All Chinese participants underwent physical examination according to a standard protocol (19). Height was measured using the portable stadiometer (model TZG, China) to the nearest 0.1 cm, with participants standing straight barefoot. Weight was measured with lever type weight scale (model RGT-140, China) to the nearest 0.1 kg, with participants wearing light underwear. Waist circumference was measured with steel tape at 1 cm above umbilicus to the nearest 1 mm. Height, weight and waist circumference were all measured twice and the mean values were recorded.
Blood pressure was measured according to the recommendation of the National High Blood Pressure Education Program (NHBPEP) Working Group in Children and Adolescents (21). Mercury sphygmomanometers (model XJ11D, China), stethoscopes (model TZ-1, China), and appropriate cuffs were used for blood pressure measurement. Participants were asked to sit quietly for at least 5 minutes prior to the first reading. Systolic blood pressure (SBP) was determined by onset of the first Korotkoff sound and diastolic blood pressure (DBP) was determined by the fifth Korotkoff sound. Blood pressure was measured twice with five minutes’ gap between two measurements, and the average of SBP and DBP values were separately calculated. Blood samples were collected after a 12-hour fasting. Fasting plasma glucose (FPG), triglyceride (TG), and high-density lipoprotein cholesterol (HDL-C) were measured using an automatic biochemical analyzer (Roche Modular P800 ISE900; Hoffmann-La Roche Ltd) by a qualified biological testing company. Rigid quality control was enforced in this study. All measurement instruments were calibrated before use, and all examiners were required to pass a standard training course before commencement.
For American participants, anthropometric measurements were collected according to protocols previously published in detail (24). Sex and age were self-reported during home interviews. FPG, TG and HDL-C levels were measured enzymatically at Johns Hopkins University Lipoprotein Analytic Laboratory with the use of a Hitachi 704 Analyzer (Boehringer Mannheim Diagnostics, Indianapolis, IN). Lipid collection and analyses were standardized to Centers for Disease Control and Prevention criteria (25).
TMI for each participant was calculated as weight (kg)/height3 (m3).
According to the criteria of National Cholesterol Education Program (NCEP) Adult Treatment Panel III (ATP III), children were considered to have MetS if they showed three or more of the following (2, 26): (1) central obesity (waist circumference ≥ 90th sex- and age-specific percentile); (2) high fasting glucose (FPG ≥ 110 mg/dL or 6.1 mmol/L); (3) hypertriglyceridemia (TG ≥ 110 mg/dL or 1.242 mmol/L); (4) low HDL-C (HDL-C ≤ 40 mg/mL or 1.0344 mmol/L); (5) high blood pressure (blood pressure ≥ 90th sex-, age- and height-specific percentile). The definitions were also showed in Supplementary Table 1.
As reference values for waist circumference vary across ethnic groups, “High Waist Circumference Screening Threshold Among Chinese Children and Adolescents Aged 7-18 years” (27) and “Anthropometric Reference Data for Children and Adults: United States” (28) were used for Chinese and American populations, respectively. Blood pressure was evaluated with the 2017 version of the Clinical practice guideline for screening and management of high blood pressure in children and adolescents (29).
All of data analysis was conducted between September and December in 2019. The characteristics of participants were given as mean (SD) or number (%). Independent two-tailed t-tests for continuous variables and chi-square (χ2) tests for categorical variables were used to compare the differences between derivation set and validation set in Chinese and American participants, respectively. LMS curves were generated with LMScharmaker (version 2.5, developed by HARLOW PRINTING LIMITED) to estimate TMI changes with age in both sexes in Chinese and American participants, respectively. Since TMI showed good stability with increasing age, especially within the range from P5 to P90 (results displayed in Supplementary Figure 1), the following analyses were carried in the absence of age factors.
The relationships between TMI percentile and prevalence of MetS components were estimated with logistic regression and fractional polynomial regression models by sex. Receiver operating characteristic (ROC) analysis was used to find the possible range of TMI cut-off percentiles, and the alternative points were identified as those with the highest Youden Index (30). Five optimal cut-off percentiles were selected for further analysis based on their capacity to distinguish MetS. The cut-off percentile with the lowest misclassification rate were selected under the premise of the largest area under ROC curves (AUC) (31). The cut-off values obtained from the derivation set were then validated in the validation set, by calculating their AUC and misclassification rate. Sensitivity analyses were conducted between sex groups for participants in both countries, while urban-rural disparities and ethical disparities were estimated for Chinese and American populations, respectively. All analyses were performed using Stata 14.0 (College Station, TX, USA) and associations were considered significant when performed at levels of P < 0.05 (two sides).
A total of 57,201 Chinese participants and 10,441 American participants were included in the present study, while 15,045 Chinese and 2,910 American participants had complete records of MetS risk components. The summary of their characteristics, including height, weight, waist circumference and MetS risk factors, are shown in Table 1. The prevalence of MetS is 6.6% to 7.0% for Chinese participants and 3.7% to 4.3% for American participants depending on derivation or validation set. Generally, no significant difference in MetS prevalence or other variables was observed between the two sets.
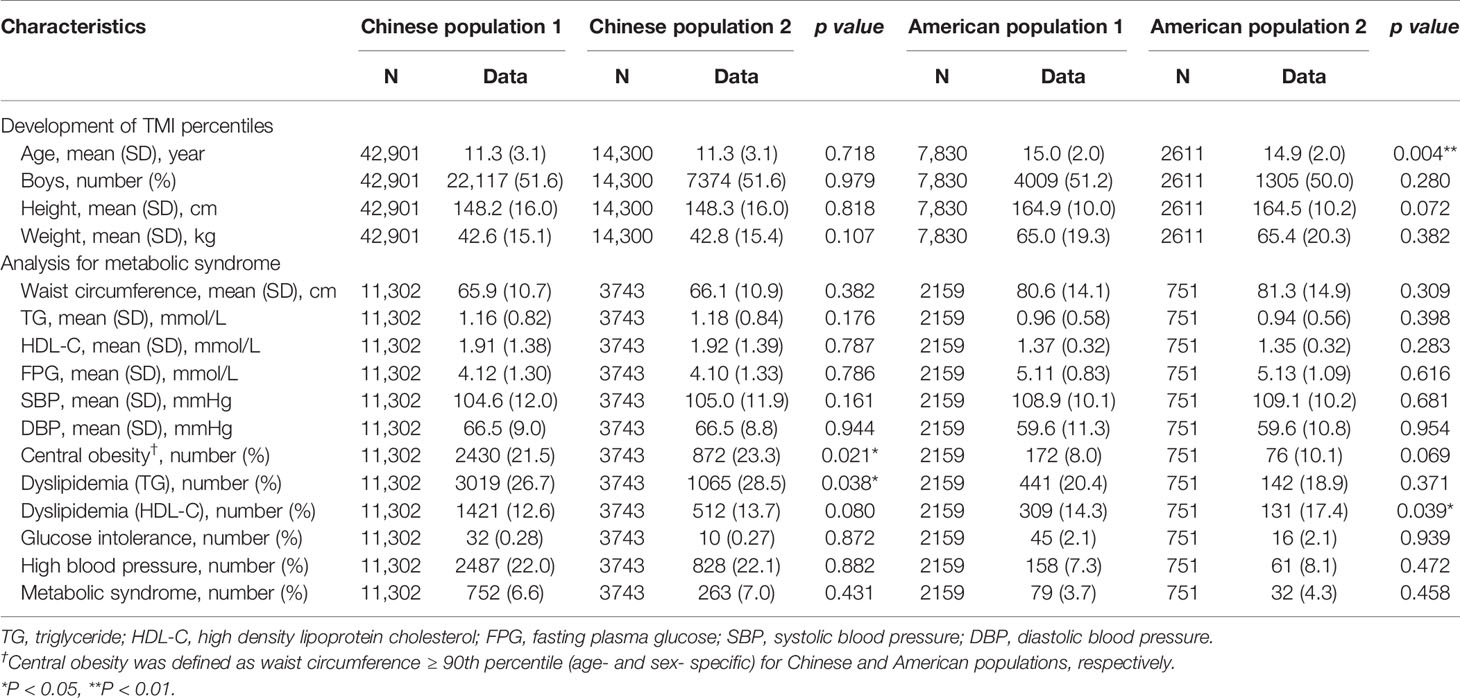
Table 1 Characteristics of Chinese and American participants, with mean and standard deviation (SD) for continuous variable and number and % for categorical variables.
As TMI percentile increased, estimated prevalence of all cardio-metabolic risk factors, including MetS, increased considerably. Notably, between P70 and P80 in Chinese participants, the estimated prevalence of MetS increased rapidly in both sexes. A similar pattern was also detected in American participants, notably between P80 and P90 (Figures 1A–D).
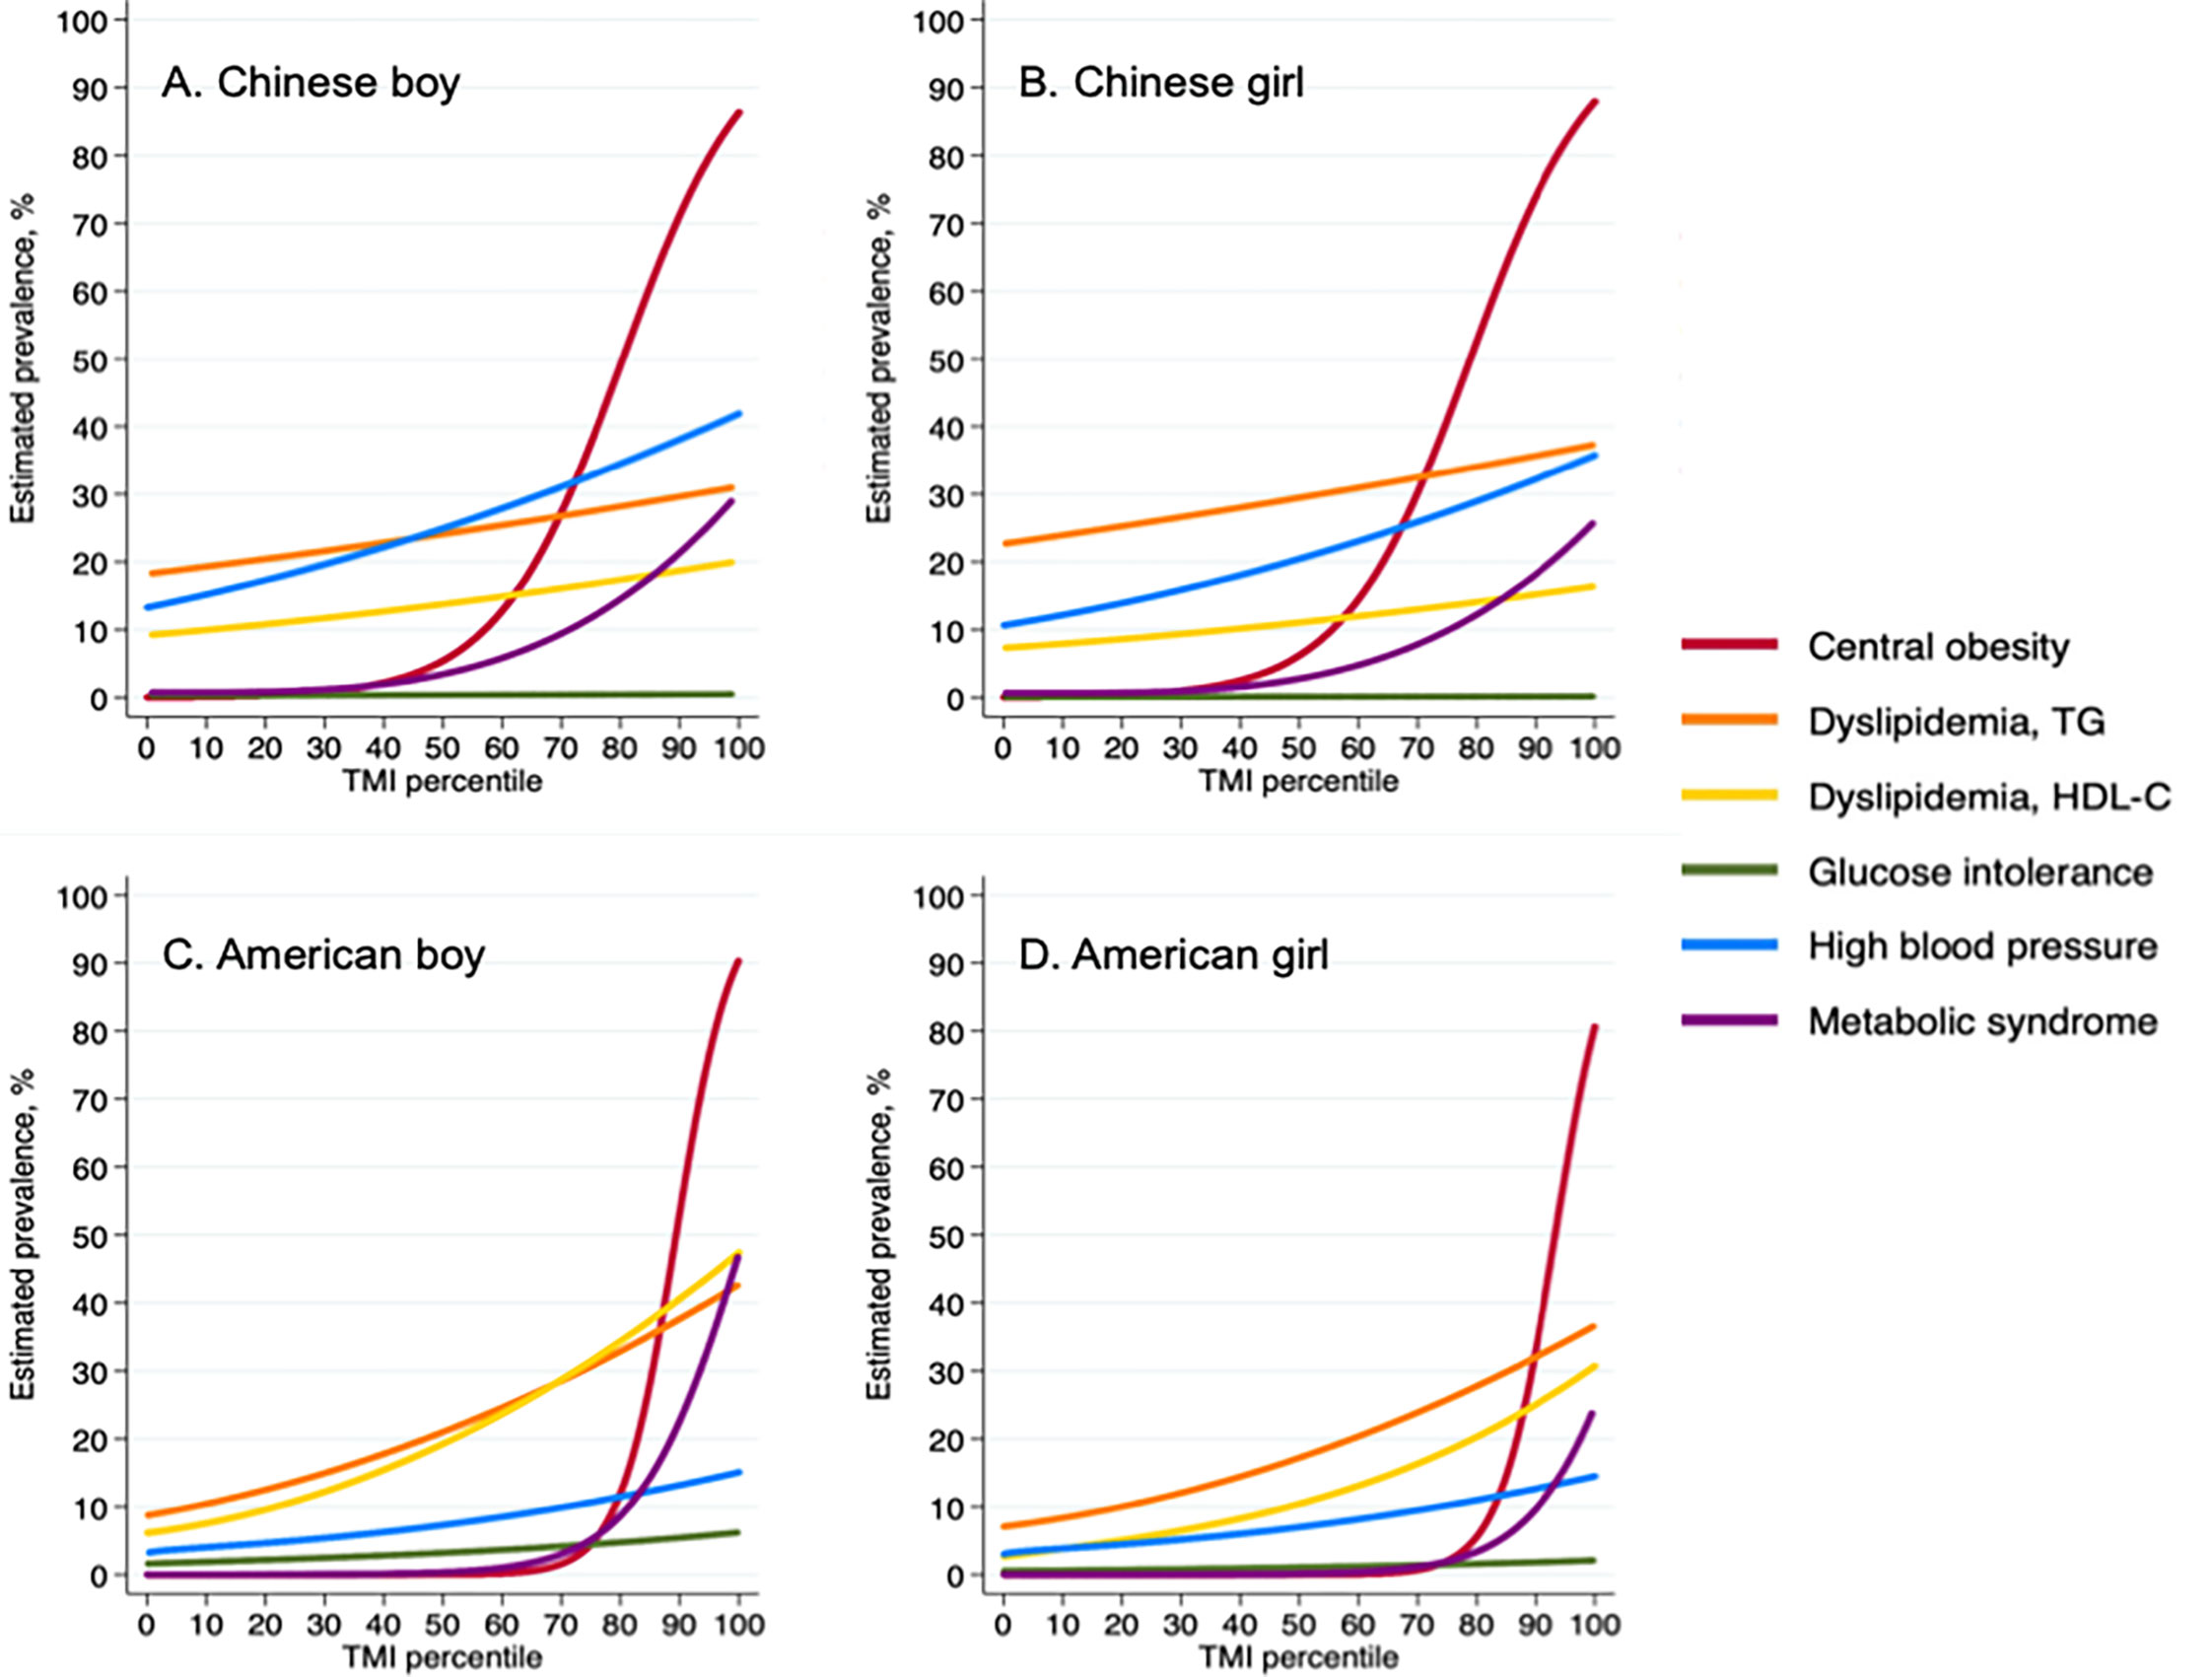
Figure 1 Prevalence of cardiometabolic risk factors according to Tri-ponderal mass index percentiles among Chinese and American children. TMI, tri-ponderal mass index (kg/m3); TG, triglyceride; HDL-C, high density lipoprotein cholesterol; FPG, fasting plasma glucose. (A) Chinese boy; (B) Chinese girl; (C) American boy; (D) American girl.
TMI showed good capacity in diagnosing MetS in both Chinese and American participants. The area under ROC curves for TMI-MetS were 0.8445 (95% CI: 0.8349-0.8537, boys) and 0.7658 (95% CI: 0.7544-0.7770, girls) for Chinese participants and 0.9329 (95% CI: 0.9166-0.9469, boys) and 0.8871 (95% CI: 0.8663-0.9056, girls) for American participants. The optimal cut-off percentiles ranged from 72.9 to 79.9 based on the highest Youden index in Chinese and American participants (Supplementary Table 2), therefore P70, P75, P80, P85 and P90 were selected for further evaluation. The corresponding TMI values of these percentiles are listed in Supplementary Table 3.
The results of AUC and misclassification rate analyses are shown in Figures 2A, B, demonstrating a reduction in the misclassification rate and AUC as higher percentiles were tested. In Chinese participants, AUC of P70, P75 and P80 varied from 0.7486 (95% CI: 0.7313-0.7660) to 0.7570 (95% CI: 0.7405-0.7735) with no statistical differences, while the AUC decreased significantly from P80 (0.7570, 95% CI: 0.7405-0.7735) to P85 (0.7294, 95% CI: 0.7115-0.7474). In American participants, the inflection point of AUC was around P90, where the AUC declined significantly from 0.8140 (95% CI: 0.7645-0.8634) for P85 to 0.7674 (95% CI: 0.7127-0.8221). Under the premise of keeping the highest AUC, the points with the lowest misclassification rate were selected for Chinese and American participants, respectively, as the possible thresholds for discriminating MetS (31). The corresponding misclassification rates were 17.1% (95% CI: 16.4-17.8) and 11.2% (95% CI: 9.9-12.6) in Chinese and American populations, respectively. Therefore, the optimal TMI percentile was P80 (TMI values of 14.46 kg/m3 for males and 13.91 kg/m3) for females, respectively) for Chinese participants and P85 (TMI values of 17.08 kg/m3 for males and 18.89 kg/m3 for females, respectively) for American participants. The selected optimal TMI values were additionally tested in the validation set, and the results supported what was found in the derivation set (Table 2).
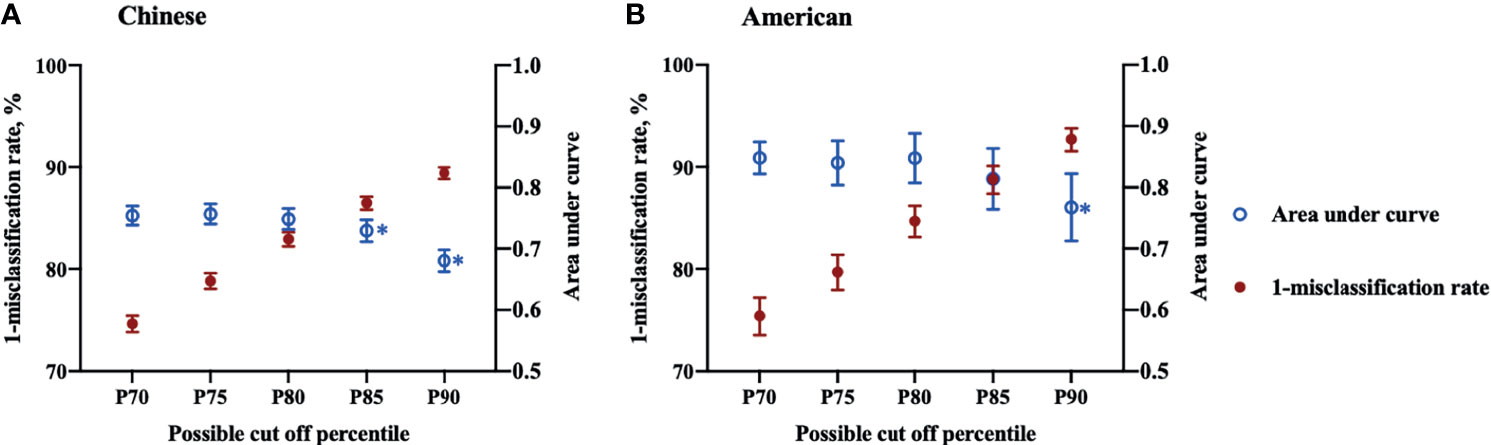
Figure 2 Misclassification rates and area under curves of Tri-ponderal mass index in assessing metabolic syndrome in Chinese and American children. Sex specific P70, P75, P80, P85 and P90 were used as threshold values for each population.* The area under curve decreased significantly compared to the former cut off percentile. (A) Chinese children; (B) American children.
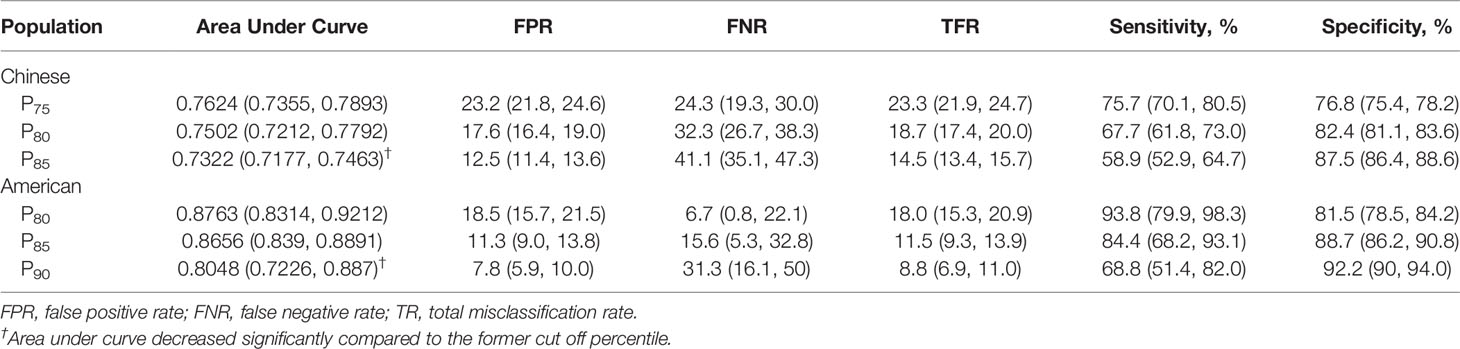
Table 2 Validation of selected cut-off percentile of Tri-ponderal mass index in identifying cardiometabolic risks in Chinese and American validate populations.
The results for sensitivity analyses were displayed in Supplementary Tables 4, 5 with derivation population. In Chinese population, the capacity of the cut points were generally consistent with those from all population, although 13.93 kg/m3 (P75) may be optimal for Chinese boys. However, as the sample size of derivations set was rather small, the results should be test in further studies with bigger population. In the American population, P85 showed good consistency in all participants except for Mexican American, for whom P90 may be more appropriate cut-off percentile, as the AUC was significantly higher than other percentiles.
MetS affects approximately 35% of adults in the United States of America and is also a great threat in developing countries, including China (32, 33). Let alone the MetS and related cardiovascular risks originated from childhood has significant influence on future diseases (34), it is of consensus that regular monitoring/management is important for children, especially for those with high MetS risk (7).
The present study found that TMI could be a satisfying index in identifying MetS and other cardio-metabolic risks in young Chinese and American populations. The thresholds established to identify elevated MetS risk were 14.46 kg/m3 for boys vs. 13.91 kg/m3 for girls in Chinese participants aged between 7 to 18, and 17.08 kg/m3 for boys vs. 18.89 kg/m 3 for girls in American participants aged between 12 to 18. These cut points showed favorable capacity in discriminating MetS and related risks and performed good consistency in subgroup analysis.
TMI as an alternative option for BMI has been paid increasing attention in recent years, especially in pediatric populations where BMI changes with age. Previous studies found that TMI remained steady throughout childhood and showed good consistency to the percent of body fat (17, 18, 20). These qualities made TMI a satisfactory indicator in daily screening of excessive weight and related cardiometabolic diseases. The present study verified its age-stability and ulterior discussed the possible TMI thresholds to discriminate MetS in both Chinese and American children. Compared to the thresholds derived from a previous study in a Columbian population (22), the present study found higher TMI cut-points in Chinese children, and even higher cut-points in American children. The distinction between ethnic groups had been discovered previously when researchers attempted to set country-specific BMI thresholds, as they found that people from Asia and Pacific regions had a higher percent of body fat and waist-to-hip ratio than Caucasians at a given BMI (35). Further studies also found that even if their anthropometric measurements were within a safe range, people from eastern countries would have higher disease risk than their western counterparts (36, 37). Besides, various cut-off points among different sex, race and ethic subgroups were found, indicating that even if TMI presented good age-stability during childhood, sex and ethic disparities should be considered in setting country-specific cut-points. For more validated TMI cutoff points, more standardized research under global cooperation should be conducted, in order to eliminate any possible deviations resulted from operators and testing examinations. For many years, researchers have been seeking an appropriate screening tool to identify adiposity, as well as obesity-related disease risk in children. Apart from age- and sex- specific BMI used for screening general adiposity, waist circumference and waist-to-height ratio are also becoming popular for central obesity (38). However, as these indicators were normally recommended for further assessment in children with risk of developing other long-term health problems than obesity, their applications in general younger populations were still under debate (39). Although, in our previous research, further combination with waist circumference did not improve the ability of discriminating high risk population of TMI in children and adolescents (20). The present study, with two national-representative surveys, provided a possible choice with both age-stability and good capacity in recognizing cardio-metabolic abnormalities. From a practical point of view, TMI bases only on height and weight measurements, and requires very simple calculation. The number of TMI thresholds for screening adiposity is also much less than those of BMI, and doesn’t depend on age- specific percentiles. These qualities make TMI an accessible, easy, and accurate indicator for long-term monitoring of childhood cardio-metabolic abnormalities in primary care settings. And it could also be useful for school-based and community surveillance efforts in early prevention of cardio-metabolic risks (40).
The current study had its limitations. Cross-sectional data was obtained from Chinese and American populations. Although majority of adolescent years were included in the present study, TMI variance at individual levels was still undetected. Meanwhile, it remained undetected that whether the time lag between two populations would make any difference to the primary findings of the present study. In addition, ethnic differences must be taken into consideration in application of TMI. Although this study conducted ethnic-stratified sensitivity analyses in American participants and found good consistency between non-Hispanic white, non-Hispanic black and other ethnic groups, it may be insufficient for making a general cut-point. Ethnic-specific studies may need further consideration, while any differences resulted from operator, testing equipment or definition on specific metabolic disorders should also be taken into consideration. Moreover, the method of waist circumference in Chinese children was not standard. Although it was proved to be similar to the standard method in analyzing abdominal fat (data published in Chinese only), underestimation of actual waist circumference was also possible. This emphasizes the importance of collaborative and standardized cooperation again.
TMI could be an accurate and convenient population-based screening tool for MetS and related cardio-metabolic risk factors in Chinese and American children and adolescents. Corresponding TMI values for sex-specific P80 in Chinese and P85 in American populations could be utilized as appropriate thresholds in clinical practice.
The raw data supporting the conclusions of this article will be made available by the authors, upon reasonable request.
The studies involving human participants were reviewed and approved by Ethical Committee of Peking University. Written informed consent to participate in this study was provided by the participants’ legal guardian/next of kin.
XW performed all statistical analyses and wrote the manuscript. JM is the principle investigator of the original study. BD and YD are co-investigators and reviewed and edited the manuscript. ZZ and YM are co-investigator of the original study. LA, YC, and WL reviewed and edited the manuscript. XW takes full responsibility for the contents of the article. All authors contributed to the article and approved the submitted version.
The present research was supported by funding of National Natural Science Foundation of China (No. 81673192, rewarded to JM; No. 81903344, rewarded to BD), Young Researcher Personal Project of Beijing to BD.
The authors declare that the research was conducted in the absence of any commercial or financial relationships that could be construed as a potential conflict of interest.
All claims expressed in this article are solely those of the authors and do not necessarily represent those of their affiliated organizations, or those of the publisher, the editors and the reviewers. Any product that may be evaluated in this article, or claim that may be made by its manufacturer, is not guaranteed or endorsed by the publisher.
The authors greatly appreciated the the Educational Administration Leaderships and primary and middle school health nurses who worked hard on data collection.
The Supplementary Material for this article can be found online at: https://www.frontiersin.org/articles/10.3389/fendo.2021.739277/full#supplementary-material
Supplementary Figure 1 | Age- and sex- specific Tri-ponderal mass index (TMI) values for Chinese children aged 7 to 18 and for American children aged 12 to 18.
Supplementary Table 1 | Definition of cardiometabolic risk factors. Waist circumference percentiles were determined from “High waist circumference screening threshold among children and adolescents aged 7–18 years” for Chinese children, and from Anthropometric reference data for children and adults: United States, 2011-2014 for American children.
Supplementary Table 2 | Parameters of the receiver operating characteristic (ROC) curves analysis for the diagnostic performance of Tri-ponderal Mass (TMI) in identifying cardiometabolic risks in Chinese and American children. TG, triglycerides; HDL-C, high density lipoprotein cholesterol; CI, confidential interval; PV (+), positive predictive value; PV (-), negative predictive value.
Supplementary Table 3 | Tri-ponderal mass index threshold for the optimal cut-off percentiles.
Supplementary Table 4 | Sensitivity analysis of different subgroups in Chinese validate population. FPR, false positive rate; FNR, false negative rate; TR, total misclassification rate. * Area under curve decreased significantly compared to the former cut off percentile. Sex specific 75th, 80th and 85th percentiles were used as threshold values for each population.
Supplementary Table 5 | Sensitivity analysis of different subgroups in American validate population.
1. Zambon S, Zanoni S, Romanato G, Corti MC, Noale M, Sartori L, et al. Metabolic Syndrome and All-Cause and Cardiovascular Mortality in an Italian Elderly Population. Diabetes Care (2009) 32:153–9. doi: 10.2337/dc08-1256
2. Cook S, Weitzman M, Auinger P, Nguyen M, Dietz WH. Prevalence of a Metabolic Syndrome Phenotype in Adolescents. Arch Pediatr Adolesc Med (2003) 157:821. doi: 10.1001/archpedi.157.8.821
3. Steinberger J, Daniels SR, Eckel RH, Hayman L, Lustig RH, McCrindle B, et al. Progress and Challenges in Metabolic Syndrome in Children and Adolescents. A Scientific Statement From the American Heart Association Atherosclerosis, Hypertension, and Obesity in the Young Committee of the Council on Cardiovascular Disease in the Young. Circ (2009) 119:628–47. doi: 10.1161/CIRCULATIONAHA.108.191394
4. Lee AM, Gurka MJ, DeBoer MD. Trends in Metabolic Syndrome Severity and Lifestyle Factors Among Adolescents. Pediatr (2016) 137:3.e20153177. doi: 10.1542/peds.2015-3177
5. De Ferranti SD, Gauvreau K, Ludwig DS, Neufeld EJ, Newburger JW, Rifai N. Prevalence of the Metabolic Syndrome in American Adolescents: Findings From the Third National Health and Nutrition Examination Survey. Circ (2004) 110:2494–7. doi: 10.1161/01.CIR.0000145117.40114.C7
6. Wang Q, Yin J, Xu L, Cheng H, Zhao X, Xiang H, et al. Prevalence of Metabolic Syndrome in a Cohort of Chinese Schoolchildren: Comparison of Two Definitions and Assessment of Adipokines as Components by Factor Analysis. BMC Public Health (2013) 13. doi: 10.1186/1471-2458-13-249
7. Magge SN, Goodman E, Armstrong SC. The Metabolic Syndrome in Children and Adolescents: Shifting the Focus to Cardiometabolic Risk Factor Clustering CLINICAL REPORT Guidance for the Clinician in Rendering Pediatric Care. From Am Acad Pediatr Pediatr (2017) 140:20171603. doi: 10.1542/peds.2017-1603
8. Song P, Yu J, Chang X, Wang M, An L. Prevalence and Correlates of Metabolic Syndrome in Chinese Children: The China Health and Nutrition Survey. Nutrients (2017) 9:1–11. doi: 10.3390/nu9010079
9. Halpern A, Mancini MC, Magalhães MEC, Fisberg M, Radominski R, Bertolami MC, et al. Metabolic Syndrome, Dyslipidemia, Hypertension and Type 2 Diabetes in Youth: From Diagnosis to Treatment. Diabetol Metab Syndr (2010) 2:55. doi: 10.1186/1758-5996-2-55
10. Graf C, Ferrari N. Metabolic Syndrome in Children and Adolescents. Visc Med (2016) 32:357–62. doi: 10.1159/000449268
11. Zimmet P, Alberti G, Kaufman F, Tajima N, Silink M, Arslanian S, et al. The Metabolic Syndrome in Children and Adolescents. Lancet (2007) 369:2059–61. doi: 10.1016/S0140-6736(07)60958-1
12. Gurka MJ, Filipp SL, Musani SK, Sims M, DeBoer MD. Use of BMI as the Marker of Adiposity in a Metabolic Syndrome Severity Score: Derivation and Validation in Predicting Long-Term Disease Outcomes. Metab (2018) 83:68–74. doi: 10.1016/j.metabol.2018.01.015
13. Macpherson M, de Groh M, Loukine L, Prud’homme D, Dubois L. Prevalence of Metabolic Syndrome and its Risk Factors in Canadian Children and Adolescents: Canadian Health Measures Survey Cycle 1 (2007-2009) and Cycle 2 (2009-2011). Heal Promot Chronic Dis Prev Canada (2016) 36:32–40. doi: 10.24095/hpcdp.36.2.03
14. Wicklow BA, Becker A, Chateau D, Palmer K, Kozyrskij A, Sellers EAC. Comparison of Anthropometric Measurements in Children to Predict Metabolic Syndrome in Adolescence: Analysis of Prospective Cohort Data. Int J Obes (2015) 39:1070–8. doi: 10.1038/ijo.2015.55
15. McCarthy HD. Body Fat Measurements in Children as Predictors for the Metabolic Syndrome: Focus on Waist Circumference. Proc Nutr Soc (2006) 65:385–92. doi: 10.1017/s0029665106005143
16. Elizondo-Montemayor L, Serrano-González M, Ugalde-Casas PA, Bustamante-Careaga H, Cuello-García C. Waist-To-Height: Cutoff Matters in Predicting Metabolic Syndrome in Mexican Children. Metab Syndr Relat Disord (2011) 9:183–90. doi: 10.1089/met.2010.0116
17. Peterson CM, Su H, Thomas DM, Heo M, Golnabi AH, Pietrobelli A, et al. Tri-Ponderal Mass Index vs Body Mass Index in Estimating Body Fat During Adolescence. JAMA Pediatr (2017) 171:629–36. doi: 10.1001/jamapediatrics.2017.0460
18. Ashley-Martin J, Ensenauer R, Maguire B, Kuhle S. Predicting Cardiometabolic Markers in Children Using Tri-Ponderal Mass Index: A Cross-Sectional Study. Arch Dis Child (2019) 104:577–82. doi: 10.1136/archdischild-2018-316028
19. Webber LS, Srinivasan SR, Wattigney WA, Berenson GS. Tracking of Serum Lipids and Lipoproteins From Childhood to Adulthood: The Bogalusa Heart Study. Am J Epidemiol (1991) 133:884–99. doi: 10.1093/oxfordjournals.aje.a115968
20. Wang X, Dong B, Ma J, Song Y, Zou Z, Arnold L. Role of Tri-Ponderal Mass Index in Cardio-Metabolic Risk Assessment in Children and Adolescents: Compared With Body Mass Index. Int J Obes (2020) 44:886–94. doi: 10.1038/s41366-019-0416-y
21. Margolis-Gil M, Yackobovitz-Gavan M, Phillip M, Shalitin S. Which Predictors Differentiate Between Obese Children and Adolescents With Cardiometabolic Complications and Those With Metabolically Healthy Obesity? Pediatr Diabetes (2018) 19:1147–55. doi: 10.1111/pedi.12694
22. Ramírez-Vélez R, Correa-Bautista JE, Carrillo HA, González-Jiménez E, Schmidt-Riovalle J, Correa-Rodríguez M, et al. Tri-Ponderal Mass Index vs. Fat Mass/Height 3 as a Screening Tool for Metabolic Syndrome Prediction in Colombian Children and Young People. Nutrients (2018) 10:1–14. doi: 10.3390/nu10040412
23. Chen Y, Ma L, Ma Y, Wang H, Luo J, Zhang X, et al. A National School-Based Health Lifestyles Interventions Among Chinese Children and Adolescents Against Obesity: Rationale, Design and Methodology of a Randomized Controlled Trial in China. BMC Public Health (2015) 15:1–10. doi: 10.1186/s12889-015-1516-9
24. Centers for Disease Control and Prevention. National Health and Nutrition Examination Survey, 1999 - 2016 Survey Content Brochure. Natl Cent Heal Stat (2016) 1–17.
25. Myers GL, Cooper GR, Winn CL, Smith SJ. The Centers for Disease Control-National Heart, Lung and Blood Institute Lipid Standardization Program: An Approach to Accurate and Precise Lipid Measurements. Clin Lab Med (1989) 9:105–36. doi: 10.1016/S0272-2712(18)30645-0
26. Grundy SM, Brewer HB Jr, Cleeman JI, Smith SC Jr, Lenfant C. Definition of Metabolic Syndrome: Report of the National Heart, Lung, and Blood Institute/American Heart Association Conference on Scientific Issues Related to Definition. Circ (2004) 109:433–8. doi: 10.1161/01.CIR.0000111245.75752.C6
27. Ji C-Y, Sung RYT, Ma G-S, Ma J, He Z-H, Chen T-J. Waist Circumference Distribution of Chinese School-Age Children and Adolescents. BioMed Environ Sci (2010) 23:12–20. doi: 10.1016/S0895-3988(10)60026-8
28. Fryar CD, Gu Q, Ogden CL. Anthropometric Reference Data for Children and Adults: United States, 2011-2014. Vital Health Stat (2016) 22.
29. Flynn JT, Kaelber DC, Baker-Smith CM, Blowey D, Carroll AE, Daniels SR, et al. Clinical Practice Guideline for Screening and Management of High Blood Pressure in Children and Adolescents. Pediatr (2017) 140:1–2. doi: 10.1542/peds.2017-1904
30. Cole TJ, Green PJ. Smoothing Reference Centile Curves: The Lms Method and Penalized Likelihood. Stat Med (1992) 11:1305–19. doi: 10.1002/sim.4780111005
31. Ling CX, Zhang H, Huang J, Zhang H. AUC: A Statistically Consistent and More Discriminating Measure Than Accuracy. IJCAI Int Jt Conf Artif Intell (2003) 3:519–24. doi: 10.5555/1630659.1630736
32. Aguilar M, Bhuket T, Torres S, Liu B, Wong RJ. Prevalence of the Metabolic Syndrome in the United States, 2003-2012. Jama (2015) 313:1973–4. doi: 10.1001/jama.2015.4260
33. World Health Organization. Western Pacific Regional Action Plan for Noncommunicable Diseases: a Region Free of Avoidable NCD Deaths and Disability[J]. (2009), 1–56.
34. Weiss R, Bremer AA, Lustig RH. What is Metabolic Syndrome, and Why are Children Getting it? Ann N Y Acad Sci (2013) 1281:123–40. doi: 10.1111/nyas.12030
35. Weisell RC. Body Mass Index as an Indicator of Obesity. Asia Pac J Clin Nutr (2002) 11:S681–4. doi: 10.1046/j.1440-6047.11.s8.5.x
36. Li G, Chen X, Jang Y, Wang J, Xing X, Yang W, et al. Obesity, Coronary Heart Disease Risk Factors and Diabetes in Chinese: An Approach to the Criteria of Obesity in the Chinese Population. Obes Rev (2002) 3:167–72. doi: 10.1046/j.1467-789X.2002.00067.x
37. Low S, Chin MC, Ma S, Heng D, Deurenberg-Yap M. Rationale for Redefining Obesity in Asians. Ann Acad Med (2009) 38:66–74.
38. Gómez-Ambrosi J, Silva C, Galofré JC, Escalada J, Santos S, Millán D, et al. Body Mass Index Classification Misses Subjects With Increased Cardiometabolic Risk Factors Related to Elevated Adiposity. Int J Obes (2012) 36:286–94. doi: 10.1038/ijo.2011.100
39. National Institute for Health and Care Excellence. Identification, Assessment and Management of Overweight and Obesity in Children, Young People and Adults - Partial Update of CG43 Methods, Evidence and Recommendations. (2014).
Keywords: tri-ponderal mass index, metabolic syndrome, child and adolescent health, health screening, cardiovascular risk
Citation: Wang X, Chen Y, Ma J, Dong B, Dong Y, Zou Z, Ma Y, Arnold L and Liang W (2021) Tri-Ponderal Mass Index Reference Values for Screening Metabolic Syndrome in Children and Adolescents: Results From Two National-Representative Cross-Sectional Studies in China and America. Front. Endocrinol. 12:739277. doi: 10.3389/fendo.2021.739277
Received: 10 July 2021; Accepted: 11 October 2021;
Published: 08 November 2021.
Edited by:
Grzegorz Telega, Medical College of Wisconsin, United StatesReviewed by:
Francesca Cinti, Agostino Gemelli University Polyclinic, ItalyCopyright © 2021 Wang, Chen, Ma, Dong, Dong, Zou, Ma, Arnold and Liang. This is an open-access article distributed under the terms of the Creative Commons Attribution License (CC BY). The use, distribution or reproduction in other forums is permitted, provided the original author(s) and the copyright owner(s) are credited and that the original publication in this journal is cited, in accordance with accepted academic practice. No use, distribution or reproduction is permitted which does not comply with these terms.
*Correspondence: Bin Dong, YmluZG9uZ0Biam11LmVkdS5jbg==; Yanhui Dong, ZG9uZ3lhbmh1aUBiam11LmVkdS5jbg==
Disclaimer: All claims expressed in this article are solely those of the authors and do not necessarily represent those of their affiliated organizations, or those of the publisher, the editors and the reviewers. Any product that may be evaluated in this article or claim that may be made by its manufacturer is not guaranteed or endorsed by the publisher.
Research integrity at Frontiers
Learn more about the work of our research integrity team to safeguard the quality of each article we publish.