 Xiaoyan Li
 Jie He
- 1Department of endocrinology, Clinical Medical College and The First Affiliated Hospital of Chengdu Medical College, Chengdu, China
- 2Department of Pulmonary and Critical Care Medicine, Clinical Medical College and The First Affiliated Hospital of Chengdu Medical College, Chengdu, China
Background: Obstructive sleep apnea syndrome (OSAS) is associated with various adipokines. Leptin, a common adipokine, has attracted considerable attention of many researchers in recent years. So far, there has been little agreement on whether blood leptin levels differ in patients with OSAS. Thus, this meta-analysis examined the relationship between serum/plasma leptin levels and the occurrence of OSAS.
Method: WanFang, Embase, CNKI, Medline, SinoMed, Web of Science, and PubMed were searched for articles before March 30, 2021, with no language limitations. STATA version 11.0 and R software version 3.6.1 were used to analyze the obtained data. The weighted mean difference and correlation coefficients were used as the main effect sizes with a random-effects model and a fixed-effects model, respectively. Trial sequential analysis was conducted using dedicated software.
Result: Screening of 34 publications identified 45 studies that met the inclusion criteria of this meta-analysis and meta-regression. Our results suggested that plasma/serum leptin levels were remarkably higher in individuals with OSAS than in healthy individuals. Subgroup analyses were performed based on OSAS severity, ethnicity, age, body mass index, assay type, and sample source. The serum and plasma leptin levels were increased in nearly all OSAS subgroups compared to those in the corresponding control groups. Meta-regression analysis indicated that age, BMI, severity, assay approaches, study design, PSG type and ethnicity did not have independent effect on leptin levels. Furthermore, a positive relationship between the serum/plasma leptin level and apnea-hypopnea index (AHI) was found in the meta-analysis. The results of the trial sequential analysis suggested that the enrolled studies surpassed the required information size, confirming that our study findings were reliable.
Conclusion: Our study results demonstrate that OSAS patients have higher leptin levels in serum/plasma compared to controls, and the serum/plasma leptin level is positively correlated with AHI, especially in adults.
1 Introduction
Obstructive sleep apnea syndrome (OSAS) is a multifactorial disease with complex pathophysiology that manifests as upper airway obstruction, chronic nocturnal intermittent hypoxia, and fragmented sleep (1). Numerous studies have shown that OSAS is a primary independent predictor of cardiovascular disease and is strongly linked to metabolic syndrome, insulin resistance, and obesity (2, 3). The incidence of moderate-to-severe OSAS has been estimated to be up to 23.4% in women and 49.7% in men, with the increasing prevalence over the past two decades (4). In addition, the OSAS prevalence is 12- to 30-fold higher in the obese population than in the non-obese population (5). As much as 60-70% of patients with OSAS have comorbid obesity, particularly visceral obesity (6).
Leptin is a common adipocytokine that is produced and secreted by white adipose tissue (7). Leptin’s primary effect is signaling satiety and decreasing the motivation to consume food. In addition, leptin and the leptin receptor are involved in energy expenditure, balance of blood glucose metabolism, inflammatory processes, and regulation of immune function (8). Levels of circulating leptin are significantly increased in the obese state of the body. Obesity is probably the most critical risk factor for OSAS progression, which is common among adolescents (9). Numerous studies have indicated the development or worsening of OSAS with increasing weight, as opposed to extensive improvement with weight loss (10). Kapusuz et al. (11) showed that patients with OSAS have higher circulating levels of leptin compared to controls. But the association between OSAS and serum/plasma leptin levels is intricate and multidirectional because obesity alone can also affect leptin levels. Sánchez et al. (12) reported that obese individuals without OSAS also display higher circulating levels of leptin, and sleep apnea is not a decisive factor for leptin levels. Similarly, Ursavas et al. (13) observed no differences in serum leptin between OSAS patients and controls. Moreover, some studies that directly examined the relationship between OSAS and leptin serum/plasma levels have been recently published, yet with controversial conclusions (14, 15).
Therefore, it is necessary to conduct a meta-analysis using all available relevant and new studies to quantitatively evaluate the relationship between serum/plasma leptin levels and the occurrence of OSAS. To the best of our knowledge, we enrolled in this study all publications that covered most comprehensive samples. Moreover, this is the first systematic review and meta-analysis to determine the pooled correlation coefficient of OSAS and apnea-hypopnea index (AHI).
2 Materials and Methods
2.1 Identification of Eligible Studies and Data Screening
We conducted a literature search for articles that measured leptin in serum/plasma samples from individuals with OSA and controls. And our meta-analysis was registered in the PROSPERO system (ID: CRD42021245786). The Web of Science, WanFang, Embase, SinoMed, Medline, PubMed, and CNKI databases were screened to identify relevant past studies (up to March 30, 2021). The keywords and subject terms employed in the search included: “leptin” or “LEP” combined with “obstructive sleep apnea” or “OSA” or “OSAS”. All references in these articles were inspected to identify additional articles that were not retrieved by the initial electronic database search. Eligible studies were required to meet the following inclusion criteria: (1) a case-control, cohort, or cross-sectional study; (2) leptin serum/plasma levels measured in individuals with OSAS without restrictions on sex, nationality, age, or ethnicity; and (3) subjects met the OSAS diagnostic criteria based on polysomnography (adults: an AHI of ≥5/h; children: an AHI of >1/h). The exclusion criteria were as follows: (1) commentaries, letters, editorials, other types of literature reviews, or case reports, and (2) adequate information could not be extracted from the original articles, and the study authors could not be contacted to provide more detailed data.
2.2 Study Selection
According to the abovementioned retrieval strategy, two authors searched the above databases independently and read the titles and abstracts of identified articles. We obtained full-text articles of all potentially eligible abstracts. Then, we re-evaluated the prospectively appropriate articles by abstracting and evaluating the full text in detail. If no consensus was reached concerning the inclusion or exclusion of an article, a third experienced reviewer was consulted.
2.3 Data Extraction and Management
We employed a specifically designed table to extract data from each of the enrolled studies as follows: (1) basic data such as first author, publication time; (2) baseline features of the study participants such age, BMI, sample size, ethnicity and sex, serum/plasma leptin levels in patients and controls; (3) disease severity; (4) quality of the literature; and (5) Spearman’s rank correlation coefficient or Pearson product-moment correlation coefficient between AHI and leptin levels.
2.4 Methodological Evaluation of the Study Quality
The quality of the included studies was examined using the Newcastle-Ottawa Scale (NOS), which analyses publications regarding the study population (4 items, full score 4), exposure or outcome (3 items, overall score 3), and comparability (1 item, overall score 2). Total scores of 7-9, 4-6, and 0-3 were considered high-, medium-, and low-quality studies, respectively.
2.5 Trial Sequential Analysis
Trial sequential analysis (TSA) was performed to assess whether quantitative findings were robust and to calculate the required information size (RIS). As cumulative meta-analyses carry the risk of producing random errors due to sparse data and repetitive testing, we added TSA to the statistical methods. When the cumulative Z-curve crossed the monitoring boundary, the result was regarded as convincing. We used a two-sided trial sequential monitoring boundary and calculated the RIS based on α=0.05 and β=0.20. The mean differences and effect sizes were calculated from the included studies. The software TSA version 0.9.5.10 beta was used for this analysis (Copenhagen Trial Unit, Centre for Clinical Intervention Research, www.ctu.dk/tsa).
2.6 Statistical Analyses
In this meta-analysis, we explored the summarized findings of the studies using the R software version 3.6.1 (R Project for Statistical Computing, https://www.r-project.org/) and STATA version 11.0 (Stata Corporation, College Station, TX, USA). Continuous outcomes were harmonized and expressed as weighted mean differences (WMDs) with 95% confidence intervals (95%CIs). Given that the standard error mostly depends on the significance of the rank correlation coefficient, the dependence on the sampling distribution of the Pearson product-moment correlation coefficient is not suggested. We compared each correlation coefficient using the Fisher transformation and then conducted an analysis with the transformed values as the input before their conversion back to correlation coefficients (CORs). Cohen’s criteria were applied to assess the computed effect size (small: ≤0.3, moderate: 0.3-0.5, large: >0.5) (16). Associations between AHI and leptin levels were analyzed using Pearson’s correlation coefficient. Based on the previous description, the reported Spearman’s correlation coefficients in some studies were converted into Pearson’s correlation coefficients (17). Cochran’s Q test with chi-square tests and I2 were employed to check for data heterogeneity, with heterogeneity cutoff points defined as 75% (high), 50% (moderate), and 25% (low). For nonsignificant heterogeneity, defined as P>0.1 and I2<50%, a fixed-effects model was chosen; if P<0.1 along with I2>50% indicated heterogeneity among the data, a random-effects model was employed. Subgroup analysis, descriptive analysis, or meta-regression was often used for heterogeneity analysis. Subgroup analyses were performed for ethnicity, study design, study quality, and type of disease. A sensitivity test was conducted to explore the influence of each study on the pooled WMD by eliminating one study at a time. Moreover, publication bias was examined using Begg’s and Egger’s tests as quantitative methods.
3 Results
3.1 Literature Search and Enrolled Studies
Overall, 687 relevant articles were extracted from the databases. After the screening of titles and abstracts and the omission of duplicates, 627 articles were excluded, and 60 publications were included in the study. We retained 60 articles in which full texts were retrieved from the databases. The full-text articles were reviewed meticulously based on the inclusion and exclusion criteria described in the Methods section. Another 26 articles were excluded for the reasons indicated in Figure 1. We retrieved the full texts of the articles and excluded several full texts for following reasons: five were reviews; two were letter to editor studies; four had no control or control group was selected as AHI>5 events/h in adults and AHI>1 events/h in children; six had no relevant data; four reported polymorphisms of leptin; 2 reported animal experiments;3 reported patients with OSAS. Then another 26 articles were excluded for the different reasons indicated in Figure 1. As shown in Table 1, three were conducted in China (18, 29, 45), five in the USA (14, 34, 42), four in Poland (19, 21, 31), nine in Turkey (11, 13, 20, 32, 35, 38, 44, 46), five in Spain (12, 22, 37), one in Australia (23), three in India (24, 40), three in Greece (26, 30), three in Italy (33, 41), one in Brazil (36), two in Belgium (43), one in Egypt (15). With regard to ethnicity, 33 studies were performed with Caucasians (11–14, 19–23, 26, 30–35, 37, 38, 41–44, 46), 11 with Asians (18–25, 29, 39, 40, 45), and one with Latinos (36) of the 45 studies, 13 reported leptin levels in plasma (12, 14, 19, 22, 30, 33, 42, 46), and 32 (11, 13, 15, 20, 21, 23–29, 31, 32, 34–41, 43–45) reported leptin levels in serum. One is cohort study (24). Thirteen are cross-sectional study (13, 26, 28, 32, 37, 39, 40, 42, 43). Thirty-one are case-control study (11, 12, 14, 15, 18–23, 25, 27, 29–31, 33–36, 38, 41, 44–46). Nine studies included children (14, 29, 34, 42, 43, 45). The data of leptin levels, age, BMI, severity degree and AHI are summarized in Table 2. Eight studies provided Pearson’s or Spearman’s correlation coefficient between leptin and AHI (12, 18, 20, 25, 27, 29, 38, 46) (Table 2). The process of the published literature selection is shown in a PRISMA flow diagram (Figure 1).
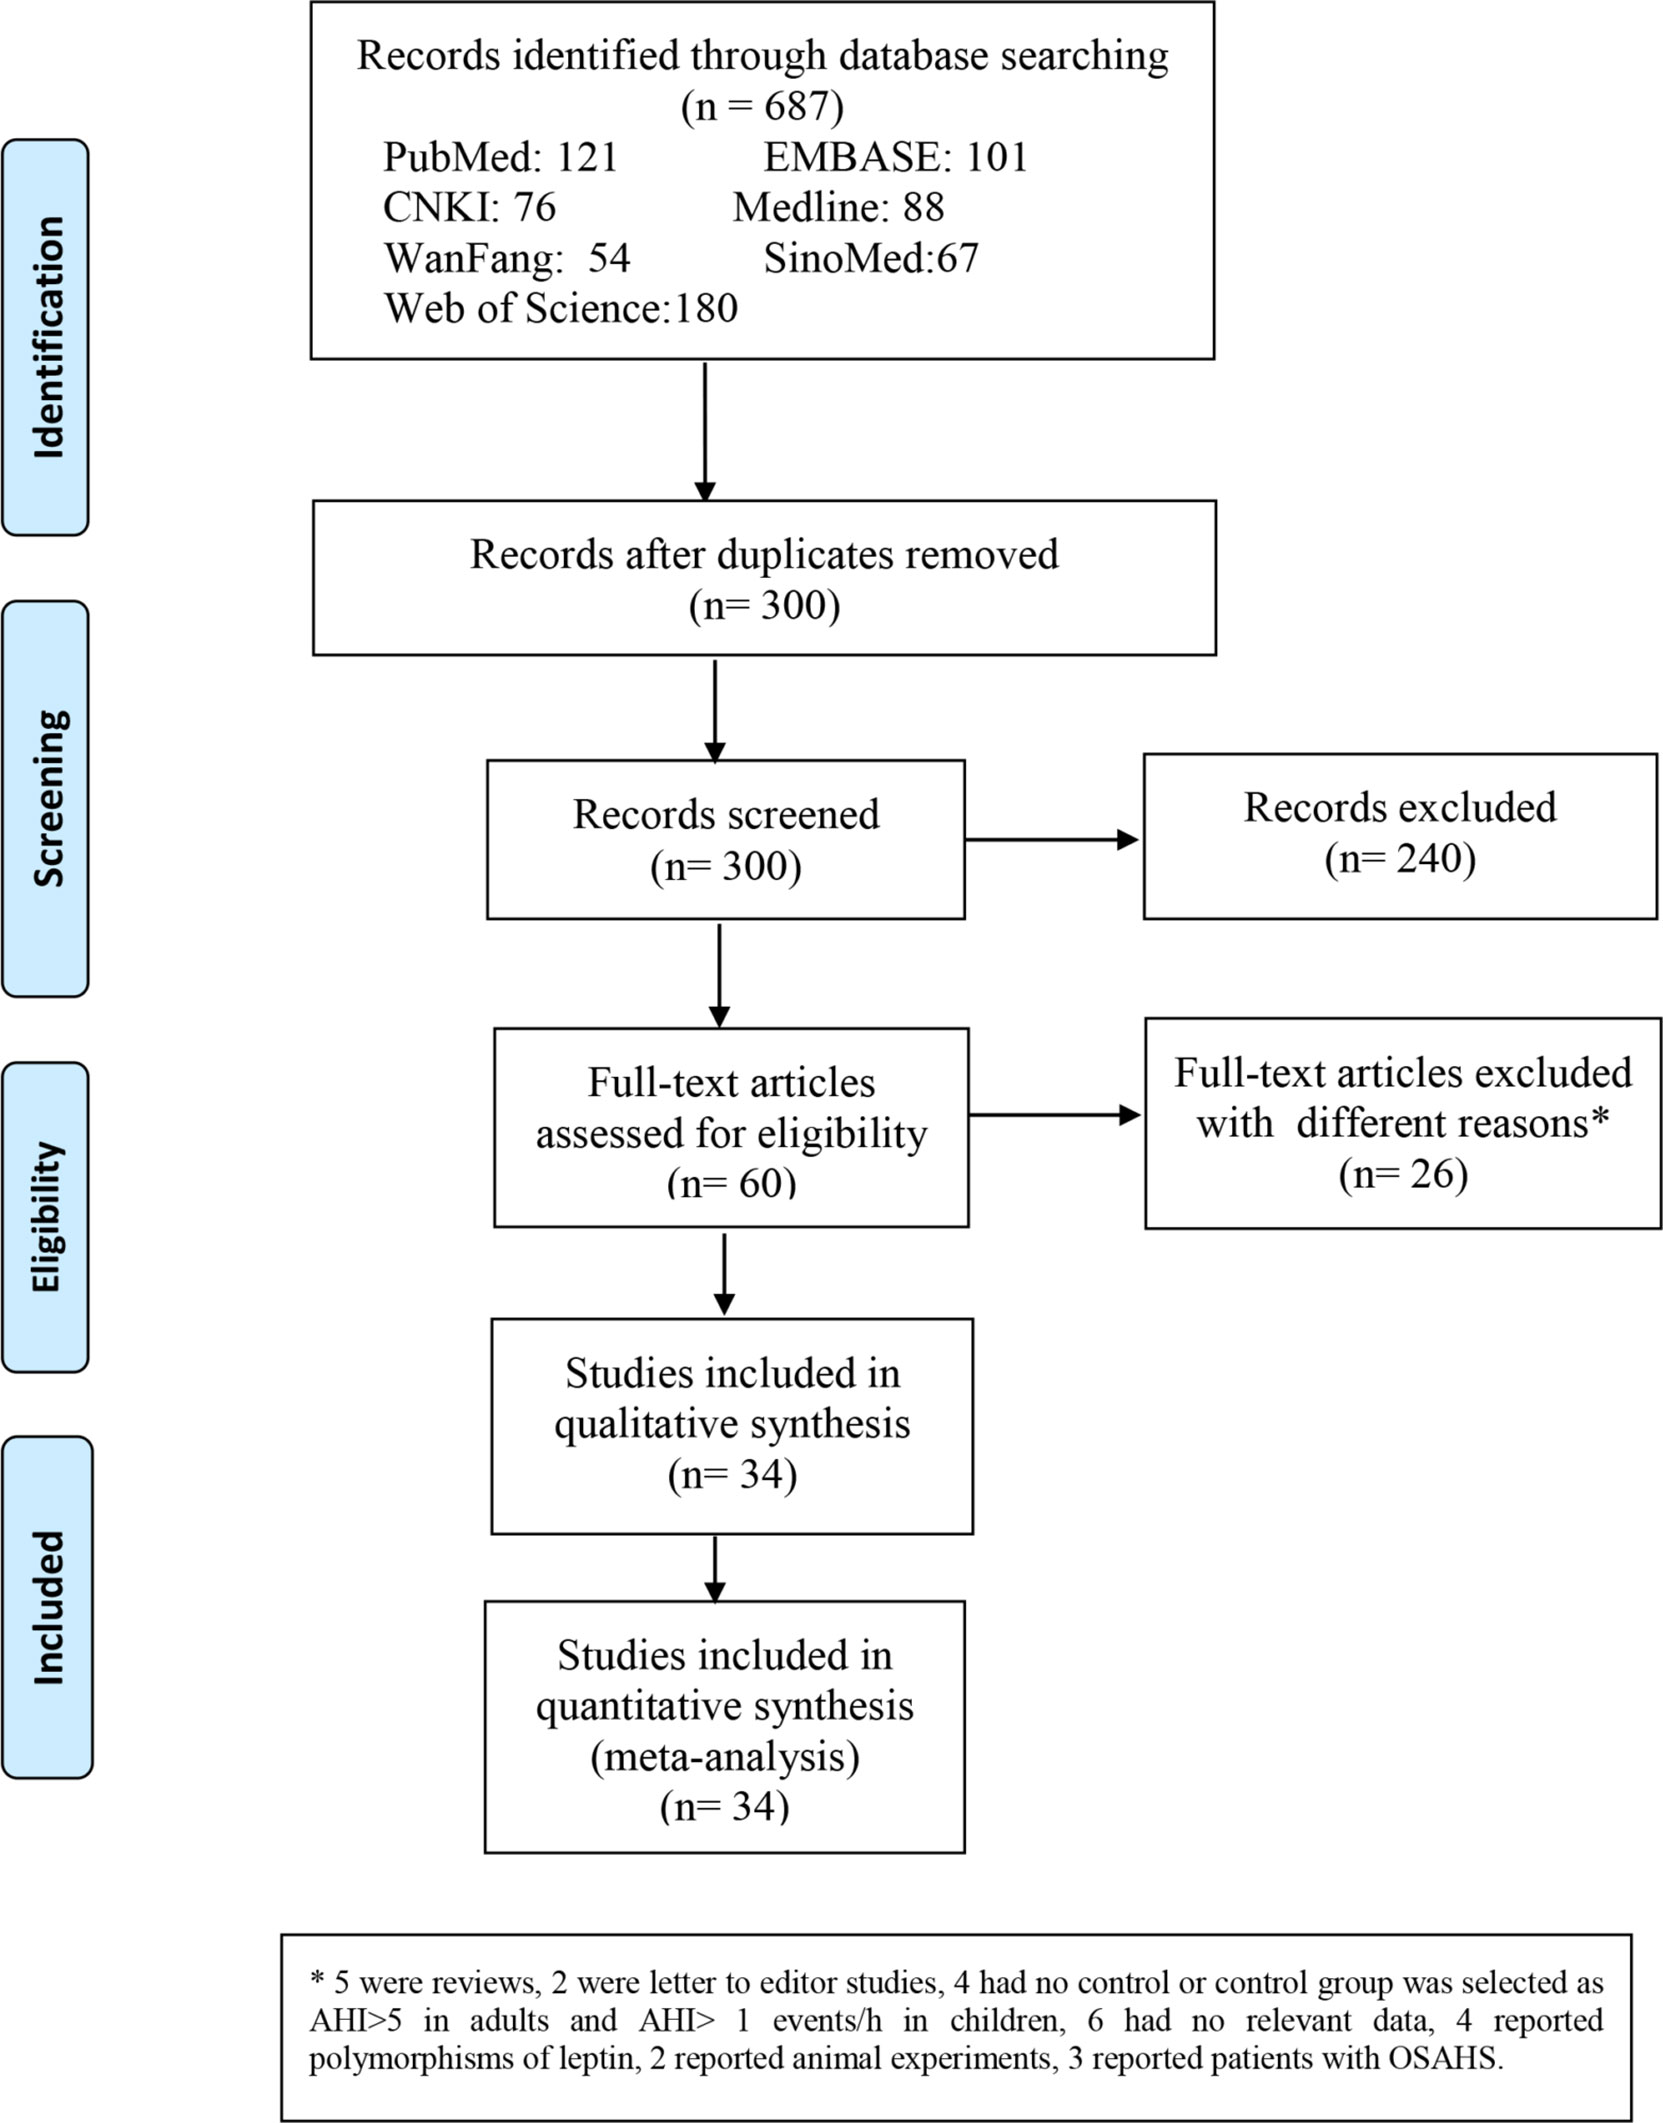
Figure 1 Flow diagram indicating the literature selection process and results based on the preferred reporting items for meta-analyses.
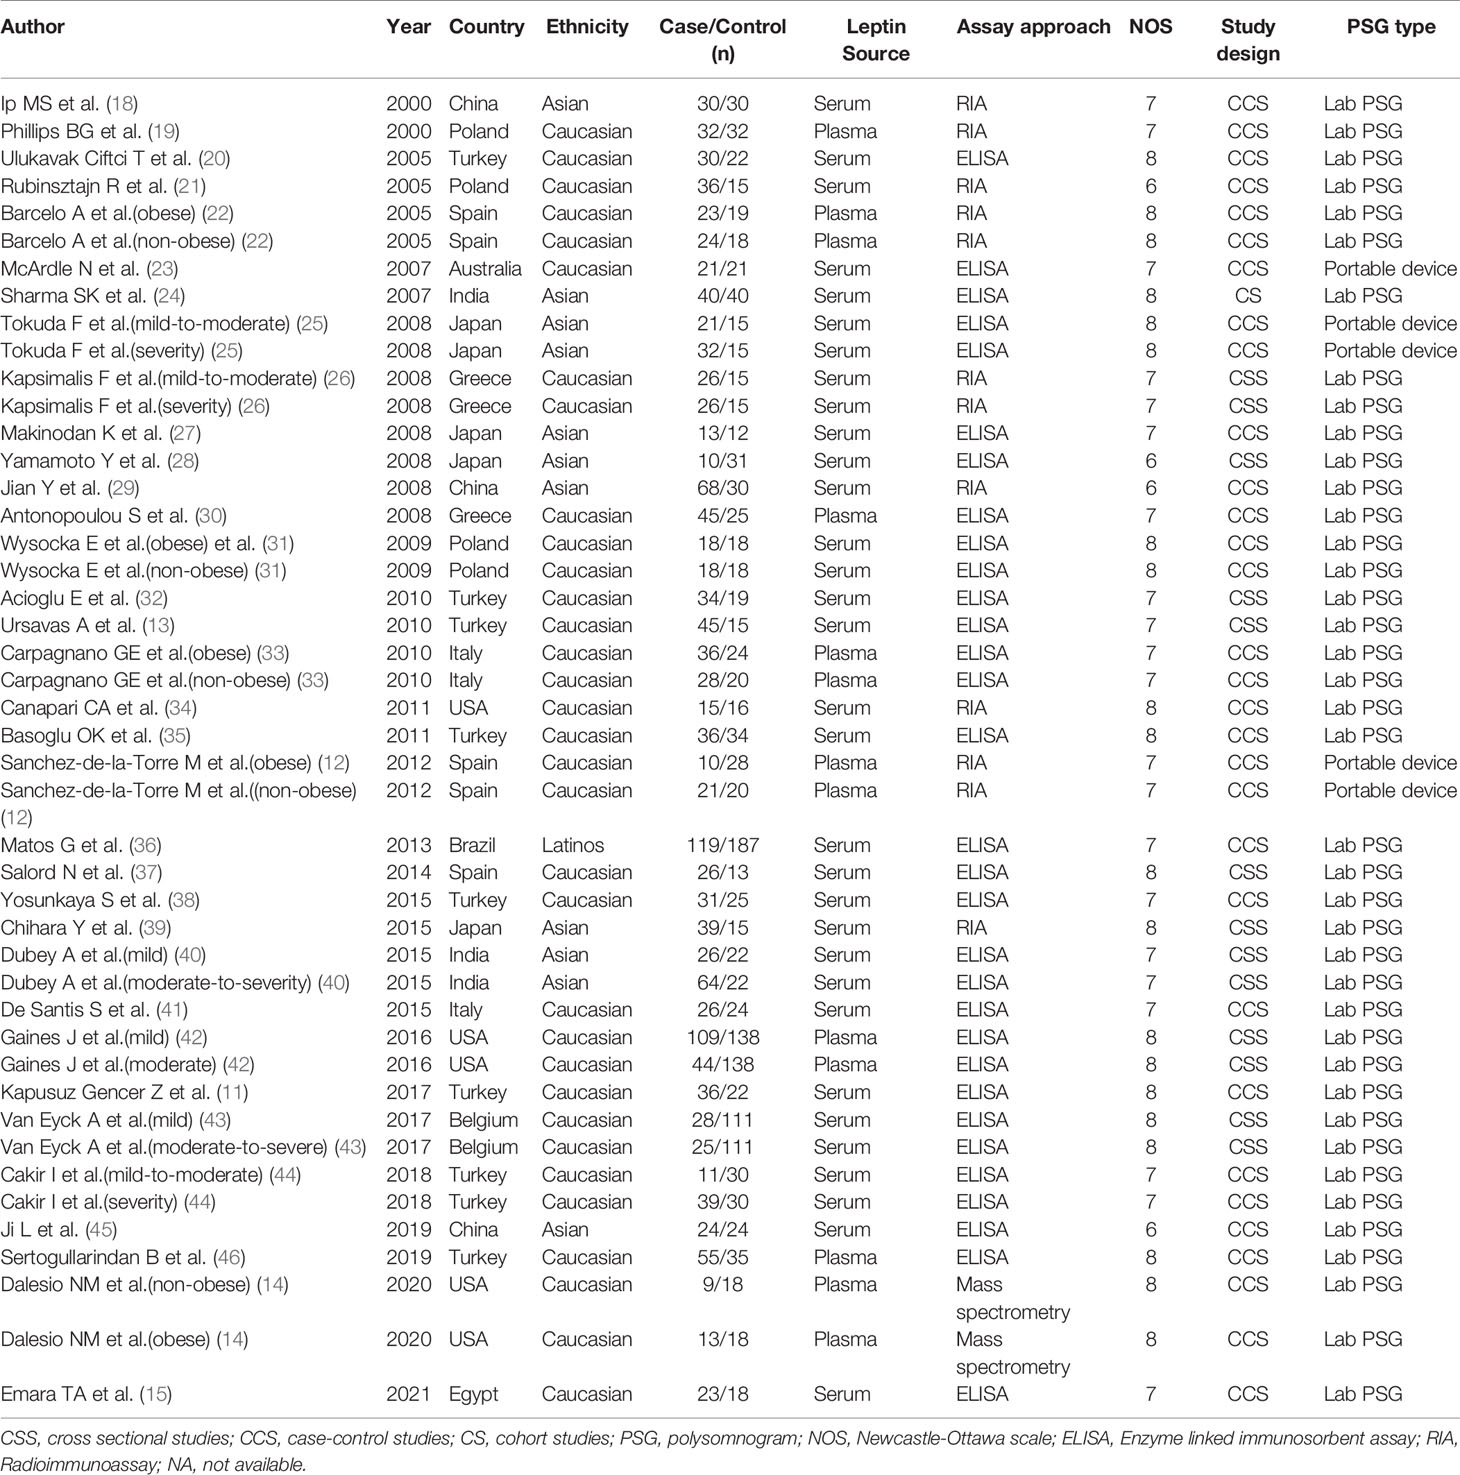
Table 1 Characteristics of included studies.

Table 2 Participants’ characteristics of included studies.
3.2 Quality Assessment
NOS scores were determined to assess the methodological quality of the included studies. According to these scores, the quality of the eligible literature was relatively high; 30 articles were high-quality studies, whereas the remaining 4 studies were of medium quality (Table 1).
3.3 Meta-Analysis
3.3.1 Leptin Levels in All Patients With OSA
All 34 articles reported leptin levels in in 1485 OSA patients and 1201 controls. I2, an index of study heterogeneity, was 97.3%; thus, we selected a random-effects model to synthesize the data. The outcome of the meta-analysis showed that patients with OSA had significantly higher leptin levels compared to controls (WMD=3.80 ng/ml, 95%CI=3.09-4.50, P<0.00001; Figure 2). Furthermore, we conducted a series of sensitivity analyses to explore the stability of the pooled data. No significant differences were found after sequentially omitting studies, suggesting the reliability of this meta-analysis result (Figure 3). Different sample types may lead to increased heterogeneity; therefore, we analyzed serum leptin and plasma leptin levels separately (Table 3).
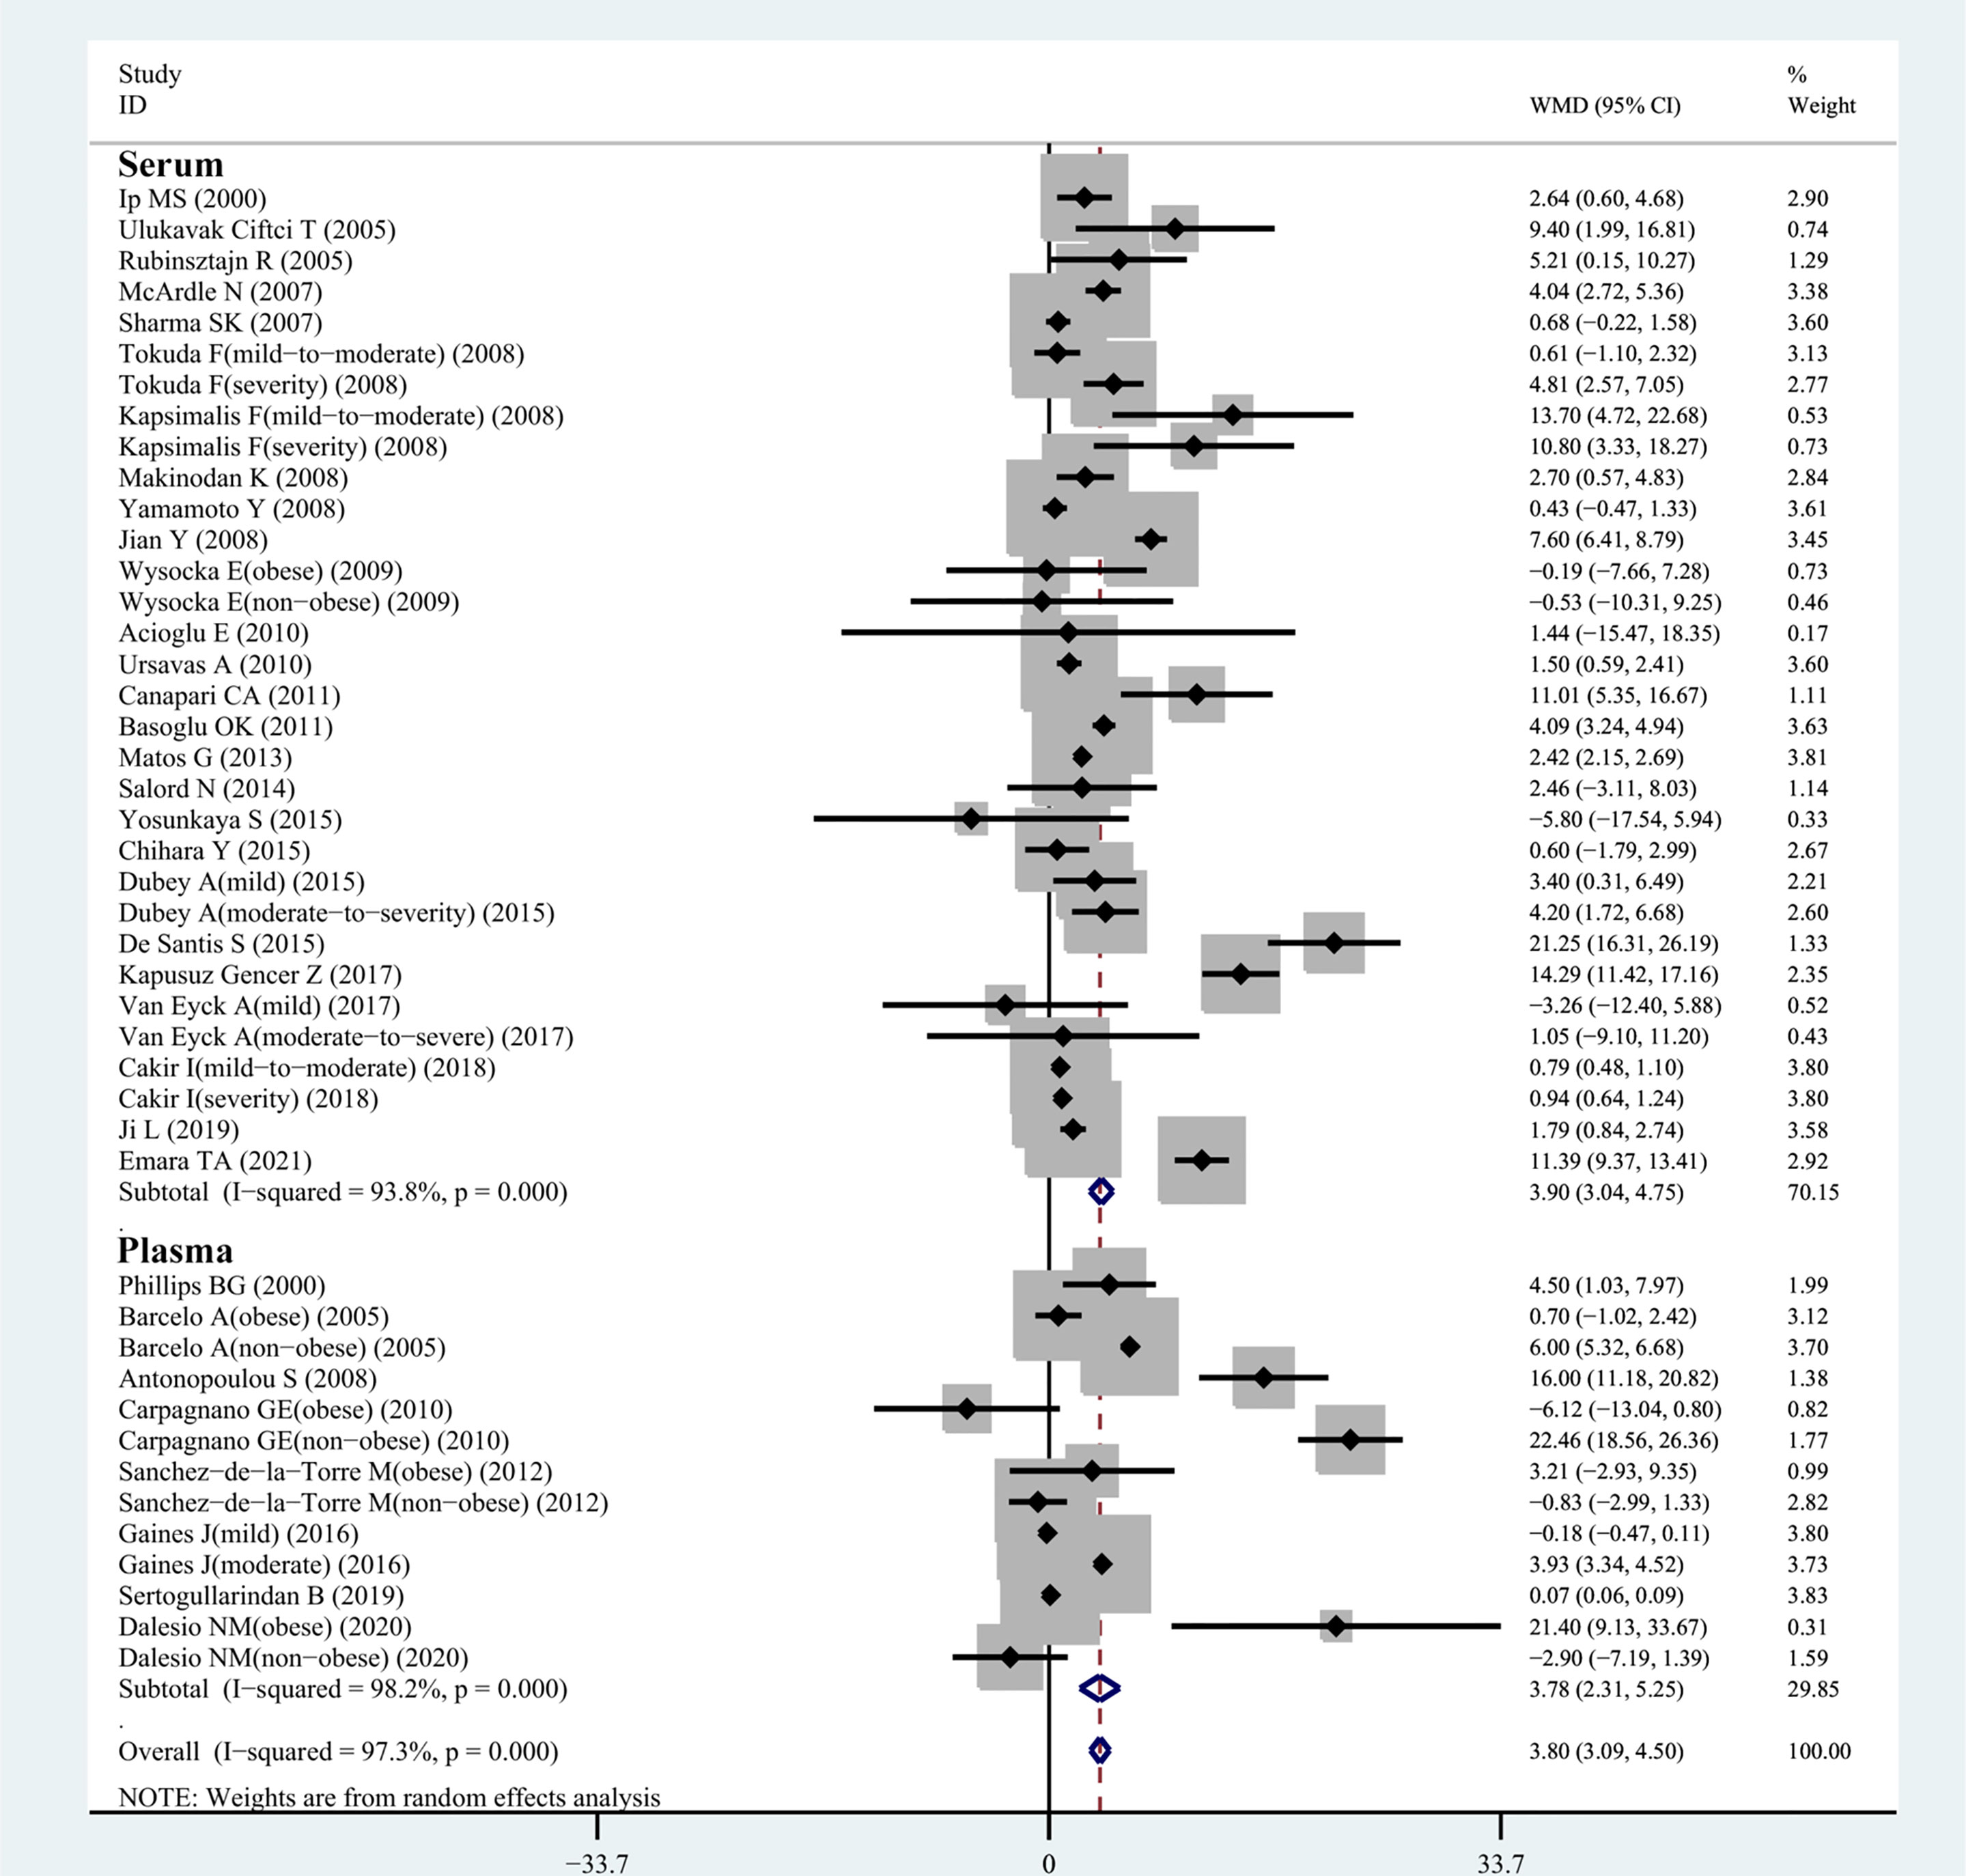
Figure 2 WMD forest plot and 95%CIs for serum leptin levels in the OSAS group in control with the control group in the meta-analysis. 95%CI, 95% confidence interval; OSAS, obstructive sleep apnea syndrome; WMD, weighted mean difference.
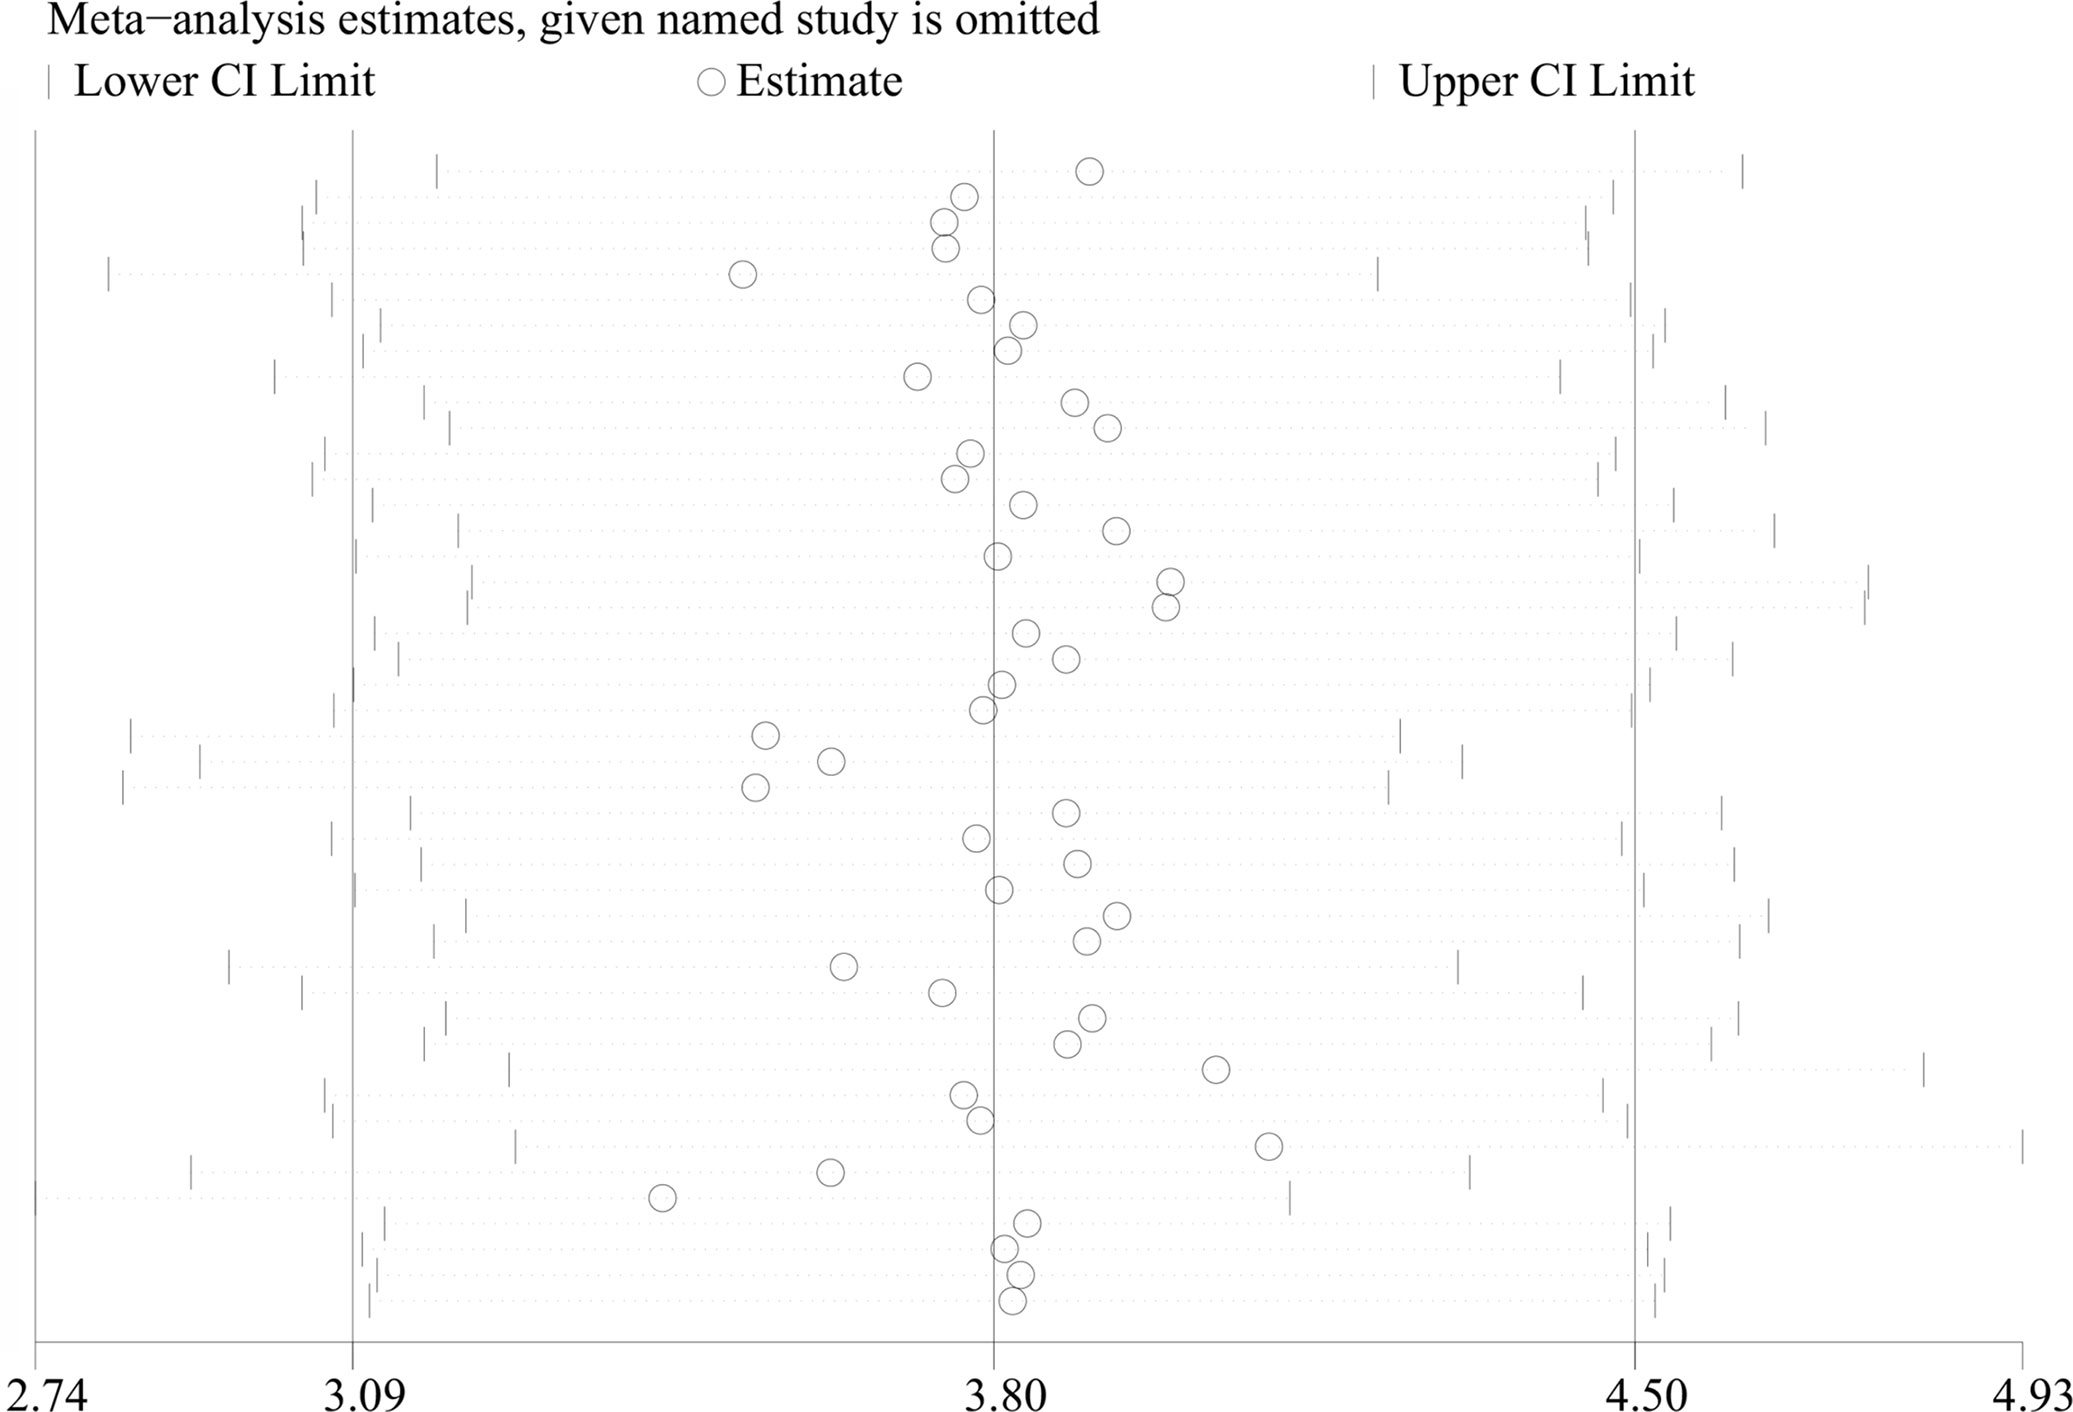
Figure 3 Sensitivity analysis of studies on leptin levels in patients with OSAS versus controls. OSAS, obstructive sleep apnea syndrome.
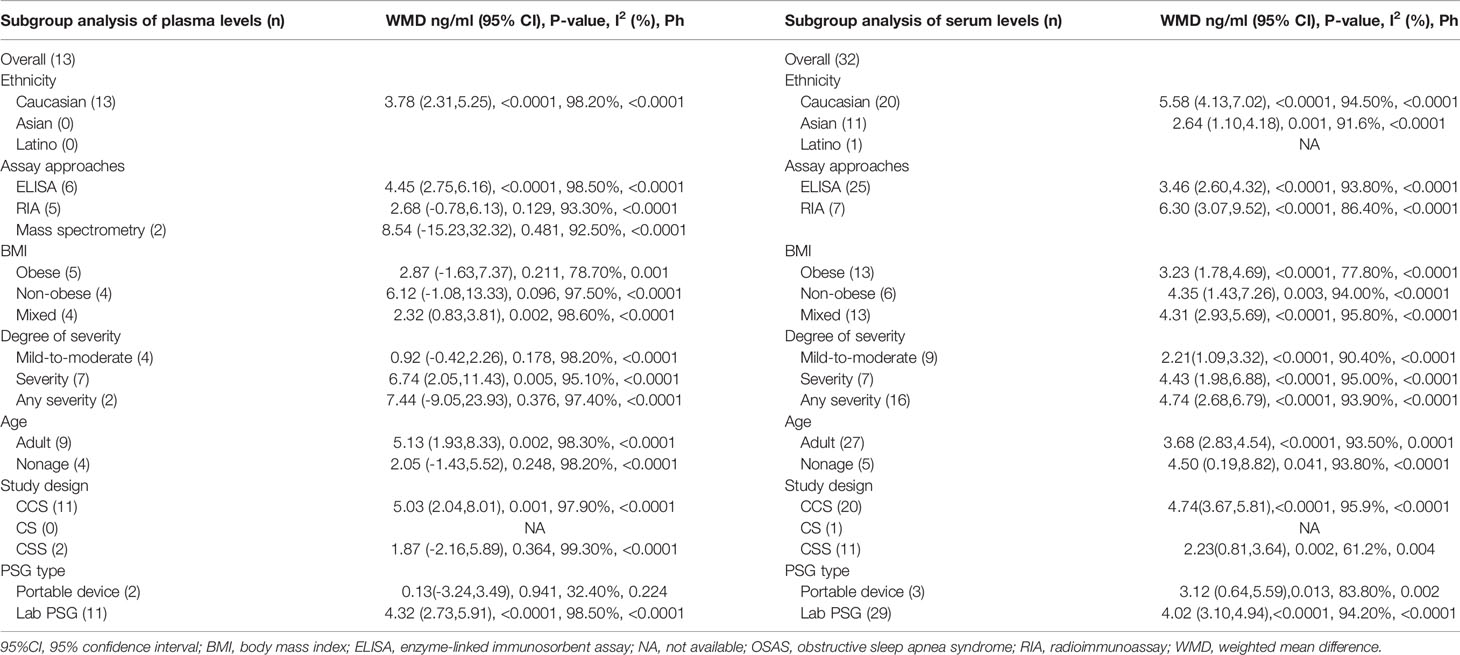
Table 3 Subgroup analyses of leptin levels in OSAS and controls.
3.3.2 Serum Leptin Levels in OSA Patients and Controls
In our meta-analysis, 32 eligible observational studies investigated the relationship between serum leptin concentration in patients with OSA and those without. A relationship between the serum leptin level and the presence of OSA was confirmed (WMD=3.90 ng/ml, 95%CI=3.04-4.75, P<0.0001; Figure 2), and we chose the random-effects model owing to the high level of heterogeneity (I2 = 93.8%; Table 3).
3.3.3 Plasma Leptin Levels in OSA Patients and Controls
Figure 2 shows the results of 13 observational studies describing plasma leptin levels. The pooled analysis comparing cases and controls illustrated that plasma leptin levels in individuals with OSA were remarkably higher than those in controls (WMD=3.78 ng/ml, 95%CI=2.31-5.25, P<0.0001; Figure 2).
3.4 Subgroup Analyses of Plasma Leptin Levels
3.4.1 Age
Four studies analyzed plasma leptin concentrations in children and adolescents with and without OSAS. No significant difference was found in young patients with OSAS (WMD=2.05 ng/ml, 95%CI=−1.42-5.52, P=0.248) compared to controls. Nine studies compared plasma leptin concentrations between adults with and without OSAS and identified substantially higher leptin levels in adults with OSAS (WMD=5.13 ng/ml, 95%CI=1.93-8.33, P=0.002; Table 3).
3.4.2 Body Mass Index
All included studies reported the BMI values for each patient. Therefore, we performed a meta-analysis of the articles according to obese, non-obese, and mixed groups. Some studies did not strictly distinguish between obese and non-obese populations, so we classified these studies as mixed groups. Four studies reported the plasma leptin levels in non-obese patients with OSA, and the plasma leptin concentrations did not differ between case and healthy control groups (WMD=6.12 ng/ml, 95%CI=−1.08-13.33, P=0.096; Table 3). Similar results were obtained in five studies providing the plasma leptin levels in obese individuals with OSA (WMD=2.87 ng/ml, 95%CI=−1.63-7.37, P=0.211). However, the remaining four studies with mixed groups showed remarkable differences between patients with OSA and healthy controls (WMD=2.32 ng/ml, 95%CI=0.83-3.81, P=0.002; Table 3).
3.4.3 OSA Severity
A subgroup meta-analysis based on OSA severity was also performed. Four studies examined the association between plasma leptin levels and mild-to-moderate OSA, and seven studies included patients with severe OSA. Two studies provided data which cannot be classified according to degrees of severity. We defined the last two studies as any severity group. The results of our analysis revealed that the plasma leptin levels in patients with severe OSA were remarkably higher than those in controls (WMD=6.74 ng/ml, 95%CI=2.05-11.43, P=0.005). The results of the other subgroup analyses are presented in Table 3.
3.4.4 Assay Approach
Considering the different assay techniques to determine leptin concentrations, subgroup analyses were carried out according to the assay type. Six studies assessed plasma leptin levels using enzyme-linked immunosorbent assays (ELISAs), and their results suggested that the plasma leptin concentration was higher in individuals with OSA compared to those in controls (WMD=4.45 ng/ml, 95%CI=2.75-6.16, P<0.0001; Table 2). Five studies determined the plasma leptin using radioimmunoassays (RIAs), and their results indicated that plasma leptin levels did not differ between individuals with OSA and controls (WMD=2.68 ng/ml, 95%CI=−0.78-6.13, P=0.129; Table 3). Two studies used high-performance liquid chromatography-tandem mass spectroscopy to detect leptin, and the leptin levels were only significantly different in obese patients with OSA (14) (Table 3).
3.4.5 Ethnicity
The subgroup analysis of plasma leptin levels in patients with OSAS is summarized in Table 2. The main subgroup population comprised Caucasians. The pooled analysis demonstrated that higher plasma leptin concentrations were observed in Caucasian patients with OSA than in corresponding controls (WMD=3.78 ng/ml, 95%CI=2.31-5.25, P<0.0001). Only serum leptin levels were determined in other ethnicities; thus, no comparative data exist for plasma leptin levels in other ethnicities (Table 3).
3.4.6 Study Design
Considering that variations in the design of included studies would affect the heterogeneity of the effect, we carried out a corresponding subgroup analysis. Compared to controls, for participant with OSA, the plasma leptin levels were significantly higher in case-control studies (WMD=5.03 ng/ml, 95%CI=2.04-8.01, P<0.0001). However, no difference was documented between OSA patients and controls in cross-sectional studies (WMD=1.87 ng/ml, 95%CI=-2.16-5.89, P=0.364) (Table 3).
3.4.7 PSG Type
We conducted a subgroup analysis based on difficult PSG types used for diagnosing OSA. Eleven studies provided data on the plasma leptin levels in OSA patients diagnosed by lab PSG, and the results reveal that the plasma leptin levels were higher in these OSA patients than in the controls (WMD=4.32 ng/ml, 95%CI=2.73,5.91, P<0.0001). Two studies provided data on the plasma leptin levels in OSA patients diagnosed by portable device, and the results reveal that there was no difference in levels of leptin between OSA patients and controls (WMD=0.13 ng/ml, 95%CI=-3.24-3.49, P=0.941) (Table 3).
3.5 Subgroup Analysis of Serum Leptin Levels
3.5.1 Age
Five studies compared serum leptin concentrations between children and adolescents with and without OSAS and found significantly higher leptin levels in those with OSAS (WMD=4.50 ng/ml, 95%CI=0.19-8.82, P=0.041). A total of 27 studies compared serum leptin concentrations between adults with and without OSAS and found significantly higher leptin levels in those with OSAS (WMD=3.68 ng/ml, 95%CI=2.83-4.54, P<0.0001; Table 3).
3.5.2 Body Mass Index
We performed a meta-analysis of 32 studies according to the BMI. Six articles provided data on serum leptin levels in non-obese individuals with OSA, and the results of our analysis showed that the serum leptin concentration was significantly higher in non-obese individuals with OSA than in controls (WMD=4.35 ng/ml, 95%CI=1.43-7.26, P=0.003). Data on serum leptin levels in obese patients with OSA were available in 13 studies, and there were remarkable differences between obese individuals with OSA and controls. Another 13 studies did not strictly distinguish between obese and non-obese populations, so we classified these studies as mixed groups. The results demonstrated that the serum leptin level was remarkably higher in the mixed group than in the control group (Table 3).
3.5.3 OSA Severity
Numerous studies have reported that serum leptin levels strongly correlate with OSA severity. In this meta-analysis, nine and seven articles reported serum leptin concentrations in patients with mild-to-moderate and severe OSA, respectively. However, there were 16 studies providing data which cannot be classified according to degrees of severity. We defined these studies as any severity group. The results of our analysis showed that the serum leptin concentrations in patients with mild-to-moderate OSA were remarkably higher than those in controls (WMD=2.21 ng/ml, 95%CI=1.09-3.32, P<0.0001). Eight studies supplied data on serum leptin levels according to OSA severity, showing that the serum leptin concentrations in patients with OSA were substantially higher than those in controls (WMD=4.43 ng/ml, 95%CI=1.98-6.88, P<0.0001). We also found that the serum leptin level in any severity group was remarkably higher than that in the control group (Table 3).
3.5.4 Assay Approach
In 25 articles, the serum leptin levels were measured using ELISAs, and the results of our analysis suggested that in these studies, the serum leptin levels were higher in individuals with OSA than in controls (Table 3). Seven studies reported that serum leptin levels were assessed using RIAs. In these studies, serum leptin levels were higher in individuals with OSA than in controls (WMD=6.30 ng/ml, 95%CI=3.07-9.52, P<0.0001; Table 3).
3.5.5 Ethnicity
The subgroup analysis of the pooled WMD for serum leptin levels in Caucasian, Asian, and Latino participants with OSAS indicated significant differences compared to the respective controls. Serum leptin levels in OSAS patients of these three ethnicities were higher than those in the respective control groups (Table 3).
3.5.6 Study Design
Compared to controls, for participant with OSA, the serum leptin levels were significantly higher in case-control studies (WMD=4.74 ng/ml, 95%CI=3.67-5.81, P<0.0001). Similarly, levels of leptin in the OSA group were higher compared to those of the control group in cross-sectional studies (WMD=2.23 ng/ml, 95%CI=0.81-3.64, P=0.002) (Table 3).
3.5.7 PSG Type
Twenty-nine studies provided data on the serum leptin levels in OSA patients diagnosed by lab PSG, and the results reveal that the serum leptin levels were higher in these OSA patients than in the controls (WMD=4.02 ng/ml, 95%CI=3.10-4.94, P<0.0001). Three studies provided data on the serum leptin levels in OSA patients diagnosed by portable device, and the results reveal that that the serum leptin levels were higher in these OSA patients than in the controls (WMD=3.12 ng/ml, 95%CI=0.64-5.59, P=0.013) (Table 3).
3.6 Meta-Analysis of the Relationship of Plasma/Serum Leptin Concentration With the AHI
Among the included publications, eight studies examined the relationship between AHI and serum leptin in patients with OSA and reported the Pearson’s or Spearman’s correlation coefficients. The AHI was often chosen as the measure to evaluate OSAS, as this parameter captures the OSAS severity. We performed a pooled analysis of the relationship between leptin levels and AHI among individuals with OSA using the R package meta. The effect size was 0.32 (95%CI=0.22-0.42, P<0.001), and heterogeneity was not significant (I2 = 45%, P=0.08; Figure 4). The meta-analysis of the correlation coefficients revealed a positive association between plasma/serum leptin levels and AHI.
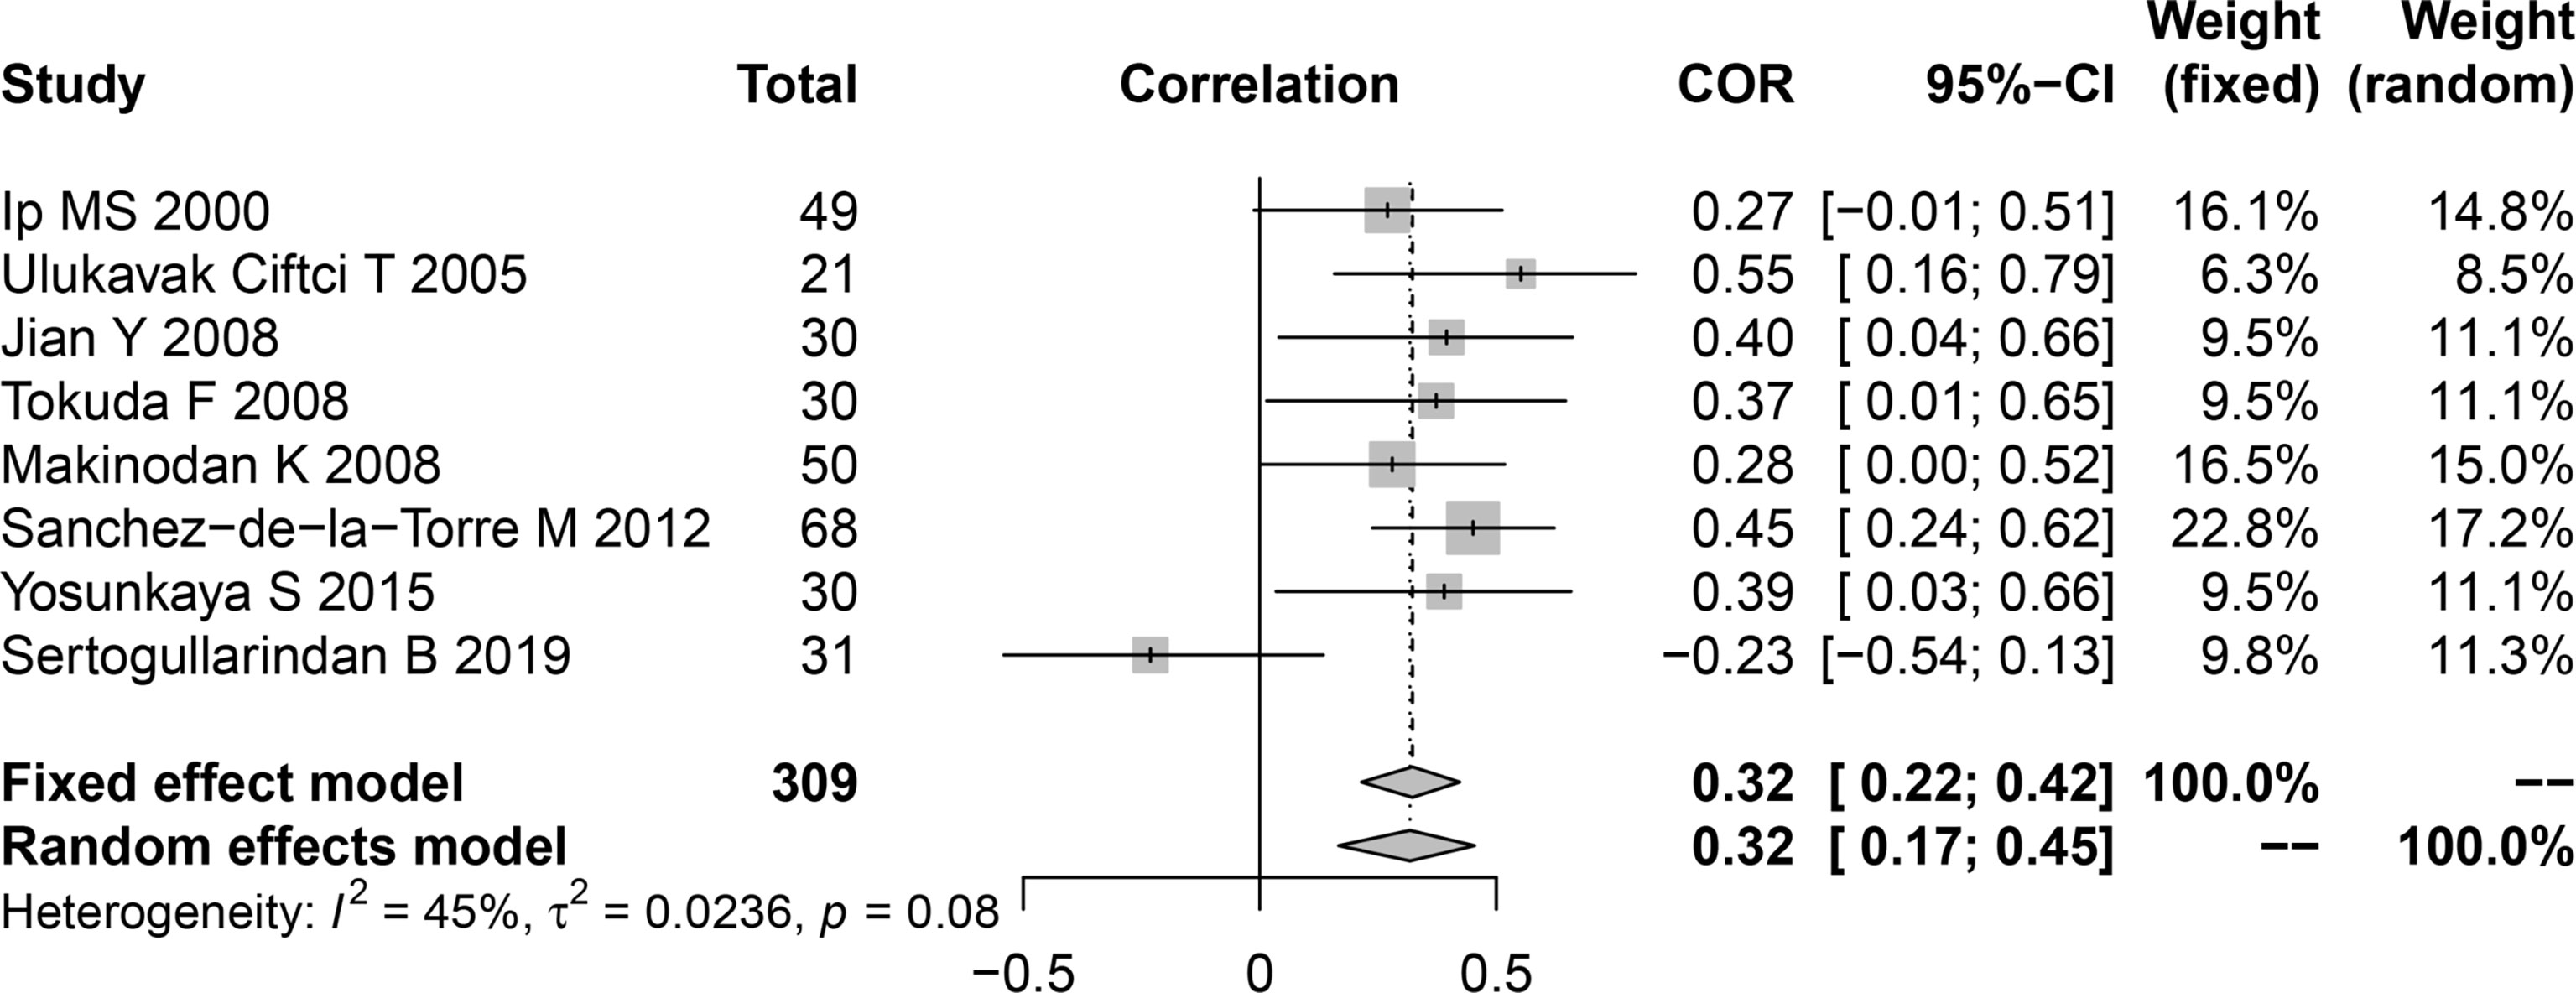
Figure 4 Funnel plot of effect sizes measured as correlations between serum/plasma leptin levels and AHI. AHI, apnea-hypopnea index.
3.7 Meta-Regression
The I2 value of all included studies was 97.3%, suggesting high study heterogeneity. Thus, we applied meta-regression analyses to identify potential sources of this heterogeneity.
The meta-regression data of serum leptin concentrations are presented in Table 4. Age, BMI, disease severity, assay approach, study design, PSG type, and ethnicity had no remarkable independent impact on serum/plasma leptin levels, as shown in Table 4. Other unknown factors influencing heterogeneity may have led to differences in the relationship between serum leptin concentration and OSA.
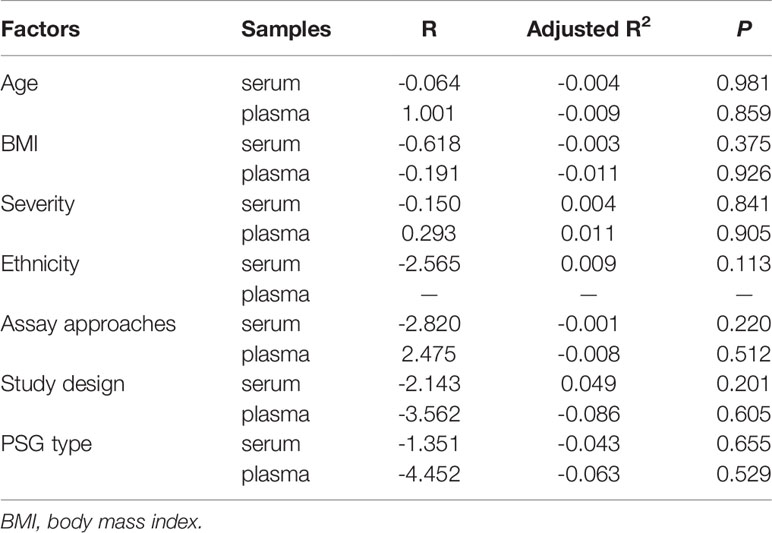
Table 4 Meta-regression analysis of variables predicting serum and plasma levels of leptin.
3.8 Trial Sequential Analysis
The TSA showed that the cumulative Z curves crossed both the conventional boundary and the trial sequential monitoring boundary, and they surpassed the RIS as well (Figure 5). Therefore, the results are reliable, and further trials are not required.
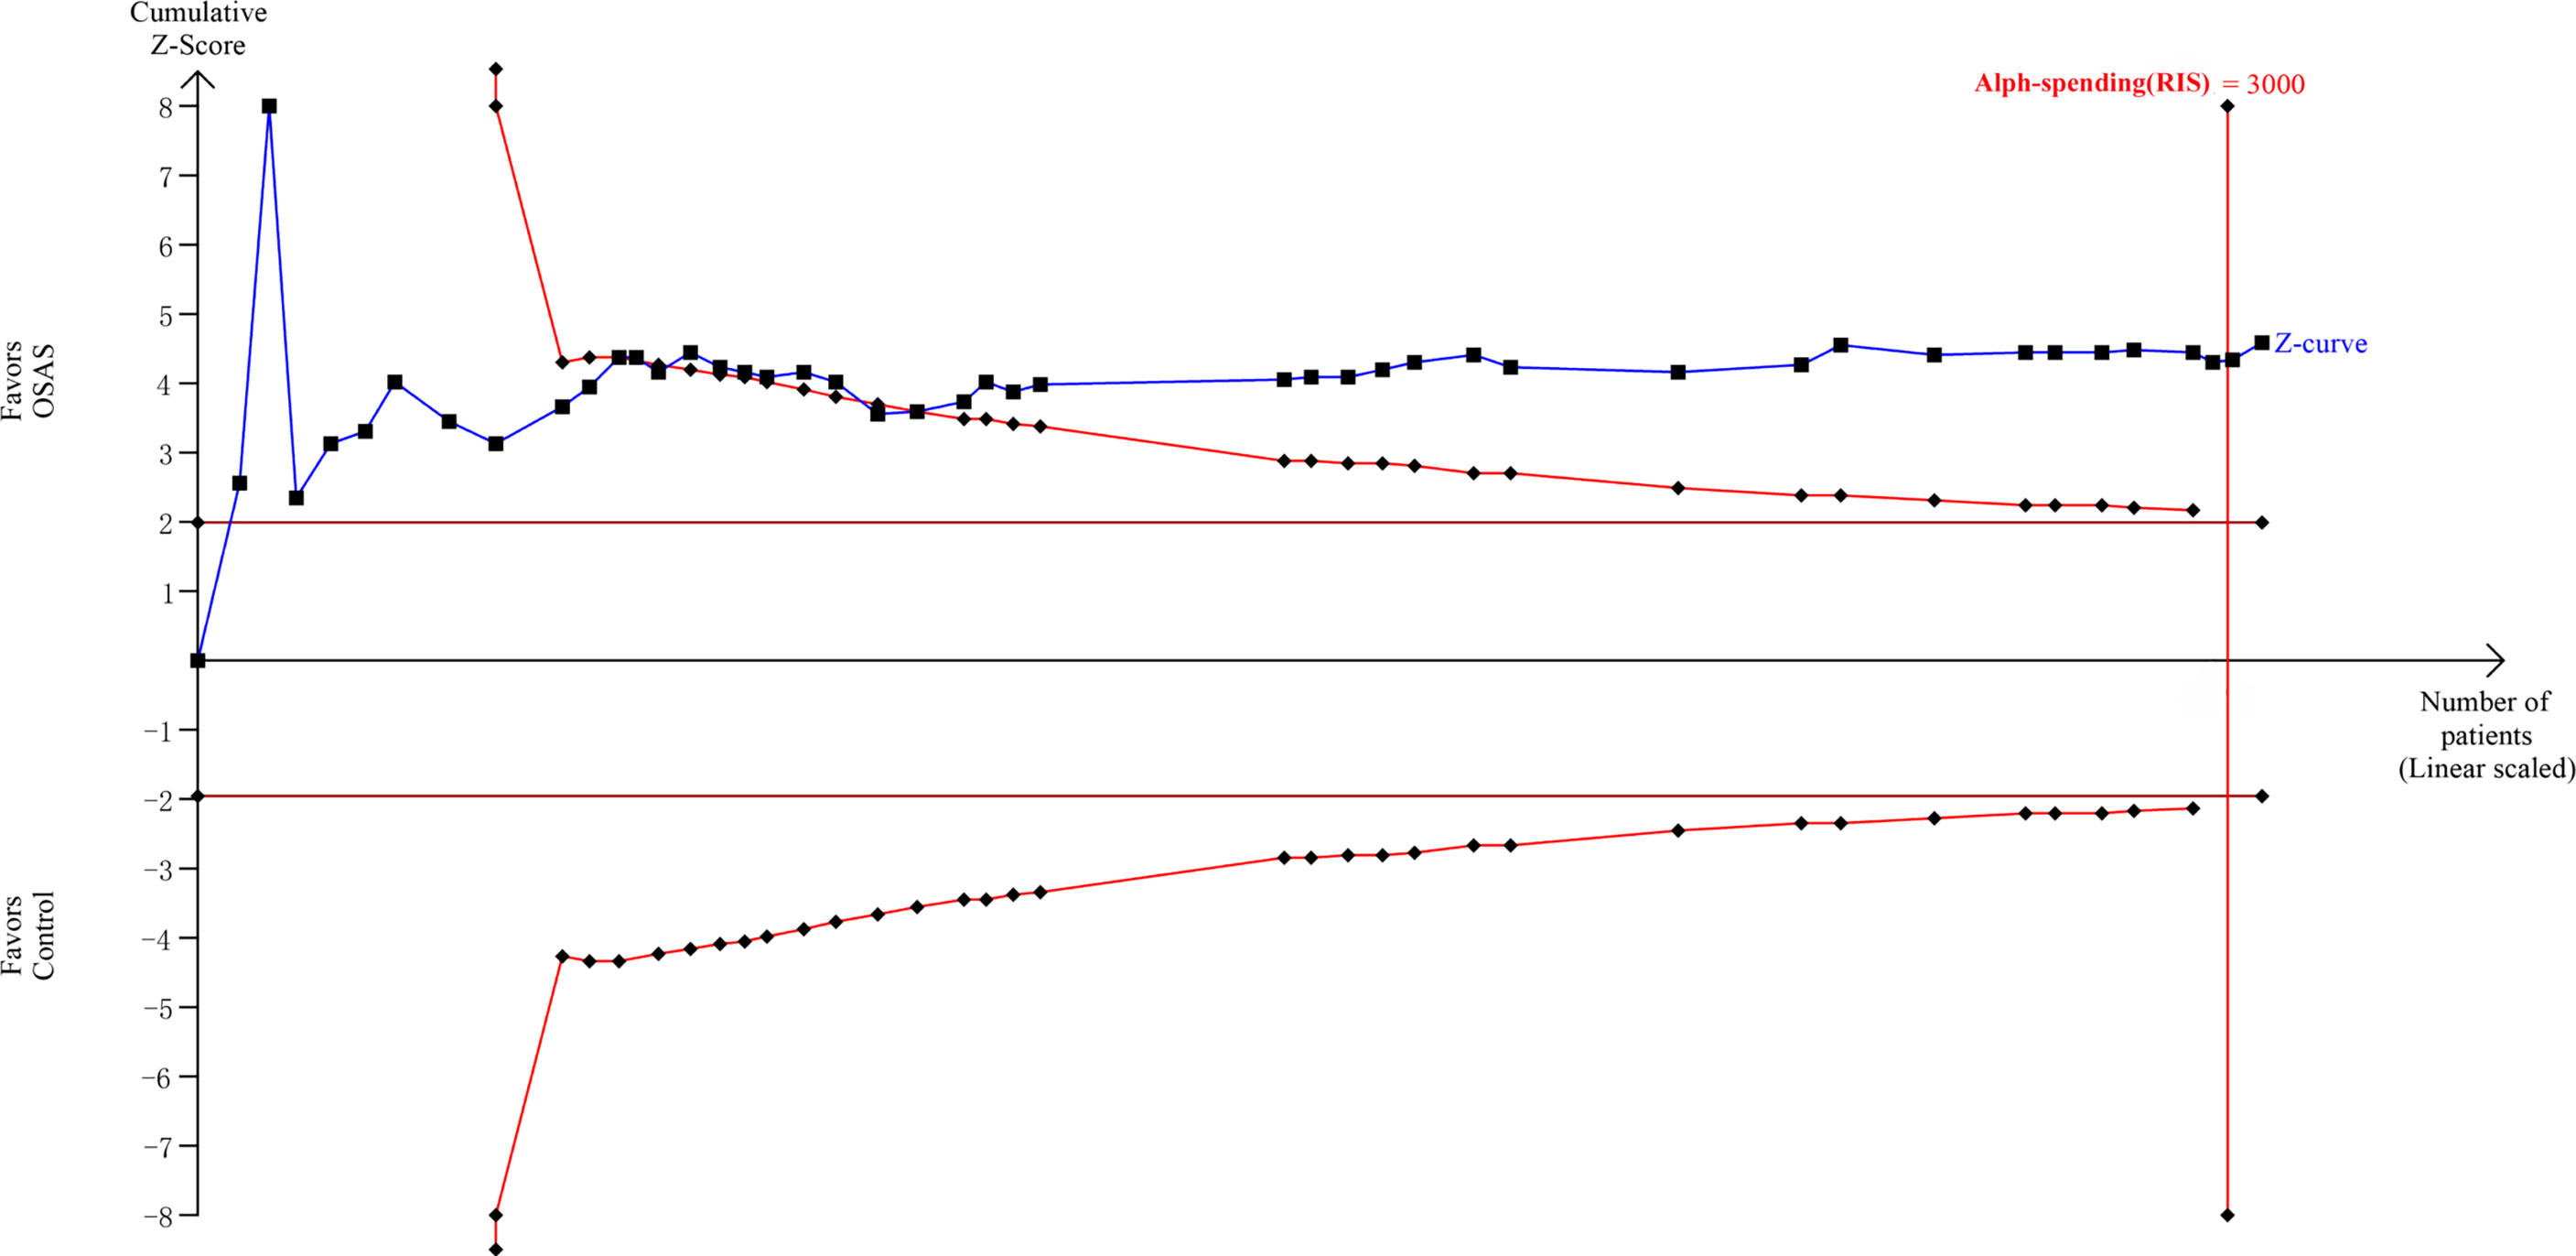
Figure 5 Trial sequential analysis.
3.9 Publication Bias
A funnel plot was generated to assess the possibility of publication bias among the enrolled studies involving the relationship between leptin concentration and OSA. The Begg’s and Egger’s tests did not identify any publication bias across the studies of patients with OSA (plasma levels: Egger’s test [P=0.577] and Begg’s test [P=0.502], Figure 6A; serum levels: Egger’s test [P=0.654] and Begg’s test [P=0.224], Figure 6B). The Egger’s test of the funnel plot evaluating the association between the correlation coefficient and AHI also detected no evidence of publication bias (P=0.078; Figure 6C).
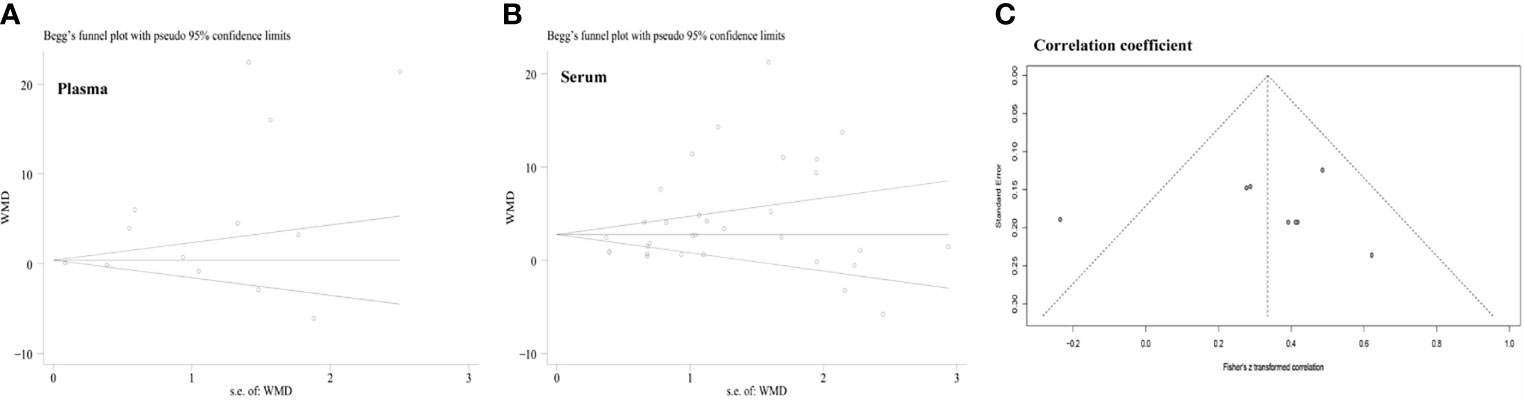
Figure 6 Funnel plots were employed to assess the publication bias among the included studies examining the relationship of leptin levels with OSAS. (A) Funnel plot of the plasma leptin levels in patients with OSAS versus the control group. (B) Funnel plot of the serum leptin levels in patients with OSAS versus the control group. (C) Funnel plot of the association between the correlation coefficient and AHI. AHI, apnea-hypopnea index; OSAS, obstructive sleep apnea syndrome.
4 Discussion
The present meta-analysis of 45 studies evaluated the serum (27 studies of adults and 5 of children) and plasma (9 studies of adults and 4 of children and adolescents) leptin levels and compared these values between individuals with OSAS and controls. The analysis showed that both plasma and serum leptin levels in adults with OSAS were significantly higher than the corresponding levels in the control group. Similarly, serum leptin levels were significantly higher in children with OSAS than in controls. However, there was no significant difference in plasma leptin levels between children and adolescents with and without OSA. This may be related to the different samples included in the meta-analysis of plasma leptin concentrations, which included samples of adolescents leading to different meta-analysis results for serum and plasma leptin levels. Furthermore, subgroup analyses were conducted according to the study design and PSG type, and the serum leptin levels were higher in the OSA patients. Moreover, the meta-analysis of the correlation coefficients revealed a pattern of positive associations between plasma/serum leptin levels and AHI. These results were further supported by TSA, demonstrating that the current sample size was adequate. However, further well-designed large-scale studies involving various ethnicities and geographical contexts are encouraged. The present conclusions have clinical importance because an elevated leptin level could be a risk factor for the development of cardiovascular disease in adults with OSAS (47). It is crucial to understand the mechanism which drive these changes in leptin levels because leptin has been reported to be related with an increased risk of myocardial infarction, hemorrhagic stroke, abnormal fibrinolysis in men and postmenopausal women (48–50) . These disorders are also typical complications among OSA patients. In addition, these results have practical importance because, in addition to routine checks on sleep and sleep-disordered breathing, both children and adults with OSAS need a thorough monitoring of metabolic level. Such detailed analyses could enable better understanding of leptin changes in OSA patients, building confidence in OSA risk-assessment.
Previously it was shown that OSAS can alter the levels of several hormones (12). Obesity and OSAS can lead to elevated levels of the adipose-derived hormone leptin, which increases metabolism (40). Leptin resistance is a major pathophysiological factor of obesity (51). Obese individuals do not lack leptin; rather, they display higher circulating levels of leptin, and these elevated levels are related to leptin resistance and impaired leptin signaling in the brain (52). OSAS and obesity are bidirectionally linked. Many studies have reported that patients with OSAS have higher leptin levels than control subjects. Although the exact mechanism of OSAS-induced impact on leptin levels is not clear, both sleep deprivation and hypoxemia are thought to be critical causative factors (53). Our combined results also indicate that plasma/serum leptin levels are higher in patients with OSA than in the control group. In the subgroup analysis according to the BMI, the plasma leptin concentration for OSA patients with a BMI of <30 kg/m2 was not different compared to controls, whereas the serum leptin level in OSA patients with a BMI of <30 kg/m2 was higher than that in healthy controls, indicating that OSA might influence the leptin level. Similarly, serum leptin levels in obese patients with OSA were higher than those in obese patients without OSA. The reason for the observed difference between plasma and serum leptin levels may be that too few studies (only four) were included in the BMI<30 group for the meta-analysis of plasma leptin levels. In general, our study results indicated that both plasma and serum leptin levels were increased in OSAS regardless of disease severity and assay approach, suggesting that leptin might be a risk factor for OSAS. Interestingly, the increase in plasma/serum leptin level showed subtle alterations in different ethnicities. The ethnicity may influence plasma/serum leptin levels in patients with OSAS. Different human polymorphisms of leptin gene and leptin receptor gene have been characterized (54–56). The synthesis of this hormone is regulated by genetic polymorphisms in the leptin gene (57). Sahin et al. (58) and Mammès et al. (59) suggested that the LEP rs2167270 A allele is associated with increased serum leptin levels in Caucasians. Similarly, Ren et al. (60) found that LEP rs8179183 is associated with serum leptin levels and overweight/obesity in Chinese adolescents.
Leptin, a 16-kD adipokine, regulates weight centrally and is also involved in a cytokine network that governs the inflammatory immune response by releasing proinflammatory cytokines (61). The underlying mechanism of the relationship between plasma/serum leptin concentration and OSA remains unclear. Based on the source, metabolism, and other factors influencing leptin, we summarize here several seemingly reasonable biological explanations. First, researchers surmise that, similar to hyperleptinemia in patients with obesity and metabolic syndrome, leptin resistance is present in patients with OSAS (20). As leptin resistance prevents leptin from performing its normal physiological function, fat distribution is imbalanced, and excess fat is deposited in the upper airway and viscera, contributing to the collapse of the airway during sleep and the onset of OSAS, while leptin concentrations increase as a compensatory mechanism. One study demonstrated that OSAS increases leptin levels independently of obesity (62). Likewise, Ip et al. (18) studied serum leptin levels in obese patients with OSAS after nasal continuous positive airway pressure ventilation (nCPAP). They found distinct hyperleptinemia in OSAS patients before treatment, but plasma leptin levels returned to normal values following nCPAP treatment while the patients maintained their body weights. The results of the present study also showed a moderate positive correlation between leptin concentration and AHI, which supports the above hypothesis. Second, hypoxia is the most important pathophysiological change in patients with OSAS (63). As AHI increases, oxygen saturation decreases significantly at night and hypoxemia occurs, which causes activation of the sympathetic nervous system, elevated angiotensin levels, and blood pressure fluctuations, all of which can lead to increased plasma leptin levels (48, 64). In patients with OSA, repetitive apnea episodes aggravate the hypoxemia and CO2 retention, both of which augment sympathetic activity and reduce parasympathetic activity (48, 64). It is tempting to speculate that sympathetic nerve activity may affect the secretion of leptin. Third, the effect of leptin on respiration is not limited to the regulation of lipid metabolism; it has a more direct effect on the respiratory system. The leptin replacement test in leptin-deficient ob/ob mice showed that leptin is not only a growth factor during lung development but also a neuroregulatory factor in the respiratory center (65). Studies in animal models have shown that leptin is a powerful stimulant of ventilation that can prevent respiratory depression in obese animals. There is accumulating evidence that leptin affects the contraction of the upper airway during sleep (66), suggesting that elevated leptin levels in the central nervous system may prevent the occurrence of OSAS. The increase in serum leptin levels in patients with OSAS may be a compensatory protective mechanism to prevent respiratory depression (67). Therefore, hyperleptinemia and leptin resistance may play important roles in the occurrence and development of OSAS. In addition to obesity, lipid metabolism disorders, systemic inflammatory responses, and oxidative stress, leptin levels were also affected by sex differences, circadian rhythm of leptin secretion, metabolic disease, and lifestyle, among others (68–70). However, because these parameters cannot be extracted from all or at least most of the included studies, it is impossible to carry out further subgroup analyses. There are also diverging views on the effects of leptin on OSAS. Pamuk et al. (71) reported that serum leptin levels of non-obese individuals and non-obese patients with mild OSA are not significantly different and suggested that obesity is an important factor affecting serum leptin levels. A study on the role of leptin in children with OSA found no significant difference in leptin levels between OSA and non-OSA groups, and after correction for obesity factors, the correlation between leptin and oxygen desaturation index was eliminated (43). These results differ from the results of this meta-analysis, maybe because a single-study sample is relatively smaller than that of the present meta-analysis or maybe due to differences in the included populations. The relationship between leptin and OSAS remains controversial, and the underlying physiological mechanism of the effect of leptin on OSA warrants further studies.
The overall heterogeneity was high in this meta-analysis (I2 = 97.3%); nevertheless, the sensitivity assessment indicated that no single study significantly influenced the pooled WMD, suggesting that our data are robust. Meta-regression analyses demonstrated that age, BMI, disease severity, assay approach, study design, PSG type, and ethnicity had no remarkable impact on heterogeneity in this meta-analysis. The heterogeneity of each subgroup remained high after subgroup analyses for these factors. This suggests that several unknown factors contributed to the observed study heterogeneity, such as different experimental reagents, physiques of the patients, or their dietary habits.
This meta-analysis has some strengths in examining the plasma/serum leptin levels in patients with OSAS. First, our results demonstrate that the plasma/serum leptin levels may be a clinically beneficial biological marker, which may aid clinicians in comprehensively diagnosing OSAS and assessing the severity of OSAS. For the first time, we combined Pearson’s correlation coefficients and analyzed the correlation between AHI and leptin levels, thereby demonstrating the relationship between leptin levels and AHI from the perspective of evidence-based medicine. Changes in plasma/serum leptin concentrations may facilitate our understanding of the metabolic mechanisms involved in OSAS. Hirotsu et al. (72) reported a possible participation of leptin in pathophysiological and inflammatory processes in OSA progression. Leptin may be a critical link associated with coexisting metabolic disorders. Manzella et al. (73) also demonstrated that leptin concentrations are positively associated with AHI values, proposing leptin as a biosignature of disease severity. The results of our study are consistent with those of previous reports. Second, this is the most comprehensive meta-analysis of relevant literature to provide robust findings. Although a few reports have previously established a link between leptin and OSA, they only studied leptin receptor gene polymorphisms or effects of continuous positive airway pressure on leptin levels in patients with OSA (74–80). We included cross sectional, case-control cohort studies to analyze the different leptin levels in OSA patients and controls. Our study had a larger sample size (2686 participants), and included more novel researches. Third, all included articles were of medium or high quality, making the assessment more reliable. Fourth, we excluded the potential impact of differences in specimen sources by analyzing serum and plasma leptin levels separately, ruling out this confounding factor.
Despite the novelty of our findings, the following limitations should be considered. First, none of the studies were adjusted to reflect possible confounding factors such as stable daily routine, smoking, or alcohol consumption. And there are only two articles in the original literatures (26, 44) were concerning on male patients with OSA. Although we tried our best to control the confound founding factors, some potential confounding factors may affect the conclusion more or less. Second, since this study lacked effective longitudinal cohort studies, we could not infer causality of the association between plasma/serum leptin levels and OSA. Third, the majority of the included studies had a sample size of fewer than 100 cases, which had insufficient power to analyze the association between leptin levels and OSAS.
5 Conclusion
It is concluded that a high plasma leptin level may be correlated with OSA, and the serum/plasma leptin level positively correlates with AHI. Furthermore, ethnicity has an impact on the association between OSAS and leptin levels. Finally, more elaborate studies are required in the future to ascertain the association between leptin levels and OSAS risk.
Data Availability Statement
The original contributions presented in the study are included in the article/supplementary material. Further inquiries can be directed to the corresponding author.
Author Contributions
Data curation: JH. Formal analysis: XL. Methodology: XL. Project administration: XL. Resources: JH. Supervision: XL. Validation: JH. Writing-original draft: XL. All authors contributed to the article and approved the submitted version.
Conflict of Interest
The authors declare that the research was conducted in the absence of any commercial or financial relationships that could be construed as a potential conflict of interest.
Publisher’s Note
All claims expressed in this article are solely those of the authors and do not necessarily represent those of their affiliated organizations, or those of the publisher, the editors and the reviewers. Any product that may be evaluated in this article, or claim that may be made by its manufacturer, is not guaranteed or endorsed by the publisher.
References
1. Maspero C, Giannini L, Galbiati G, Rosso G, Farronato G. Obstructive Sleep Apnea Syndrome: A Literature Review. Minerva Stomatol (2015) 64:97–109.
2. Li M, Li X, Lu Y. Obstructive Sleep Apnea Syndrome and Metabolic Diseases. Endocrinology (2018) 159:2670–5. doi: 10.1210/en.2018-00248
3. Salman LA, Shulman R, Cohen JB. Obstructive Sleep Apnea, Hypertension, and Cardiovascular Risk: Epidemiology, Pathophysiology, and Management. Curr Cardiol Rep (2020) 22:6. doi: 10.1007/s11886-020-1257-y
4. Kuczyński W, Kudrycka A, Małolepsza A, Karwowska U, Białasiewicz P, Białas A. The Epidemiology of Obstructive Sleep Apnea in Poland-Polysomnography and Positive Airway Pressure Therapy. Int J Environ Res Public Health (2021) 18(4):2109. doi: 10.3390/ijerph18042109
5. Kawada T. Obstructive Sleep Apnea Syndrome and Obesity: Screening Ability. Sleep Breath (2020) 24:743. doi: 10.1007/s11325-019-01973-6
6. Bozkurt NC, Beysel S, Karbek B, Unsal İO, Cakir E, Delibasi T. Visceral Obesity Mediates the Association Between Metabolic Syndrome and Obstructive Sleep Apnea Syndrome. Metab Syndr Relat Disord (2016) 14:217–21. doi: 10.1089/met.2015.0086
7. Zhang Y, Chua S Jr. Leptin Function and Regulation. Compr Physiol (2017) 8:351–69. doi: 10.1002/cphy.c160041
8. Triantafyllou GA, Paschou SA, Mantzoros CS. Leptin and Hormones: Energy Homeostasis. Endocrinol Metab Clin North Am (2016) 45:633–45. doi: 10.1016/j.ecl.2016.04.012
9. Taytard J, Dubern B, Aubertin G. [Obesity in Childhood: What are the Respiratory Risks?]. Rev Mal Respir (2019) 36:1139–47. doi: 10.1016/j.rmr.2019.09.002
10. Xanthopoulos MS, Berkowitz RI, Tapia IE. Effects of Obesity Therapies on Sleep Disorders. Metabolism (2018) 84:109–17. doi: 10.1016/j.metabol.2018.01.022
11. Kapusuz Gencer Z, Özkiriş M, Göçmen Y, Intepe YS, Akin I, Delibaş N, et al. The Correlation of Serum Levels of Leptin, Leptin Receptor and NO X (NO 2 (-) and NO 3 (-)) in Patients With Obstructive Sleep Apnea Syndrome. Eur Arch Otorhinolaryngol (2014) 271:2943–8. doi: 10.1007/s00405-014-2946-1
12. Sánchez-de-la-Torre M, Mediano O, Barceló A, Piérola J, de la Peña M, Esquinas C, et al. The Influence of Obesity and Obstructive Sleep Apnea on Metabolic Hormones. Sleep Breath (2012) 16:649–56. doi: 10.1007/s11325-011-0552-7
13. Ursavas A, Ilcol YO, Nalci N, Karadag M, Ege E. Ghrelin, Leptin, Adiponectin, and Resistin Levels in Sleep Apnea Syndrome: Role of Obesity. Ann Thorac Med (2010) 5:161–5. doi: 10.4103/1817-1737.65050
14. Dalesio NM, Lee CKK, Hendrix CW, Kerns N, Hsu A, Clarke W, et al. Effects of Obstructive Sleep Apnea and Obesity on Morphine Pharmacokinetics in Children. Anesth Analg (2020) 131:876–84. doi: 10.1213/ANE.0000000000004509
15. Emara TA, Khazbak AO, Mohammed O, Elgaml M, Zidan A, Hosny SM. Changes in Serum Leptin Level After Multilevel Surgery in Patients With Obstructive Sleep Apnea. Laryngoscope (2021) 131:E665–70. doi: 10.1002/lary.28908
16. Du L, Shi HY, Qian Y, Jin XH, Li Y, Yu HR, et al. Association Between Social Support and Suicidal Ideation in Patients With Cancer: A Systematic Review and Meta-Analysis. Eur J Cancer Care (Engl) (2021) 30:e13382. doi: 10.1111/ecc.13382
17. Surov A, Meyer HJ, Wienke A. Associations Between Apparent Diffusion Coefficient (ADC) and KI 67 in Different Tumors: A Meta-Analysis. Part 1: ADC(Mean). Oncotarget (2017) 8:75434–44. doi: 10.18632/oncotarget.20406
18. Ip MS, Lam KS, Ho C, Tsang KW, Lam W. Serum Leptin and Vascular Risk Factors in Obstructive Sleep Apnea. Chest (2000) 118:580–6. doi: 10.1378/chest.118.3.580
19. Phillips BG, Kato M, Narkiewicz K, Choe I, Somers VK. Increases in Leptin Levels, Sympathetic Drive, and Weight Gain in Obstructive Sleep Apnea. Am J Physiol Heart Circ Physiol (2000) 279:H234–7. doi: 10.1152/ajpheart.2000.279.1.H234
20. Ulukavak Ciftci T, Kokturk O, Bukan N, Bilgihan A. Leptin and Ghrelin Levels in Patients With Obstructive Sleep Apnea Syndrome. Respiration (2005) 72:395–401. doi: 10.1159/000086254
21. Rubinsztajn R, Kumor M, Byśkiniewicz K, Bielicki P, Chazan R. [Serum Leptin Concentration and Sympathetic Activation Estimated on the Adrenaline and Noradrenaline Serum Concentration in Patients With Obstructive Sleep Apnea]. Pol Arch Med Wewn (2005) 113:544–51.
22. Barceló A, Barbé F, Llompart E, de la Peña M, Durán-Cantolla J, Ladaria A, et al. Neuropeptide Y and Leptin in Patients With Obstructive Sleep Apnea Syndrome: Role of Obesity. Am J Respir Crit Care Med (2005) 171:183–7. doi: 10.1164/rccm.200405-579OC
23. McArdle N, Hillman D, Beilin L, Watts G. Metabolic Risk Factors for Vascular Disease in Obstructive Sleep Apnea: A Matched Controlled Study. Am J Respir Crit Care Med (2007) 175:190–5. doi: 10.1164/rccm.200602-270OC
24. Sharma SK, Kumpawat S, Goel A, Banga A, Ramakrishnan L, Chaturvedi P. Obesity, and Not Obstructive Sleep Apnea, is Responsible for Metabolic Abnormalities in a Cohort With Sleep-Disordered Breathing. Sleep Med (2007) 8:12–7. doi: 10.1016/j.sleep.2006.06.014
25. Tokuda F, Sando Y, Matsui H, Koike H, Yokoyama T. Serum Levels of Adipocytokines, Adiponectin and Leptin, in Patients With Obstructive Sleep Apnea Syndrome. Intern Med (2008) 47:1843–9. doi: 10.2169/internalmedicine.47.1035
26. Kapsimalis F, Varouchakis G, Manousaki A, Daskas S, Nikita D, Kryger M, et al. Association of Sleep Apnea Severity and Obesity With Insulin Resistance, C-Reactive Protein, and Leptin Levels in Male Patients With Obstructive Sleep Apnea. Lung (2008) 186:209–17. doi: 10.1007/s00408-008-9082-x
27. Makinodan K, Yoshikawa M, Fukuoka A, Tamaki S, Koyama N, Yamauchi M, et al. Effect of Serum Leptin Levels on Hypercapnic Ventilatory Response in Obstructive Sleep Apnea. Respiration (2008) 75:257–64. doi: 10.1159/000112471
28. Yamamoto Y, Fujiuchi S, Hiramatsu M, Nishigaki Y, Takeda A, Fujita Y, et al. Resistin Is Closely Related to Systemic Inflammation in Obstructive Sleep Apnea. Respiration (2008) 76:377–85. doi: 10.1159/000141866
29. Jian Y. Changes in Serum Leptin and Tumor Necrosis Factor-α Levels in Children With Obstructive Sleep Apnea Syndrome. J Of Chin Physician (2008) (05):617–9. doi: 10.3760/cma.j.issn.1008-1372.2008.05.014
30. Antonopoulou S, Loukides S, Papatheodorou G, Roussos C, Alchanatis M. Airway Inflammation in Obstructive Sleep Apnea: Is Leptin the Missing Link? Respir Med (2008) 102:1399–405. doi: 10.1016/j.rmed.2008.04.021
31. Wysocka E, Cofta S, Dziegielewska S, Gozdzik J, Torlinski L, Batura-Gabryel H. Adipocytokines in Sleep Apnea Syndrome. Eur J Med Res (2009) 14(Suppl 4):255–8. doi: 10.1186/2047-783X-14-S4-255
32. Acıoğlu E, Yiğit O, Volkan Sunter A, Taşkın U, Berçik İnal B, Sahin M. Obesity and Obstructive Sleep Apnea Syndrome. J Otolaryngol Head Neck Surg (2010) 39:744–51. doi: 10.2310/7070.2010.090320
33. Carpagnano GE, Resta O, Pergola GD, Sabato R, Foschino Barbaro MP. The Role of Obstructive Sleep Apnea Syndrome and Obesity in Determining Leptin in the Exhaled Breath Condensate. J Breath Res (2010) 4:036003. doi: 10.1088/1752-7155/4/3/036003
34. Canapari CA, Hoppin AG, Kinane TB, Thomas BJ, Torriani M, Katz ES. Relationship Between Sleep Apnea, Fat Distribution, and Insulin Resistance in Obese Children. J Clin Sleep Med (2011) 7:268–73. doi: 10.5664/JCSM.1068
35. Basoglu OK, Sarac F, Sarac S, Uluer H, Yilmaz C. Metabolic Syndrome, Insulin Resistance, Fibrinogen, Homocysteine, Leptin, and C-Reactive Protein in Obese Patients With Obstructive Sleep Apnea Syndrome. Ann Thorac Med (2011) 6:120–5. doi: 10.4103/1817-1737.82440
36. Matos G, Hirotsu C, Alvarenga TA, Cintra F, Bittencourt L, Tufik S, et al. The Association Between TNF-α and Erectile Dysfunction Complaints. Andrology (2013) 1:872–8. doi: 10.1111/j.2047-2927.2013.00136.x
37. Salord N, Gasa M, Mayos M, Fortuna-Gutierrez AM, Montserrat JM, Sánchez-de-la-Torre M, et al. Impact of OSA on Biological Markers in Morbid Obesity and Metabolic Syndrome. J Clin Sleep Med (2014) 10:263–70. doi: 10.5664/jcsm.3524
38. Yosunkaya Ş, Okur HK, Can Ü, Zamani A, Kutlu R. Impact of Continuous Positive Airway Pressure Treatment on Leptin Levels in Patients With Obstructive Sleep Apnea Syndrome. Metab Syndr Relat Disord (2015) 13:272–7. doi: 10.1089/met.2014.0161
39. Chihara Y, Akamizu T, Azuma M, Murase K, Harada Y, Tanizawa K, et al. Among Metabolic Factors, Significance of Fasting and Postprandial Increases in Acyl and Desacyl Ghrelin and the Acyl/Desacyl Ratio in Obstructive Sleep Apnea Before and After Treatment. J Clin Sleep Med (2015) 11:895–905. doi: 10.5664/jcsm.4942
40. Dubey A, Kant S, Tiwari S, Agarwal S, Mahdi AA. Leptin Level Correlates With Obesity and Health Related Quality of Life in Obstructive Sleep Apnea Syndrome Patients. Indian J Tuberc (2015) 62:105–9. doi: 10.1016/j.ijtb.2015.04.010
41. De Santis S, Cambi J, Tatti P, Bellussi L, Passali D. Changes in Ghrelin, Leptin and Pro-Inflammatory Cytokines After Therapy in Obstructive Sleep Apnea Syndrome (OSAS) Patients. Otolaryngol Pol (2015) 69:1–8. doi: 10.5604/00306657.1147029
42. Gaines J, Vgontzas AN, Fernandez-Mendoza J, Calhoun SL, He F, Liao D, et al. Inflammation Mediates the Association Between Visceral Adiposity and Obstructive Sleep Apnea in Adolescents. Am J Physiol Endocrinol Metab (2016) 311:E851–8. doi: 10.1152/ajpendo.00249.2016
43. Van Eyck A, Van Hoorenbeeck K, De Winter BY, Van Gaal L, De Backer W, Verhulst SL. Sleep-Disordered Breathing, Systemic Adipokine Secretion, and Metabolic Dysregulation in Overweight and Obese Children and Adolescents. Sleep Med (2017) 30:52–6. doi: 10.1016/j.sleep.2015.11.014
44. Cakir I, Uluhan M. Cardiotrophin-1 and Leptin as Cardiovascular Risk Markers in Male Patients With Obstructive Sleep Apnea Syndrome. Arch Med Sci Atheroscler Dis (2018) 3:e123–8. doi: 10.5114/amsad.2018.79407
45. Ji L, Jia X. Expression and Significance of Leptin in Serum of Children With OSA. Chin J Otorhinolaryngol In Integr Med (2019) 27:304–5. doi: 10.16542/j.cnki.issn.1007-4856.2019.03.018
46. Sertogullarindan B, Komuroglu AU, Ucler R, Gunbatar H, Sunnetcioglu A, Cokluk E. Betatrophin Association With Serum Triglyceride Levels in Obstructive Sleep Apnea Patients. Ann Thorac Med (2019) 14:63–8. doi: 10.4103/atm.ATM_52_18
47. Voulgaris A, Archontogeorgis K, Papanas N, Pilitsi E, Nena E, Xanthoudaki M, et al. Increased Risk for Cardiovascular Disease in Patients With Obstructive Sleep Apnoea Syndrome-Chronic Obstructive Pulmonary Disease (Overlap Syndrome). Clin Respir J (2019) 13:708–15. doi: 10.1111/crj.13078
48. Syed AH, Lohana S, Aung NH, Memon MK, Shaikh A, Memon S, et al. Correlation of Leptin With Acute Myocardial Infarction: A Case Control Study. Cureus (2020) 12:e12190. doi: 10.7759/cureus.12190
49. Ilhan N, Susam S, Canpolat O, Belhan O. The Emerging Role of Leptin, Adiponectin and Visfatin in Ischemic/Hemorrhagic Stroke. Br J Neurosurg (2019) 33:504–7. doi: 10.1080/02688697.2019.1578862
50. Söderberg S, Olsson T, Eliasson M, Johnson O, Ahrén B. Plasma Leptin Levels are Associated With Abnormal Fibrinolysis in Men and Postmenopausal Women. J Intern Med (1999) 245:533–43. doi: 10.1046/j.1365-2796.1999.00472.x
51. Izquierdo AG, Crujeiras AB, Casanueva FF, Carreira MC. Leptin, Obesity, and Leptin Resistance: Where Are We 25 Years Later? Nutrients (2019) 11(11):2704. doi: 10.3390/nu11112704
52. Zhao S, Zhu Y, Schultz RD, Li N, He Z, Zhang Z, et al. Partial Leptin Reduction as an Insulin Sensitization and Weight Loss Strategy. Cell Metab (2019) 30:706–19.e6. doi: 10.1016/j.cmet.2019.08.005
53. Alam I, Lewis K, Stephens JW, Baxter JN. Obesity, Metabolic Syndrome and Sleep Apnoea: All Pro-Inflammatory States. Obes Rev (2007) 8:119–27. doi: 10.1111/j.1467-789X.2006.00269.x
54. Nesrine Z, Haithem H, Imen B, Fadoua N, Asma O, Fadhel NM, et al. Leptin and Leptin Receptor Polymorphisms, Plasma Leptin Levels and Obesity in Tunisian Volunteers. Int J Exp Pathol (2018) 99:121–30. doi: 10.1111/iep.12271
55. Li J, Yang S, Jiao X, Yang Y, Sun H, Zhang M, et al. Targeted Sequencing Analysis of the Leptin Receptor Gene Identifies Variants Associated With Obstructive Sleep Apnoea in Chinese Han Population. Lung (2019) 197:577–84. doi: 10.1007/s00408-019-00254-z
56. Popko K, Gorska E, Wasik M, Stoklosa A, Pływaczewski R, Winiarska M, et al. Frequency of Distribution of Leptin Receptor Gene Polymorphism in Obstructive Sleep Apnea Patients. J Physiol Pharmacol (2007) 58(Suppl 5):551–61. doi: 10.1152/jn.z9k-8581-corr.2007
57. Pawlik A, Teler J, Maciejewska A, Sawczuk M, Safranow K, Dziedziejko V. Adiponectin and Leptin Gene Polymorphisms in Women With Gestational Diabetes Mellitus. J Assist Reprod Genet (2017) 34:511–6. doi: 10.1007/s10815-016-0866-2
58. Sahin DS, Tumer C, Demir C, Celik MM, Celik M, Ucar E, et al. Association With Leptin Gene C.-2548 G>A Polymorphism, Serum Leptin Levels, and Body Mass Index in Turkish Obese Patients. Cell Biochem Biophys (2013) 65:243–7. doi: 10.1007/s12013-012-9427-1
59. Mammès O, Betoulle D, Aubert R, Herbeth B, Siest G, Fumeron F. Association of the G-2548A Polymorphism in the 5' Region of the LEP Gene With Overweight. Ann Hum Genet (2000) 64:391–4. doi: 10.1017/S0003480000008277
60. Ren D, Xu JH, Bi Y, Zhang Z, Zhang R, Li Y, et al. Association Study Between LEPR, MC4R Polymorphisms and Overweight/Obesity in Chinese Han Adolescents. Gene (2019) 692:54–9. doi: 10.1016/j.gene.2018.12.073
61. Coppack SW. Pro-Inflammatory Cytokines and Adipose Tissue. Proc Nutr Soc (2001) 60:349–56. doi: 10.1079/PNS2001110
62. Tatsumi K, Kasahara Y, Kurosu K, Tanabe N, Takiguchi Y, Kuriyama T. Sleep Oxygen Desaturation and Circulating Leptin in Obstructive Sleep Apnea-Hypopnea Syndrome. Chest (2005) 127:716–21. doi: 10.1378/chest.127.3.716
63. Harki O, Tamisier R, Pépin JL, Bailly S, Mahmani A, Gonthier B, et al. VE-Cadherin Cleavage in Sleep Apnoea: New Insights Into Intermittent Hypoxia-Related Endothelial Permeability. Eur Respir J (2021) 2004518. doi: 10.1183/13993003.04518-2020
64. Lévy P, Pépin JL, Arnaud C, Tamisier R, Borel JC, Dematteis M, et al. Intermittent Hypoxia and Sleep-Disordered Breathing: Current Concepts and Perspectives. Eur Respir J (2008) 32:1082–95. doi: 10.1183/09031936.00013308
65. Tankersley C, Kleeberger S, Russ B, Schwartz A, Smith P. Modified Control of Breathing in Genetically Obese (Ob/Ob) Mice. J Appl Physiol (1985) (1996) 81:716–23. doi: 10.1152/jappl.1996.81.2.716
66. Gutiérrez-Carrasquilla L, López-Cano C, Sánchez E, Barbé F, Dalmases M, Hernández M, et al. Effect of Glucose Improvement on Nocturnal Sleep Breathing Parameters in Patients With Type 2 Diabetes: The Candy Dreams Study. J Clin Med (2020) 9(4):1022. doi: 10.3390/jcm9041022
67. Malli F, Papaioannou AI, Gourgoulianis KI, Daniil Z. The Role of Leptin in the Respiratory System: An Overview. Respir Res (2010) 11:152. doi: 10.1186/1465-9921-11-152
68. Aro M, Anttalainen U, Kurki S, Irjala K, Polo O, Saaresranta T. Gender-Specific Change in Leptin Concentrations During Long-Term CPAP Therapy. Sleep Breath (2020) 24:191–9. doi: 10.1007/s11325-019-01846-y
69. Sirico F, Bianco A, D'Alicandro G, Castaldo C, Montagnani S, Spera R, et al. Effects of Physical Exercise on Adiponectin, Leptin, and Inflammatory Markers in Childhood Obesity: Systematic Review and Meta-Analysis. Child Obes (2018) 14:207–17. doi: 10.1089/chi.2017.0269
70. Luglio HF, Sulistyoningrum DC, Huriyati E, Lee YY, Wan Muda WAM. The Gene-Lifestyle Interaction on Leptin Sensitivity and Lipid Metabolism in Adults: A Population Based Study. Nutrients (2017) 9(7):716. doi: 10.3390/nu9070716
71. Pamuk AE, Süslü AE, Yalçınkaya A, Öztaş YE, Pamuk G, Özer S, et al. The Serum Leptin Level in Non-Obese Patients With Obstructive Sleep Apnea. Auris Nasus Larynx (2018) 45:796–800. doi: 10.1016/j.anl.2017.11.009
72. Hirotsu C, Albuquerque RG, Nogueira H, Hachul H, Bittencourt L, Tufik S, et al. The Relationship Between Sleep Apnea, Metabolic Dysfunction and Inflammation: The Gender Influence. Brain Behav Immun (2017) 59:211–8. doi: 10.1016/j.bbi.2016.09.005
73. Manzella D, Parillo M, Razzino T, Gnasso P, Buonanno S, Gargiulo A, et al. Soluble Leptin Receptor and Insulin Resistance as Determinant of Sleep Apnea. Int J Obes Relat Metab Disord (2002) 26:370–5. doi: 10.1038/sj.ijo.0801939
74. Chen X, Niu X, Xiao Y, Dong J, Lu M, Kong W. Effect of Continuous Positive Airway Pressure on Leptin Levels in Patients With Obstructive Sleep Apnea: A Meta-Analysis. Otolaryngol Head Neck Surg (2015) 152:610–8. doi: 10.1177/0194599814562719
75. Zhang P, Liu J, Long S, Xie X, Guo Y. Association Between Continuous Positive Airway Pressure and Changes in Serum Leptin in Patients With Obstructive Sleep Apnoea: A Meta-Analysis. Sleep Breath (2014) 18:695–702. doi: 10.1007/s11325-014-0941-9
76. Zhu M, Bai X. Association of LEPR Gln223Arg Polymorphism With Obstructive Sleep Apnea Syndrome: A Meta-Analysis. Crit Rev Eukaryot Gene Expr (2019) 29:171–6. doi: 10.1615/CritRevEukaryotGeneExpr.2019025748
77. Xu B, Liu J, Li T, Liu S. Gln223Arg Polymorphism in the Caucasian Population and Pro1019Pro Polymorphism in the Chinese Population are Risk Factors for OSAS: An Updated Meta-Analysis of 1159 Subjects. Rev Port Pneumol (2006) 23:62–70. doi: 10.1016/j.rppnen.2016.12.002
78. Lan F, Cao C, Liu J, Li W. Obstructive Sleep Apnea Syndrome Susceptible Genes in the Chinese Population: A Meta-Analysis of 21 Case-Control Studies. Sleep Breath (2015) 19:1441–8. doi: 10.1007/s11325-015-1176-0
79. Lv D, Tan L, Wu Y, Cao C, Deng Z. Leptin and Leptin Receptor Gene Polymorphisms in Obstructive Sleep Apnea: A HuGE Review and Meta-Analysis. Sleep Breath (2015) 19:1073–8. doi: 10.1007/s11325-015-1120-3
Keywords: leptin, obstructive sleep apnea syndrome, meta-analysis, obesity, serum, plasma
Citation: Li X and He J (2021) The Association Between Serum/Plasma Leptin Levels and Obstructive Sleep Apnea Syndrome: A Meta-Analysis and Meta-Regression. Front. Endocrinol. 12:696418. doi: 10.3389/fendo.2021.696418
Received: 19 April 2021; Accepted: 07 September 2021;
Published: 24 September 2021.
Edited by:
Carol F. Elias, University of Michigan, United StatesReviewed by:
Peng Li, University of Michigan, United StatesHuajun Xu, Shanghai Jiao Tong University, China
Copyright © 2021 Li and He. This is an open-access article distributed under the terms of the Creative Commons Attribution License (CC BY). The use, distribution or reproduction in other forums is permitted, provided the original author(s) and the copyright owner(s) are credited and that the original publication in this journal is cited, in accordance with accepted academic practice. No use, distribution or reproduction is permitted which does not comply with these terms.
*Correspondence: Jie He, MTM1NDAyNDY5NzRAMTYzLmNvbQ==