 Hannah Maude
 Winston Lau2
 Toby Andrew
94% of researchers rate our articles as excellent or good
Learn more about the work of our research integrity team to safeguard the quality of each article we publish.
Find out more
ORIGINAL RESEARCH article
Front. Endocrinol., 11 August 2021
Sec. Diabetes: Molecular Mechanisms
Volume 12 - 2021 | https://doi.org/10.3389/fendo.2021.694893
This study investigated the potential genetic mechanisms which underlie adipose tissue mitochondrial dysfunction in Type 2 diabetes (T2D), by systematically identifying nuclear-encoded mitochondrial genes (NEMGs) among the genes regulated by T2D-associated genetic loci. The target genes of these ‘disease loci’ were identified by mapping genetic loci associated with both disease and gene expression levels (expression quantitative trait loci, eQTL) using high resolution genetic maps, with independent estimates co-locating to within a small genetic distance. These co-locating signals were defined as T2D-eQTL and the target genes as T2D cis-genes. In total, 763 cis-genes were associated with T2D-eQTL, of which 50 were NEMGs. Independent gene expression datasets for T2D and insulin resistant cases and controls confirmed that the cis-genes and cis-NEMGs were enriched for differential expression in cases, providing independent validation that genetic maps can identify informative functional genes. Two additional results were consistent with a potential role of T2D-eQTL in regulating the 50 identified cis-NEMGs in the context of T2D risk: (1) the 50 cis-NEMGs showed greater differential expression compared to other NEMGs and (2) other NEMGs showed a trend towards significantly decreased expression if their expression levels correlated more highly with the subset of 50 cis-NEMGs. These 50 cis-NEMGs, which are differentially expressed and associated with mapped T2D disease loci, encode proteins acting within key mitochondrial pathways, including some of current therapeutic interest such as the metabolism of branched-chain amino acids, GABA and biotin.
Considerable efforts have been spent in a bid to understand the genetic mechanisms that underpin Type 2 diabetes (T2D) and other complex diseases. Dozens of genome wide association studies (GWAS) have successfully replicated the association of hundreds of genetic markers with T2D (referred to as disease loci) using single-SNP (single-nucleotide polymorphism) tests for association (1), with recent studies achieving cohort sizes of up to one million participants (2). Such large cohorts enable variants with small phenotypic effects to achieve statistical significance, although introduce additional problems of potential heterogeneity and ability to obtain high quality phenotype data. We previously used an alternative test for association, here called LDU-based gene mapping, to map 111 novel T2D disease loci at genome-wide significance in a cohort of 5,800 T2D cases and 9,691 controls (3). 20 of these loci were more recently also reported in a GWAS using single-SNP tests of association (based on a replication co-location criterion of 500kb), but required over one million participants to achieve statistical significance (2). LDU-based gene mapping, described in detail elsewhere (4), captures additional information at each locus by utilizing high-resolution genetic maps measured in additive linkage disequilibrium units (LDU) (3) (Figure 1), is robust to imputation errors by using only observed genotyped marker panels, and requires a lower statistical threshold by correcting for ~5,000 genomic tests. In this current study we show that the LDU-based method can be applied to investigate a specific biological hypothesis in the context of disease, namely the role of mitochondrial function in T2D.

Figure 1 An overview of linkage disequilibrium unit (LDU)-based gene mapping and single-SNP tests of association. Single-SNP methods test each SNP independently for association and detect disease loci where one or more SNPs achieve a genome-wide significance threshold of 5 × 10⁻⁸, typically using a regression that tests for differences in case vs control allele frequencies. LDU-based gene mapping detects disease loci where multiple genetic markers display a pattern of association which reflects the decline in LD between SNPs and the estimated location of a causal variant. LD information is obtained from a relevant population-specific genetic LDU map shown in blue, where horizontal ‘blocks’ represent extended LD and vertical ‘steps’ represent a breakdown in LD. Note that depending upon the local LD structure, the lead SNP and causal variant estimated location are rarely the same.
Mitochondrial function in T2D is of therapeutic interest since the mitochondria are targeted by multiple drugs used to treat T2D (5). Mitochondrial dysfunction, for which definitions include differences in numbers, morphology, gene expression, oxidative phosphorylation, substrate oxidation and production of reactive oxygen species (ROS) or ATP, has been well established to be implicated in T2D through observational and functional studies [see several detailed reviews (6–9)]. This is unsurprising, since insulin activity and therefore resistance can regulate mitochondrial function (10, 11). On the other hand, manipulating mitochondrial function both in vitro and in vivo can influence insulin sensitivity (12–15), while mutations in the mitochondrial genome cause diabetes syndromes in humans (16–19). Thus, the question remains to what extent, if any, the mitochondrial dysfunction observed in individuals with T2D and their healthy offspring (20–24) may causally contribute to disease (25). Since inherited genetic mechanisms can precede and increase risk of disease onset, we used a novel genetic design to identify potential mechanisms which drive mitochondrial dysfunction in the context of T2D. Specifically, this study investigated T2D disease loci which regulate the expression levels of nuclear-encoded mitochondrial genes (NEMGs) in adipose tissue, since mitochondrial dysfunction in adipose can result in ectopic fat production, inflammation (26) and peripheral insulin resistance (IR) (27, 28). NEMGs, through which T2D genetic risk variants may feasibly regulate mitochondrial function, are particularly enriched for regulation by genetic variants in adipose tissue (29).
Here, we aim to identify NEMGs among the target genes (cis-genes) regulated by T2D disease loci. Since T2D loci are overwhelmingly non-coding (1, 30, 31), cis-genes were here defined based on the colocation of disease loci with adipose tissue eQTL (expression quantitative trait loci), independently mapped using LDU-based gene mapping, under the hypothesis of shared functional variants. This current study follows our previous observation that the cis-genes of 111 novel T2D disease loci (hereafter referred to as T2D cis-genes) included NEMGs (3). Here, the list of T2D cis-genes was extended and refined based on the co-location of eQTL within a small genetic distance of disease loci, to effectively exclude eQTL which appeared physically close (separated by a small base pair distance) but represented independent association signals from variants separated by LD breakdown (and therefore a large genetic distance). The extended list of T2D cis-genes was used to address two fundamental research objectives: (1) to validate the identified T2D cis-genes and cis-NEMGs, by directly testing independent gene expression datasets for evidence that these genes associate with T2D and insulin resistance, by means of differential expression compared to healthy controls and (2) to identify mitochondrial pathways potentially dysregulated in the context of T2D.
The current study analyzed location estimates of causal variants associated with T2D and adipose gene expression, mapped as previously described by Lau et al. (3) using an LDU-based multi-marker test of association described in detail elsewhere (4) (see Figure 1 for a brief summary). The multi-marker test of association implements an adapted Malécot model to estimate causal variant locations within 4,800 distinct analytical windows (each approximately 10 LDU in size) comprising the autosomal genome. One test is fitted per window and incorporates all genotyped variants, testing for declines in SNP-trait association as would be expected for SNPs in decreasing LD with a causal variant. Decline in LD is modelled based upon population-specific, high-resolution genetic maps measured in metric additive LDU and constructed using millions of observed genotyped markers for population-specific reference panels (3, 32). Compared to single-SNP tests, which test every SNP independently, LDU-based mapping effectively reduces the total number of association tests and genome-wide significance threshold (see Figure 1), while controlling for Type I and Type II error rates (4).
The locations of causal variants associated with T2D (ŜT2D) were estimated from two European case-control cohorts (the Wellcome Trust Case Control Consortium, WTCCC1 and WTCCC2) (33, 34) and one African American (AA) cohort (obtained from the National Institute of Diabetes and Digestive and Kidney Diseases, NIDDK) (35), totaling 5,800 cases and 9,691 controls. Genetic locations associated with adipose tissue gene expression levels (ŜeQTL) were also mapped for genes within ±1.5Mb of replicated ŜT2D, defined as co-locating within 1LDU, using a population-based sample of healthy Europeans from the MuTHER Consortium (36). The current study included ŜT2D using a nominal significance threshold (ŜT2D α < 1x10⁻³) in order to expand the previously reported list of cis-genes (3) defined using Bonferroni-correction (ŜT2D α < 1x10⁻⁵, corrected for ~5,000 independent tests) and facilitate pathway enrichment analysis. ŜeQTL were included if they had a nominal p-value <0.05.
ŜT2D and ŜeQTL were integrated in this study to identify putative T2D-eQTL based upon a co-location threshold of 1 LDU. This threshold reflects a small genetic distance and excludes genetically distinct signals (similar to replicating lead SNPs based on high LD). 1 LDU corresponds to a median distance of 48kb per chromosome, ranging from a median of 34kb (chr22) to 57kb (chr2), as defined by the European genetic LDU map. Replicated T2D loci were defined where two or more ŜT2D co-located within 1 LDU and were considered cosmopolitan if one ŜT2D was AA (converted to the European LDU map via its physical location). Adipose tissue ŜeQTL within 1 LDU of a replicated ŜT2D, referred to as ‘T2D-eQTL’ (an example is illustrated in Figure 2), were used to define target T2D cis-genes. Gene expression probes associated with ŜeQTL which overlapped multiple genes were assigned gene names using the annotated gene (according to the R package illuminaHumanv3.db). Otherwise, gene names were assigned using Ensembl GRCh37 gene coordinates. Ensembl gene identifiers were converted to HGNC identifiers using the biomaRt package in R (37). All LDU location estimates have been converted to physical location (GRCh37 or b37) for presentational purposes.
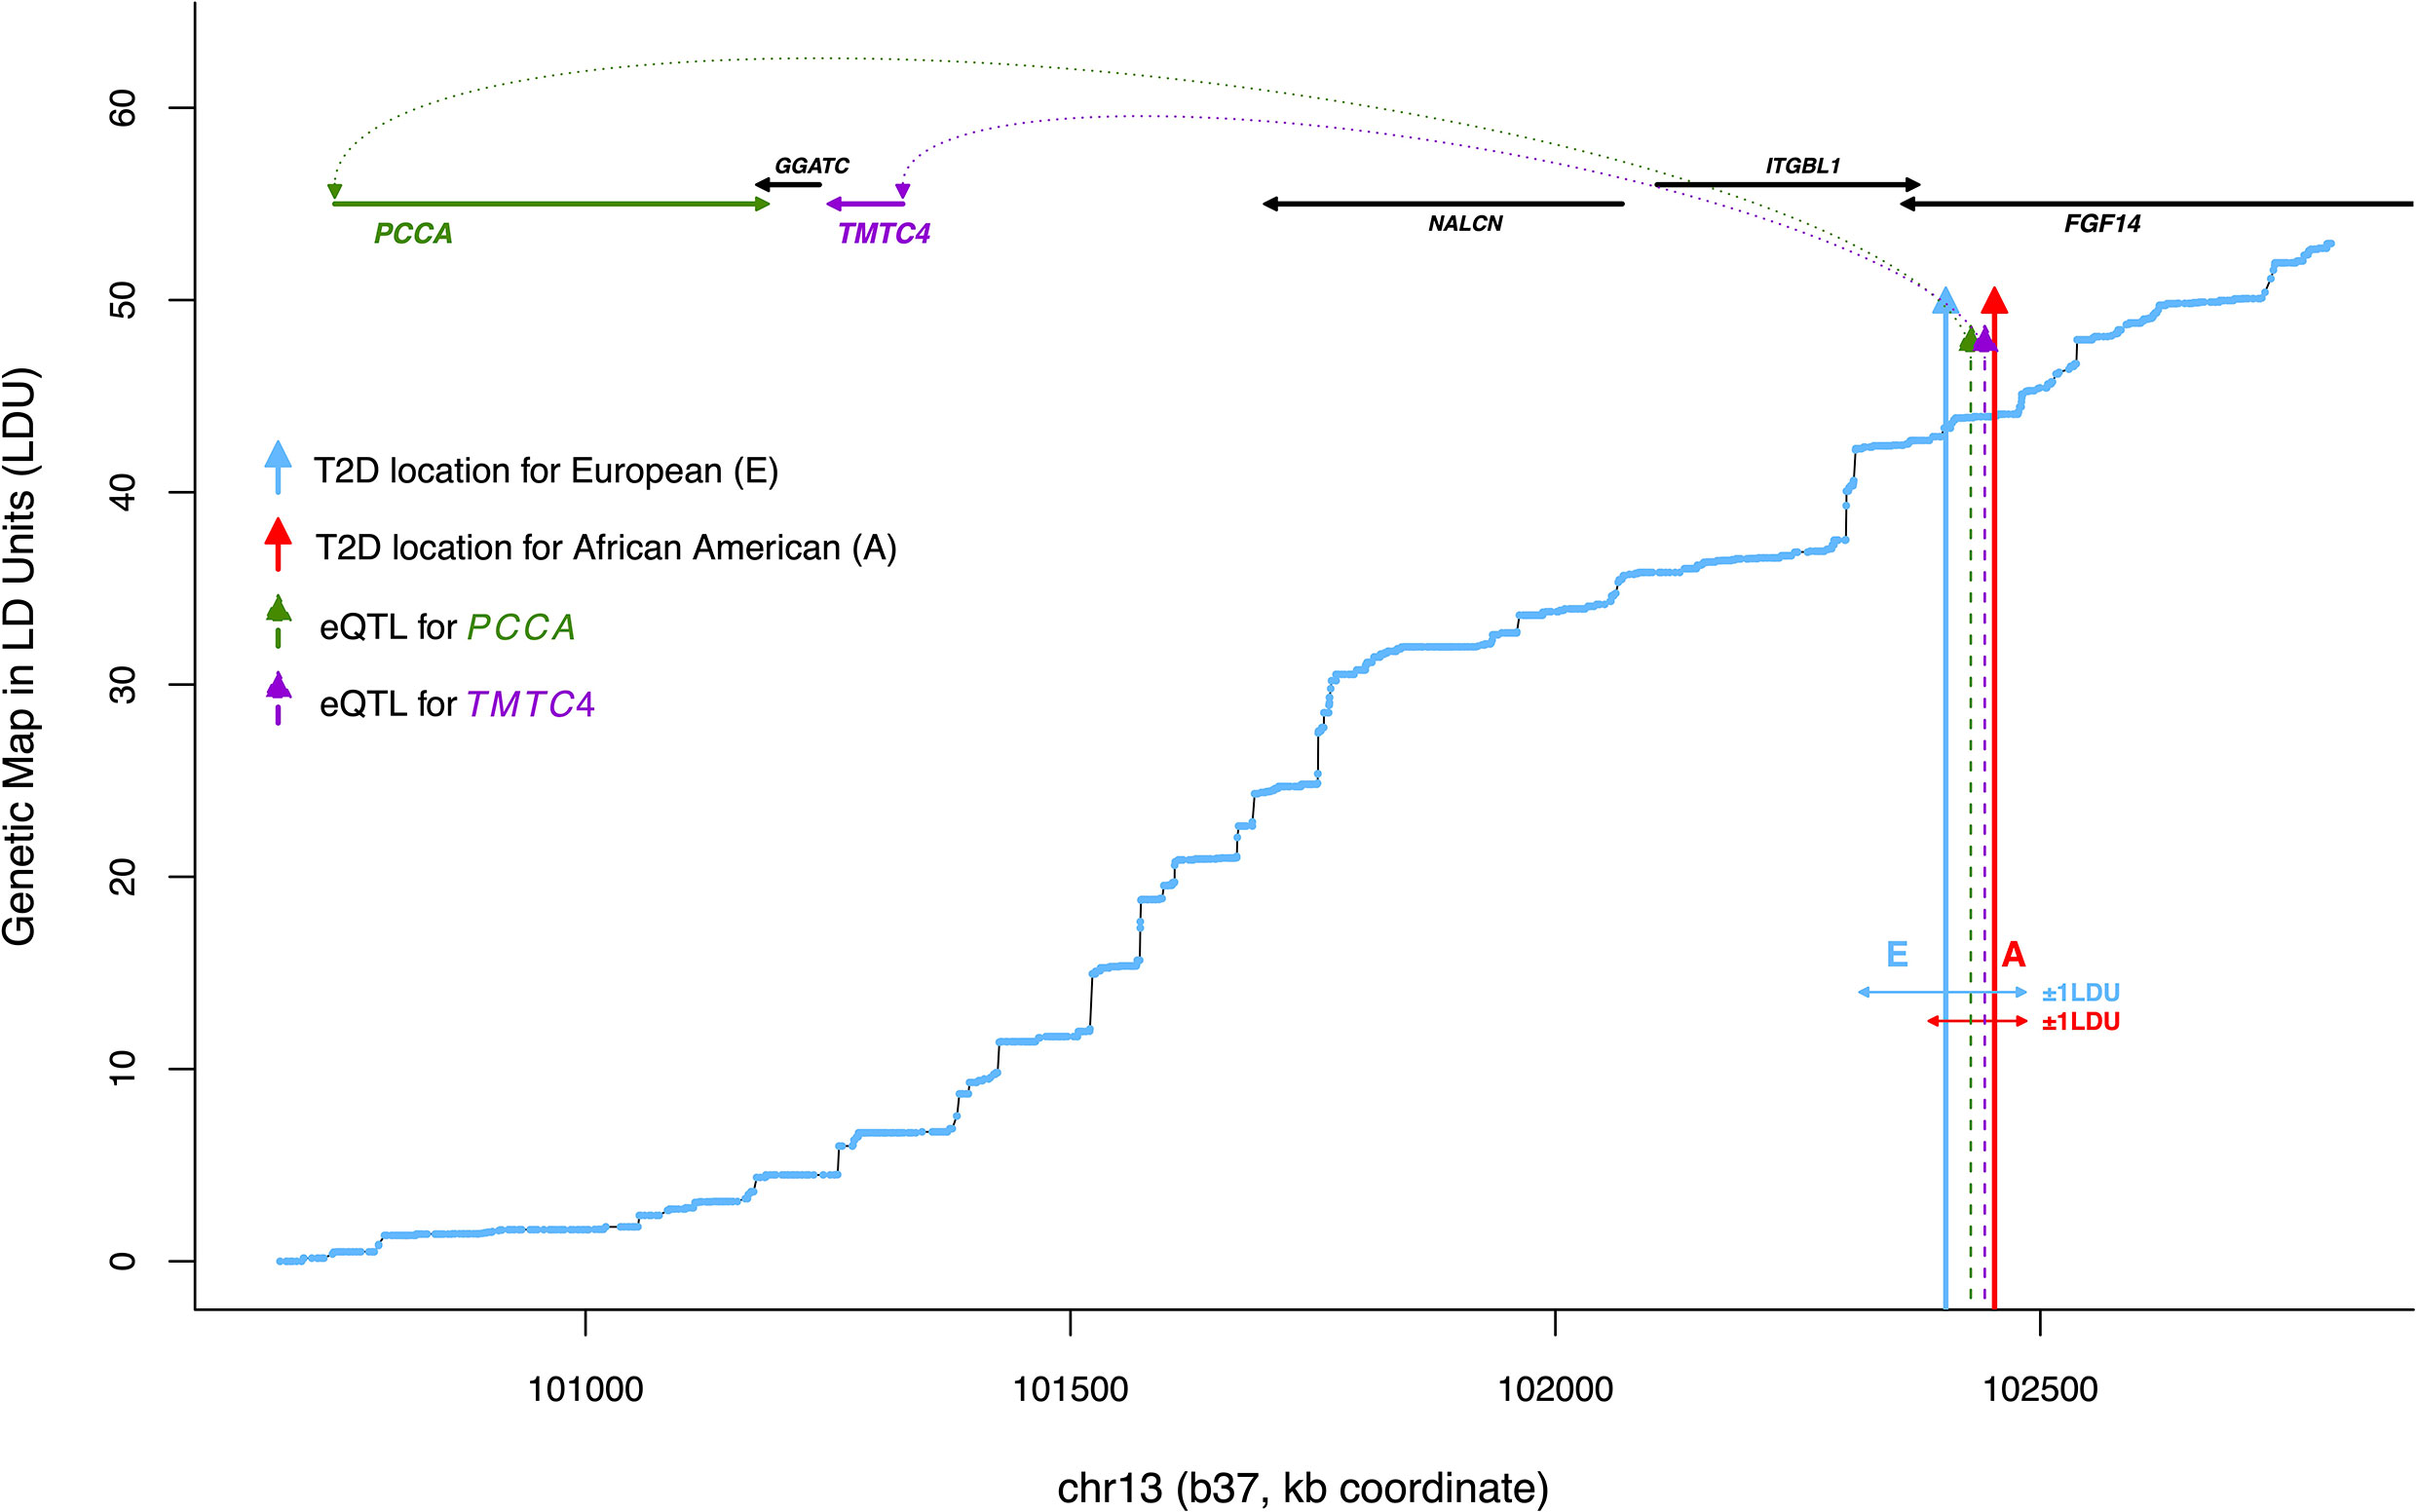
Figure 2 An example of co-locating T2D and eQTL locations, or ‘T2D-eQTL’ (chr13). Plotted is physical distance (kb coordinate) against genetic distance in linkage disequilibrium units (LDU), based on a European genetic map constructed by Lau et al. (3). The blue line shows cumulative LDU across the region in a ‘step’ and ‘block’ structure, corresponding to regions of LD breakdown and extended LD, respectively. Blue and red arrows correspond to ŜT2D location estimates associated with T2D in the Wellcome Trust European and African American populations (WTC and AA), respectively, with horizontal arrows illustrating the asymmetrical physical distance extending ±1 LDU. The dotted arrows show ŜeQTL location estimates for two cis-genes, PCCA which is a nuclear-encoded mitochondrial gene (NEMG) and TMTC4, which is not (confidence intervals not shown). All ŜT2D and ŜeQTL location estimates are provided in Table 1.
NEMGs were identified by cross-referencing Ensembl and HGNC gene identifiers with the combined MitoCarta2.0 and MitoCarta+ databases (38, 39) of known NEMGs. KEGG pathways and KEGG ontology terms (40) were used to group the cis-NEMGs by function, in addition to GeneCards summaries where KEGG data were lacking (41). Additional databases including STRING (42), Refseq (43), Reactome (44) and Gene Ontology (45) were used to further discuss potential gene functions.
Independent datasets with baseline gene expression data for T2D and IR case-control cohorts, measured using Affymetrix arrays, were identified from the Gene Expression Omnibus (GEO) database (46, 47). The search string is shown in the Supplementary Methods, with inclusion and exclusion criteria listed in Supplementary Table S2. Supplementary Figure S1 shows the datasets excluded following full-text review. The tissues skeletal muscle, liver and pancreas were included in addition to subcutaneous adipose to investigate potential cross-tissue effects on cis-gene expression. Raw data were downloaded as CEL files and normalized using robust multi-array averaging (RMA) (48), as implemented by the R package oligo (49). Phenotype data was extracted using GEOquery (50) and the appropriate array annotation package. Gene-centric Z scores, used as a summary measure of differential expression for each gene by disease status, were calculated by regressing normalized probe expression on phenotype, coded 0 for control and 1 for T2D or IR cases. Linear mixed-effects regression models (including intercept random effects) were fitted to model probes for genes with more than one annotated probe. This model reflects a conservative assumption that the probes for each gene share the same direction of effect (where untrue, the effect will be expected to be reduced or go undetected). Where available, age and BMI were included as co-variates. The case-control datasets were meta-analyzed for each tissue using a random-effects model as described by Choi et al. (51) and implemented in the R package geneMeta (52). One dataset, accession GSE25462 (53), included skeletal muscle gene expression data for normoglycemic but IR individuals with one or two parents with T2D (n = 15 and n = 10, respectively), as well as healthy individuals with no family history (n = 10). Gene expression levels were regressed against the number of parents with T2D (0, 1 or 2), in order to separately investigate potential genetic risk without confounding due to disease onset.
Gene-set significance was calculated using a non-parametric Wilcoxon rank sum test, previously shown to have the highest reproducibility and sensitivity compared to other GSEA tests (54), and gene-level sampling with 10,000 permutations. False discovery rate (FDR) was used to correct for multiple testing. GSEA was applied to genome-wide Z scores using the R package piano (55).
Since the expression of NEMGs is highly correlated, there is likely to be limited power to detect an enrichment of differential expression for the subset of T2D cis-NEMGs compared to the background of all NEMGs (tested using GSEA as described above). The case vs control expression of NEMGs in either mitoCarta2.0 or mitoCarta+ and not identified as T2D cis-genes in this study (‘non-T2D’ NEMGs) was further investigated in relation to how highly their expression correlated with the subset of identified T2D cis-NEMGs. The null hypothesis is that there is no relationship between the degree of NEMG differential expression and their strength of correlation with the mapped T2D cis-NEMGs, while significant association would demonstrate that T2D-eQTL association distinguishes between NEMG differential expression in cases. Differential expression was measured as the gene expression summary Z-scores from the adipose tissue meta-analysis. All non-T2D NEMGs were correlated with the expression of each T2D cis-NEMG to calculate pairwise Pearson correlation coefficients and the mean value estimated for the T2D cis-NEMGs as a group. For this analysis, the gene expression correlation coefficients were measured using the control-only normalized expression values from the adipose dataset GSE27949, having the largest number of controls at n = 11, with gene-level expression calculated as the average of the annotated probes. For all non-T2D NEMGs, the mean correlation value was regressed against the adipose Z-score of differential expression using linear regression. Mean gene expression was included in the regression as a covariate.
41 mitochondrial-related gene sets were identified and downloaded from the curated Molecular Signatures Database (MSigDB) (56, 57), each with >25% overlap with the combined MitoCarta2.0/MitoCarta+ databases of NEMGs (38, 39). The gene sets (listed in the Supplementary Table S6) were tested for enrichment in the total T2D cis-genes. For each gene set, the observed number of T2D cis-genes was compared to expected counts under the null. Expected counts were generated using two alternative permutation-approaches, random and structured. For the random approach, control genes (equal to the total number of identified T2D cis-genes) were randomly selected from the genomic background and for the structured approach, genes were randomly selected from within ±1.5Mb of each other to control for any potential local structure (an average of 4.6 cis-genes were observed per T2D-eQTL). Empirical p-values were based on 10,000 permutations. Gene sets which showed nominal evidence of differential expression (p-value < 0.05) were also tested for case-control differential gene expression using GSEA, as described above.
This study analyzed genomic location estimates of causal variants associated with T2D (ŜT2D) and adipose gene expression (ŜeQTL) mapped as previously described by Lau et al. (3) using LDU-based gene mapping (see Methods and Figure 1). ŜT2D estimates were mapped in two European and one African American T2D case-control cohorts and were required to replicate in at least two datasets. The list of previously mapped loci was here expanded to include nominally significant loci to facilitate pathway enrichment analysis of target genes. Crucially, ŜT2D replication was defined using a stringent co-location threshold, such that ŜT2D were independently mapped within a genetic distance of 1 LDU [according to a European-specific genetic LDU map assembled by Lau et al. (3)]. This approach aims to prioritize ŜT2D estimates which are likely to represent shared causal variants, while excluding ŜT2D which are physically close in chromosome (base pair) location but are separated by a large genetic distance and LD breakdown (and therefore capture independently inherited variants). Figure 2, which shows the genetic LDU map, illustrates how the kb (kilobase pair) distance corresponding to 1 LDU can differ depending on the genomic location, with 1 LDU extending across a larger kb distance where there is more extensive LD between pairs of genetic markers, for example due to a lack of recombination (32). Across the autosomal genome, 1 LDU corresponds to a median of 48kb per chromosome and ranges from a median of 34kb (chr22) to 57kb (chr2).
A total of 174 loci showed replicated association with T2D based on a 1 LDU threshold. To identify the likely target genes (cis-genes) regulated by these loci, adipose tissue eQTL were mapped using LDU-based gene mapping for all genes within 1.5Mb. A total of 763 genes were associated with nominally significant ŜeQTL estimates (likely location of causal variants associated with gene expression levels) within 1 LDU of 167 T2D loci, of which 59 were European-specific loci and 108 were shared with African Americans. Co-locating T2D loci and eQTL are referred to as ‘T2D-eQTL’ and associated genes as ‘T2D cis-genes’. Figure 2 illustrates an example T2D-eQTL, where an eQTL associated with the neighboring gene PCCA co-located with two independent ŜT2D. The genetic LDU vs physical kb coordinates of the region are plotted to illustrate the 1 LDU distance used to define co-location and shared T2D-eQTL signals. Since the extent of 1 LDU depends on the pairwise LD between SNPs at the genomic locus, the 1 LDU distance in Figure 2 can be seen to extend further downstream of the African American T2D location (red arrow) due to an upstream breakdown in LD at this locus.
Based on comparison with the MitoCarta2.0 (38) and MitoCarta+ (39) databases of known NEMGs, 50 of the total T2D cis-genes were defined as NEMGs, associated with 40 independent loci. These 50 T2D cis-NEMGs are listed in Table 1 with the corresponding T2D (ŜT2D) and eQTL (ŜeQTL) location estimates (b37) obtained from LDU-based gene mapping. Of these 40 loci, 20 have been independently associated with T2D in two single-SNP GWAS studies: 13 by Mahajan et al. (2018) (1) and an addition seven in the recent GWAS by Vujkovic et al. (2020) (2) (based on the replication criteria of Vujkovic et al. requiring lead SNPs to be within 500kb, here defined as the distance between lead GWAS SNPs and ŜT2D locations).
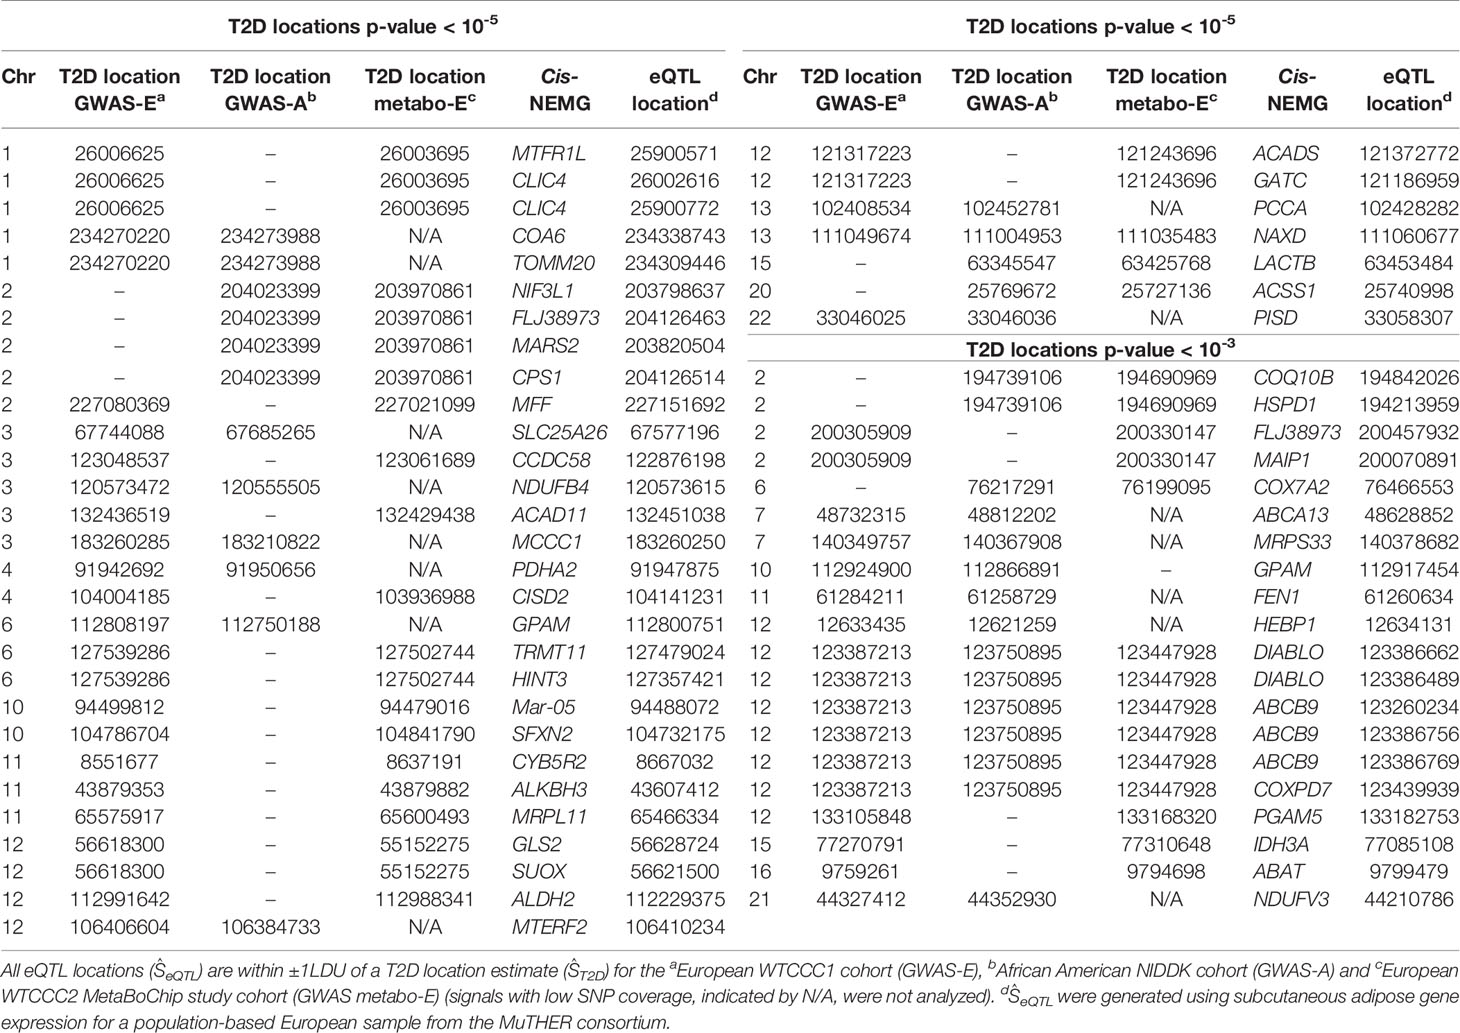
Table 1 T2D and eQTL location estimates (physical coordinate, b37) associated with 50 T2D cis-NEMGs.
The hypothesis that the reported cis-genes are regulated by genetic variants associated with T2D was further explored by comparing the levels of gene expression using independent cohorts of T2D cases and controls. A total of 12 independent gene expression datasets for T2D or insulin resistant (IR) cases and controls were retrieved from the public GEO repository after the application of strict inclusion and exclusion criteria, listed in Supplementary Table S2. Expression datasets were included for adipose, muscle, liver and pancreas, in order to explore potential effects across multiple T2D-relevant tissues. The final 12 datasets are listed in Supplementary Table S3 and extended information is provided in Supplementary Table S4. One dataset provided data for both skeletal muscle and subcutaneous adipose (accession: GSE13070). Another skeletal muscle dataset (accession: GSE25462) included gene expression data for normoglycemic individuals with zero, one or two T2D-affected parents, which provided an opportunity to assess informative changes in gene expression in individuals without overt T2D, but who may have a greater genetic susceptibility for T2D risk due to their positive family history.
The T2D cis-genes and cis-NEMGs were tested for enrichment of differential expression in T2D or IR cases using gene set enrichment analysis (GSEA) in the meta-analyzed datasets, grouped by tissue type. GSEA offers a powerful means to detect consistent patterns of differential expression within a set of related genes (23, 58). In this instance, the sets of total T2D cis-genes (n = 763) and cis-NEMGs (n = 50) were tested for differential expression using a competitive GSEA and gene-centric Z scores as summary measures of differential gene expression. Four GSEA analyses were carried out: the first two tests compared (1) the T2D cis-gene and (2) the cis-NEMG gene sets against the genomic background. The third (3) tested the T2D cis-NEMGs compared to the background of all NEMGs. The motivation for the third comparison was to test whether the 50 T2D cis-NEMGs showed additional differential expression compared to the background of all known NEMGs, which are generally down-regulated in individuals with T2D (data not shown). This comparison aimed to detect any evidence consistent with the alternative hypothesis that genetic mechanisms may dysregulate key NEMGs in T2D, compared with a null hypothesis that NEMGs may show non-specific down-regulation as a consequence of T2D onset. The fourth test (4) provided a negative control for this comparison and compared three control sets of randomly selected NEMGs (excluding the identified cis-NEMGs and therefore referred to as ‘non-T2D’ NEMGs in this study) to the NEMG background.
The results of the GSEA are shown in Table 2 for the meta-analyzed datasets (summary GSEA results for each individual datasets are provided in Supplementary Table S5). Firstly, the total 763 T2D cis-genes were significantly enriched for decreased expression in T2D and IR cases compared to controls in skeletal muscle, liver and pancreas (see Table 2A) and were enriched for both increased and decreased (mixed) differential expression in adipose. The T2D cis-genes were also enriched for decreased expression in the skeletal muscle of unaffected individuals with an increasing number of parents affected by T2D, demonstrating a detectable change in gene expression in the absence of overt disease onset. For the subset of 50 cis-NEMGs, GSEA confirmed significant down-regulation in cases in three out of the four tissues (Table 2B), as well as the in the skeletal muscle of normoglycemic individuals with affected parents. Liver was not significant, however this tissue notably had the smallest combined sample size with only 20 cases.
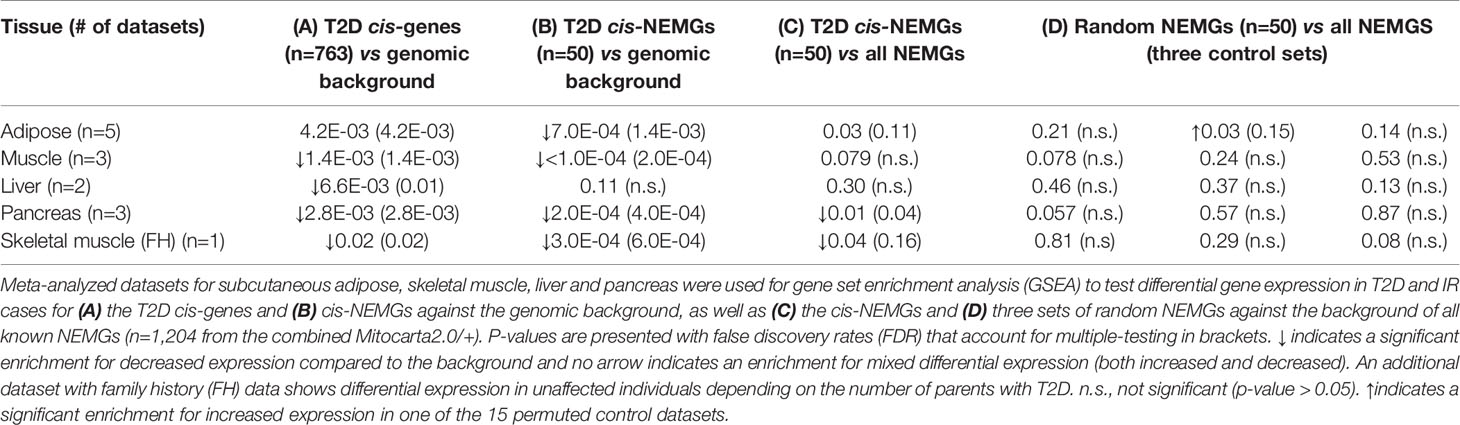
Table 2 Cis-gene expression in Type 2 diabetes (T2D) and insulin resistant (IR) cases vs controls.
If mitochondrial dysfunction were exclusively a consequence of T2D onset, then the a priori expectation would be for NEMGs to show generalized differential expression for individuals with T2D or IR, regardless of inferred cis-NEMG association with T2D genetic risk loci or not. Indeed, the set of total NEMGs in Mitocarta2.0/+ were generally downregulated across all datasets (data not shown). Here however, we demonstrate that this effect is not just a general feature of T2D, but can also be stratified by disease status for cis-NEMGs that are associated with T2D-eQTL and NEMGs that are not. GSEA provided evidence that the 50 T2D cis-NEMGs were enriched for differential expression compared to the background of all NEMGs (n = 1,204) (see Table 2C) for the meta-analyzed adipose (p-value = 0.03) and pancreas tissues (p-value = 0.01), as well as in skeletal muscle for normoglycemic individuals with an increasing number of parents affected with T2D (p-value = 0.04). Only pancreatic tissue was significant after correction by FDR (FDR = 0.04), although the GSEA power is likely to be limited by the high correlation structure between NEMG expression. Three negative control sets of 50 random NEMGs showed no significant differences in expression compared to the NEMG background, excluding one nominal result from the total 15 tests (see Table 2D). This result was also observed in the normoglycemic offspring of individuals with affected parents, demonstrating changes in this subset of NEMGs compared to other NEMGs even in the absence of overt disease.
An additional analysis was carried out to further investigate NEMG expression in T2D and IR. The differential expression levels of all NEMGs (summary Z scores) excluding the 50 T2D cis-genes (n = 1,155, referred to as ‘non-T2D’ NEMGs) were assessed for correlation with the 50 T2D cis-NEMGs in normoglycemic (control) individuals (n=11, GSE27949). Using linear regression including average gene expression levels as a covariate, a significant negative relationship was observed between the Z score (case vs control differential expression) in adipose tissue of these 1,155 non-T2D NEMGs and their mean pairwise correlation with the 50 T2D cis-NEMGs (p-value = 2.5E-08). Figure 3 illustrates the decrease in gene expression in T2D cases for NEMGs which correlated more highly with the 50 T2D cis-NEMGs. This analysis effectively differentiates changes in NEMG expression based on the expression levels of the subset of 50 T2D cis-NEMGs identified by ŜT2D-ŜeQTL co-location. Following the identification of these candidate genes, it will be of future interest to investigate the consequences of their altered expression and the potential for driving the wider changes observed in highly correlated NEMGs.
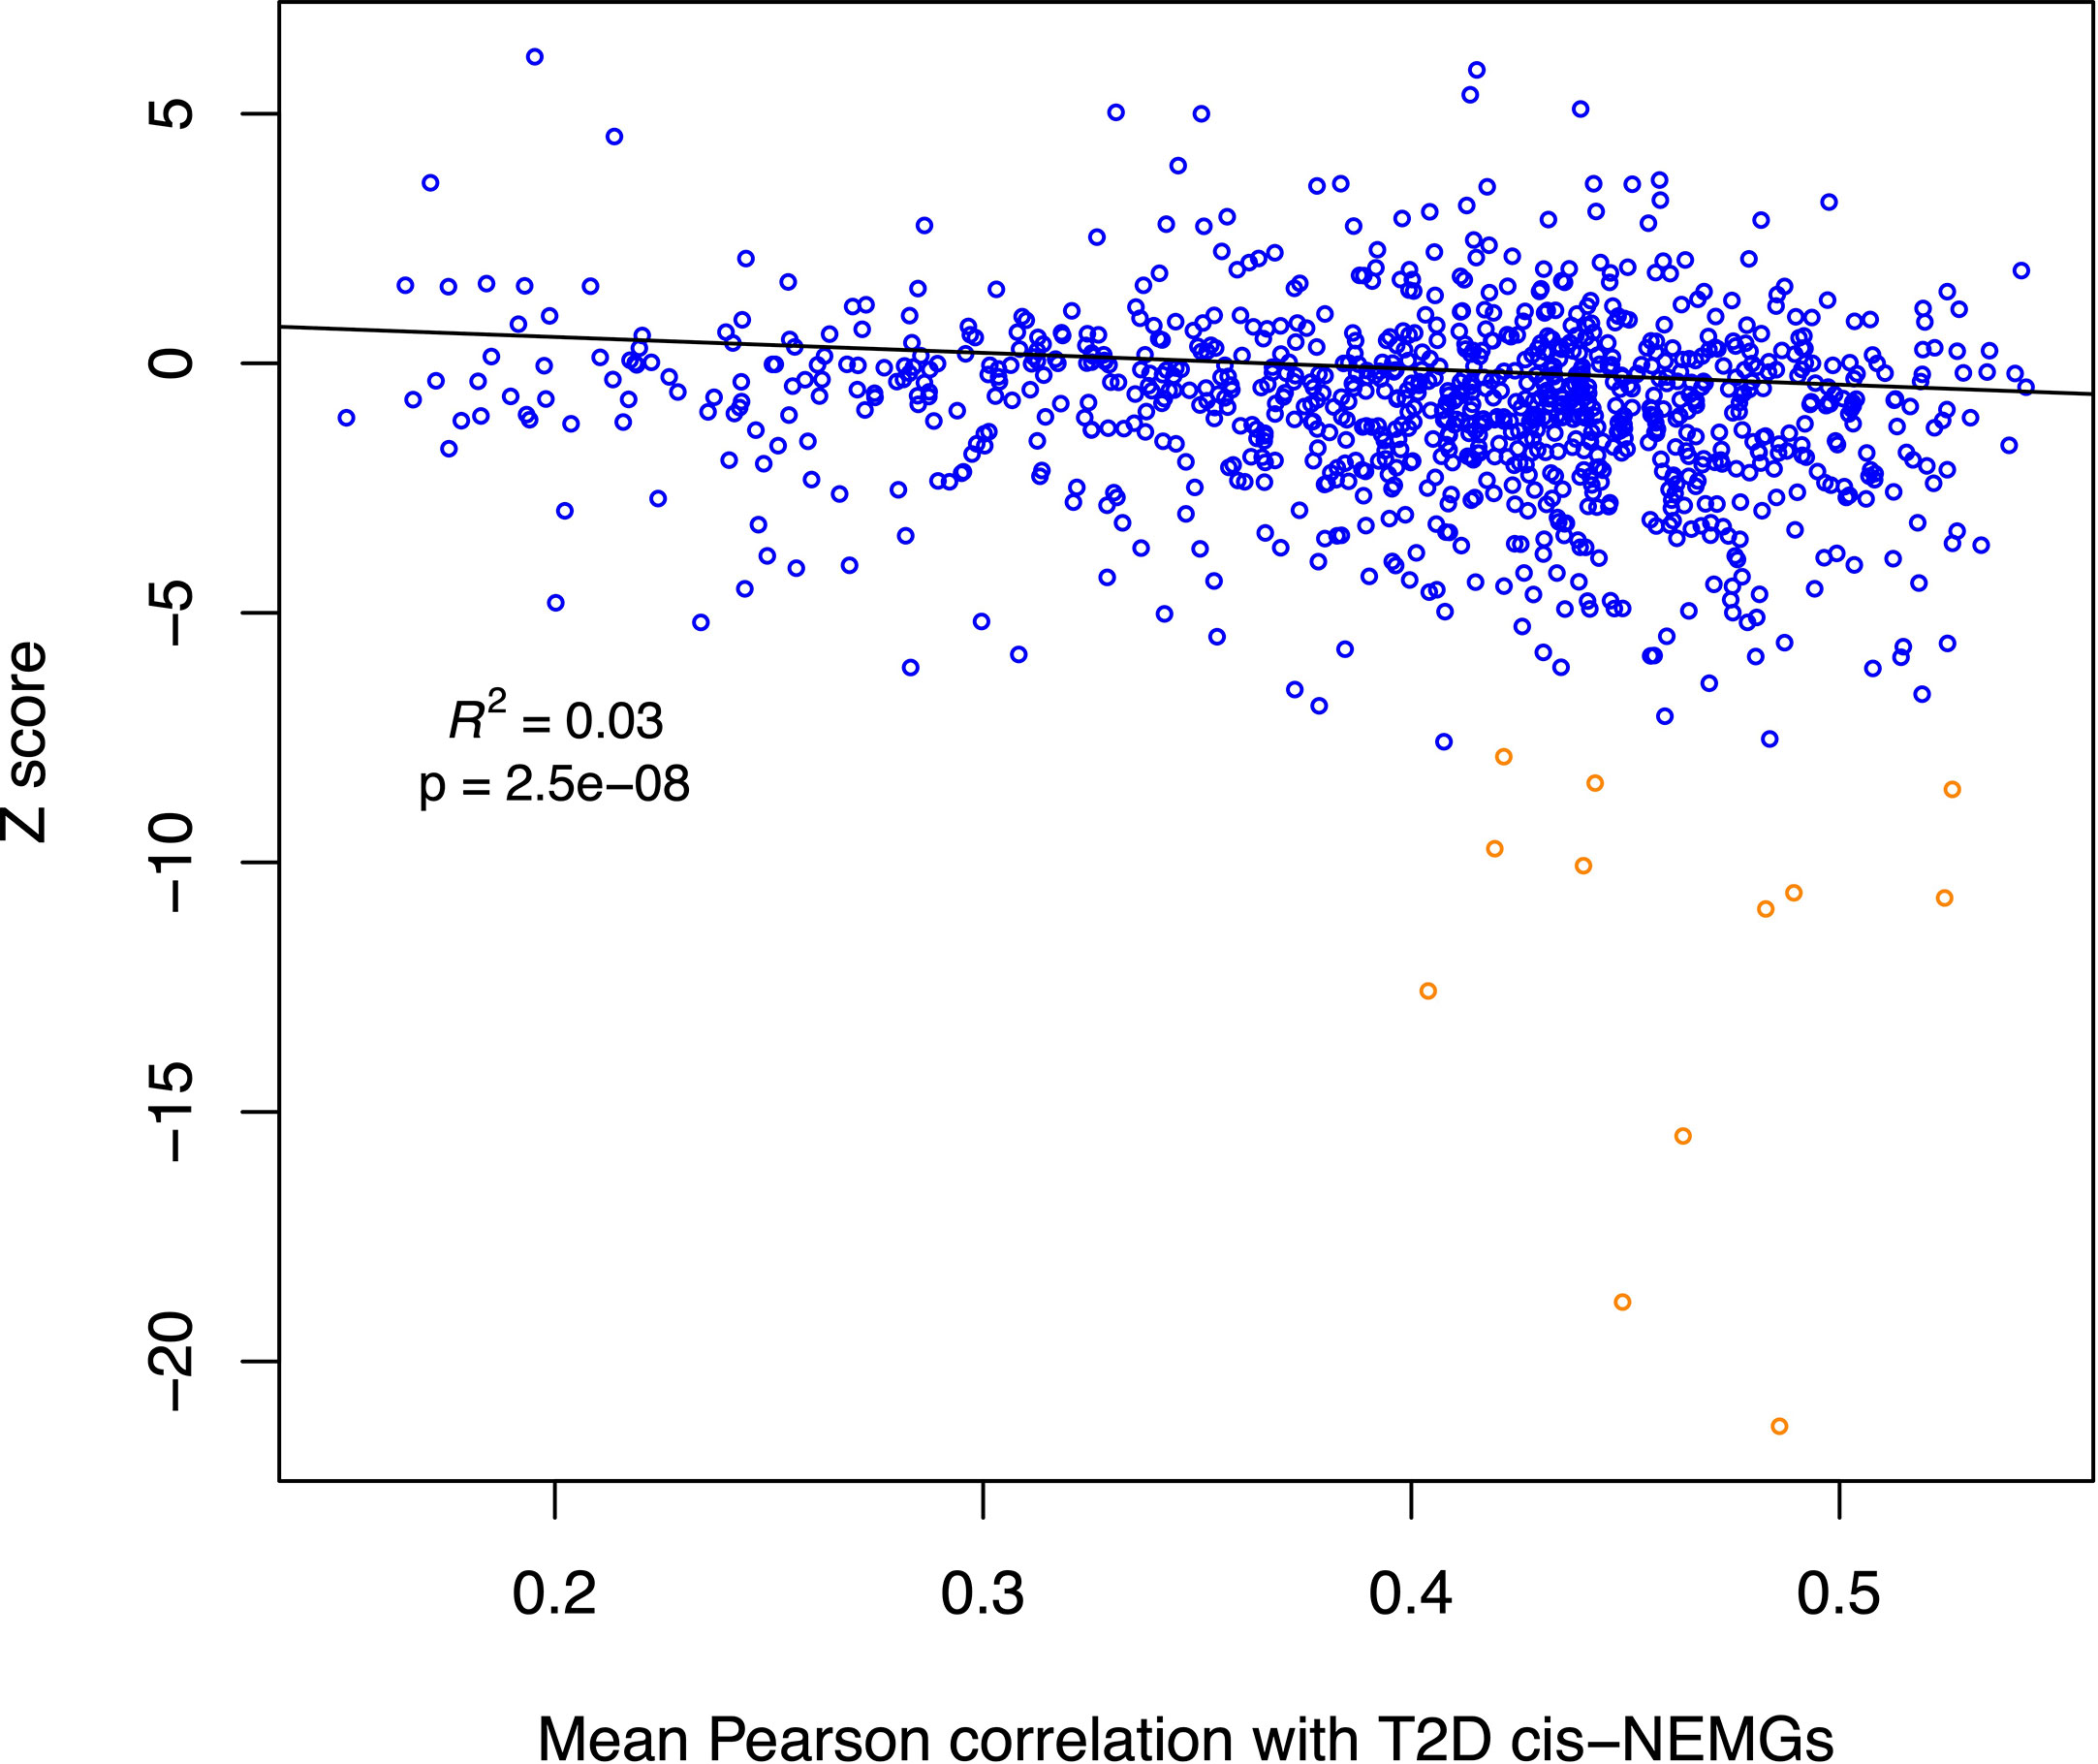
Figure 3 Scatterplot for non-T2D NEMG subcutaneous adipose differential expression by degree of correlation with T2D cis-NEMGs. The summary statistic of meta-analyzed adipose differential expression in T2D and IR cases (Z-score) for each non-T2D NEMG (n = 1,155) is plotted against its mean Pearson pairwise correlation coefficient for the T2D cis-NEMGs (n = 50), with the latter based on baseline expression levels in control individuals. NEMGs in general show reduced gene expression in cases compared to controls if they are more highly correlated with the 50 T2D cis-NEMGs (regression p-value = 2.5E-08, adjusted for absolute gene expression levels). The fitted line for the regression excludes 12 outlying data points (dark orange in the scatterplot) identified using the iterative robust regression procedure rreg implemented in Stata.
Figure 4 presents the 50 T2D cis-NEMGs grouped by common biological functions and pathways, with a full summary list provided in Supplementary Table S1 (Supplementary Table S1 also cites evidence from the literature for a subset of these 50 NEMGs which have been previously linked to diabetes). These groups descriptively suggest biological pathways involved in T2D etiology, the largest of which include lipid and amino acid metabolism and suggest a heritable susceptibility to dysregulated mitochondrial metabolism in T2D adipose tissue. Of particular interest are cis-NEMGs which catalyze nearby steps on the same pathway, most notably branched chain amino acid (BCAA) catabolism with five cis-NEMGs: PCCA, MCCC1, ABAT, ACADS and ALDH2 (Supplementary Figure S3). GSEA indicated that T2D/IR cases had decreased expression of genes involved in BCAA catabolism, supporting mounting evidence for a role of this pathway in T2D risk. While NEMGs were not generally enriched in the total count of T2D cis-genes compared to the genomic background - comprising 6.6% of the total compared to 5.4% of the genomic background (estimated using the total 21,215 genes annotated to the genomic IlluminaHT-12 v.3 BeadChip used for eQTL mapping) (Fisher-exact p-value = 0.20) - several mitochondrial pathways were enriched. Of 41 pre-defined gene sets relating to mitochondrial pathways, obtained from the curated Molecular Signatures Database (MSigDB) (56, 57), four gene sets showed nominal evidence of enrichment; these are shown in Table 3 and include valine, leucine and isoleucine (branched chain amino acid, BCAA) catabolism, biotin-dependent carboxylases, propanoate and butanoate metabolism. The gene sets have significant overlap, with the two biotin-dependent carboxylases (PCCA and MCCC1) present in the BCAA gene set and PCCA also contributing to propanoate metabolism. Cis-genes in the BCAA catabolism gene set also overlapped with propanoate metabolism (ABAT, ACSS1, PCCA and ALDH2) and butanoate metabolism (ABAT, ACADS, PDHA2 and ALDH2).
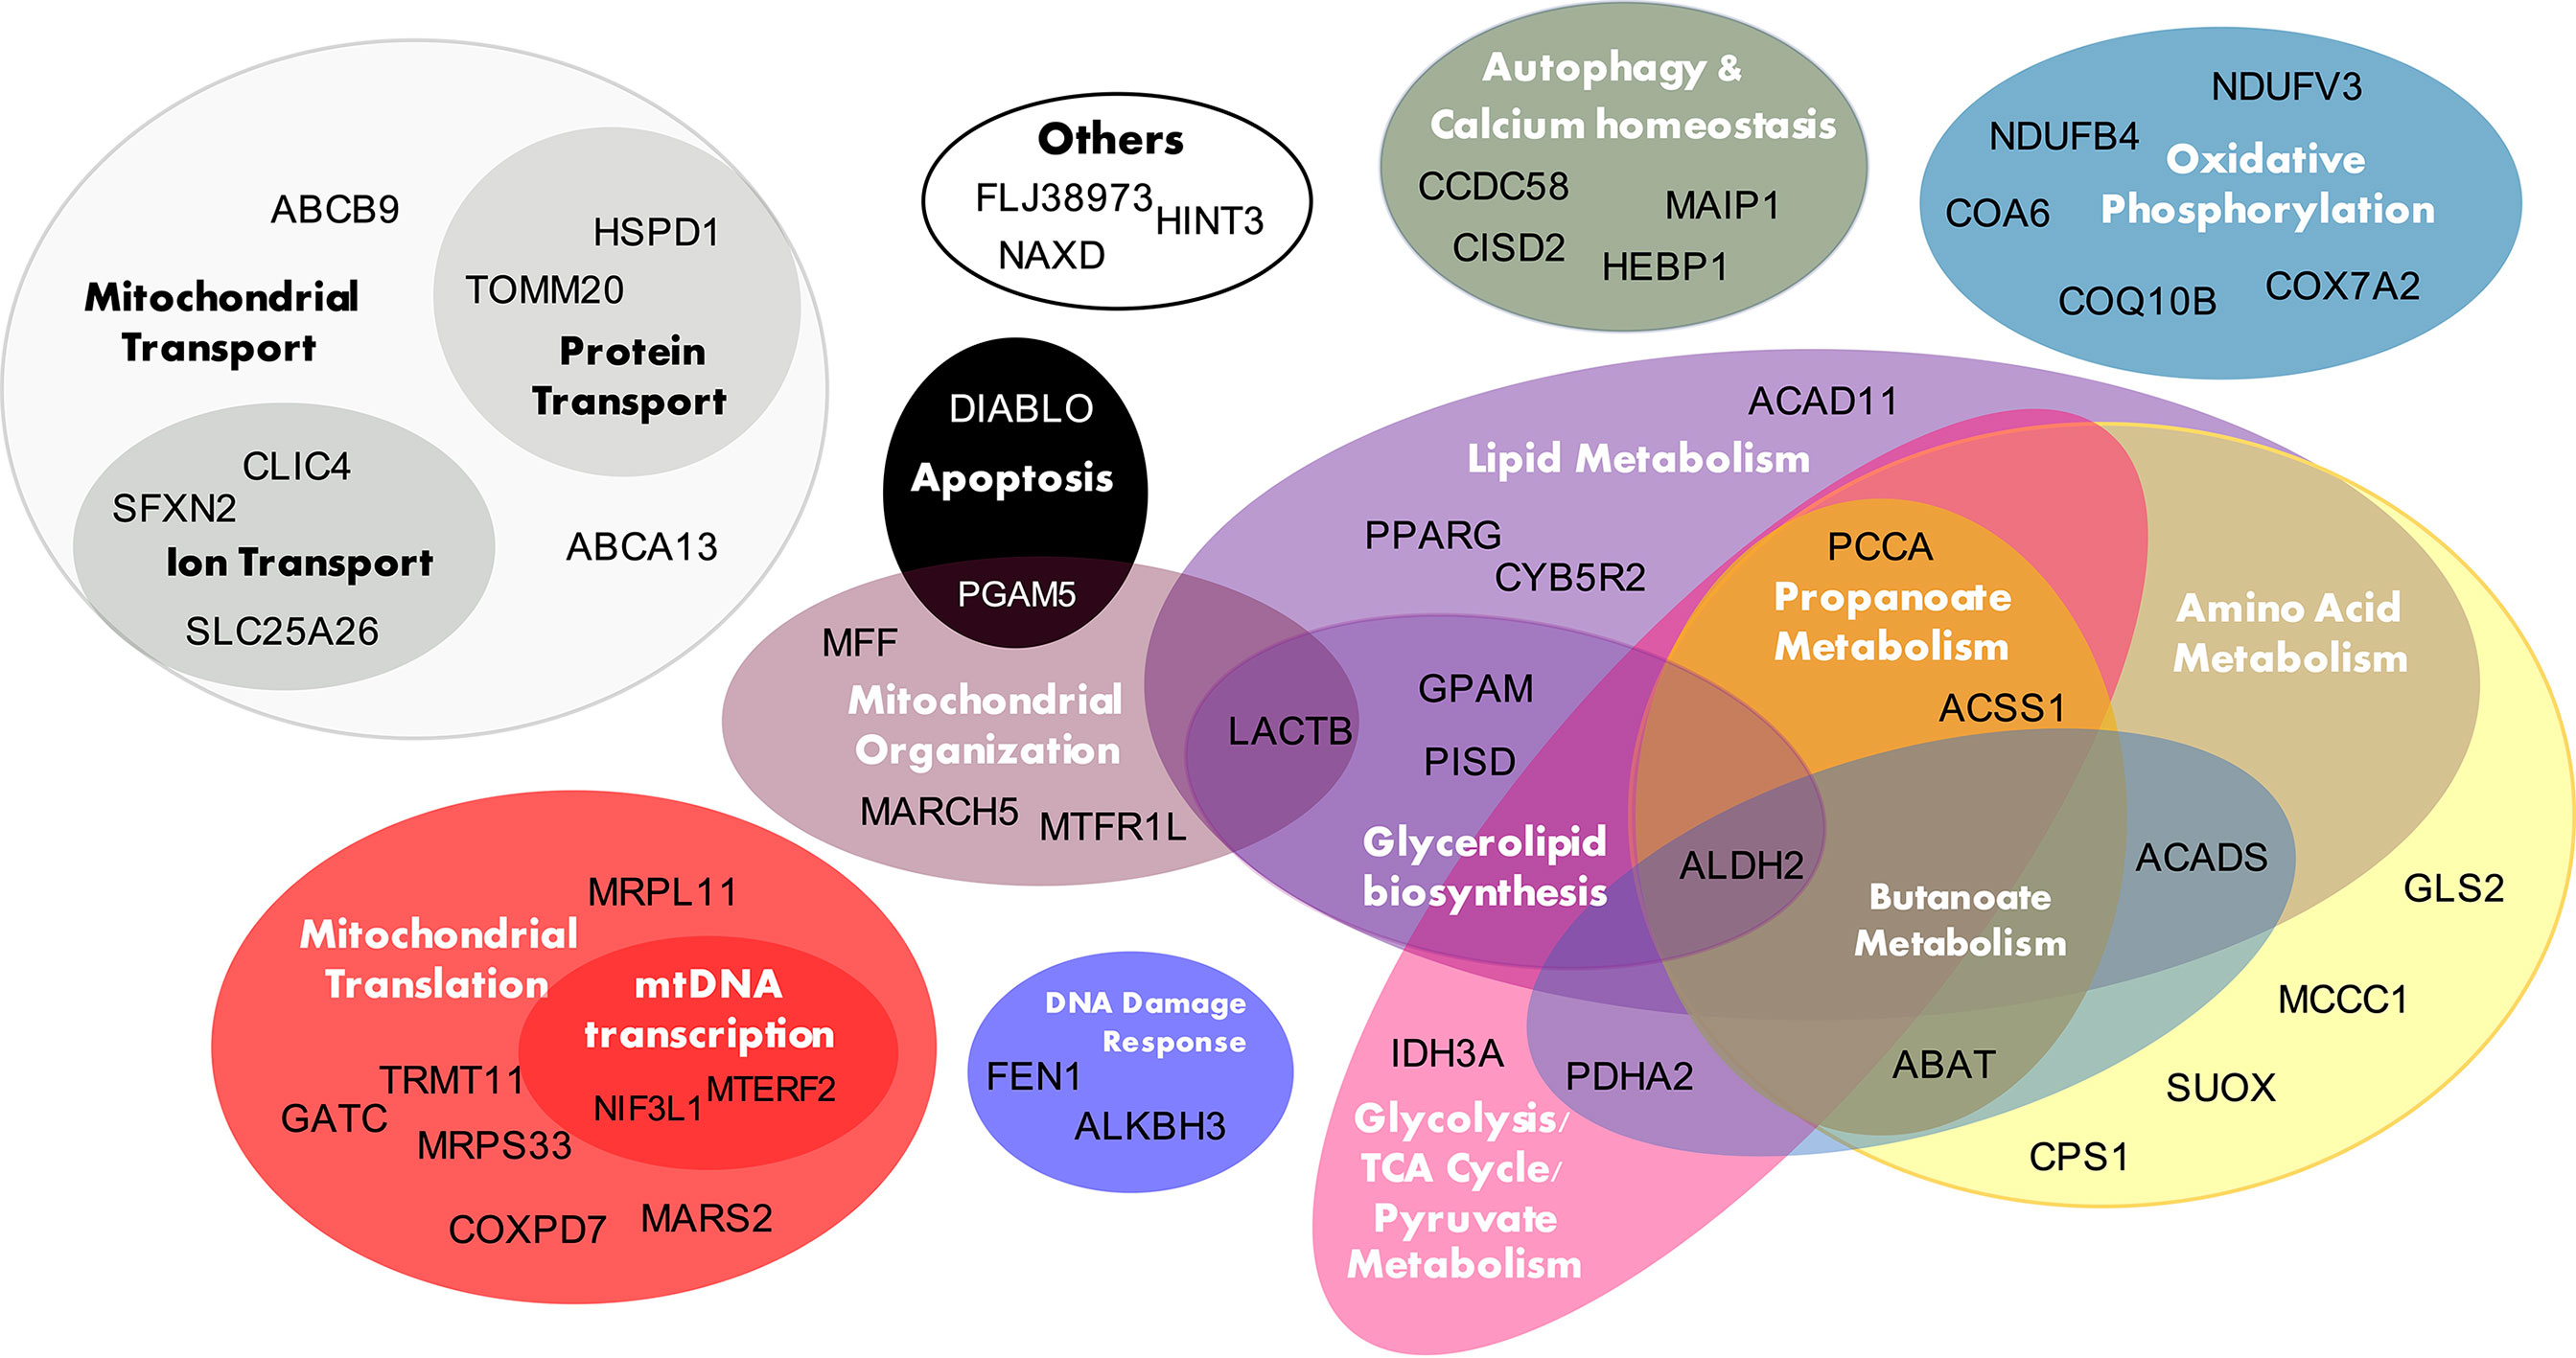
Figure 4 T2D cis-NEMG biological function. The 50 T2D cis-regulated nuclear encoded mitochondrial genes (cis-NEMGs) are grouped by common biological pathways (see Supplementary Table S1 for extended information).
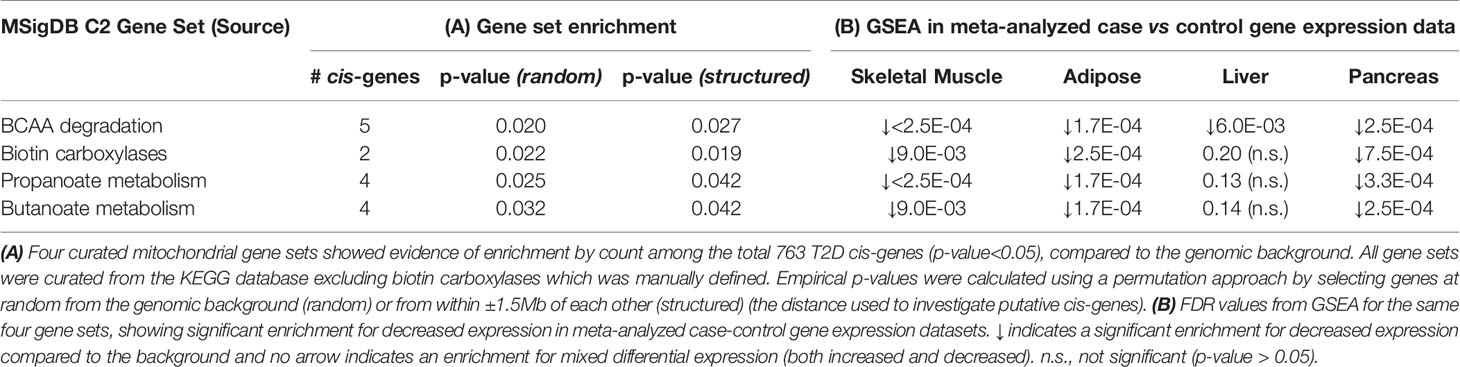
Table 3 Four mitochondrial pathways enriched in the total T2D cis-genes.
The four mitochondrial gene sets showing evidence of enrichment in the total T2D cis-genes were also tested for differential expression. In the case-control gene expression meta-analysis, BCAA metabolism was enriched for decreased expression in 4 out of 4 tissues; propanoate metabolism in 3 out of 4 tissues (muscle, pancreas, and adipose); biotin-dependent carboxylases in 3 out of 4 tissues (muscle, adipose and pancreas); and butanoate metabolism in 3 out of 4 tissues (muscle, adipose and pancreas) (FDR <0.05) (Table 3B). BCAA catabolism, propanoate and butanoate metabolism were also significantly downregulated in the skeletal muscle of normoglycemic individuals with affected parents.
The T2D cis-NEMGs include both novel genes, which have not been previously reported in the literature in relation to T2D, as well as genes with published links to diabetes. Approximately half of the cis-NEMGs have previously been linked to diabetes or IR and Supplementary Table S1 cites functional evidence from the literature. We here provide the likely locations of T2D risk variants which may regulate the expression of these genes. Examples include CISD2, a causal gene for Wolfram syndrome which manifests with early-onset diabetes (59, 60) and ABAT, which encodes Gamma-aminobutyric acid transaminase (GABA-T). GABA-T knockdown improves insulin sensitivity in obese mice, causing weight loss and decreased food intake (61). As another example, the T2D cis-gene GPAM encodes glycerol-3-phosphate acyltransferase and its overexpression has been shown to induce IR (62–64). At a pathway level, the cis-NEMGs implicate T2D-related molecular pathways including BCAA catabolism (cis-genes: PCCA, MCCC1, ACADS, ABAT and ALDH2). BCAA levels demonstrate striking power as predictive biomarkers of T2D (65, 66) and BCAA catabolism is intricately entwined with metabolic homeostasis (67), insulin secretion, adipocyte differentiation (68, 69), energy homeostasis (70), inflammation (71, 72) and appetite (73). Similarly, there is a diverse literature linking fatty acid β-oxidation (cis-genes: ACAD11, ACADS) to T2D, including proposed mechanisms through which decreased oxidation of fatty acids and accumulation of intermediates may cause insulin resistance and T2D [reviewed in (74)]. Prolonged inhibition of β-oxidation in mice was recently shown to reduce insulin sensitivity and increase hepatic glucose production (75). In addition to metabolic pathways, the T2D cis-NEMGs may also implicate general mitochondrial function in T2D genetic risk, including mitochondrial transcription and translation (MRPL11, MRPS33, TRMT11, COXPD7, GATC, MARS2); fission (MARCH5, MFF, MTFR1L); organization and dynamics (LACTB, PGAM5); transport (SLC25A26, CLIC4, SFXN2, TOMM20, HSPD1, ABCA13, ABCB9) and the electron transport chain (COQ10B, NDUFB4, COX7A2, NDUFV3 and COA6).
This study investigated evidence of genetic mechanisms which may contribute to mitochondrial dysfunction in T2D. LDU-based gene mapping provided evidence of 50 NEMGs which may be cis-genes regulated by genetic variants associated with an increased risk of T2D. This approach yielded three novel outcomes. Firstly, ŜT2D-ŜeQTL co-location within 1 LDU identified disease-relevant cis-genes which showed independent evidence of differential expression in individuals with T2D, IR and a positive family history of T2D, compared to controls (see Table 2); this result supports the use of eQTL mapping in identifying the likely target genes of T2D loci. Secondly, ŜT2D-ŜeQTL co-location identified 50 cis-NEMGs which showed differential expression in cases to a greater extent than other NEMGs, with NEMGs not identified as T2D cis-genes in turn also showing reduced expression if their expression correlated more highly with the subset of 50 cis-NEMGs. This differentiation of general NEMG expression raises the possibility that genotype-dependent changes in key NEMGs may drive wider perturbations in mitochondrial function and is worthy of further investigation. These results suggest that mitochondrial dysfunction may not exclusively be a consequence of T2D and instead may also support the role of heritable genetic variation in contributing to mitochondrial dysfunction prior to disease onset. Thirdly, four mitochondrial gene sets were enriched for T2D cis-genes: BCAA catabolism, biotin-dependent carboxylases, propanoate and butanoate metabolism. Overall, these three outcomes support our conclusion that genetic mechanisms may contribute to mitochondrial dysfunction in T2D.
One subsidiary aim of this study was to provide additional validation that LDU-based gene mapping can successfully map disease-eQTL and functional cis-genes. Independent evidence was used to demonstrate that the mapped cis-genes were differentially expressed in individuals with T2D and IR. This is in line with recent in vivo evidence that a novel T2D cis-gene previously mapped using the same method (76), ABCC5, was functionally implicated in diabetes by improving insulin sensitivity and reducing fat mass when knocked-out in mice (76, 77). Association mapping using genetic LDU maps, as described by Maniatis et al. (4), offers significant power to identify disease-eQTL and associated cis-genes, by testing for evidence of association based on the decline of trait-association for genotyped variants in decreasing LD with a causal variant (see Figure 1). This mapping method can be applied to other complex diseases, including T2D subgroups which show distinct genetic associations (78–80).
A key assumption of this study is that co-locating ŜT2D-ŜeQTL capture shared causal variants. This is generally supported by the observed differential expression of the associated cis-genes in individuals with T2D or IR, but may also be addressed locus-by-locus. Functional studies will be necessary to confirm the causal cis-gene(s), since it is possible that neighboring genes may be co-regulated with a causal gene despite it not directly contributing to the T2D phenotype. Future LDU-based mapping of eQTL for other tissues will also offer wider insights into the role of NEMG regulation in T2D. Nevertheless, the current study provides important evidence regarding the role of adipose tissue mitochondrial function in inherited risk of T2D. These results implicate adipose tissue mitochondrial metabolism in T2D risk, particularly BCAA catabolism, biotin carboxylases, propanoate and butanoate metabolism (Table 3A), although additional pathways may be revealed by expanding the search to proteins such as nuclear transcription factors which do not localize to the mitochondrial proteome. Examples include PPARG and SPATA18, both of which were identified as T2D cis-genes but not NEMGs and play important roles in regulating mitochondrial function and quality, respectively.
Finally, these results may be of clinical interest, since many T2D drugs affect mitochondrial function (5) and NEMG regulation may impact treatment efficacy. For example, MCCC1 and PCCA make up two of the five human biotin-dependent carboxylases. The efficacy of biotin, which may improve insulin sensitivity (81, 82), may be influenced by the dysregulation of these genes. The expression of GABA-transaminase (ABAT) may also influence the proposed therapeutic benefits of GABA treatment, which is currently undergoing clinical investigation. In conclusion, this study identified 50 NEMGs which may be effector genes of genotype-driven mitochondrial dysfunction in T2D and highlights key genes and pathways which may contribute to insulin resistance in adipose tissue. The methods described in this paper can be used to systematically interpret cis-gene functions to implicate novel biological pathways in the etiology of T2D and other complex traits.
The original contributions presented in the study are included in the article/Supplementary Material. Further inquiries can be directed to the corresponding author.
All analyses use publicly available data. The patients/participants provided their written informed consent as part of each study data sample collection.
TA conceptualized the study with contribution from NM. NM, WL, and TA carried out initial data analysis and provided the data used in this study. HM drafted the MS and implemented the analyses and methods described. All authors contributed to the article and approved the submitted version.
HM and TA would like to acknowledge the Medical Research Council, United Kingdom, for financially supporting this work (MRC DTP PhD Studentship and Investigator Award 91993, respectively). WL and NM would like to acknowledge the Wellcome Trust, United Kingdom, for financial support (Seed Award 209106/Z/17/Z).
The authors declare that the research was conducted in the absence of any commercial or financial relationships that could be construed as a potential conflict of interest.
All claims expressed in this article are solely those of the authors and do not necessarily represent those of their affiliated organizations, or those of the publisher, the editors and the reviewers. Any product that may be evaluated in this article, or claim that may be made by its manufacturer, is not guaranteed or endorsed by the publisher.
The authors would like to thank the WTCCC (UK), the NIDDK (US) and the MuTHER (UK) Consortia for making their data available. TA would like to thank Dr Will Astle for his expert statistical advice (any mistakes our own).
The Supplementary Material for this article can be found online at: https://www.frontiersin.org/articles/10.3389/fendo.2021.694893/full#supplementary-material
1. Mahajan A, Taliun D, Thurner M, Robertson NR, Torres JM, Rayner NW, et al. Fine-Mapping Type 2 Diabetes Loci to Single-Variant Resolution Using High-Density Imputation and Islet-Specific Epigenome Maps. Nat Genet (2018) 50(11):1505–13. doi: 10.1038/s41588-018-0241-6
2. Vujkovic M, Keaton JM, Lynch JA, Miller DR, Zhou J, Tcheandjieu C, et al. Discovery of 318 New Risk Loci for Type 2 Diabetes and Related Vascular Outcomes Among 1.4 Million Participants in a Multi-Ancestry Meta-Analysis. Nat Genet (2020) 52(7):680–91. doi: 10.1101/19012690
3. Lau W, Andrew T, Maniatis N. High-Resolution Genetic Maps Identify Multiple Type 2 Diabetes Loci at Regulatory Hotspots in African Americans and Europeans. Am J Hum Genet (2017) 100(5):803–16. doi: 10.1016/j.ajhg.2017.04.007
4. Maniatis N, Collins A, Gibson J, Zhang W, Tapper W, Morton NE. Positional Cloning by Linkage Disequilibrium. Am J Hum Genet (2004) 74(5):846–55. doi: 10.1086/383589
5. Yaribeygi H, Atkin SL, Sahebkar A. Mitochondrial Dysfunction in Diabetes and the Regulatory Roles of Antidiabetic Agents on the Mitochondrial Function. J Cell Physiol (2019) 234(6):8402–10. doi: 10.1002/jcp.27754
6. Gonzalez-Franquesa A, Patti M-E. Insulin Resistance and Mitochondrial Dysfunction, Mitochondrial Dynamics in Cardiovascular Medicine, Springer. Adv Exp Med Biol (2017). p. 465–520.
7. Montgomery MK, Turner N. Mitochondrial Dysfunction and Insulin Resistance: An Update. Endocrine Connections (2015) 4(1):R1–R15. doi: 10.1530/EC-14-0092
8. Sergi D, Naumovski N, Heilbronn LK, Abeywardena M, O'Callaghan N, Lionetti L, et al. Mitochondrial (Dys) Function and Insulin Resistance: From Pathophysiological Molecular Mechanisms to the Impact of Diet. Front Physiol (2019) 10:532. doi: 10.3389/fphys.2019.00532
9. Wada J, Nakatsuka A. Mitochondrial Dynamics and Mitochondrial Dysfunction in Diabetes. Acta Med Okayama (2016) 70(3):151–8. doi: 10.18926/AMO/54413
10. Zabielski P, Lanza IR, Gopala S, Heppelmann CJH, Bergen HR, Dasari S, et al. Altered Skeletal Muscle Mitochondrial Proteome as the Basis of Disruption of Mitochondrial Function in Diabetic Mice. Diabetes (2016) 65(3):561–73. doi: 10.2337/db15-0823
11. Franko A, von Kleist-Retzow J-C, Böse M, Sanchez-Lasheras C, Brodesser S, Krut O, et al. Complete Failure of Insulin-Transmitted Signaling, But Not Obesity-Induced Insulin Resistance, Impairs Respiratory Chain Function in Muscle. J Mol Med (2012) 90(10):1145–60. doi: 10.1007/s00109-012-0887-y
12. Henstridge DC, Bruce CR, Drew BG, Tory K, Kolonics A, Estevez E, et al. Activating HSP72 in Rodent Skeletal Muscle Increases Mitochondrial Number and Oxidative Capacity and Decreases Insulin Resistance. Diabetes (2014) 63(6):1881–94. doi: 10.2337/db13-0967
13. Lim JH, Lee JI, Suh YH, Kim W, Song JH, Jung MH. Mitochondrial Dysfunction Induces Aberrant Insulin Signalling and Glucose Utilisation in Murine C2C12 Myotube Cells. Diabetologia (2006) 49(8):1924–36. doi: 10.1007/s00125-006-0278-4
14. Morrow RM, Picard M, Derbeneva O, Leipzig J, McManus MJ, Gouspillou G, et al. Mitochondrial Energy Deficiency Leads to Hyperproliferation of Skeletal Muscle Mitochondria and Enhanced Insulin Sensitivity. Proc Natl Acad Sci USA (2017) 114(10):2705–10. doi: 10.1073/pnas.1700997114
15. Wright LE, Brandon AE, Hoy AJ, Forsberg GB, Lelliott CJ, Reznick J, et al. Amelioration of Lipid-Induced Insulin Resistance in Rat Skeletal Muscle by Overexpression of Pgc-1beta Involves Reductions in Long-Chain acyl-CoA Levels and Oxidative Stress. Diabetologia (2011) 54(6):1417–26. doi: 10.1007/s00125-011-2068-x
16. Ballinger SW, Shoffner JM, Hedaya EV, Trounce I, Polak MA, Koontz DA, et al. Maternally Transmitted Diabetes and Deafness Associated With a 10.4 Kb Mitochondrial DNA Deletion. Nat Genet (1992) 1(1):11–5. doi: 10.1038/ng0492-11
17. Kadowaki T, Kadowaki H, Mori Y, Tobe K, Sakuta R, Suzuki Y, et al. A Subtype of Diabetes Mellitus Associated With a Mutation of Mitochondrial DNA. N Engl J Med (1994) 330(14):962–8. doi: 10.1056/NEJM199404073301403
18. Maassen JA, LM TH, Van Essen E, Heine RJ, Nijpels G, Jahangir Tafrechi RS, et al. Mitochondrial Diabetes: Molecular Mechanisms and Clinical Presentation. Diabetes (2004) 53 Suppl 1:S103–109. doi: 10.2337/diabetes.53.2007.s103
19. van den Ouweland JM, Lemkes HH, Ruitenbeek W, Sandkuijl LA, de Vijlder MF, Struyvenberg PA, et al. Mutation in Mitochondrial tRNA(Leu)(UUR) Gene in a Large Pedigree With Maternally Transmitted Type II Diabetes Mellitus and Deafness. Nat Genet (1992) 1(5):368–71. doi: 10.1038/ng0892-368
20. Petersen KF, Dufour S, Befroy D, Garcia R, Shulman GI. Impaired Mitochondrial Activity in the Insulin-Resistant Offspring of Patients With Type 2 Diabetes. N Engl J Med (2004) 350(7):664–71. doi: 10.1056/NEJMoa031314
21. Befroy DE, Petersen KF, Dufour S, Mason GF, de Graaf RA, Rothman DL, et al. Impaired Mitochondrial Substrate Oxidation in Muscle of Insulin-Resistant Offspring of Type 2 Diabetic Patients. Diabetes (2007) 56(5):1376–81. doi: 10.2337/db06-0783
22. Morino K, Petersen KF, Dufour S, Befroy D, Frattini J, Shatzkes N, et al. Reduced Mitochondrial Density and Increased IRS-1 Serine Phosphorylation in Muscle of Insulin-Resistant Offspring of Type 2 Diabetic Parents. J Clin Invest (2005) 115(12):3587–93. doi: 10.1172/JCI25151
23. Mootha VK, Lindgren CM, Eriksson KF, Subramanian A, Sihag S, Lehar J, et al. Pgc-1α-Responsive Genes Involved in Oxidative Phosphorylation Are Coordinately Downregulated in Human Diabetes. Nat Genet (2003) 34(3):267–73. doi: 10.1038/ng1180
24. Kacerovsky-Bielesz G, Chmelik M, Ling C, Pokan R, Szendroedi J, Farukuoye M, et al. Short-Term Exercise Training Does Not Stimulate Skeletal Muscle ATP Synthesis in Relatives of Humans With Type 2 Diabetes. Diabetes (2009) 58(6):1333–41. doi: 10.2337/db08-1240
25. Genders AJ, Holloway GP, Bishop DJ. Are Alterations in Skeletal Muscle Mitochondria a Cause or Consequence of Insulin Resistance? Int J Mol Sci (2020) 21:6948. doi: 10.3390/ijms21186948
26. Woo CY, Jang JE, Lee SE, Koh EH, Lee KU. Mitochondrial Dysfunction in Adipocytes as a Primary Cause of Adipose Tissue Inflammation. Diabetes Metab J (2019) 43(3):247–56. doi: 10.4093/dmj.2018.0221
27. Boudina S, Graham TE. Mitochondrial Function/Dysfunction in White Adipose Tissue. Exp Physiol (2014) 99(9):1168–78. doi: 10.1113/expphysiol.2014.081414
28. Lee JH, Park A, Oh KJ, Lee SC, Kim WK, Bae KH. The Role of Adipose Tissue Mitochondria: Regulation of Mitochondrial Function for the Treatment of Metabolic Diseases. Int J Mol Sci (2019) 20:4924. doi: 10.3390/ijms20194924
29. Sajuthi SP, Sharma NK, Chou JW, Palmer ND, McWilliams DR, Beal J, et al. Mapping Adipose and Muscle Tissue Expression Quantitative Trait Loci in African Americans to Identify Genes for Type 2 Diabetes and Obesity. Hum Genet (2016) 135(8):869–80. doi: 10.1007/s00439-016-1680-8
30. Fuchsberger C, Flannick J, Teslovich TM, Mahajan A, Agarwala V, Gaulton KJ, et al. The Genetic Architecture of Type 2 Diabetes. Nature (2016) 536(7614):41–7. doi: 10.1038/nature18642
31. Nicolae DL, Gamazon E, Zhang W, Duan S, Dolan ME, Cox NJ. Trait-Associated SNPs are More Likely to be eQTLs: Annotation to Enhance Discovery From GWAS. PLoS Genet (2010) 6(4):e1000888. doi: 10.1371/journal.pgen.1000888
32. Maniatis N, Collins A, Xu CF, McCarthy LC, Hewett DR, Tapper W, et al. The First Linkage Disequilibrium (LD) Maps: Delineation of Hot and Cold Blocks by Diplotype Analysis. Proc Natl Acad Sci U S A (2002) 99(4):2228–33. doi: 10.1073/pnas.042680999
33. Voight BF, Kang HM, Ding J, Palmer CD, Sidore C, Chines PS, et al. The Metabochip, a Custom Genotyping Array for Genetic Studies of Metabolic, Cardiovascular, and Anthropometric Traits. PLoS Genet (2012) 8(8):e1002793. doi: 10.1371/journal.pgen.1002793
34. Wellcome Trust Case Control C. Genome-Wide Association Study of 14,000 Cases of Seven Common Diseases and 3,000 Shared Controls. Nature (2007) 447(7145):661–78. doi: 10.1038/nature05911
35. Palmer GH, Brown WC, Noh SM, Brayton KA. Genome-Wide Screening and Identification of Antigens for Rickettsial Vaccine Development. FEMS Immunol Med Microbiol (2012) 64(1):115–9. doi: 10.1111/j.1574-695X.2011.00878.x
36. Grundberg E, Small KS, Hedman AK, Nica AC, Buil A, Keildson S, et al. Mapping Cis- and Trans-Regulatory Effects Across Multiple Tissues in Twins. Nat Genet (2012) 44(10):1084–9. doi: 10.1038/ng.2394
37. Durinck S, Moreau Y, Kasprzyk A, Davis S, De Moor B, Brazma A, et al. BioMart and Bioconductor: A Powerful Link Between Biological Databases and Microarray Data Analysis. Bioinformatics (2005) 21(16):3439–40. doi: 10.1093/bioinformatics/bti525
38. Calvo SE, Clauser KR, Mootha VK. MitoCarta2.0: An Updated Inventory of Mammalian Mitochondrial Proteins. Nucleic Acids Res (2016) 44(D1):D1251–1257. doi: 10.1093/nar/gkv1003
39. Floyd BJ, Wilkerson EM, Veling MT, Minogue CE, Xia C, Beebe ET, et al. Mitochondrial Protein Interaction Mapping Identifies Regulators of Respiratory Chain Function. Mol Cell (2016) 63(4):621–32. doi: 10.1016/j.molcel.2016.06.033
40. Kanehisa M, Sato Y, Kawashima M, Furumichi M, Tanabe M. KEGG as a Reference Resource for Gene and Protein Annotation. Nucleic Acids Res (2016) 44(D1):D457–462. doi: 10.1093/nar/gkv1070
41. Rebhan M, Chalifa-Caspi V, Prilusky J, Lancet D. GeneCards: Integrating Information About Genes, Proteins and Diseases. Trends Genet (1997) 13(4):163. doi: 10.1016/s0168-9525(97)01103-7
42. Szklarczyk D, Franceschini A, Wyder S, Forslund K, Heller D, Huerta-Cepas J, et al. String v10: Protein-Protein Interaction Networks, Integrated Over the Tree of Life. Nucleic Acids Res (2015) 43(Database issue):D447–452. doi: 10.1093/nar/gku1003
43. Pruitt KD, Tatusova T, Brown GR, Maglott DR. Ncbi Reference Sequences (RefSeq): Current Status, New Features and Genome Annotation Policy. Nucleic Acids Res (2012) 40(Database issue):D130–5. doi: 10.1093/nar/gkr1079
44. Croft D, Mundo AF, Haw R, Milacic M, Weiser J, Wu G, et al. The Reactome Pathway Knowledgebase. Nucleic Acids Res (2014) 42(Database issue):D472–7. doi: 10.1093/nar/gkt1102
45. Gene Ontology C. Gene Ontology Consortium: Going Forward. Nucleic Acids Res (2015) 43(Database issue):D1049–56. doi: 10.1093/nar/gku1179
46. Barrett T, Wilhite SE, Ledoux P, Evangelista C, Kim IF, Tomashevsky M, et al. Ncbi GEO: Archive for Functional Genomics Data Sets—Update. Nucleic Acids Res (2012) 41(D1):D991–5. doi: 10.1093/nar/gks1193
47. Edgar R, Domrachev M, Lash AE. Gene Expression Omnibus: NCBI Gene Expression and Hybridization Array Data Repository. Nucleic Acids Res (2002) 30(1):207–10. doi: 10.1093/nar/30.1.207
48. Irizarry RA, Hobbs B, Collin F, Beazer-Barclay YD, Antonellis KJ, Scherf U, et al. Exploration, Normalization, and Summaries of High Density Oligonucleotide Array Probe Level Data. Biostatistics (2003) 4(2):249–64. doi: 10.1093/biostatistics/4.2.249
49. Carvalho BS, Irizarry RA. A Framework for Oligonucleotide Microarray Preprocessing. Bioinformatics (2010) 26(19):2363–7. doi: 10.1093/bioinformatics/btq431
50. Davis S, Meltzer PS. Geoquery: A Bridge Between the Gene Expression Omnibus (GEO) and Bioconductor. Bioinformatics (2007) 23(14):1846–7. doi: 10.1093/bioinformatics/btm254
51. Choi JK, Yu U, Kim S, Yoo OJ. Combining Multiple Microarray Studies and Modeling Interstudy Variation. Bioinformatics (2003) 19 Suppl 1:i84–90. doi: 10.1093/bioinformatics/btg1010
52. Lusa L, Gentleman R, Ruschhaupt M. GeneMeta: Metaanalysis for High Throughput Experiments. R Package Version (2006) 1.
53. Jin W, Goldfine AB, Boes T, Henry RR, Ciaraldi TP, Kim E-Y, et al. Increased SRF Transcriptional Activity in Human and Mouse Skeletal Muscle is a Signature of Insulin Resistance. J Clin Invest (2011) 121(3):918–29. doi: 10.1172/JCI41940
54. Hung JH, Yang TH, Hu Z, Weng Z, DeLisi C. Gene Set Enrichment Analysis: Performance Evaluation and Usage Guidelines. Brief Bioinform (2012) 13(3):281–91. doi: 10.1093/bib/bbr049
55. Varemo L, Scheele C, Broholm C, Mardinoglu A, Kampf C, Asplund A, et al. Proteome- and Transcriptome-Driven Reconstruction of the Human Myocyte Metabolic Network and Its Use for Identification of Markers for Diabetes. Cell Rep (2015) 11(6):921–33. doi: 10.1016/j.celrep.2015.04.010
56. Liberzon A, Subramanian A, Pinchback R, Thorvaldsdottir H, Tamayo P, Mesirov JP. Molecular Signatures Database (MsigDB) 3.0. Bioinformatics (2011) 27(12):1739–40. doi: 10.1093/bioinformatics/btr260
58. Subramanian A, Tamayo P, Mootha VK, Mukherjee S, Ebert BL, Gillette MA, et al. Gene Set Enrichment Analysis: A Knowledge-Based Approach for Interpreting Genome-Wide Expression Profiles. Proc Natl Acad Sci U S A (2005) 102(43):15545–50. doi: 10.1073/pnas.0506580102
59. Rouzier C, Moore D, Delorme C, Lacas-Gervais S, Ait-El-Mkadem S, Fragaki K, et al. A Novel CISD2 Mutation Associated With a Classical Wolfram Syndrome Phenotype Alters Ca2+ Homeostasis and ER-mitochondria Interactions. Hum Mol Genet (2017) 26(9):1599–611. doi: 10.1093/hmg/ddx060
60. Cattaneo M, La Sala L, Rondinelli M, Errichiello E, Zuffardi O, Puca AA, et al. A Donor Splice Site Mutation in CISD2 Generates Multiple Truncated, non-Functional Isoforms in Wolfram Syndrome Type 2 Patients. BMC Med Genet (2017) 18(1):147. doi: 10.1186/s12881-017-0508-2
61. Geisler CE, Ghimire S, Bruggink SM, Miller KE, Weninger SN, Kronenfeld JM, et al. A Critical Role of Hepatic GABA in The Metabolic Dysfunction and Hyperphagia of Obesity. bioRxiv (2020). doi: 10.1101/2020.04.02.022699
62. Nagle CA, An J, Shiota M, Torres TP, Cline GW, Liu ZX, et al. Hepatic Overexpression of glycerol-sn-3-phosphate Acyltransferase 1 in Rats Causes Insulin Resistance. J Biol Chem (2007) 282(20):14807–15. doi: 10.1074/jbc.M611550200
63. Zhang C, Wendel AA, Keogh MR, Harris TE, Chen J, Coleman RA. Glycerolipid Signals Alter mTOR Complex 2 (mTORC2) to Diminish Insulin Signaling. Proc Natl Acad Sci U S A (2012) 109(5):1667–72. doi: 10.1073/pnas.1110730109
64. Zhang C, Cooper DE, Grevengoed TJ, Li LO, Klett EL, Eaton JM, et al. Glycerol-3-phosphate acyltransferase-4-deficient Mice are Protected From Diet-Induced Insulin Resistance by the Enhanced Association of mTOR and Rictor. Am J Physiol Endocrinol Metab (2014) 307(3):E305–15. doi: 10.1152/ajpendo.00034.2014
65. Guasch-Ferre M, Hruby A, Toledo E, Clish CB, Martinez-Gonzalez MA, Salas-Salvado J, et al. Metabolomics in Prediabetes and Diabetes: A Systematic Review and Meta-Analysis. Diabetes Care (2016) 39(5):833–46. doi: 10.2337/dc15-2251
66. Flores-Guerrero JL, Oste MCJ, Kieneker LM, Gruppen EG, Wolak-Dinsmore J, Otvos JD, et al. Plasma Branched-Chain Amino Acids and Risk of Incident Type 2 Diabetes: Results From the PREVEND Prospective Cohort Study. J Clin Med (2018) 7. doi: 10.3390/jcm7120513
67. Gannon NP, Schnuck JK, Vaughan RA. Bcaa Metabolism and Insulin Sensitivity - Dysregulated by Metabolic Status? Mol Nutr Food Res (2018) 62(6):e1700756. doi: 10.1002/mnfr.201700756
68. Green CR, Wallace M, Divakaruni AS, Phillips SA, Murphy AN, Ciaraldi TP, et al. Branched-Chain Amino Acid Catabolism Fuels Adipocyte Differentiation and Lipogenesis. Nat Chem Biol (2016) 12(1):15–21. doi: 10.1038/nchembio.1961
70. Yoneshiro T, Wang Q, Tajima K, Matsushita M, Maki H, Igarashi K, et al. BCAA Catabolism in Brown Fat Controls Energy Homeostasis Through SLC25A44. Nature (2019) 572(7771):614–9. doi: 10.1038/s41586-019-1503-x
71. Nicastro H, da Luz CR, Chaves DF, Bechara LR, Voltarelli VA, Rogero MM, et al. Does Branched-Chain Amino Acids Supplementation Modulate Skeletal Muscle Remodeling Through Inflammation Modulation? Possible Mech Action J Nutr Metab (2012) 2012:136937. doi: 10.1155/2012/136937
72. Zhenyukh O, Gonzalez-Amor M, Rodrigues-Diez RR, Esteban V, Ruiz-Ortega M, Salaices M, et al. Branched-Chain Amino Acids Promote Endothelial Dysfunction Through Increased Reactive Oxygen Species Generation and Inflammation. J Cell Mol Med (2018) 22(10):4948–62. doi: 10.1111/jcmm.13759
73. Solon-Biet SM, Cogger VC, Pulpitel T, Wahl D, Clark X, Bagley E, et al. Branched Chain Amino Acids Impact Health and Lifespan Indirectly Via Amino Acid Balance and Appetite Control. Nat Metab (2019) 1(5):532–45. doi: 10.1038/s42255-019-0059-2
74. Park SS, Seo Y-K. Excess Accumulation of Lipid Impairs Insulin Sensitivity in Skeletal Muscle. Int J Mol Sci (2020) 21(6):1949. doi: 10.3390/ijms21061949
75. Lundsgaard AM, Fritzen AM, Nicolaisen TS, Carl CS, Sjoberg KA, Raun SH, et al. Glucometabolic Consequences of Acute and Prolonged Inhibition of Fatty Acid Oxidation. J Lipid Res (2020) 61(1):10–9. doi: 10.1194/jlr.RA119000177
76. Direk K, Lau W, Small KS, Maniatis N, Andrew T. ABCC5 Transporter is a Novel Type 2 Diabetes Susceptibility Gene in European and African American Populations. Ann Hum Genet (2014) 78(5):333–44. doi: 10.1111/ahg.12072
77. Cyranka M, Veprik A, McKay EJ, van Loon N, Thijsse A, Cotter L, et al. Abcc5 Knockout Mice Have Lower Fat Mass and Increased Levels of Circulating Glp-1. Obes (Silver Spring) (2019) 27(8):1292–304. doi: 10.1002/oby.22521
78. Udler MS. Type 2 Diabetes: Multiple Genes, Multiple Diseases. Curr Diabetes Rep (2019) 19(8):55. doi: 10.1007/s11892-019-1169-7
79. Ahlqvist E, Storm P, Karajamaki A, Martinell M, Dorkhan M, Carlsson A, et al. Novel Subgroups of Adult-Onset Diabetes and Their Association With Outcomes: A Data-Driven Cluster Analysis of Six Variables. Lancet Diabetes Endocrinol (2018) 6(5):361–9. doi: 10.1016/S2213-8587(18)30051-2
80. Udler MS, Kim J, von Grotthuss M, Bonas-Guarch S, Cole JB, Chiou J, et al. Type 2 Diabetes Genetic Loci Informed by Multi-Trait Associations Point to Disease Mechanisms and Subtypes: A Soft Clustering Analysis. PLoS Med (2018) 15(9):e1002654. doi: 10.1371/journal.pmed.1002654
81. Sasaki Y, Sone H, Kamiyama S, Shimizu M, Shirakawa H, Kagawa Y, et al. Administration of Biotin Prevents the Development of Insulin Resistance in the Skeletal Muscles of Otsuka Long-Evans Tokushima Fatty Rats. Food Funct (2012) 3(4):414–9. doi: 10.1039/c2fo10175k
Keywords: mitochondrial dysfunction, type 2 diabetes, insulin action and resistance, adipose tissue, gene set enrichment analyses, differential gene expression, heritable susceptibility
Citation: Maude H, Lau W, Maniatis N and Andrew T (2021) New Insights Into Mitochondrial Dysfunction at Disease Susceptibility Loci in the Development of Type 2 Diabetes. Front. Endocrinol. 12:694893. doi: 10.3389/fendo.2021.694893
Received: 13 April 2021; Accepted: 08 July 2021;
Published: 11 August 2021.
Edited by:
Åke Sjöholm, Gävle Hospital, SwedenReviewed by:
Lijun Ma, Wake Forest University, United StatesCopyright © 2021 Maude, Lau, Maniatis and Andrew. This is an open-access article distributed under the terms of the Creative Commons Attribution License (CC BY). The use, distribution or reproduction in other forums is permitted, provided the original author(s) and the copyright owner(s) are credited and that the original publication in this journal is cited, in accordance with accepted academic practice. No use, distribution or reproduction is permitted which does not comply with these terms.
*Correspondence: Toby Andrew, dC5hbmRyZXdAaW1wZXJpYWwuYWMudWs=
Disclaimer: All claims expressed in this article are solely those of the authors and do not necessarily represent those of their affiliated organizations, or those of the publisher, the editors and the reviewers. Any product that may be evaluated in this article or claim that may be made by its manufacturer is not guaranteed or endorsed by the publisher.
Research integrity at Frontiers
Learn more about the work of our research integrity team to safeguard the quality of each article we publish.