
94% of researchers rate our articles as excellent or good
Learn more about the work of our research integrity team to safeguard the quality of each article we publish.
Find out more
ORIGINAL RESEARCH article
Front. Endocrinol. , 14 June 2021
Sec. Thyroid Endocrinology
Volume 12 - 2021 | https://doi.org/10.3389/fendo.2021.666595
 Claudia Irene Maushart1Jaël Rut Senn1Rahel Catherina Loeliger1Marius E. Kraenzlin2Julian Müller3
 Anton S. Becker3
 Miroslav Balaz4
 Christian Wolfrum4Irene A. Burger3
 Matthias Johannes Betz1*
Thyroid hormone (TH) is an important regulator of mammalian metabolism and facilitates cold induced thermogenesis (CIT) in brown adipose tissue (BAT). Profound hypothyroidism or hyperthyroidism lead to alterations in BAT function and CIT. In euthyroid humans the inter-individual variation of thyroid hormones is relatively large. Therefore, we investigated whether levels of free thyroxine (T4) or free triiodothyronine (T3) are positively associated with CIT in euthyroid individuals. We performed an observational study in 79 healthy, euthyroid volunteers (mean age 25.6 years, mean BMI 23.0 kg · m-2). Resting energy expenditure (REE) was measured by indirect calorimetry during warm conditions (EEwarm) and after a mild cold stimulus of two hours (EEcold). CIT was calculated as the difference between EEcold and EEwarm. BAT activity was assessed by 18F-FDG-PET after a mild cold stimulus in a subset of 26 participants. EEcold and CIT were significantly related to levels of free T4 (R2 = 0.11, p=0.0025 and R2 = 0.13, p=0.0011, respectively) but not to free T3 and TSH. Cold induced BAT activity was also associated with levels of free T4 (R2 = 0.21, p=0.018). CIT was approximately fourfold higher in participants in the highest tertile of free T4 as compared to the lowest tertile. Additionally, free T4 was weakly, albeit significantly associated with outdoor temperature seven days prior to the respective study visit (R2 = 0.06, p=0.037). These finding suggests that variations in thyroid hormone levels within the euthyroid range are related to the capability to adapt to cool temperatures and affect energy balance.
Thyroid hormone (TH) is an important regulator of mammalian metabolism and resting energy expenditure (REE) (1). Overt hyperthyroidism increases REE and food intake (2), and stimulates gluconeogenesis (3) as well as lipolysis (4) while overt hypothyroidism has the opposite effect (5–7). However, the consequences of subtle changes in thyroid hormone levels on metabolism are less certain. Several cross-sectional studies suggest that variations of free thyroxine (free T4) and free triiodothyronine (free T3) within the reference range are associated with metabolic health (8–11). In mammals, TH is crucial for the maintenance of body core temperature by positively regulating thermogenesis (12). TH affects virtually all metabolically active tissues and among others Brown adipose tissue (BAT) is an important target of TH action (13). BAT is a thermogenic tissue and is activated by the sympathetic nervous system in response to mild cold exposure. The resulting increase in REE is called “cold induced thermogenesis” (CIT) (13). Brown adipocytes contain a high amount of mitochondria which harbor uncoupling protein 1 (UCP1) in the inner mitochondrial membrane. UCP1 is exclusive to brown adipocytes and can convert chemical energy directly into heat by short-circuiting oxidative phosphorylation (14). Research in both rodents (15) and humans (16) indicates favorable effects of active BAT on metabolism, such as a reduction in blood glucose and triglycerides and lipoproteins suggesting that more active BAT could contribute to a metabolically healthy phenotype.
Recently, we demonstrated that CIT is reduced in hypothyroid individuals and can be restored by sufficient thyroid hormone replacement (17). In the present study, we investigated whether levels of thyroid hormones within the reference range in healthy, euthyroid individuals are connected to EE at warm and cold temperatures.
We collected data of healthy volunteers from a prospective observational study [clinicaltrials.gov ID: NCT02682706 (18)] and the screening data from two interventional trials [NCT03189511 (19) and NCT03269747]. All participants were recruited via local advertisement at the endocrine outpatient clinic at the University Hospital Basel. Inclusion criteria were as follows: age 18 to 40 years, female and male persons with a BMI of 17.5 to 27 kg/m2 for NCT02682706. Male persons with a BMI of 17.5 to 27 kg/m2 for NCT03189511 and NCT03269747. We excluded participants with chronic heart failure, liver cirrhosis, kidney failure, active cancer, thyroid hormone disorders or intake of the following medication: Non-steroidal anti-inflammatory drugs (NSAID), glucocorticoids, diuretics, antihypertensives, fibrates or statins, metformin. From March 2016 to February 2019 we included a total of 79 healthy participants.
The ethical review board of Northwest and Central Switzerland (EKNZ) approved the studies and all participants provided written informed consent.
Resting energy expenditure (REE) was measured for 30 minutes by indirect calorimetry using a ventilated canopy calorimeter (Quark RMR, Cosmed, Rome, Italy). Participants fasted for at least 6 hours prior to the study visit and were asked to refrain from intensive physical activity 24 hours before the scheduled study visit. We measured EE during warm conditions (EEwarm) and after a standardized, mild cold stimulus (EEcold). All visits took place in an air-conditioned study room at a controlled ambient temperature of 24°C year round. For determination of EEwarm participants were placed in a hospital bed in a supine position and were covered with a fleece blanket. After the first measurement, the blanket was removed and the patients were asked to wear only a t-shirt and shorts. Participants were additionally exposed to mild cold using a water circulated cooling system (Hilotherm clinic, Hilotherm GmbH, Germany) around the patient’s waist. The water temperature was continuously reduced by 1°C every two minutes from 25°C to a minimum of 10°C. During the cooling participants were asked repeatedly if they experienced cold or noticed shivering. In case of shivering they were covered with a blanket for 5 minutes and the water temperature was raised by 2°C until the shivering stopped. The total cooling time was 120 minutes. During the last 30 minutes of the cooling the measurement of EEcold was performed. Cold induced thermogenesis (CIT) was calculated as the difference between EEcold and EEwarm. Relative CIT was calculated as the percentage of EEwarm in the respective subject in order to correct for variations in size.
During the experiment we continuously measured the skin temperature every 60 seconds with self-contained temperature probes (iButton DS1922L, Maxim Integrated Products, Inc, San Jose, CA) at the following eight defined body locations: Supraclavicular region (right and left), parasternal at the level of the 2nd intercostal space (right and left), umbilicus, mid-thigh (right and left), middle of the lower arm palmar side, finger tip of the 3rd finger of the non-dominant hand, and middle of the lower left leg, back of the left foot. The temperature data of every location during the last ten minutes of warm and cold phase, respectively, were averaged.
The tympanic temperature was measured with infrared tympanometry (Braun, ThermoScan PRO 6000, Marlborough, MA) before and after cold exposure.
In a subset of participants we analyzed BAT activity by 18F-FDG-PET which was performed after controlled cold exposure in 17 and 16 participants in the context of two clinical trials [trial 1: NCT03189511 (19) and trial 2: NCT03269747]. Specifically, the participants who qualified for the interventional trials continued to 18F-FDG-PET. Briefly, participants were exposed to mild cold for two hours using a Hilotherm clinic cooling device as described above. In trial 1 BAT was further stimulated by oral administration of 200 mg of Mirabegron 90 minutes before the onset of cooling (Betmiga, Astellas Pharma, Wallisellen, Switzerland). In both trials, participants received 75 MBq 18F-FDG intravenously directly after the cold exposure. PET scans were performed on a SIGNA PET/MR (GE Healthcare, Waukesha, WI, USA; trial 1) or a Siemens Biograph mCT (Siemens Healthineers, Erlangen, Germany; trial 2), respectively. We compared the SUVmean of supraclavicular adipose tissue to the levels of free T4 measured before the stimulation of BAT. In this setting, TH was measured in 10 participants from trial 1 and 16 participants from trial 2.
Blood was sampled into serum monovettes (Sarstedt, Germany) at the beginning of the study visit with all subjects fasted for at least six hours. They were also asked to refrain from strenuous exercise during the 24 hours before attending the study. Samples were left standing for 30 minutes and were then centrifuged at 3000xg at 4°C.
TSH and free T4 were measured at the central lab of the University Hospital Basel. For TSH and free T4 electro-chemiluminescence immunoassay (Elecsys, all assays from Roche Diagnostics AG, Rotkreuz, Switzerland) were used. The reference range for TSH was 0.33 – 4.49 mIU · l-1. The fT4 levels had a reference range of 11.6-22.0 pM. The reference ranges were established at the central lab of the University Hospital Basel.
Thyroglobulin and free T3 were analysed at a specialized endocrine laboratory (SpezialLABOR, Basel, Switzerland) on a Siemens Immulite 2000 Systems (Siemens Healthcare Diagnostic Products Ltd., Gwynedd, UK). The reference range was 2.8–6.5 pM for free T3 and 1.6 and 59.9 ng · ml-1 for thyroglobulin. Reference ranges for these parameters were according to the manufacturer’s package insert.
The Institute for Meteorology, Climatology and Remote Sensing at the University of Basel provided daily mean, maximum and minimum temperatures for all days during the study period. The outdoor temperatures were recorded at an urban meteorological station nearby the University Hospital Basel. Mean daily temperatures were averaged over a period of 7 days prior to the respective study visit.
Data were analysed using R Version 3.5 (20) and GraphPad Prism Version 9 (GraphPad, La Jolla, CA). Continuous data are given as mean ± SD unless stated otherwise. TSH values were not normally distributed and log-transformed before further analysis. Simple linear regression was performed for measures of EE and TH levels. In order to correct for potential confounding factors linear modeling was performed as follows: All continuous variables were scaled by Z-scaling. A linear model was built in R containing all anthropometric and laboratory values. Thereafter the model was refined stepwise in order to reduce the number of variables to only significant ones. A p-value below 0.05 was considered significant.
All participants were healthy, euthyroid and had a mean age of about 25 years. Due to the study design of the two interventional trials, the majority of subjects was male. Baseline anthropometric data and thyroid hormone values are given in Table 1.
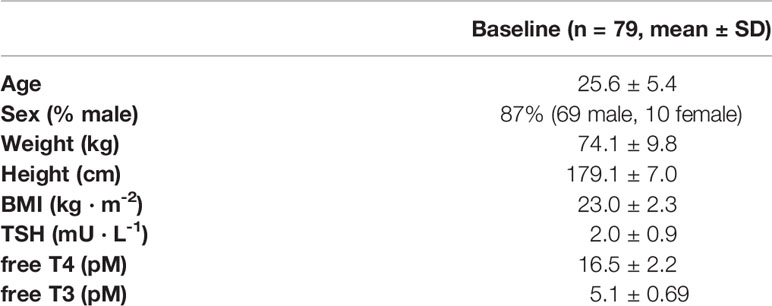
Table 1 Clinical characteristics at baseline.
In order to document a sufficient cold exposure we compared the skin and tympanic temperatures in all subjects before and after cold exposure. The tympanic temperature dropped only minimally, albeit significantly (see Figure 1A). With the exception of the supraclavicular region, the skin temperature dropped significantly in all other skin regions. The reduction of skin temperature was most pronounced in the umbilical region as the sensor was intentionally placed below the cooling mattress placed around the patients’ mid-section (see Figures 1B–I).
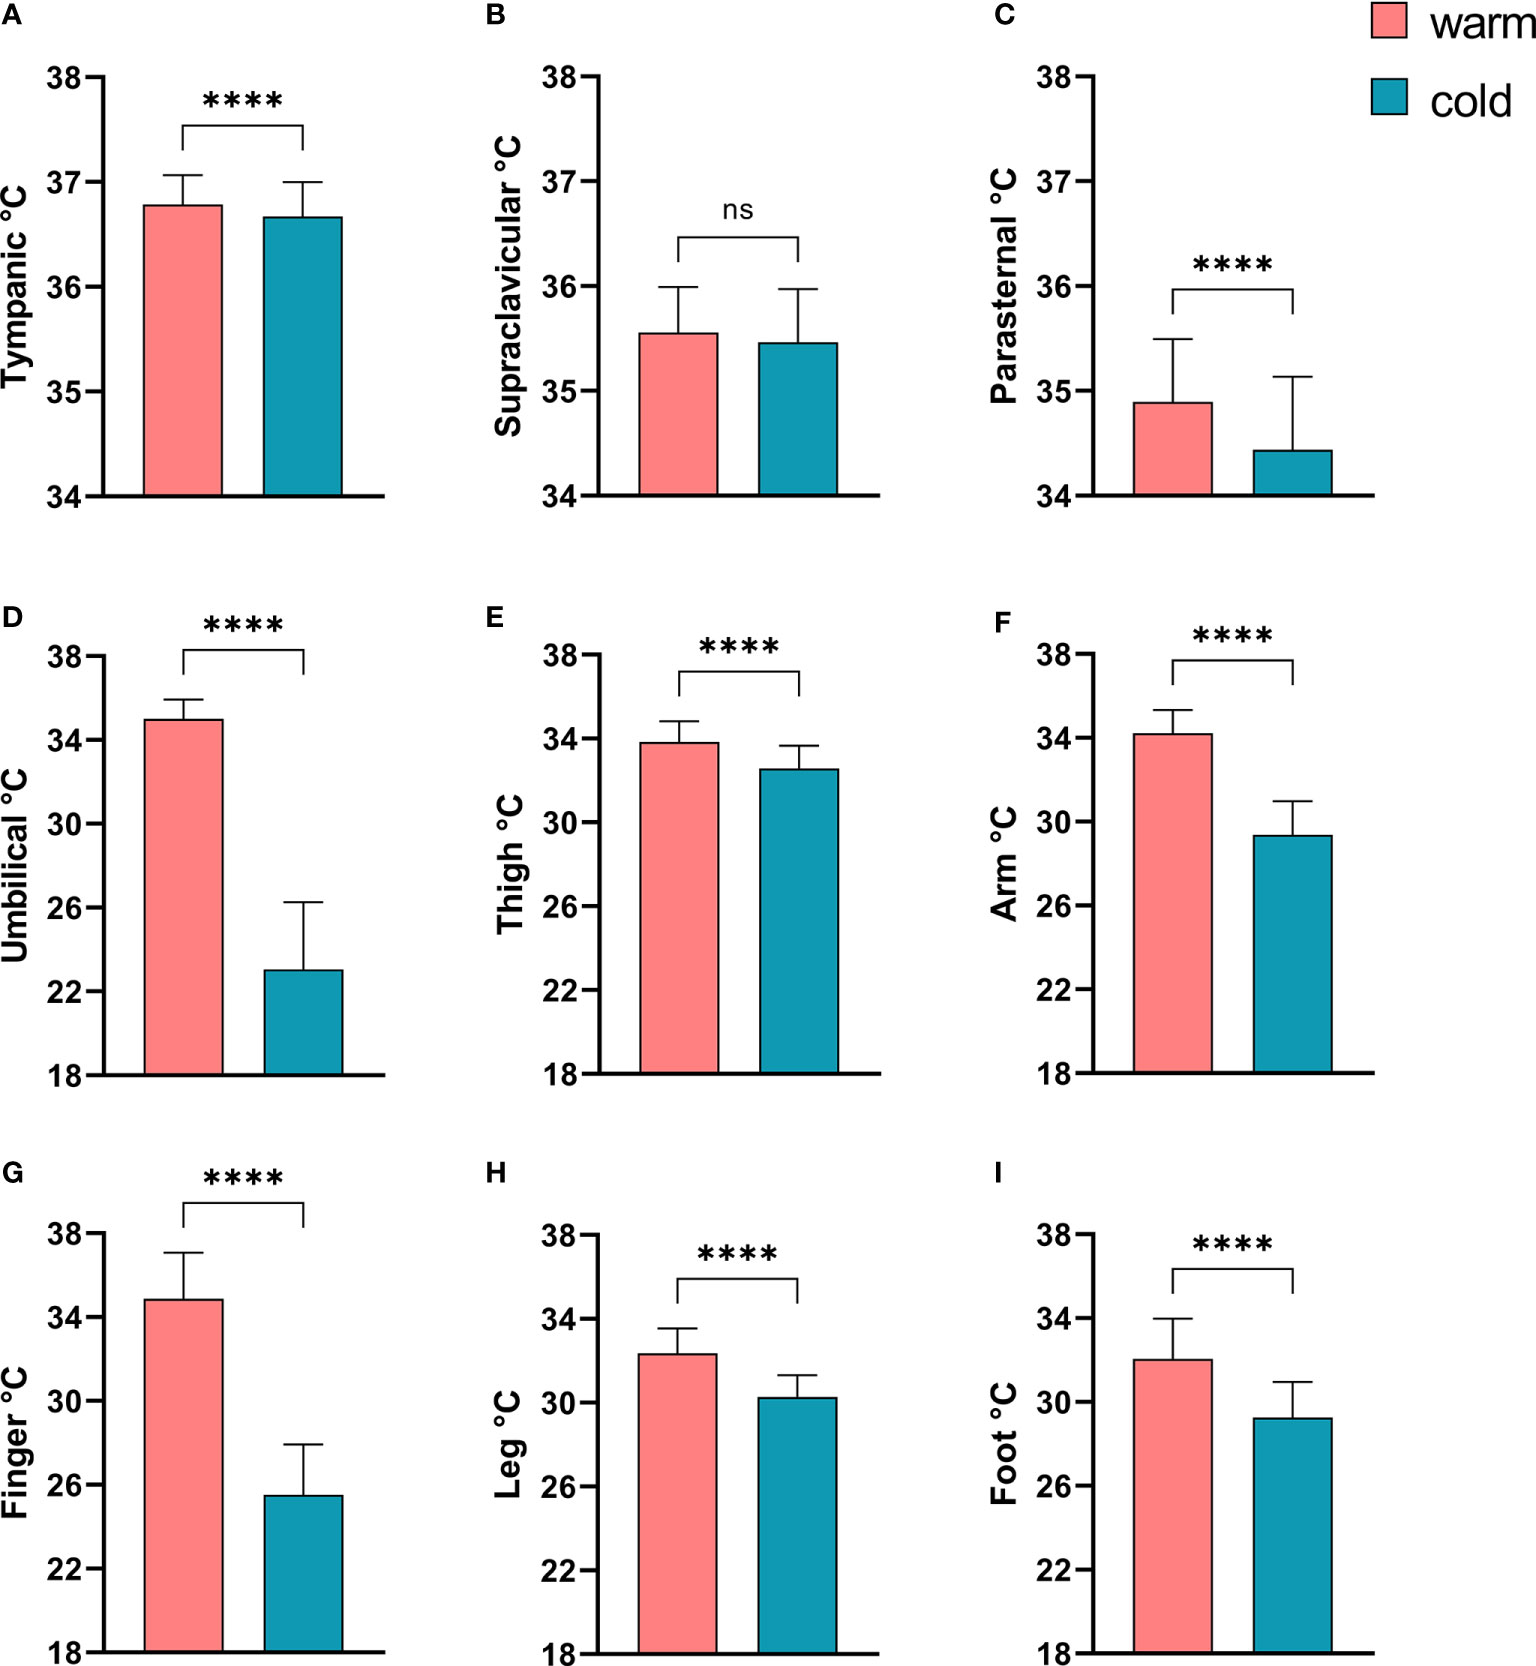
Figure 1 Comparison of tympanic temperature and skin temperatures before and after mild cold exposure. (A) Tympanic temperature; Skin temperatures: (B) Supraclavicular region; (C) Parasternal region; (D), Umbilicus; (E) Thigh; (F) Non-dominant forearm; (G) Middle finger, non dominant hand; (H) Left lower leg; (I) Left dorsal foot. ****p<0.0001 in Wilcoxon-Signed-Rank Test, ns, p≥0.05.
In all study subjects, resting energy expenditure (REE) was measured during warm conditions (EEwarm) and after a mild cold stimulus of two hours (EEcold). TSH was not associated with CIT (p=0.37), EEwarm (p=0.82) or EEcold (p=0.78). While EEwarm was not significantly associated with levels of free T4 (R2 = 0.03, p=0.12, Figure 2A) it correlated significantly with levels of free T3 (R2 = 0.16, p=0.0004, Figure 2D). EEcold was weakly, albeit significantly associated with levels of free T4 (R2 = 0.11, p=0.0025, Figure 2B) and with free T3 (R2 = 0.11, p=0.0039, Figure 2E).
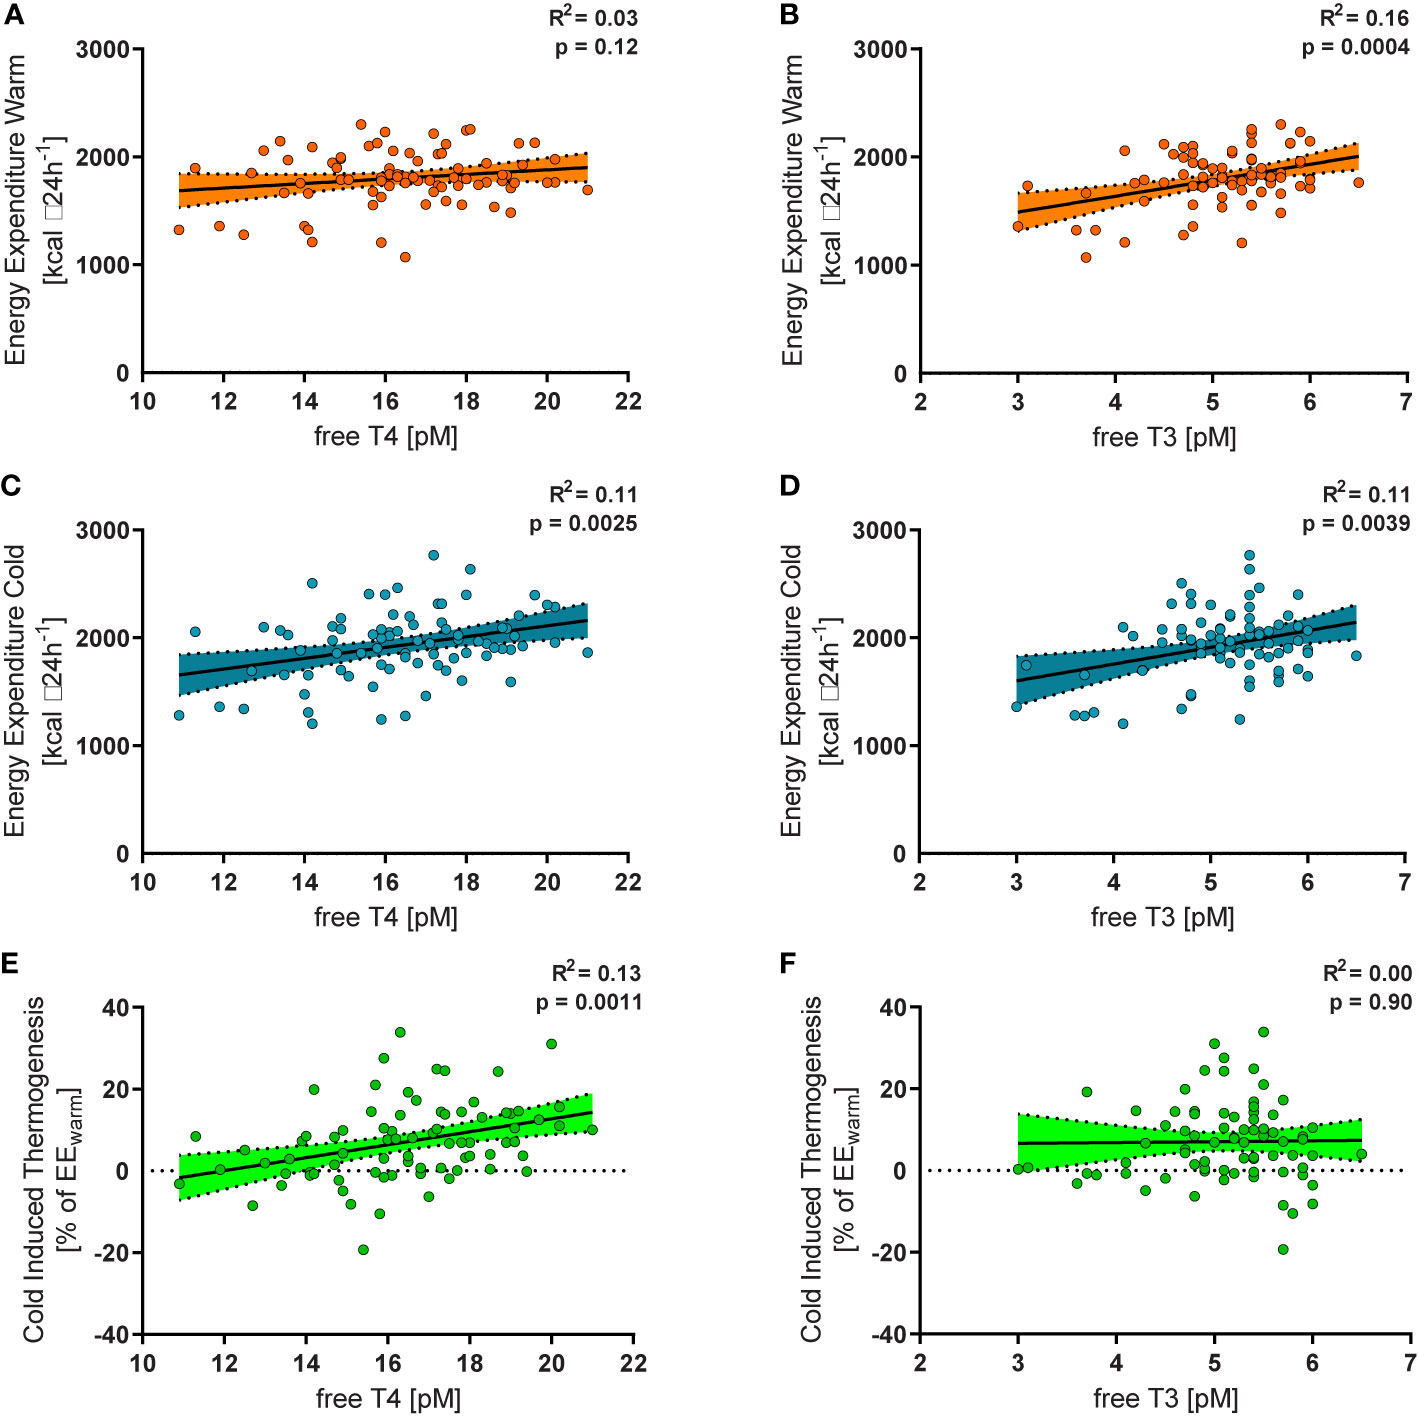
Figure 2 Free T4 within the reference range was not significantly related to energy expenditure during warm conditions (EEwarm, R2 = 0.03, p=0.12, (A), but to energy expenditure during mild cold exposure (EEcold, R2 = 0.11, p=0.0025, (B) and to relative cold induced thermogenesis (CIT, R2 = 0.13, p=0.0011, (C). Free T3 was significantly associated with EEwarm (R2 = 0.16, p=0.0004, (D), EEcold (R2 = 0.11, p=0.0039, (E), but not with CIT (R2 = 0.00, p=0.90, (F).
Cold induced thermogenesis (CIT) was calculated as the difference between EEcold and EEwarm. For a better comparability of the interindividual variation of REE we calculated relative CIT (CIT divided by EEwarm). Relative CIT was significantly associated with free T4 (R2 = 0.13, p=0.0011, Figure 2C) but not with free T3 (R2 = 0.00, p=0.90, Figure 2F). It should be emphasized that all participants were euthyroid. In order to assess the clinical relevance of our findings we stratified them into tertiles according to their free T4 levels (Figure 3A). Importantly, the mean TSH level in all tertiles was virtually identical (ANOVA p=0.89, Figure 3B).

Figure 3 Subjects were grouped into tertiles according their levels of free T4 (A). The mean TSH levels of the three groups did not differ significantly (ANOVA p=0.89, (B). In the highest tertile (free T4 17.5 to 21.0 pM) they had mean CIT of 10.2 ± 7.5% of EEwarm while those in the lowest tertile (free T4 10.9 to 15.7 pM) had a mean CIT of 2.3 ± 8.7% (ANOVA p=0.0057, trend p=0.0027, (C). **p<0.01; ****p<0.0001; ns, p≥0.05.
In participants with a level of free T4 in the highest tertile (free T4 17.5 to 21.0 pM) mean CIT was approximately four-fold higher (10.2 ± 7.5% of EEwarm) than in those in the lowest tertile (free T4 10.9 to 15.7 pM, mean CIT of 2.3 ± 8.7%, ANOVA p=0.0057, trend p=0.0027, Figure 3C).
REE and CIT are known to be associated with several anthropometric factors and outdoor temperature (21, 22). Therefore, we performed multiple linear regression to analyze whether levels of TH were still predictive of EEwarm, EEcold or relative CIT.
EEwarm was significantly influenced by weight (p=0.023) and sex (p<0.0001) of participants (Table 2A). For EEcold the outdoor temperature during the week before the measurement of REE was an additional significant predictor (p=0.0021) (Table 2B). In both models, levels of TH did not affect REE. However, levels of free T4 were significantly associated with CIT (p=0.020), as were outdoor temperature (p=0.0035), height (p=0.0005) and weight (p=0.0069) (Table 2C). We performed the same analysis also with the warm (mean temperature ≥ 15.0°C) vs. cold season and the meteorological season. In both models free T4 was a significant predictor of CIT (p=0.0085 and p=0.0088). CIT was inversely associated with the warm season as compared to the cold season (p=0.024). Using meteorological seasons as a factor and comparing to autumn, summer was inversely correlated with CIT (p=0.045), see Supplementary Table 1.
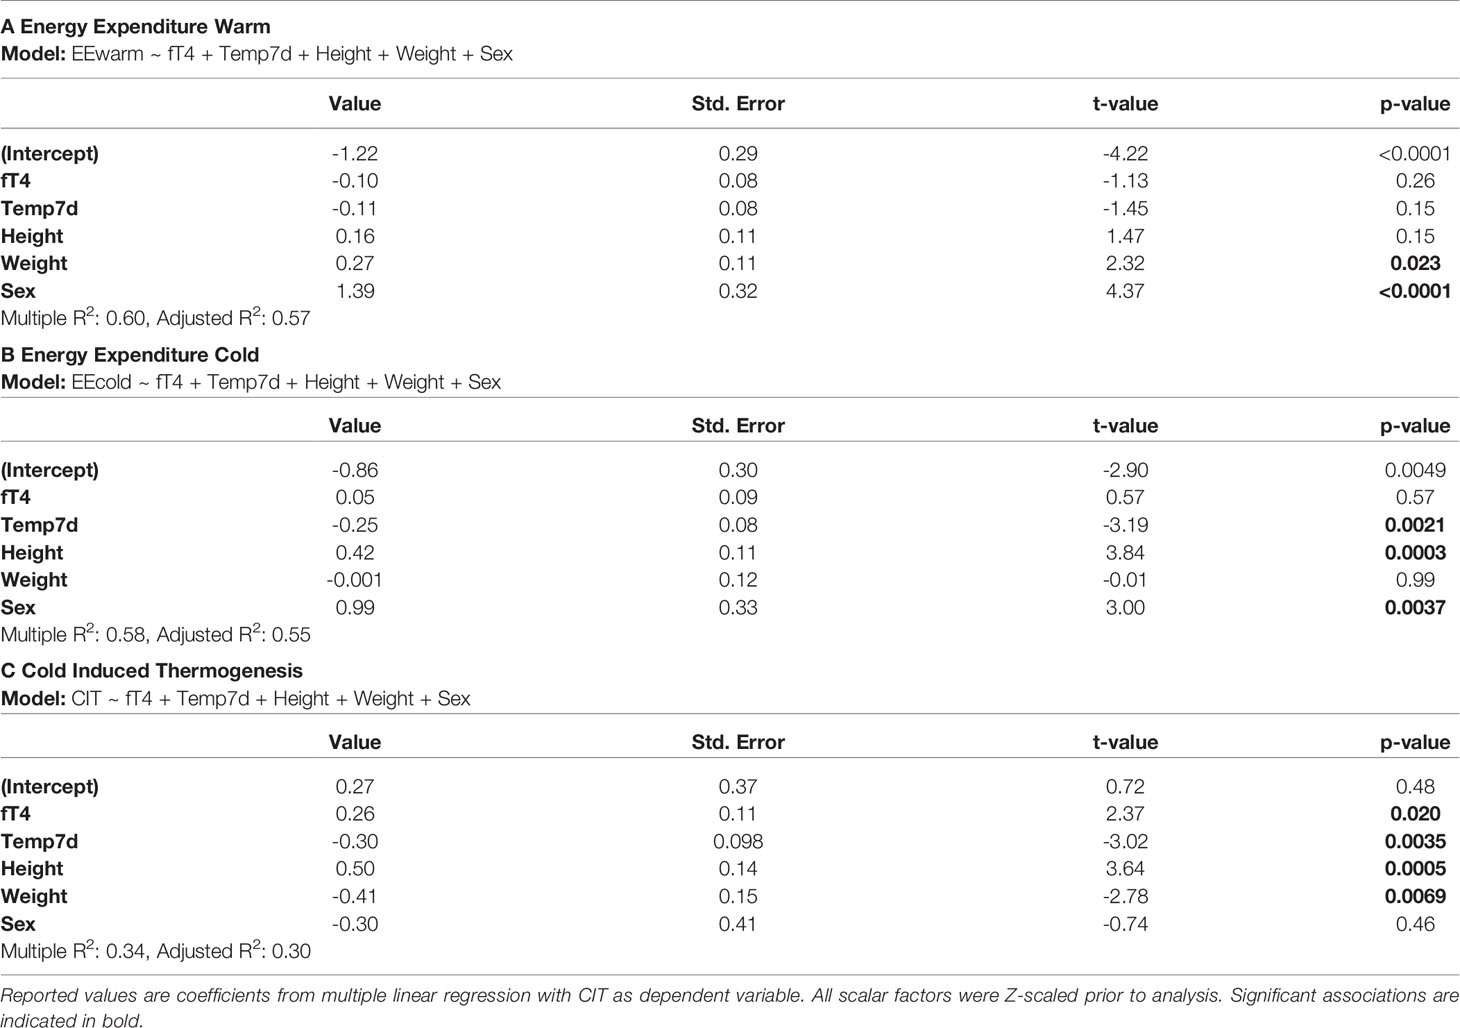
Table 2 Results of multiple linear regression.
In order to further delineate the effects of free T4 on cold induced metabolism we analysed PET/CT and PET/MR data which were available for a subset of the participants. 18F-FDG-PET/CT and –PET/MR had been performed after two hours of mild cold exposure and were compared to the levels of free T4 in a serum sample directly prior to BAT stimulation. SUVmean of 18F-FDG in the supraclavicular adipose tissue was significantly associated with levels of free T4 (Figure 4, R2 = 0.21, p=0.018).
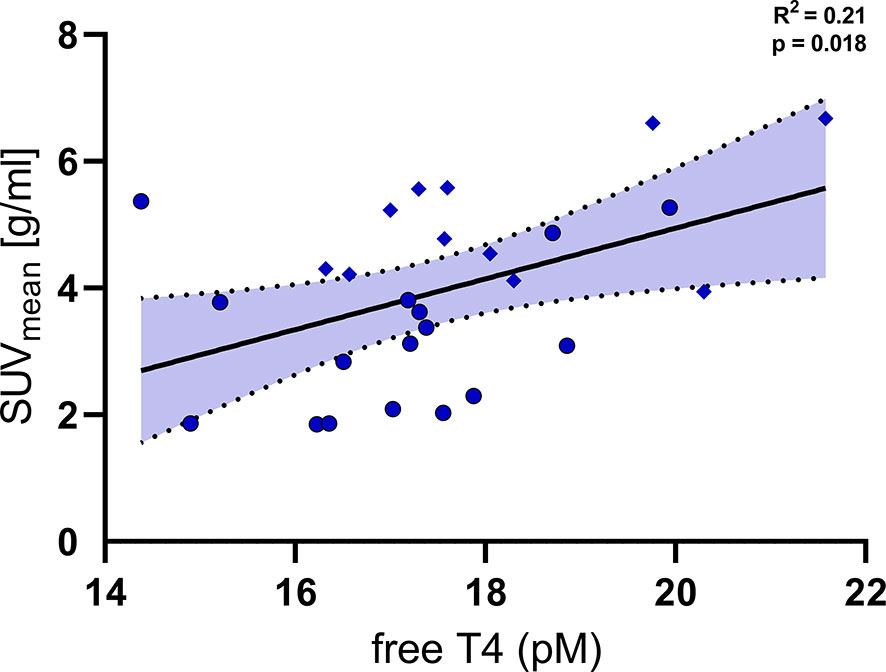
Figure 4 Levels of free T4 were significantly associated with the uptake of fluoro-deoxyglucose (SUVmean) into supraclavicular brown adipose tissue (R2 = 0.21, p=0.018). Diamonds: individual data points from trial 1 NCT03189511 (PET/MRI, BAT stimulation by Mirabegron and cold exposure), Circles: individual data points from trial 2 NCT03269747 (PET/CT, BAT stimulation by cold exposure).
TH metabolism is increased during exposure to severe cold (23, 24). In the temperate climate of Basel, Switzerland, free T4 was weakly, albeit significantly associated with outdoor temperature (R2 = 0.06, p=0.037). This association persisted when weight and sex were added to the regression model. Free T3 and TSH were not related to outdoor temperature (R2 = 0.00, p=0.81, and R2 = 0.014, p=0.30, respectively, Table 3).
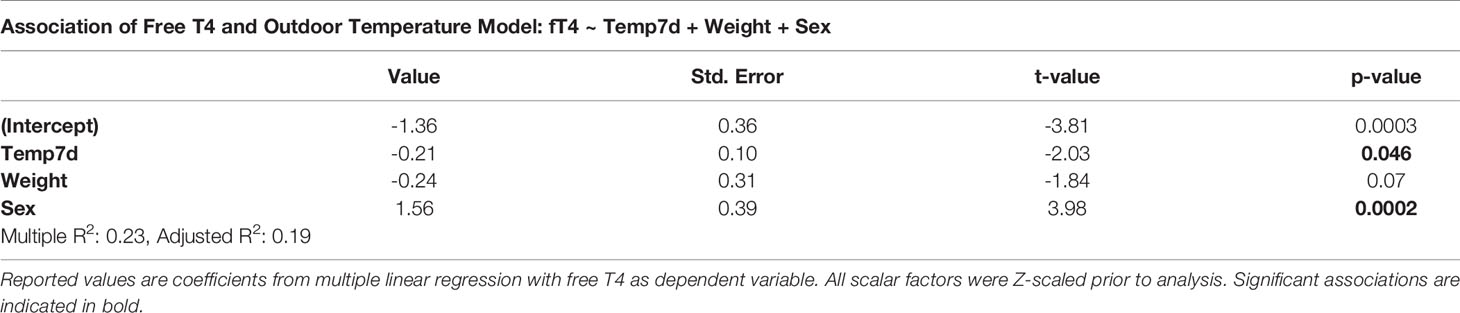
Table 3 Association of free T4 and outdoor temperature.
Levels of thyroglobulin are an endogenous marker of thyroid hormone synthesis and have been shown to be substantially increased in very cold climates (23). In our cohort and a temperate climate zone we found no association of thyroglobulin to outdoor temperature (R2 = 0.03, p=0.14).
In this study, we demonstrate that levels of free T4 within the reference range in euthyroid, healthy individuals are significantly associated with CIT. This association persisted after multivariate correction for other parameters known to influence CIT. Further, we provide evidence that this effect may be caused at least partially by an influence on BAT activity.
In standard clinical practice, TSH is considered to be the most sensitive and cost-effective test of thyroid function. A value within the reference range is considered to be a robust marker of euthyroid hormone levels. All healthy volunteers participating in our study had normal serum TSH levels indicating normal thyroid function. However, measuring levels of free thyroxin (free T4) and free liothyronine (free T3) allows a more detailed overview of thyroid function. The population based reference ranges for free T4 and free T3 are relatively large (25–27) suggesting potential effects on metabolism. We therefore investigated whether these differences in levels of free T4 and free T3 affect human thermogenesis.
Previously, we and others were able to demonstrate that REE is reduced in hypothyroidism and that restoring euthyroidism normalizes REE in humans (17, 28). Here, higher levels of free T4 within the reference range did not lead to higher REE at room temperature in euthyroid individuals, which is in line with a recent study in a larger cohort (29). Interestingly, levels of free T3 were significantly associated with REE at room temperature. Of note, this association did not persist after multivariate correction. In a similar population as the one studied here, Roef et al. found a significant positive association of free T3 with BMI (30) which might explain this finding. As T4 is mainly converted to T3 intracellularly by DIO2 in brown adipocytes, the levels of T3 measured in serum do not necessarily reflect the levels within BAT (31).
In contrast, levels of free T4 but not free T3 were positively associated with CIT in our cohort. CIT reflects the increase in REE in response to cool environmental temperatures in order to maintain core body temperature. BAT is one of the main tissues to facilitate CIT and is a well-established target of TH action.
BAT expresses high amounts of deiodinase type 2 (DIO2) which locally converts T4 into T3 and which is induced by cold exposure (32, 33). These mechanisms are crucial for mitochondriogenesis and heat production (32). We assessed BAT activity by FDG-PET in a subset of our cohort. Indeed, we could demonstrate that higher levels of free T4 are significantly associated with a higher metabolic activity of BAT. In line with our data, circulating levels of free T4 within the reference range were significantly related to markers of white to brown adipocyte conversion in human subcutaneous adipose tissue (34).
Importantly, the main stimulus of CIT in adult humans appears to be cool environmental temperatures (21, 35, 36). Previously, we could demonstrate that in hypothyroid individuals the effect of environmental temperatures on CIT seems to be abrogated (17). Therefore, we would like to speculate that thyroid hormones facilitate the dynamic adaptations to cool temperatures also in humans. This notion is supported by findings in rats: thyroid ablation did not affect BAT function after animals had been acclimated to cool temperatures. However, if thyroid ablation was performed prior to chronic cold exposure animals exhibited blunted function of BAT (37).
Furthermore, BAT activity and CIT differ substantially between healthy individuals of comparable age and body composition. Importantly, a significant proportion of participants in our study reduced EE in response to cold exposure, i.e. had negative CIT. A recent study showed that individuals reacting with negative CIT to mild cold exposure do also reduce EE to a greater extent while fasting. The authors suggested that this phenomenon might therefore signify a “thrifty” phenotype (38).
In mice, strain specific differences in the ability to recruit BAT have been demonstrated and suggest strong genetic influences (39). In humans, genetic influences on BAT recruitment have also been demonstrated (40, 41). Still, the underlying genetic alterations, molecular mechanisms, and physiologic regulation have to be elucidated and might comprise transcription factors involved in adipocyte browning as well as thyroid hormone metabolism.
Our findings suggest, that slightly higher levels of free T4 allow for better adaptation to cold environments. An increase in CIT, e.g. by systematic mild cold exposure, has been demonstrated to improve insulin sensitivity (16) and reduce body fat mass (42). In line with these findings, large cohort studies in China and Belgium demonstrated favorable effects of higher levels of thyroxine within the reference range, in euthyroid individuals (11, 30), which might be facilitated in part by CIT.
Previously, exposure to severe cold in the polar regions has been demonstrated to increase TH metabolism in humans resulting in increased levels of thyroglobulin and iodine excretion. However, steady state levels of free T4 and free T3 were not increased or rather reduced in these studies (23, 24). In our cohort, levels of thyroglobulin were not associated with outdoor temperature or CIT, but free T4 was weakly associated with temperature. It should be noted that the outdoor temperatures in the cited papers were approximately 20 to 30°C lower than in our study and might thus lead to different adaptive effects. Systematic studies of TH levels in more temperate climate zones comprise relatively few participants (43). Some of these studies also indicate a seasonal influence on thyroid hormone levels (44). More recent analysis of very large datasets imply an inverse influence of outdoor temperature on TSH (45, 46).
Our study is limited by its observational nature and we can thus not prove causality. Strengths of our study comprise the relatively large cohort of participants and the thorough and prospective measurement of REE and CIT. Furthermore, we took into account the environmental temperatures which are a major factor influencing CIT. We could find evidence that BAT activity was positively associated with levels of free T4 in a subgroup of participants whom we investigated with FDG-PET.
In conclusion, we provide evidence for a link between TH and CIT in healthy individuals. Our findings suggest that differences in the level of TH even in euthyroid individuals affect metabolism significantly and should be studied in further detail.
The datasets used and/or analyzed during the current study are available from the corresponding author on reasonable request. The request will be judged by an independent committee at the Department of Clinical Research of the University Hospital Basel to ensure that legal obligations are fulfilled.
The studies involving human participants were reviewed and approved by Ethikkommission Nordwest- und Zentralschweiz, Basel, CH. The patients/participants provided their written informed consent to participate in this study.
CIM and MJB: conceived the study, performed experiments, analyzed data, drafted the manuscript. JRS, RCL, JM, ASB, and MB: performed experiments, analyzed data. CW and IAB: conceived the study, analyzed data. MK: performed thyroid hormone measurements. All authors contributed to the article and approved the submitted version.
The study was funded by grants from the Swiss National Science Foundation (grant no. PZ00P3_167823), the Bangerter-Rhyner Foundation, Basel, and the Nora van der Meuuwen-Häfliger Foundation, Basel, to MJB. RL received a stipend from the Goldschmidt-Jacobson Foundation, Basel.
The authors declare that the research was conducted in the absence of any commercial or financial relationships that could be construed as a potential conflict of interest.
We thank Roland Vogt, PhD, of the Institute for Meteorology, Climatology and Remote Sensing at the University of Basel, for providing temperature data.
The Supplementary Material for this article can be found online at: https://www.frontiersin.org/articles/10.3389/fendo.2021.666595/full#supplementary-material
AMPK, Adenosine Monophosphate-Activated Protein Kinase; BAT, Brown Adipose Tissue; BMI, Body Mass Index; CIT, Cold Induced Thermogenesis; DIO 2, Deiodinase 2; EE, Energy Expenditure; FDG, Fluordesoxyglucose; fT3, Free Triiodothyronine; fT4, Free Thyroxine; TH, Thyroid Hormone; TSH, Thyroid Stimulating Hormone; UCP1, Uncoupling Protein 1; REE, Resting Energy Expenditure.
1. Mullur R, Liu YY, Brent GA. Thyroid Hormone Regulation of Metabolism. Physiol Rev (2014) 94(2):355–82 doi: 10.1152/physrev.00030.2013
2. López M, Varela L, Vázquez MJ, Rodríguez-Cuenca S, González CR, Velagapudi VR, et al. Hypothalamic AMPK and Fatty Acid Metabolism Mediate Thyroid Regulation of Energy Balance. Nat Med (2010) 16(9):1001. doi: 10.1038/nm.2207
3. Comte B, Vidal H, Laville M, Riou J-P. Influence of Thyroid Hormones on Gluconeogenesis From Glycerol in Rat Hepatocytes: A Dose-Response Study. Metabolism (1990) 39(3):259–63. doi: 10.1016/0026-0495(90)90044-D
4. Hellstroöm L, Wahrenberg H, Reynisdottir S, Arner P. Catecholamine-Induced Adipocyte Lipolysis in Human Hyperthyroidism*. J Clin Endocrinol Metab (1997) 82(1):159–66. doi: 10.1210/jc.82.1.159
5. Wolf M, Weigert A, Kreymann G. Body Composition and Energy Expenditure in Thyroidectomized Patients During Short-Term Hypothyroidism and Thyrotropin-Suppressive Thyroxine Therapy. Eur J Endocrinol (1996) 134(2):168–73. doi: 10.1530/eje.0.1340168
6. Wahrenberg H, Wennlund A, Arner P. Adrenergic Regulation of Lipolysis in Fat Cells From Hyperthyroid and Hypothyroid Patients. J Clin Endocrinol Metab (1994) 78(4):898–903. doi: 10.1210/jcem.78.4.8157718
7. Mcculloch AJ, Johnston DG, Baylis PH, Kendalltaylor P, Clark F, Young ET, et al. Evidence That Thyroid-Hormones Regulate Gluconeogenesis From Glycerol in Man. Clin Endocrinol (Oxf) (1983) 19(1):67–76. doi: 10.1111/j.1365-2265.1983.tb00744.x
8. Mehran L, Amouzegar A, Bakhtiyari M, Mansournia MA, Rahimabad PK, Tohidi M, et al. Variations in Serum Free Thyroxine Concentration Within the Reference Range Predicts the Incidence of Metabolic Syndrome in Non-Obese Adults: A Cohort Study. Thyroid (2017) 27(7):886–93. doi: 10.1089/thy.2016.0557
9. Jun JE, Jee JH, Bae JC, Jin SM, Hur KY, Lee MK, et al. Association Between Changes in Thyroid Hormones and Incident Type 2 Diabetes: A Seven-Year Longitudinal Study. Thyroid (2017) 27(1):29–38. doi: 10.1089/thy.2016.0171
10. Wolffenbuttel BHR, Wouters H, Slagter SN, van Waateringe RP, Muller Kobold AC, van Vliet-Ostaptchouk JV, et al. Thyroid Function and Metabolic Syndrome in the Population-Based Life Lines Cohort Study. BMC Endocr Disord (2017) 17(1):65. doi: 10.1186/s12902-017-0215-1
11. Song Q, Chen X, Su Y, Xie Z, Wang S, Cui B. Age and Gender Specific Thyroid Hormones and Their Relationships With Body Mass Index in a Large Chinese Population. Int J Endocrinol Metab (2019) 17(1):e66450–e. doi: 10.5812/ijem.66450
12. Silva JE. Thermogenic Mechanisms and Their Hormonal Regulation. Physiol Rev (2006) 86(2):435–64. doi: 10.1152/physrev.00009.2005
13. Betz MJ, Enerback S. Targeting Thermogenesis in Brown Fat and Muscle to Treat Obesity and Metabolic Disease. Nat Rev Endocrinol (2018) 14(2):77–87. doi: 10.1038/nrendo.2017.132
14. Fedorenko A, Lishko PV, Kirichok Y. Mechanism of Fatty-Acid-Dependent UCP1 Uncoupling in Brown Fat Mitochondria. Cell (2012) 151(2):400–13. doi: 10.1016/j.cell.2012.09.010
15. Kooijman S, Wang Y, Parlevliet ET, Boon MR, Edelschaap D, Snaterse G, et al. Central GLP-1 Receptor Signalling Accelerates Plasma Clearance of Triacylglycerol and Glucose by Activating Brown Adipose Tissue in Mice. Diabetologia (2015) 58(11):2637–46. doi: 10.1007/s00125-015-3727-0
16. Hanssen MJ, Hoeks J, Brans B, van der Lans AA, Schaart G, van den Driessche JJ, et al. Short-Term Cold Acclimation Improves Insulin Sensitivity in Patients With Type 2 Diabetes Mellitus. Nat Med (2015) 21(8):863–5. doi: 10.1038/nm.3891
17. Maushart CI, Loeliger R, Gashi G, Christ-Crain M, Betz MJ. Resolution of Hypothyroidism Restores Cold-Induced Thermogenesis in Humans. Thyroid (2019) 29(4):493–501. doi: 10.1089/thy.2018.0436
18. Gashi G, Madoerin P, Maushart CI, Michel R, Senn JR, Bieri O, et al. Mri Characteristics of Supraclavicular Brown Adipose Tissue in Relation to Cold-Induced Thermogenesis in Healthy Human Adults. J Magn Reson Imaging (2019) 50(4):1060–1068. doi: 10.1002/jmri.26733
19. Balaz M, Becker AS, Balazova L, Straub L, Muller J, Gashi G, et al. Inhibition of Mevalonate Pathway Prevents Adipocyte Browning in Mice and Men by Affecting Protein Prenylation. Cell Metab (2019) 29(4):901–16.e8. doi: 10.1016/j.cmet.2018.11.017
20. R-Core-Team. R: A Language and Environment for Statistical Computing. 3.4.1 ed. Vienna, Austria: R Foundation for Statistical Computing (2017)
21. Senn JR, Maushart CI, Gashi G, Michel R, Lalive d’Epinay M, Vogt R, et al. Outdoor Temperature Influences Cold Induced Thermogenesis in Humans. Front Physiol (2018) 9:1184. doi: 10.3389/fphys.2018.01184
22. van Marken Lichtenbelt WD, Schrauwen P, van De Kerckhove S, Westerterp-Plantenga MS. Individual Variation in Body Temperature and Energy Expenditure in Response to Mild Cold. Am J Physiol Endocrinol Metab (2002) 282(5):E1077–83. doi: 10.1152/ajpendo.00020.2001
23. Andersen S, Kleinschmidt K, Hvingel B, Laurberg P. Thyroid Hyperactivity With High Thyroglobulin in Serum Despite Sufficient Iodine Intake in Chronic Cold Adaptation in An Arctic Inuit Hunter Population. Eur J Endocrinol (2012) 166(3):433–40. doi: 10.1530/EJE-11-0888
24. Do NV, Mino L, Merriam GR, LeMar H, Case HS, Palinkas LA, et al. Elevation in Serum Thyroglobulin During Prolonged Antarctic Residence: Effect of Thyroxine Supplement in the Polar 3,5,3’-Triiodothyronine Syndrome. J Clin Endocrinol Metab (2004) 89(4):1529–33. doi: 10.1210/jc.2003-031747
25. Wilke TJ. Influence of Age and Sex on the Concentration of Free Thyroxin in Serum and on the Free Thyroxin: Total Thyroxin Ratio. Clin Chem (1983) 29(7):1428–30. doi: 10.1093/clinchem/29.7.1428
26. Meier CA, Maisey MN, Lowry A, Muller J, Smith MA. Interindividual Differences in the Pituitary-Thyroid Axis Influence the Interpretation of Thyroid Function Tests. Clin Endocrinol (Oxf) (1993) 39(1):101–7. doi: 10.1111/j.1365-2265.1993.tb01758.x
27. Hoermann R, Eckl W, Hoermann C, Larisch R. Complex Relationship Between Free Thyroxine and TSH in the Regulation of Thyroid Function. Eur J Endocrinol (2010) 162(6):1123–9. doi: 10.1530/EJE-10-0106
28. Broeders EP, Vijgen GH, Havekes B, Bouvy ND, Mottaghy FM, Kars M, et al. Thyroid Hormone Activates Brown Adipose Tissue and Increases Non-Shivering Thermogenesis–A Cohort Study in A Group of Thyroid Carcinoma Patients. PLoS One (2016) 11(1):e0145049. doi: 10.1371/journal.pone.0145049
29. Spadafranca A, Cappelletti C, Leone A, Vignati L, Battezzati A, Bedogni G, et al. Relationship Between Thyroid Hormones, Resting Energy Expenditure and Cardiometabolic Risk Factors in Euthyroid Subjects. Clin Nutr (2015) 34(4):674–8. doi: 10.1016/j.clnu.2014.07.014
30. Roef GL, Rietzschel ER, Van Daele CM, Taes YE, De Buyzere ML, Gillebert TC, et al. Triiodothyronine and Free Thyroxine Levels Are Differentially Associated With Metabolic Profile and Adiposity-Related Cardiovascular Risk Markers in Euthyroid Middle-Aged Subjects. Thyroid (2014) 24(2):223–31. doi: 10.1089/thy.2013.0314
31. Gereben BZ, Zavacki AM, Ribich S, Kim BW, Huang SA, Simonides WS, et al. Cellular and Molecular Basis of Deiodinase-Regulated Thyroid Hormone Signaling1. Endocr Rev (2008) 29(7):898–938. doi: 10.1210/er.2008-0019
32. de Jesus LA, Carvalho SD, Ribeiro MO, Schneider M, Kim SW, Harney JW, et al. The Type 2 Iodothyronine Deiodinase Is Essential for Adaptive Thermogenesis in Brown Adipose Tissue. J Clin Invest (2001) 108(9):1379–85. doi: 10.1172/JCI200113803
33. Louzada RA, Santos MC, Cavalcanti-de-Albuquerque JP, Rangel IF, Ferreira AC, Galina A, et al. Type 2 Iodothyronine Deiodinase Is Upregulated in Rat Slow- and Fast-Twitch Skeletal Muscle During Cold Exposure. Am J Physiol Endocrinol Metab (2014) 307(11):E1020–9. doi: 10.1152/ajpendo.00637.2013
34. Martínez-Sánchez N, Moreno-Navarrete JM, Contreras C, Rial-Pensado E, Fernø J, Nogueiras R, et al. Thyroid Hormones Induce Browning of White Fat. J Endocrinol (2016) 232(2):351–62. doi: 10.1530/JOE-16-0425
35. Yoneshiro T, Matsushita M, Nakae S, Kameya T, Sugie H, Tanaka S, et al. Brown Adipose Tissue is Involved in the Seasonal Variation of Cold-Induced Thermogenesis in Humans. Am J Physiol Regul Integr Comp Physiol (2016) 310(10):R999–1009. doi: 10.1152/ajpregu.00057.2015
36. van Ooijen AM, van Marken Lichtenbelt WD, van Steenhoven AA, Westerterp KR. Seasonal Changes in Metabolic and Temperature Responses to Cold Air in Humans. Physiol Behav (2004) 82(2-3):545–53. doi: 10.1016/j.physbeh.2004.05.001
37. Zaninovich AA, Raices M, Rebagliati I, Ricci C, Hagmuller K. Brown Fat Thermogenesis in Cold-Acclimated Rats Is Not Abolished by the Suppression of Thyroid Function. Am J Physiol Endocrinol Metab (2002) 283(3):E496–502. doi: 10.1152/ajpendo.00540.2001
38. Hollstein T, Heinitz S, Ando T, Rodzevik TL, Basolo A, Walter M, et al. Metabolic Responses to 24-Hour Fasting and Mild Cold Exposure in Overweight Individuals Are Correlated and Accompanied by Changes in FGF21 Concentration. Diabetes (2020) 69(7):1382–8. doi: 10.2337/db20-0153
39. Guerra C, Koza RA, Yamashita H, Walsh K, Kozak LP. Emergence of Brown Adipocytes in White Fat in Mice Is Under Genetic Control. Effects on Body Weight and Adiposity. J Clin Invest (1998) 102(2):412–20. doi: 10.1172/JCI3155
40. Bakker LE, Boon MR, van der Linden RA, Arias-Bouda LP, van Klinken JB, Smit F, et al. Brown Adipose Tissue Volume in Healthy Lean South Asian Adults Compared With White Caucasians: A Prospective, Case-Controlled Observational Study. Lancet Diabetes Endocrinol (2014) 2(3):210–7. doi: 10.1016/S2213-8587(13)70156-6
41. Claussnitzer M, Dankel SN, Kim K-H, Quon G, Meuleman W, Haugen C, et al. FTO Obesity Variant Circuitry and Adipocyte Browning in Humans. N Engl J Med (2015) 373(10):895–907. doi: 10.1056/NEJMoa1502214
42. Yoneshiro T, Aita S, Matsushita M, Kayahara T, Kameya T, Kawai Y, et al. Recruited Brown Adipose Tissue as An Antiobesity Agent in Humans. J Clin Invest (2013) 123(8):3404–8. doi: 10.1172/JCI67803
43. Andersen S, Bruun NH, Pedersen KM, Laurberg P. Biologic Variation Is Important for Interpretation of Thyroid Function Tests. Thyroid (2003) 13(11):1069–78. doi: 10.1089/105072503770867237
44. Smals A, Ross H, Kloppenborg P. Seasonal Variation in Serum T3 and T4 Levels in Man. J Clin Endocrinol Metab (1977) 44(5):998–1001. doi: 10.1210/jcem-44-5-998
45. Wang D, Cheng X, Yu S, Qiu L, Lian X, Guo X, et al. Data Mining: Seasonal and Temperature Fluctuations in Thyroid-Stimulating Hormone. Clin Biochem (2018) 60:59–63. doi: 10.1016/j.clinbiochem.2018.08.008
Keywords: brown adipose tissue, cold adaptation, cold induced thermogenesis, energy expenditure, thyroid hormone, thyroxine
Citation: Maushart CI, Senn JR, Loeliger RC, Kraenzlin ME, Müller J, Becker AS, Balaz M, Wolfrum C, Burger IA and Betz MJ (2021) Free Thyroxine Levels are Associated with Cold Induced Thermogenesis in Healthy Euthyroid Individuals. Front. Endocrinol. 12:666595. doi: 10.3389/fendo.2021.666595
Received: 05 March 2021; Accepted: 20 April 2021;
Published: 14 June 2021.
Edited by:
Douglas Forrest, National Institutes of Health (NIH), United StatesReviewed by:
Eric Fliers, Amsterdam University Medical Center, NetherlandsCopyright © 2021 Maushart, Senn, Loeliger, Kraenzlin, Müller, Becker, Balaz, Wolfrum, Burger and Betz. This is an open-access article distributed under the terms of the Creative Commons Attribution License (CC BY). The use, distribution or reproduction in other forums is permitted, provided the original author(s) and the copyright owner(s) are credited and that the original publication in this journal is cited, in accordance with accepted academic practice. No use, distribution or reproduction is permitted which does not comply with these terms.
*Correspondence: Matthias Johannes Betz, TWF0dGhpYXMuQmV0ekB1c2IuY2g=
Disclaimer: All claims expressed in this article are solely those of the authors and do not necessarily represent those of their affiliated organizations, or those of the publisher, the editors and the reviewers. Any product that may be evaluated in this article or claim that may be made by its manufacturer is not guaranteed or endorsed by the publisher.
Research integrity at Frontiers
Learn more about the work of our research integrity team to safeguard the quality of each article we publish.