
95% of researchers rate our articles as excellent or good
Learn more about the work of our research integrity team to safeguard the quality of each article we publish.
Find out more
ORIGINAL RESEARCH article
Front. Endocrinol. , 11 March 2021
Sec. Obesity
Volume 12 - 2021 | https://doi.org/10.3389/fendo.2021.642568
 Alessio Basolo1,2*†
 Takafumi Ando1,3†
 Douglas C. Chang1Tim Hollstein1Jonathan Krakoff1
 Paolo Piaggi1,4
 Susanne Votruba1
Objective: Circulating albumin is negatively associated with adiposity but whether it is associated with increased energy intake, lower energy expenditure or weight gain has not been examined.
Methods: In study 1 (n=238; 146 men), we evaluated whether fasting albumin concentration was associated with 24-h energy expenditure and ad libitum energy intake. In study 2 (n=325;167 men), we evaluated the association between plasma albumin and change in weight and body composition.
Results: After adjustment for known determinants of energy intake lower plasma albumin concentration was associated with greater total daily energy intake (β= 89.8 kcal/day per 0.1 g/dl difference in plasma albumin, p=0.0047). No associations were observed between plasma albumin concentrations and 24-h energy expenditure or 24-h respiratory quotient (p>0.2). Over 6 years, volunteers gained on average 7.5 ± 11.7 kg (p<0.0001). Lower albumin concentrations were associated with greater weight [β=3.53 kg, p=0.039 (adjusted for age, sex, follow up time), CI 0.16 to 6.21 per 1 g/dl difference albumin concentration] and fat mass (β=2.3 kg, p=0.022), respectively, but not with changes in fat free mass (p=0.06).
Conclusions: Lower albumin concentrations were associated with increased ad libitum food intake and weight gain, indicating albumin as a marker of energy intake regulation.
Clinical Trial Registration: ClinicalTrials.gov, identifiers NCT00340132, NCT00342732.
The imbalance between energy intake and expenditure leads to the development of obesity, a condition associated with various metabolic diseases (1) and low-grade chronic inflammation (2). The adipose tissue, as an endocrine organ (3), produces a variety of inflammatory markers (adipocytokines) such as tumor necrosis factor (TNF-α), interleukin 1 (IL-1) and interleukin 6 (IL-6) (4, 5). Concentrations of plasma IL-6, TNF- α and other inflammatory markers increases in proportion with the increase in body mass index (BMI) in adolescents and elderly individuals (6, 7). Importantly, inflammation may play a role in the regulation of energy balance (8). In mice, IL-6 reduced food intake and hyperphagia (9) and IL-6 and TNF- α increased energy expenditure (10).
Albumin has recently been reported as a valid marker of the inflammatory process (11, 12) although, historically, it has also been described as marker of protein malnutrition (13). Albumin is the most abundant circulating protein in healthy subjects representing nearly 50% of total protein content in the human body (11, 14). Under physiological conditions albumin is almost exclusively produced by the liver (15) and its synthesis is inhibited by proinflammatory molecules such as IL-6 and TNF- α (15). Reduced albumin levels are associated with higher percentage of body fat and adipose tissue inflammation markers such as macrophages (16), indicating that reduced albumin concentrations might be linked with the inflammatory process and development of obesity. Albumin binds ghrelin and may impact the orexigenic effects of this hormone, additionally indicating a role for albumin in appetite regulation (17).
Given its inverse association with adiposity, its positive association with markers of subclinical inflammation that may influence appetite and its role in binding ghrelin, we investigated whether albumin concentration might be a determinant of factors that affect energy balance including 24-h energy expenditure and its components, assessed by a whole-room indirect calorimeter, and ad libitum food intake, assessed by using a validated, highly reproducible computerized vending machine paradigm over 3 days. After finding that reduced albumin was associated with greater ad libitum food intake, we then evaluated whether albumin concentration predicted future changes in body weight and body composition.
The study population included 238 adults, most of whom were Native Americans, admitted to clinical trial NCT00342732 from 1999 to 2017 (The Food Intake Phenotype: Assessing Eating Behavior and Food Preferences as Risk Factors for Obesity) (Study 1). For this current analysis, we included those (age <65 years) who had valid measures of energy expenditure and substrate oxidation in eucaloric conditions, assessed by whole-room indirect calorimeter (18) and valid measures of ad libitum food intake measurement over a 3-day period assessed by a validated, highly reproducible, computerized vending machine paradigm (19) (Figure 1, Supplemental Material).
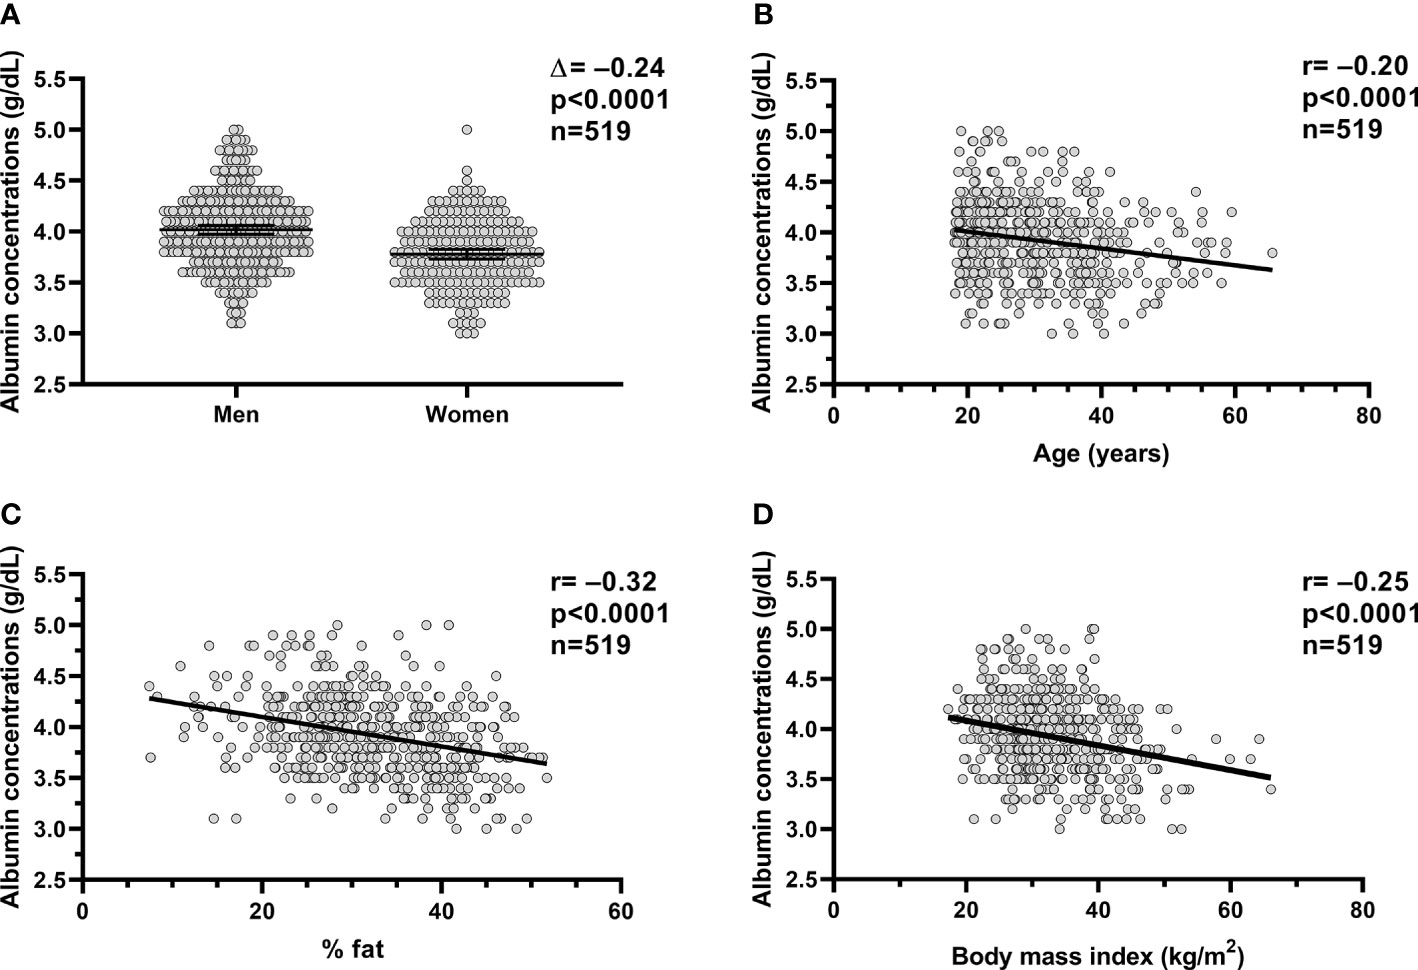
Figure 1 Relationships between plasm albumin concentrations and body composition and age. Relationships between plasma albumin concentration (g/dl) and sex (A), age (B), percent body fat (C) and BMI (D). In each panel, the Pearson’s correlation coefficient (r) is reported along with its significance (p). The dots in each panel are referring to the volunteers (n=519) who completed the inpatient part of the studies (study 1 and study 2). %fat, percentage body fat; BMI, body mass index.
The second cohort included 325 adult Native Americans who participated in an ongoing longitudinal clinical trial NCT00340132 (Cross-sectional and longitudinal studies of “pre-diabetes”) (Study 2) from 1983 to 2009 to evaluate the risk factors for type 2 diabetes and obesity who had follow-up measured of adiposity (Figure 1, Supplemental Material). The participants were admitted to the clinical research unit as previously described (20). All 325 volunteers completed the inpatient study and returned for follow up visits. A DXA scan for the measurement of body weight and body composition (FM and FFM) was performed at baseline and follow up visit. For the current analysis, we included only those with age ≥ 18 years who were diabetes-free at baseline and follow-up based on oral glucose tolerance test (OGTT).
The volunteers for both study protocols were recruited from the greater Phoenix area and were healthy other than obesity and impaired glucose tolerance, based on medical history and laboratory testing. In particular, the measurement of serum creatinine concentration and electrocardiography were performed to evaluate renal and cardiac function, respectively.
Also, the volunteers were not actively smoking cigarettes or on medications at the time of the inpatient evaluation. Both study protocols were approved by the Institutional Review Board of the National Institute of Diabetes and Digestive and Kidney Diseases (NIDDK). Written and informed consent was signed by the volunteers prior to admission for each study.
In both studies, plasma albumin concentration was measured in the fasting state at admission and was available for all the participants (Figure 1, Supplemental Material). Volunteers were fed a standard weight-maintaining diet (50% carbohydrate, 30% fat, and 20% protein) upon admission. A unit-specific equation (21) based on body weight and sex was used to calculate the weight maintaining energy needs (WMEN) for each participant and intake was adjusted as needed to ensure a body weight within 1% of the admission weight. After 3 days on a weight-maintaining diet, a 75-g oral glucose tolerance test was performed to assess glucose tolerance according to the American Diabetes Association criteria (22) and subjects with diabetes were excluded.
In study 1, dual-energy x-ray absorptiometry (DPX-1 and DPX-L; Lunar Radiation, Madison, WI) was used to assess body composition (percentage of body fat, %fat) and, hence, to calculate body fat mass (FM) and fat free mass (FFM). Fat free mass and fat mass indexes (FFMI and FMI, respectively) were calculated by dividing the respective masses by height squared. In study 2, body composition was assessed by hydro-densitometry (23) or by total body dual-energy X-ray absorptiometry (DPX-L; Lunar Radiation, Madison, WI). The absorptiometry measures were converged to comparable hydro-densitometry values, using previously derived equations (24) to calculate percentage of body fat (%fat). A validated regression equation was used to make DXA data comparable among diverse DXA machine (25) to account for the usage of different DXA machine over the course of the studies. Body mass index (BMI; kg/m2) was calculated by measured height and weight.
The glucose oxidase method (Glucose analyzer GM9, Analox Instruments; Lunenberg, MA; Beckman Instruments Inc., Fullerton, California, USA) was used to measure plasma glucose concentration. Plasma albumin was measured by the bromocresol purple method (Monarch Chemistry analyzer, Instrumentation Laboratory, Lexington, MA; DADE Behring Dimension RxL Chemistry analyzer, Siemens Medical Solutions, Malvern, PA).
To measure 24-h energy expenditure (24-h EE), participants of study 1 spent approximately 23.5 h inside a whole-room indirect calorimeter as previously described (18). To account for reduced physical activity inside the chamber, predefined energy intake in the metabolic chamber was approximately 80% of the weight maintaining diet and based on previously developed equation (26). All unconsumed food was returned to the metabolic kitchen for weighing for an accurate calculation of intake. To calculate 24-h EE and 24-h RQ, carbon dioxide production and oxygen consumption were extrapolated to 24 h. Energy intake minus 24-h EE was defined as 24-h energy balance (ENBAL). The volunteers with ENBAL greater than 20% were excluded from the analysis involving energy expenditure and respiratory quotient. From the 24-h RQ, 24-h carbohydrate oxidation (24-h CARBOX) and lipid oxidation (24-h LIPOX) rates were calculated accounting for 24-h protein oxidation (24-h PROTOX) obtained by the measurement of 24-h urinary nitrogen excretion as previously described (27). Radar sensors were used to detect spontaneous physical activity (SPA) expressed as the percentage of time over the 24-h period in which activity was detected. The average energy expenditure between 2330 and 0500 during which SPA was < 1.5% was defined as sleeping metabolic rate (SMR).
To assess ad libitum food intake for a 3-day period in participants of study 1, a highly reproducible, validated and computerized vending machine paradigm (19, 28) was used. On the admission day, a food selection questionnaire in which a 9-point Likert scale (1=dislike extremely, 5=neutral, 9=like extremely) to assess the food preferences of each participant was given to rate each food item. During the 3-day period, the 40 different food items rated by participants as intermediate with score 4-8 were stocked in an individual-specific, computer-operated vending machines. The volunteers had free access to food for 23.5 h (30 min/day were needed to load the vending machine by the kitchen staff members). Prior to stocking the vending machines, the kitchen staff weighed all food and the leftovers (any uneaten food by the participants) were also weighed at the end of the vending day to precisely estimate the actual intake. The CBORD Professional Diet Analyzer Program (CBORD, Inc., Ithaca, NY, USA) and the Food Processor database (ESHA version 10.0.0, ESHA Research, Salem, OR, USA) were used to calculate the daily total and individual macronutrient kilocalories consumed. The average total ad libitum food intake over 3 days was calculated and expressed as total kcal eaten daily. Similar calculations were performed for each macronutrient intake (carbohydrate, fat, and protein). The total energy intake was also expressed as percentage of the WMEN determined prior to the 3-day vending period.
Statistical analyses were performed using SAS software (SAS 9.3, Enterprise guide version 5.1; SAS Institute, Cary, NC). Data are expressed as mean ± SD or mean with 95% confidence interval (CI). Student’s t-test and ANOVA were used to evaluate differences according to gender and ethnicity, respectively. Associations between normally distributed quantitative variables were assessed by the Pearson’s correlation coefficient. To assess the independent determinants of plasma albumin concentrations, we performed multivariate linear regression analysis including age, sex, ethnicity, and body fat as predictors.
Multivariate regression analysis was also performed to assess the associations between plasma albumin concentrations and total ad libitum food intake and macronutrient intakes adjusting for their known determinants (i.e., age, sex, ethnicity, FFMI, and FMI) (29). Pearson’s correlation coefficient was then calculated to quantify the relationships between plasma albumin and residual values of food intake measures.
The change in body weight as well as the change in fat mass, fat free mass (expressed in kg) and waist circumference (expressed in cm), were calculated as the difference between the follow-up and the baseline measures recorded during the inpatient admission. Linear regression analysis was first used to calculate adjusted values (i.e., residuals) of changes in body weight, fat mass, fat free mass and waist circumference at follow-up after adjustment for baseline age, sex, and follow-up time. Specifically, adjusted values were calculated after adding the average of each variable to the residuals calculated by the aforementioned regression models.
Characteristics of the whole study group (study 1+study 2) and of each study separately, are reported in Table 1. On average, participants were young (30.4 ± 9.3 years) with obesity (33.1 ± 7.9 kg/m2). The expected differences in body composition were observed between men and women in both studies, such that women had higher fat mass and lower fat free mass compared to men. In the situation where a few individuals participated in both studies, only the first visit was included for the analysis and reported in the demographic table.

Table 1 Demographic and anthropometric characteristics of the combined study cohorts.
In the whole study group (study 1+study 2), plasma albumin concentration measured on the day of admission was on average 3.9 ± 0.4 g/dl and diverged by sex (p<0.0001, Figure 1A), such as the plasma albumin concentrations were on average lower in women compared to men by approximately 6% (Δ=−0.24 g/dl, CI: −0.30 to −0.17). Plasma albumin concentrations were negatively associated with age (r=−0.20, p<0.0001, Figure 1B), %fat (r= −0.32, p<0.0001, Figure 1C), and BMI (r=−0.25, p<0.0001, Figure 1D).
In a multivariable model, age (p<0.0001), sex (p=0.0007), and %fat (p<0.0001) were independent determinants of plasma albumin concentrations (total r2 = 0.18) as opposed to ethnicity (p=0.4).
Similar results were observed when study 1 and study 2 were analyzed separately.
In the 238 volunteers who completed study 1 and had a valid assessment of metabolic chamber measures, no associations were observed between plasma albumin concentrations and 24-h EE and 24h RQ, CARBOX, LIPOX, or PROTOX (all p>0.2). Similar results were obtained after adjustment for their known determinants (all p>0.3).
The ad libitum food intake of the participants of study 1 are reported in Table 2. The average, daily, total ad libitum energy intake on the vending machines was 3958 ± 1403 kcal/day (or 119 ± 37% when expressed as percentage of WMEN) and was lower in women compared to men by approximately 30%.
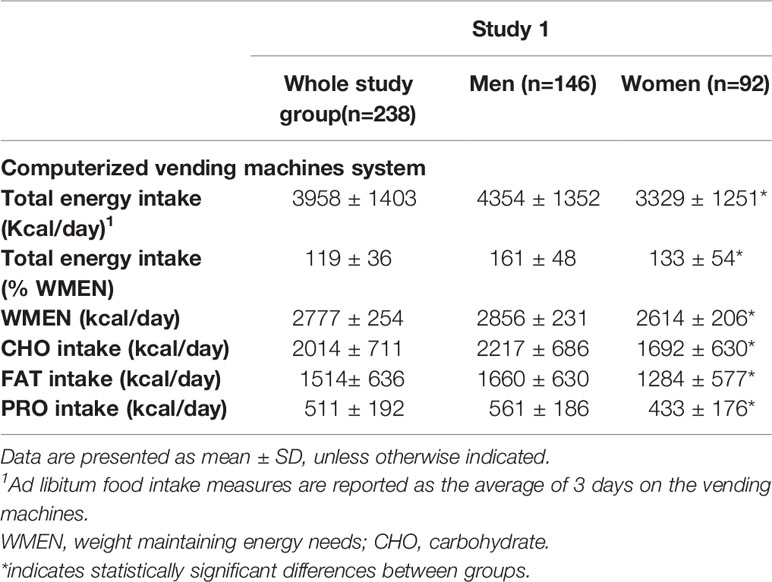
Table 2 Measures of ad libitum food intake by the computerized vending machine system.
Lower plasma albumin concentration was associated with higher total energy intake on the vending machines (β= 89.8 kcal/day per 0.1 g/dl reduction in plasma albumin, p=0.0047, Figure 2A), reflecting higher carbohydrate (β= 44.0 kcal/day, p=0.0078, Figure 2B), fat (β= 33.8 kcal/day, p=0.023, Figure 2C) and protein (β= 13.8 kcal/day, p=0.001, Figure 2D) intake after adjustment for their known determinants (age, sex, ethnicity, FMI, and FFMI). Also, lower albumin correlated with higher %WMEN (r=-0.2, p=0.002) after adjustment for age and sex.
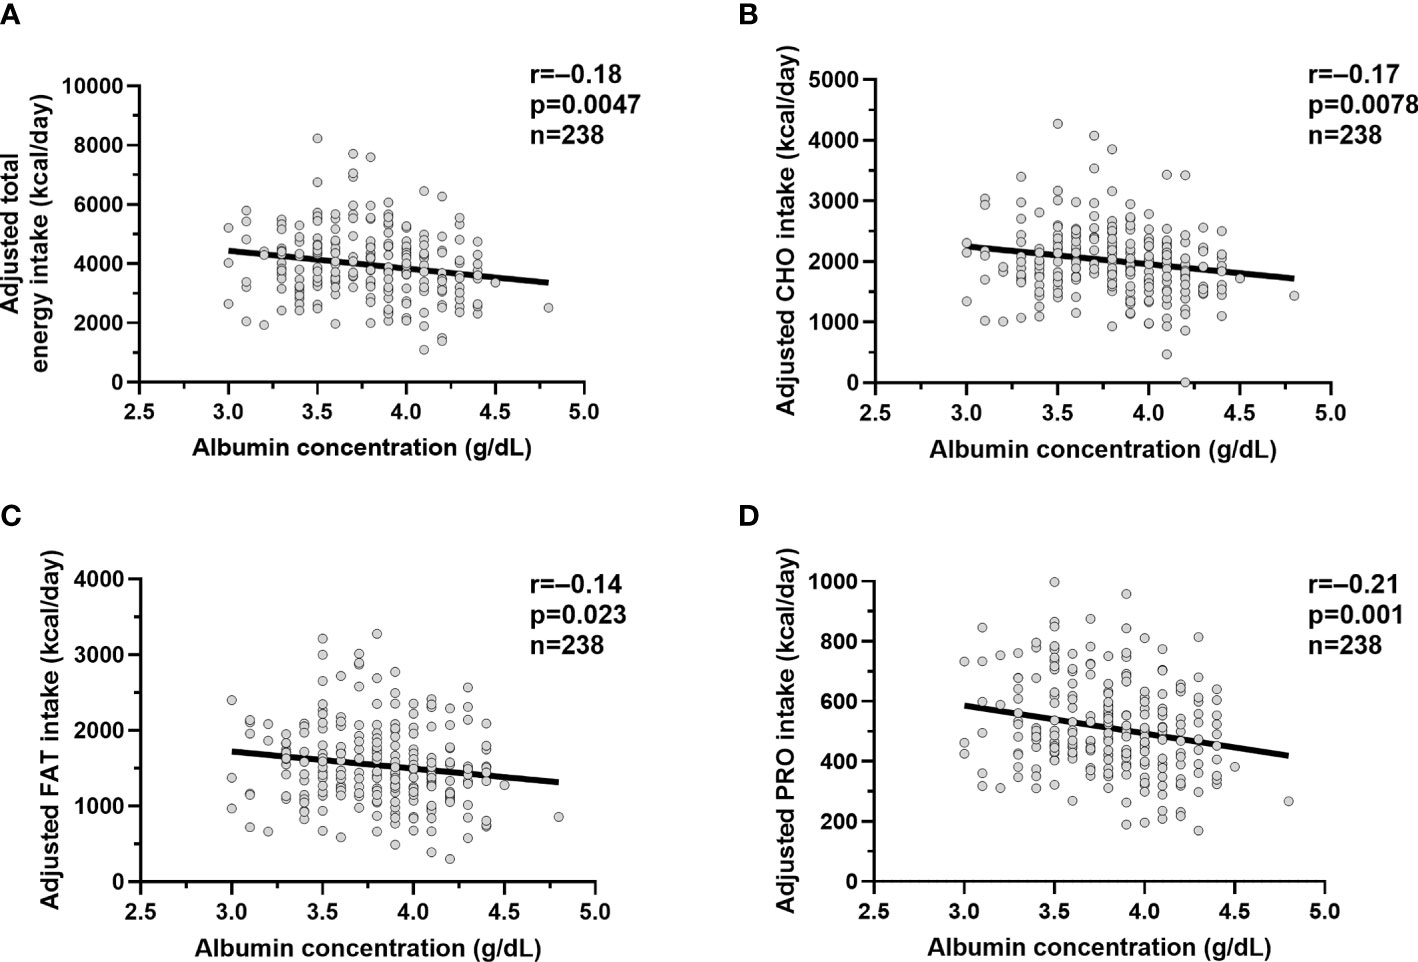
Figure 2 Relationships between albumin concentrations and ad libitum food intake measures. Relationships between plasma albumin concentration (g/dl) and adjusted total ad libitum food intake (A), adjusted carbohydrate intake (B), adjusted fat intake (C) and adjusted protein intake (D). The total ad libitum food intake and each macronutrient intake during the 3-day vending period are expressed as the average over 3 days. The adjusted food and macronutrient intake values were calculated via linear regression analysis including fat-free mass, fat mass, age, sex, ethnicity after adding the average total food and macronutrient intake to the residual values obtained from the regression model. In each panel, the Pearson’s correlation coefficient (r) is reported along with its significance (p).
We did not observe any difference between plasma albumin and total daily energy intake (adjusted for age, sex, FMI, and FFMI) in the five different ethnic groups (albumin × ethnicity interaction term p=0.12).
Since lower albumin was associated with greater ad libitum food intake, we evaluated whether reduced albumin was associated future weight gain. In study 2, mean body weight and BMI at baseline were 64.2 ± 23.4 kg and 33.8 ± 7.7 kg/m2, respectively. At the follow up visit after ~6 years (median 5.8 years IQR 2.87 to 7.8), subjects gained on average 7.5 ± 11.7 kg (p<0.0001) reflecting an increase in FM (+3.6 ± 7.4 kg, p<0.0001), FFM (+3.2 ± 5.8 kg, p<0.0001), and waist circumference (+7.2 ± 9.5 cm, p<0.0001). After adjustment for age, sex and follow up time, lower albumin concentrations were associated with increase in weight (β=3.53 kg, p=0.039, CI 0.16 to 6.21 per 1 g/dl difference albumin concentration, Figure 3A) and fat mass (β=2.3 kg, p=0.022, CI 0.36 to 4.24, Figure 3B), respectively, but not FFM (p=0.06, Figure 3C) or waist circumference (p=0.07, Figure 3D).
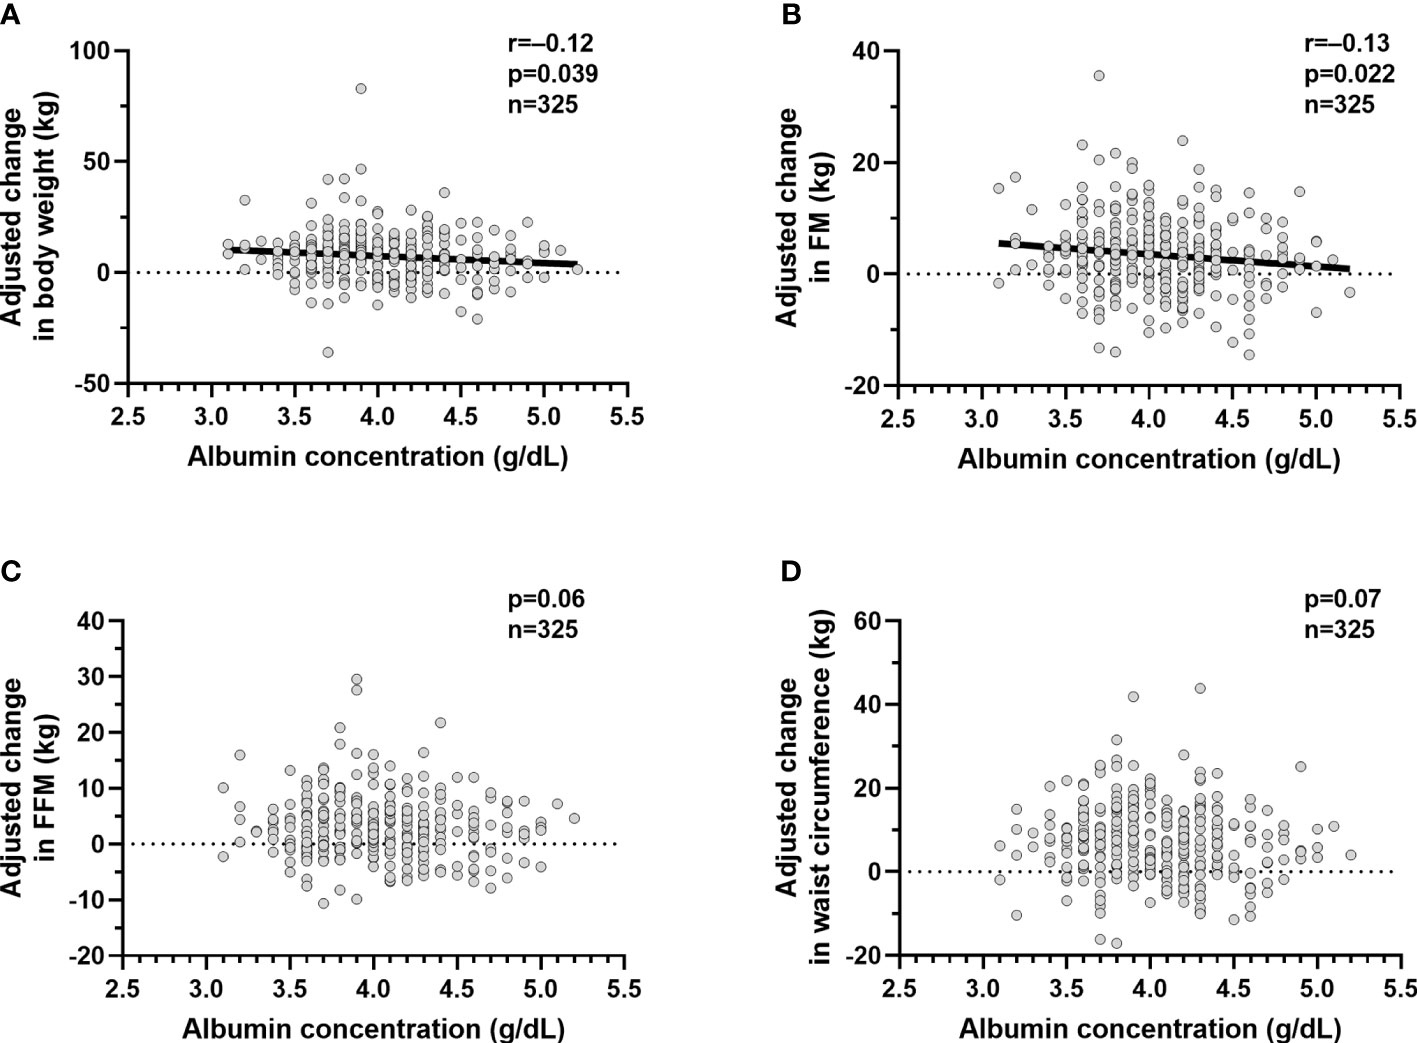
Figure 3 Relationships between plasma albumin concentrations and change in body weight and body composition. Relationships between plasma albumin concentration (g/dl) and adjusted mean change in body weight (A), adjusted mean change in fat mass (B), adjusted mean change in fat free mass (C) and adjusted mean change in waist circumference (D). The adjusted mean change in body weight, fat mass,fat free mass and waist circumference values were calculated via linear regression analysis including age, sex, follow up time in years after adding the average of the mean change in body weight, mean change in fat mass, mean change in fat free mass and mean change in and waist circumference to the residual values obtained from the regression model. In each panel, the Pearson’s correlation coefficient (r) is reported along with its significance (p). The dots represent values for the volunteers who completed the inpatient part of study 1 (n=325) and who returned for the follow up visit (n=325). The participants recruited were only Native Americans.
In healthy adults, plasma albumin was not associated with 24-h energy expenditure or substrate oxidation, but lower albumin concentration was associated with greater ad libitum energy intake. Lower plasma albumin concentration was also associated with greater weight and fat mass gain over 6 years.
No previous studies have demonstrated that albumin predicts long-term weight change. Since reduced albumin has also been associated with the development of type 2 diabetes (16), the results further suggest that weight gain may be mediating future risk of type 2 diabetes found in prior studies.
Weight gain must be due to reduced energy expenditure or greater energy intake or a combination of the two. We evaluated both sides of the energy balance equation and found that reduced albumin was associated with greater ad libitum food intake but not energy expenditure. Though the mechanism linking reduced albumin and weight gain is unclear, these results indicate that reduced albumin may influence appetite regulation. Since lower albumin is associated with higher inflammation (e.g. Il-6) which is known to suppress energy intake (9, 30), we would have expected food intake to be suppressed if the mechanism was related to inflammation. Alternatively, the mechanism may be related to albumin’s ability to binds a host of substances including hormones known to alter appetite (e.g. thyroxine, glucocorticoids) (31–33). Albumin may serves as a carrier-ligand for these substances providing transport to sites of action, metabolism, and excretion (34). Albumin-ghrelin binding has been shown to impair ghrelin biological activity (17). Reduced circulating albumin may result in less albumin-ghrelin interaction and thus greater ghrelin availability and activity of ghrelin stimulating appetite (17). Albumin also binds fatty acids (35) which have been implicated as signaling molecules for hypothalamic appetite regulation (36). Oleic acid (OA), a monounsaturated peripheral circulating fatty acid, has been shown to affect food intake in rodent models. Central administration of OA reduced food intake (37–39) through the increase in the gene expression of pro-opiomelanocortin (POMC) which is a known anorexigenic pathways. Although there is high affinity of albumin for fatty acids in circulation, experimental findings indicate that albumin may facilitate availability of these substrates at target organs (40). We might then also speculate that decreased circulating albumin might influence energy intake via fatty acids as a signal for nutrient availability. Thus, potential mechanisms may be related to albumin’s carrier functions or interactions with hormones known to regulate appetite such as ghrelin and other molecules such as fatty acids.
We also evaluated the anthropometric determinants of plasma albumin concentration. Few studies in literature have investigated the relationship between albumin and body composition.
In elderly patients hospitalized in a rehabilitation unit, serum albumin was not associated with lean mass or appendicular skeletal muscles mass (41). Recently, two recent studies showed a negative correlation between serum albumin and BMI (42, 43). Also, it has been shown that plasma albumin concentration is negatively associated with percentage body fat in Native American population (16). In line with these latter findings, we confirmed that lower plasma albumin is associated with higher percent of body fat, but not with fat free mass.
One of the strengths of the present study is the large cohort of healthy participants, allowing this analysis to fully examine circulating plasma albumin concentrations as a predictor of weight change and as a predictor of short-term ad libitum intake in humans. Furthermore, the measurements of energy metabolism and ad libitum food intake were performed in a carefully controlled inpatient setting using very accurate and highly reproducible methods including measurements of EE over 24 h in a whole-room indirect calorimeter, as well as measurements of ad libitum food intake over 3 days using computerized vending machines.
Despite the strengths, our study has several limitations. Only baseline albumin was measured, thus the association between albumin and body weight change might be altered after accounting for repeated measurement over time. Furthermore, the study did not evaluate orexigenic/anorexigenic hormones or other serum inflammatory markers besides albumin. Moreover, although the correlation coefficients were not strong, the statistically significant associations indicate that the study had sufficient sample size to detect these associations.
Finally, we could not assess in vivo interactions between albumin and hormones known to influence appetite, so the precise mechanism remains unclear.
In conclusion, in a large cohort of overweight but otherwise healthy subjects, lower albumin concentration was associated with future weight and fat mass gain. This may be due to an increase in ad libitum food and macronutrient intake, also associated with plasma albumin levels. These results suggest that albumin might be considered a marker of energy intake playing a role in the regulation of energy balance equation and in regulating weight change and possibly suggesting a biological reason for the “non adherence” to dietary prescriptions in persons with obesity.
The raw data supporting the conclusions of this article will be made available by the authors, without undue reservation.
The studies involving human participants were reviewed and approved by National Institute of Diabetes and Digestive and Kidney Diseases, National Institutes of Health (NIH). The patients/participants provided their written informed consent to participate in this study.
AB and TA analyzed and interpreted data and wrote the manuscript. DC, PP, and TH assisted with the interpretation of the data and revised the manuscript. SV and JK designed the two clinical protocols, supported with the interpretation of the data, and reviewed the manuscript. SV edited the manuscript and interpreted data. All authors contributed to the article and approved the submitted version. AB has full access to all the data in the study and take responsibility for the integrity of the data and the accuracy of the data analysis.
This work was supported by the Intramural Research Program of the National Institutes of Health, National Institute of Diabetes and Digestive and Kidney Diseases. This research was supported by the Intramural Research Program of the NIH, The National Institute of Diabetes and Digestive and Kidney Diseases (NIDDK). PP was supported by the program “Rita Levi Montalcini for young researchers” from the Italian Minister of Education and Research.
The authors declare that the research was conducted in the absence of any commercial or financial relationships that could be construed as a potential conflict of interest.
The authors thank the volunteers, the clinical staff of the Phoenix Epidemiology and Clinical Research Branch for conducting the examinations and the metabolic kitchen stuff. The authors have nothing to disclose. Deidentified data analyzed during the current study are available from the corresponding author upon reasonable request.
The Supplementary Material for this article can be found online at: https://www.frontiersin.org/articles/10.3389/fendo.2021.642568/full#supplementary-material
DXA, dual energy X-ray absorptiometry; FFM, fat free mass; FFMI, fat free mass index; FM, fat mass; FMI, fat mass index; OGTT, oral glucose tolerance test; %FAT, percent of body fat; WC, waist circumference; 24-h EE, 24-h energy expenditure; ENBAL, 24-h energy balance; SMR, sleeping metabolic rate; 24h RQ, 24-h respiratory quotient; 24h CARBOX, 24-h carbohydrate oxidation; LIPOX, 24-h lipid oxidation; PROTOX, 24-h protein oxidation; SPA, spontaneous physical activity; WMEN, weight maintaining energy needs.
1. Zheng W, McLerran DF, Rolland B, Zhang X, Inoue M, Matsuo K, et al. Association between body-mass index and risk of death in more than 1 million Asians. N Engl J Med (2011) 364(8):719–29. doi: 10.1056/NEJMoa1010679
2. Stępień M, Stępień A, Wlazeł RN, Paradowski M, Banach M, Rysz J. Obesity indices and inflammatory markers in obese non-diabetic normo-and hypertensive patients: a comparative pilot study. Lipids Health Dis (2014) 13(1):29. doi: 10.1186/1476-511X-13-29
3. Kershaw EE, Flier JS. Adipose tissue as an endocrine organ. J Clin Endocrinol Metab (2004) 89(6):2548–56. doi: 10.1210/jc.2004-0395
4. Ye J, McGuinness OP. Inflammation during obesity is not all bad: evidence from animal and human studies. Am J Physiol Endocrinol Metab (2013) 304(5):E466–E77. doi: 10.1152/ajpendo.00266.2012
5. Lafontan M. Fat cells: afferent and efferent messages define new approaches to treat obesity. Annu Rev Pharmacol Toxicol (2005) 45:119–46. doi: 10.1146/annurev.pharmtox.45.120403.095843
6. Wärnberg J, Moreno L, Mesana M, Marcos A. Inflammatory mediators in overweight and obese Spanish adolescents. AVENA Study Int J Obes (2004) 28(3):S59–63. doi: 10.1038/sj.ijo.0802809
7. Wannamethee S, Whincup P, Rumley A, Lowe G. Inter-relationships of interleukin-6, cardiovascular risk factors and the metabolic syndrome among older men. J Thromb Haemostasis (2007) 5(8):1637–43. doi: 10.1111/j.1538-7836.2007.02643.x
8. Wang H, Ye J. Regulation of energy balance by inflammation: common theme in physiology and pathology. Rev Endocr Metab Disord (2015) 16(1):47–54. doi: 10.1007/s11154-014-9306-8
9. Wallenius V, Wallenius K, Ahrén B, Rudling M, Carlsten H, Dickson SL, et al. Interleukin-6-deficient mice develop mature-onset obesity. Nat Med (2002) 8(1):75–9. doi: 10.1038/nm0102-75
10. Pamir N, McMillen TS, Kaiyala KJ, Schwartz MW, LeBoeuf RC. Receptors for tumor necrosis factor-α play a protective role against obesity and alter adipose tissue macrophage status. Endocrinology (2009) 150(9):4124–34. doi: 10.1210/en.2009-0137
11. Bhat S, Jagadeeshaprasad MG, Venkatasubramani V, Kulkarni MJ. Abundance matters: role of albumin in diabetes, a proteomics perspective. Expert Rev Proteomics (2017) 14(8):677–89. doi: 10.1080/14789450.2017.1352473
12. Fuhrman MP, Charney P, Mueller CM. Hepatic proteins and nutrition assessment. J Am Diet Assoc (2004) 104(8):1258–64. doi: 10.1016/j.jada.2004.05.213
13. Weinsier RL, Hunker EM, Krumdieck CL, Butterworth J. Hospital malnutrition a prospective evaluation of general medical patients during the course of hospitalization. Am J Clin Nutr (1979) 32(2):418–26. doi: 10.1093/ajcn/32.2.418
14. Garcovich M, Zocco MA, Gasbarrini A. Clinical use of albumin in hepatology. Blood Transfus (2009) 7(4):268. doi: 10.2450/2008.0080-08
15. Evans T. albumin as a drug—biological effects of albumin unrelated to oncotic pressure. Aliment Pharmacol Ther (2002) 16:6–11. doi: 10.1046/j.1365-2036.16.s5.2.x
16. Chang DC, Xu X, Ferrante AW, Krakoff J. Reduced plasma albumin predicts type 2 diabetes and is associated with greater adipose tissue macrophage content and activation. Diabetol Metab Syndr (2019) 11(1):14. doi: 10.1186/s13098-019-0409-y
17. Lufrano D, Trejo SA, Llovera RE, Salgueiro M, Fernandez G, Damonte VM, et al. Ghrelin binding to serum albumin and its biological impact. Mol Cell Endocrinol (2016) 436:130–40. doi: 10.1016/j.mce.2016.07.016
18. Ravussin E, Lillioja S, Anderson TE, Christin L, Bogardus C. Determinants of 24-hour energy expenditure in man. Methods and results using a respiratory chamber. J Clin Invest (1986) 78(6):1568–78. doi: 10.1172/JCI112749
19. Venti CA, Votruba SB, Franks PW, Krakoff J, Salbe AD. Reproducibility of ad libitum energy intake with the use of a computerized vending machine system. Am J Clin Nutr (2010) 91(2):343–8. doi: 10.3945/ajcn.2009.28315
20. Knowler WC, Bennett PH, Hamman RF, Miller M. Diabetes incidence and prevalence in Pima Indians: a 19-fold greater incidence than in Rochester, Minnesota. Am J Epidemiol (1978) 108(6):497–505. doi: 10.1093/oxfordjournals.aje.a112648
21. Ferraro R, Boyce VL, Swinburn B, De Gregorio M, Ravussin E. Energy cost of physical activity on a metabolic ward in relationship to obesity. Am J Clin Nutr (1991) 53(6):1368–71. doi: 10.1093/ajcn/53.6.1368
22. Gavin JR II, Alberti K, Davidson MB, DeFronzo RA. Report of the expert committee on the diagnosis and classification of diabetes mellitus. Diabetes Care (1997) 20(7):1183. doi: 10.2337/diacare.20.7.1183
23. Buskirk ER. Underwater weighing and body density: a review of procedures. Tech Meas Body Compost (1961) 1961:90–106.
24. Tataranni PA, Ravussin E. Use of dual-energy X-ray absorptiometry in obese individuals. Am J Clin Nutr (1995) 62(4):730–4. doi: 10.1093/ajcn/62.4.730
25. Reinhardt M, Piaggi P, DeMers B, Trinidad C, Krakoff J. Cross calibration of two dual-energy X-ray densitometers and comparison of visceral adipose tissue measurements by iDXA and MRI. Obesity (2017) 25(2):332–7. doi: 10.1002/oby.21722
26. Abbott W, Howard BV, Christin L, Freymond D, Lillioja S, Boyce VL, et al. Short-term energy balance: relationship with protein, carbohydrate, and fat balances. Am J Physiol Endocrinol Metab (1988) 255(3):E332–7. doi: 10.1152/ajpendo.1988.255.3.E332
27. Jequier E, Acheson K, Schutz Y. Assessment of energy expenditure and fuel utilization in man. Annu Rev Nutr (1987) 7(1):187–208. doi: 10.1146/annurev.nu.07.070187.001155
28. Basolo A, Votruba SB, Heinitz S, Krakoff J, Piaggi P. Deviations in energy sensing predict long-term weight change in overweight Native Americans. Metabolism (2018) 82:65–71. doi: 10.1016/j.metabol.2017.12.013
29. Weise CM, Hohenadel MG, Krakoff J, Votruba SB. Body composition and energy expenditure predict ad-libitum food and macronutrient intake in humans. Int J Obes (2014) 38(2):243–51. doi: 10.1038/ijo.2013.85
30. Sullivan DH, Roberson PK, Johnson LE, Mendiratta P, Bopp MM, Bishara O. Association between inflammation-associated cytokines, serum albumins, and mortality in the elderly. J Am Med Dir Assoc (2007) 8(7):458–63. doi: 10.1016/j.jamda.2007.04.004
31. Tritsch GL, Rathke CE, Tritsch NE, Weiss CM. Thyroxine binding by human serum albumin. J Biol Chem (1961) 236:3163–7. doi: 10.1016/S0021-9258(18)93989-X
32. Dunn JF, Nisula BC, Rodbard D. Transport of steroid hormones: binding of 21 endogenous steroids to both testosterone-binding globulin and corticosteroid-binding globulin in human plasma. J Clin Endocrinol Metab (1981) 53(1):58–68. doi: 10.1210/jcem-53-1-58
33. Basolo A, Burkholder J, Osgood K, Graham A, Bundrick S, Frankl J, et al. Exenatide has a pronounced effect on energy intake but not energy expenditure in non-diabetic subjects with obesity: A randomized, double-blind, placebo-controlled trial. Metabolism (2018) 85:116–25. doi: 10.1016/j.metabol.2018.03.017
34. Fasano M, Curry S, Terreno E, Galliano M, Fanali G, Narciso P, et al. The extraordinary ligand binding properties of human serum albumin. IUBMB Life (2005) 57(12):787–96. doi: 10.1080/15216540500404093
35. Curry S, Brick P, Franks NP. Fatty acid binding to human serum albumin: new insights from crystallographic studies. Biochim Biophys Acta (BBA) Mol Cell Biol Lipids (1999) 1441(2-3):131–40. doi: 10.1016/S1388-1981(99)00148-1
36. Scharrer E. Control of food intake by fatty acid oxidation and ketogenesis. Nutrition (1999) 15(9):704–14. doi: 10.1016/S0899-9007(99)00125-2
37. Obici S, Feng Z, Morgan K, Stein D, Karkanias G, Rossetti L. Central administration of oleic acid inhibits glucose production and food intake. Diabetes (2002) 51(2):271–5. doi: 10.2337/diabetes.51.2.271
38. Ross RA, Rossetti L, Lam TK, Schwartz GJ. Differential effects of hypothalamic long-chain fatty acid infusions on suppression of hepatic glucose production. Am J Physiol Endocrinol Metab (2010) 299(4):E633–E9. doi: 10.1152/ajpendo.00190.2010
39. Schwinkendorf D, Tsatsos N, Gosnell BA, Mashek D. Effects of central administration of distinct fatty acids on hypothalamic neuropeptide expression and energy metabolism. Int J Obes (2011) 35(3):336–44. doi: 10.1038/ijo.2010.159
40. van der VUSSE GJ. Albumin as fatty acid transporter. Drug Metab Pharmacokinet (2009) 24(4):300–7. doi: 10.2133/dmpk.24.300
41. Bouillanne O, Hay P, Liabaud B, Duché C, Cynober L, Aussel C. Evidence that albumin is not a suitable marker of body composition-related nutritional status in elderly patients. Nutrition (2011) 27(2):165–9. doi: 10.1016/j.nut.2009.12.007
42. Cheong M, Chew STH, Oliver J, Baggs G, Low YL, How CH, et al. Nutritional Biomarkers and Associated Factors in Community-Dwelling Older Adults: Findings from the SHIELD Study. Nutrients (2020) 27(2):165–9. doi: 10.3390/nu12113329
Keywords: albumin, energy intake, feeding behavior, food intake, weight change, energy expenditure
Citation: Basolo A, Ando T, Chang DC, Hollstein T, Krakoff J, Piaggi P and Votruba S (2021) Reduced Albumin Concentration Predicts Weight Gain and Higher Ad Libitum Energy Intake in Humans. Front. Endocrinol. 12:642568. doi: 10.3389/fendo.2021.642568
Received: 16 December 2020; Accepted: 25 January 2021;
Published: 11 March 2021.
Edited by:
Noriyuki Koibuchi, Gunma University, JapanReviewed by:
Karen Oliveira, Universidade Federal Fluminense, BrazilCopyright © 2021 Basolo, Ando, Chang, Hollstein, Krakoff, Piaggi and Votruba. This is an open-access article distributed under the terms of the Creative Commons Attribution License (CC BY). The use, distribution or reproduction in other forums is permitted, provided the original author(s) and the copyright owner(s) are credited and that the original publication in this journal is cited, in accordance with accepted academic practice. No use, distribution or reproduction is permitted which does not comply with these terms.
*Correspondence: Alessio Basolo, YWxlc3Npby5iYXNvbG9AbWVkLnVuaXBp
†These authors have contributed equally to this work
Disclaimer: All claims expressed in this article are solely those of the authors and do not necessarily represent those of their affiliated organizations, or those of the publisher, the editors and the reviewers. Any product that may be evaluated in this article or claim that may be made by its manufacturer is not guaranteed or endorsed by the publisher.
Research integrity at Frontiers
Learn more about the work of our research integrity team to safeguard the quality of each article we publish.