- 1Department of Endocrinology, Endocrine and Diabetes Care Center, Hubbali, India
- 2Department of Biochemistry, Basaveshwar College of Pharmacy, Gadag, India
- 3Department of Medicine, Dr. D. Y. Patil Medical College, Kolhapur, India
- 4Biostatistics and Bioinformatics, Chanabasava Nilaya, Bharthinagar, Dharwad, India
- 5Department of Pharmaceutical Chemistry, JSS College of Pharmacy, Mysuru and JSS Academy of Higher Education & Research, Mysuru, India
- 6Department of Ayurveda, Rajiv Gandhi Education Society`s Ayurvedic Medical College, Ron, India
Obesity is an excess accumulation of body fat. Its progression rate has remained high in recent years. Therefore, the aim of this study was to diagnose important differentially expressed genes (DEGs) associated in its development, which may be used as novel biomarkers or potential therapeutic targets for obesity. The gene expression profile of E-MTAB-6728 was downloaded from the database. After screening DEGs in each ArrayExpress dataset, we further used the robust rank aggregation method to diagnose 876 significant DEGs including 438 up regulated and 438 down regulated genes. Functional enrichment analysis was performed. These DEGs were shown to be significantly enriched in different obesity related pathways and GO functions. Then protein–protein interaction network, target genes - miRNA regulatory network and target genes - TF regulatory network were constructed and analyzed. The module analysis was performed based on the whole PPI network. We finally filtered out STAT3, CORO1C, SERPINH1, MVP, ITGB5, PCM1, SIRT1, EEF1G, PTEN and RPS2 hub genes. Hub genes were validated by ICH analysis, receiver operating curve (ROC) analysis and RT-PCR. Finally a molecular docking study was performed to find small drug molecules. The robust DEGs linked with the development of obesity were screened through the expression profile, and integrated bioinformatics analysis was conducted. Our study provides reliable molecular biomarkers for screening and diagnosis, prognosis as well as novel therapeutic targets for obesity.
Introduction
Obesity has long been part of the larger metabolic disorder and affects a large proportion of the global population particularly in the Western World (1). Obesity is diagnosed on the basis of body mass index (1). Obesity occurs in children age between 5 to 19 years as well as more common in women than in men (2). Countless surveys have proved that obesity is an key risk factor for heart disease (3), hyperlipidaemia (4), hyperinsulinaemia (5), hypertension (6), atherosclerosis (7), insulin resistance (8) and cancer (9). Important candidate genes and relevant signaling pathways linked with obesity remains largely unknown. As a result, seek of an earlier diagnosis and better prognosis, deeper understanding of genetic and molecular mechanisms about obesity is necessary.
Previous reports demonstrate that many genes and signaling pathways participate in obesity. Polymorphisms in UCP2 and UCP3 were responsible for development of obesity (10). TNFα and lipoprotein lipase were important for advancement of obesity (11). SLC6A14 (12) and JHDM2A (13) were lined with pathogenesis of obesity. Human salivary (AMY1) and pancreatic (AMY2) amylase genes were diagnosed with growth of obesity (14). Signaling pathways such as inflammatory signaling pathway (15), TLR4 signaling pathway (16), calcineurin-dependent signaling pathways (17), mTOR Complex1–S6K1 signaling pathway (18) and leptin-signaling pathway (19) were important for development of obesity. Therefore, it is meaningful to explore the precise molecular mechanisms involved in obesity and thus find a valid diagnostic way and generate an advance therapeutic strategy.
In present trends, the application of high-throughput analysis in gene expression profiling is becoming more valuable in clinical and medical research (20), molecular classification (21), prognosis prediction (22), diagnoses (23) and new targeted drug discovery (24). In this study, the original microarray data (E-MTAB-6728) was downloaded from ArrayExpress database (https://www.ebi.ac.uk/) and analyzed to get differently expressed genes (DEGs) between obesity persons and lean persons (normal controls). Subsequently, gene ontology (GO), pathway enrichment analysis, protein–protein interaction network construction and analysis, module analysis, target gene - miRNA interaction network construction and analysis, and target gene - TF interaction network construction and analysis to discover the key genes and pathways closely related to obesity. Finally, selected hub genes were validated by immunohistochemical (IHC) analysis, receiver operating characteristic curve (ROC) analysis and RT-PCR. This current investigation aimed at using bioinformatics tools to predict the key pathways and genes in obesity that can hold a value for target based therapeutic means.
Materials and Methods
Microarray Data
The microarray expression profile of E-MTAB-6728 was downloaded from ArrayExpress (https://www.ebi.ac.uk/). E-MTAB-6728 was based on A-MEXP-1171 - Illumina HumanHT-12 v3.0 Expression BeadChip and was submitted by Bjune et al. (25). The E-MTAB-6728 dataset about expression of genes from obesity persons compared to lean persons (normal controls).There are twenty-four samples including twelve obesity persons and lean persons (normal controls). The overall design of the experiment was microarray analysis of adiposities from obese patients versus adipocytes from lean persons (controls).
Identification of DEGs
The raw data files were acquired for the analysis as IDAT files (Illumina platform) forms and were converted into gene symbols and then processed to background correction and quantile data normalization using the effective multiarray average algorithm in the beadarray package (26). The analysis was carried out via R software (version 3.5.2). Hierarchical clustering analysis was applied to categorize the samples into two groups with similar expression patterns in obesity persons and lean persons (normal controls). The paired Student’s t-test based on the Limma package in R bioconductor was used to diagnose DEGs between two experimental conditions (27). Multiple testing corrections were performed by the Benjamini–Hochberg method (28). Then, the Log2 Fold change (log2FC) was determined. We selected up regulated DEGs with | log2FC | > 0.524 and FDR < 0.05, and down regulated DEGs with | log2FC | < -0.394 and FDR < 0.05 were considered as the cutoff values.
Pathway and Gene Ontology (GO) Enrichment Analysis of DEGs
The BIOCYC, Kyoto Encyclopedia of Genes and Genomes (KEGG), REACTOME, Pathway Interaction Database (PID), GenMAPP, MSigDB C2 BIOCARTA, PantherDB, Pathway Ontology and Small Molecule Pathway Database (SMPDB) databases are a knowledge base for systematic analysis, annotation, and visualization of gene functions. The GO database can add functional classification for genomic data, including categories of biological processes (BP), cellular component (CC), and molecular function (MF). GO analysis is a prevalent genes and gene products annotating approach. ToppCluster (https://toppcluster.cchmc.org/) (29) is an online tool for gene functional classification, which is a key foundation for high-throughput gene analysis to understand the biological importance of genes. In the current investigation, in order to analyze the functions of DEGs, Pathway and GO enrichment analysis were conducted using the ToppCluster online tool; p<0.05 was set as the cutoff point.
Integration of PPI Network and Module Analysis
The mentha (https://mentha.uniroma2.it/) (30) is a biological database designed to predict protein-protein interaction (PPI) information. The DEGs were mapped to STRING to evaluate the interactive relationships, with a confidence score >0.9 defined as significant. Then, integration of protein-protein interaction (PPI) network was visualized using cytoscape software (version 3.8.2) (http://www.cytoscape.org/) (31). The plug-in Network Analyzer identified hub genes based on mathematical calculation methods such as node degree (32), betweenness (33), stress (34) and closeness (35) the number of genes within centrality mathematical calculation methods were represented the significance of the disorder. The PEWCC1 was applied to screen modules of PPI network with degree cutoff = 2, node score cutoff = 0.2, k-core = 2, and max. depth = 100 (36). The functional enrichment analysis in the module was performed by ToppCluster.
Construction of Target Genes - miRNA Regulatory Network
MiRNA of target genes were explored combined with the human miRNA information (miRNet database, (https://www.mirnet.ca/) (37), recorded using TarBase, miRTarBase, miRecords, miR2Disease, HMDD, SM2miR, PhenomiR, PharmacomiR, EpimiR and starBase databases, and visualized using the Cytoscape software (31).
Construction of Target Genes - TF Regulatory Network
TFs of hub genes were explored combined with the human TF information (NetworkAnalyst database, http://www.networkanalyst.ca) (38), recorded using ENCODE database, and visualized using the Cytoscape software (31).
Validation of Hub Genes
Immunohistochemical (IHC) analysis of adipose tissues was performed utilizing human protein atlas (www.proteinatlas.org) (39). ROC analysis was performed using pROC package (40) in R. ROC analyses were estimated for diagnostic value of hub genes. When the AUC value was > 0.7, the hub genes were considered to be capable of distinguishing obesity persons from normal lean with excellent specificity and sensitivity.
Detection of the mRNA Expression of the Hub Genes by RT-PCR
D12 (ATCC CRL-3280) cell line for obesity and D16 (ATCC CRL-3281) cell line a normal control were purchased from the American Type Culture Collection (ATCC) (Maryland, USA). D12 cells were cultured in Dulbecco’s modified Eagle’s medium (DMEM) F12 medium, which contains 10% fetal bovine serum. D16 cells were cultured in Dulbecco’s modified Eagle’s medium (DMEM) F12 medium, which contains 10% fetal bovine serum. The culture temperature is 37°C and CO2 concentration is 5%. Total cellular RNA was extracted from cell culture with 1 ml TRI Reagent® (Sigma, USA). Reverse transcription cDNA kit (Thermo Fisher Scientific, Waltham, MA, USA) and random primers were used to synthesize cDNA. RT-PCR was performed using QuantStudio 7 Flex real-time PCR system (Thermo Fisher Scientific, Waltham, MA, USA). The conditions for RT-PCR amplification were as follows: 95°C for 120 seconds followed by 40 cycles of 95°C for 15 seconds, annealing temperature for 45 seconds. Each sample was run in triplicate. Relative expression level for each target gene was normalized by the Ct value of β-actin (internal control) using a 2 −ΔΔCT relative quantification method (41). The primer pairs used in the experiments are listed in Supplementary Table 1.
Molecular Docking Studies
The module SYBYL-X 2.0 perpetual software was used for Surflex-Docking of the designed molecules. The molecules were sketched by using ChemDraw Software and imported and saved in sdf. format using Openbabelfree software. The one co-crystallized protein from each of ERBB2, STAT3 and HSPAB8 were selected for docking studies. The protein structures of ERBB2, STAT3 and HSPAB8 of PDB code 1MFL, 5OOW and 3CWG was retrieved from Protein Data Bank (42–44). Together with the TRIPOS force field, GasteigerHuckel (GH) charges were added to all designed molecules and the standard ant-obesity drug Orlistat, for the structure optimization process. In addition, energy minimization was carried out using MMFF94s and MMFF94 algorithm process. Protein processing was carried out after the incorporation of protein. The co-crystallized ligand and all water molecules were removed from the crystal structure; more hydrogen’s were added and the side chain was set. TRIPOS force field was used for the minimization of structure. The designed molecules interaction efficiency with the receptor was represented by the Surflex-Dock score in kcal/mol units. The interaction between the protein and the ligand, the best pose was incorporated into the molecular area. The visualization of ligand interaction with receptor is done by using discovery studio visualizer.
Results
Data Normalization
Each array was normalized (centered) by quantile data normalization using the beadarray package in R bioconductor. As shown in Figures 1A, B, raw expression data were normalized after preprocessing; median-centered values demonstrated that the data were normalized and thus it was possible to cross-compare between obesity persons and lean persons (normal controls).
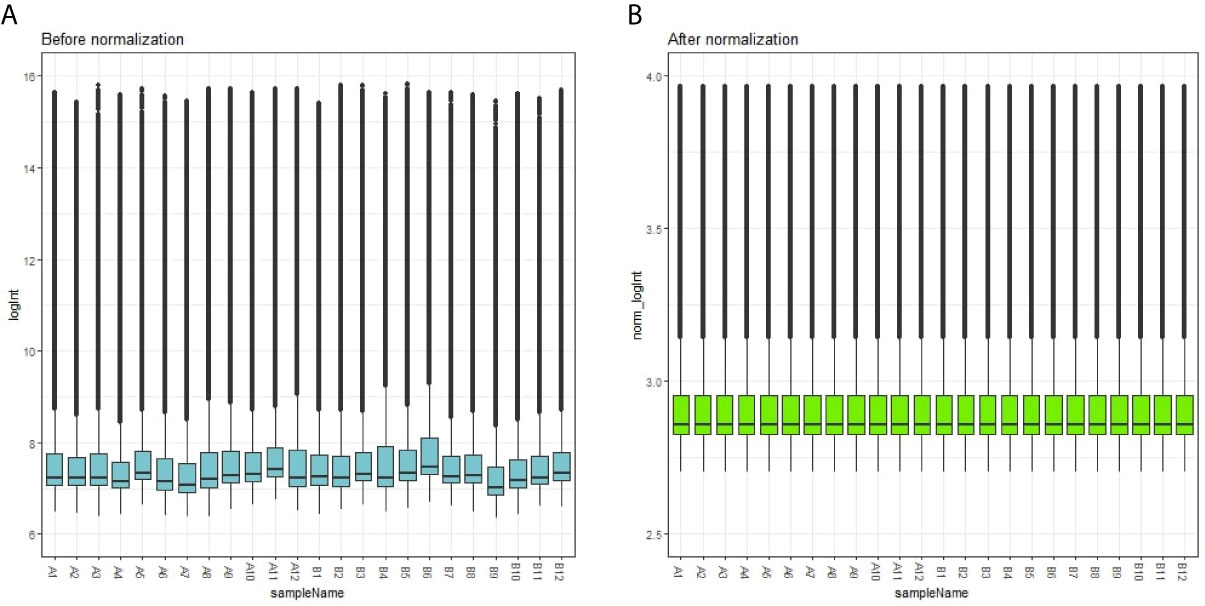
Figure 1 Box plots of the gene expression data before (A) and after normalization (B). Horizontal axis represents the sample symbol and the vertical axis represents the gene expression values. The black line in the box plot represents the median value of gene expression. (A1-A12 = adipocytes from lean persons; B1-B12 = adipocytes from obese patients).
Identification of DEGs Between Obese Patients and Lean Persons
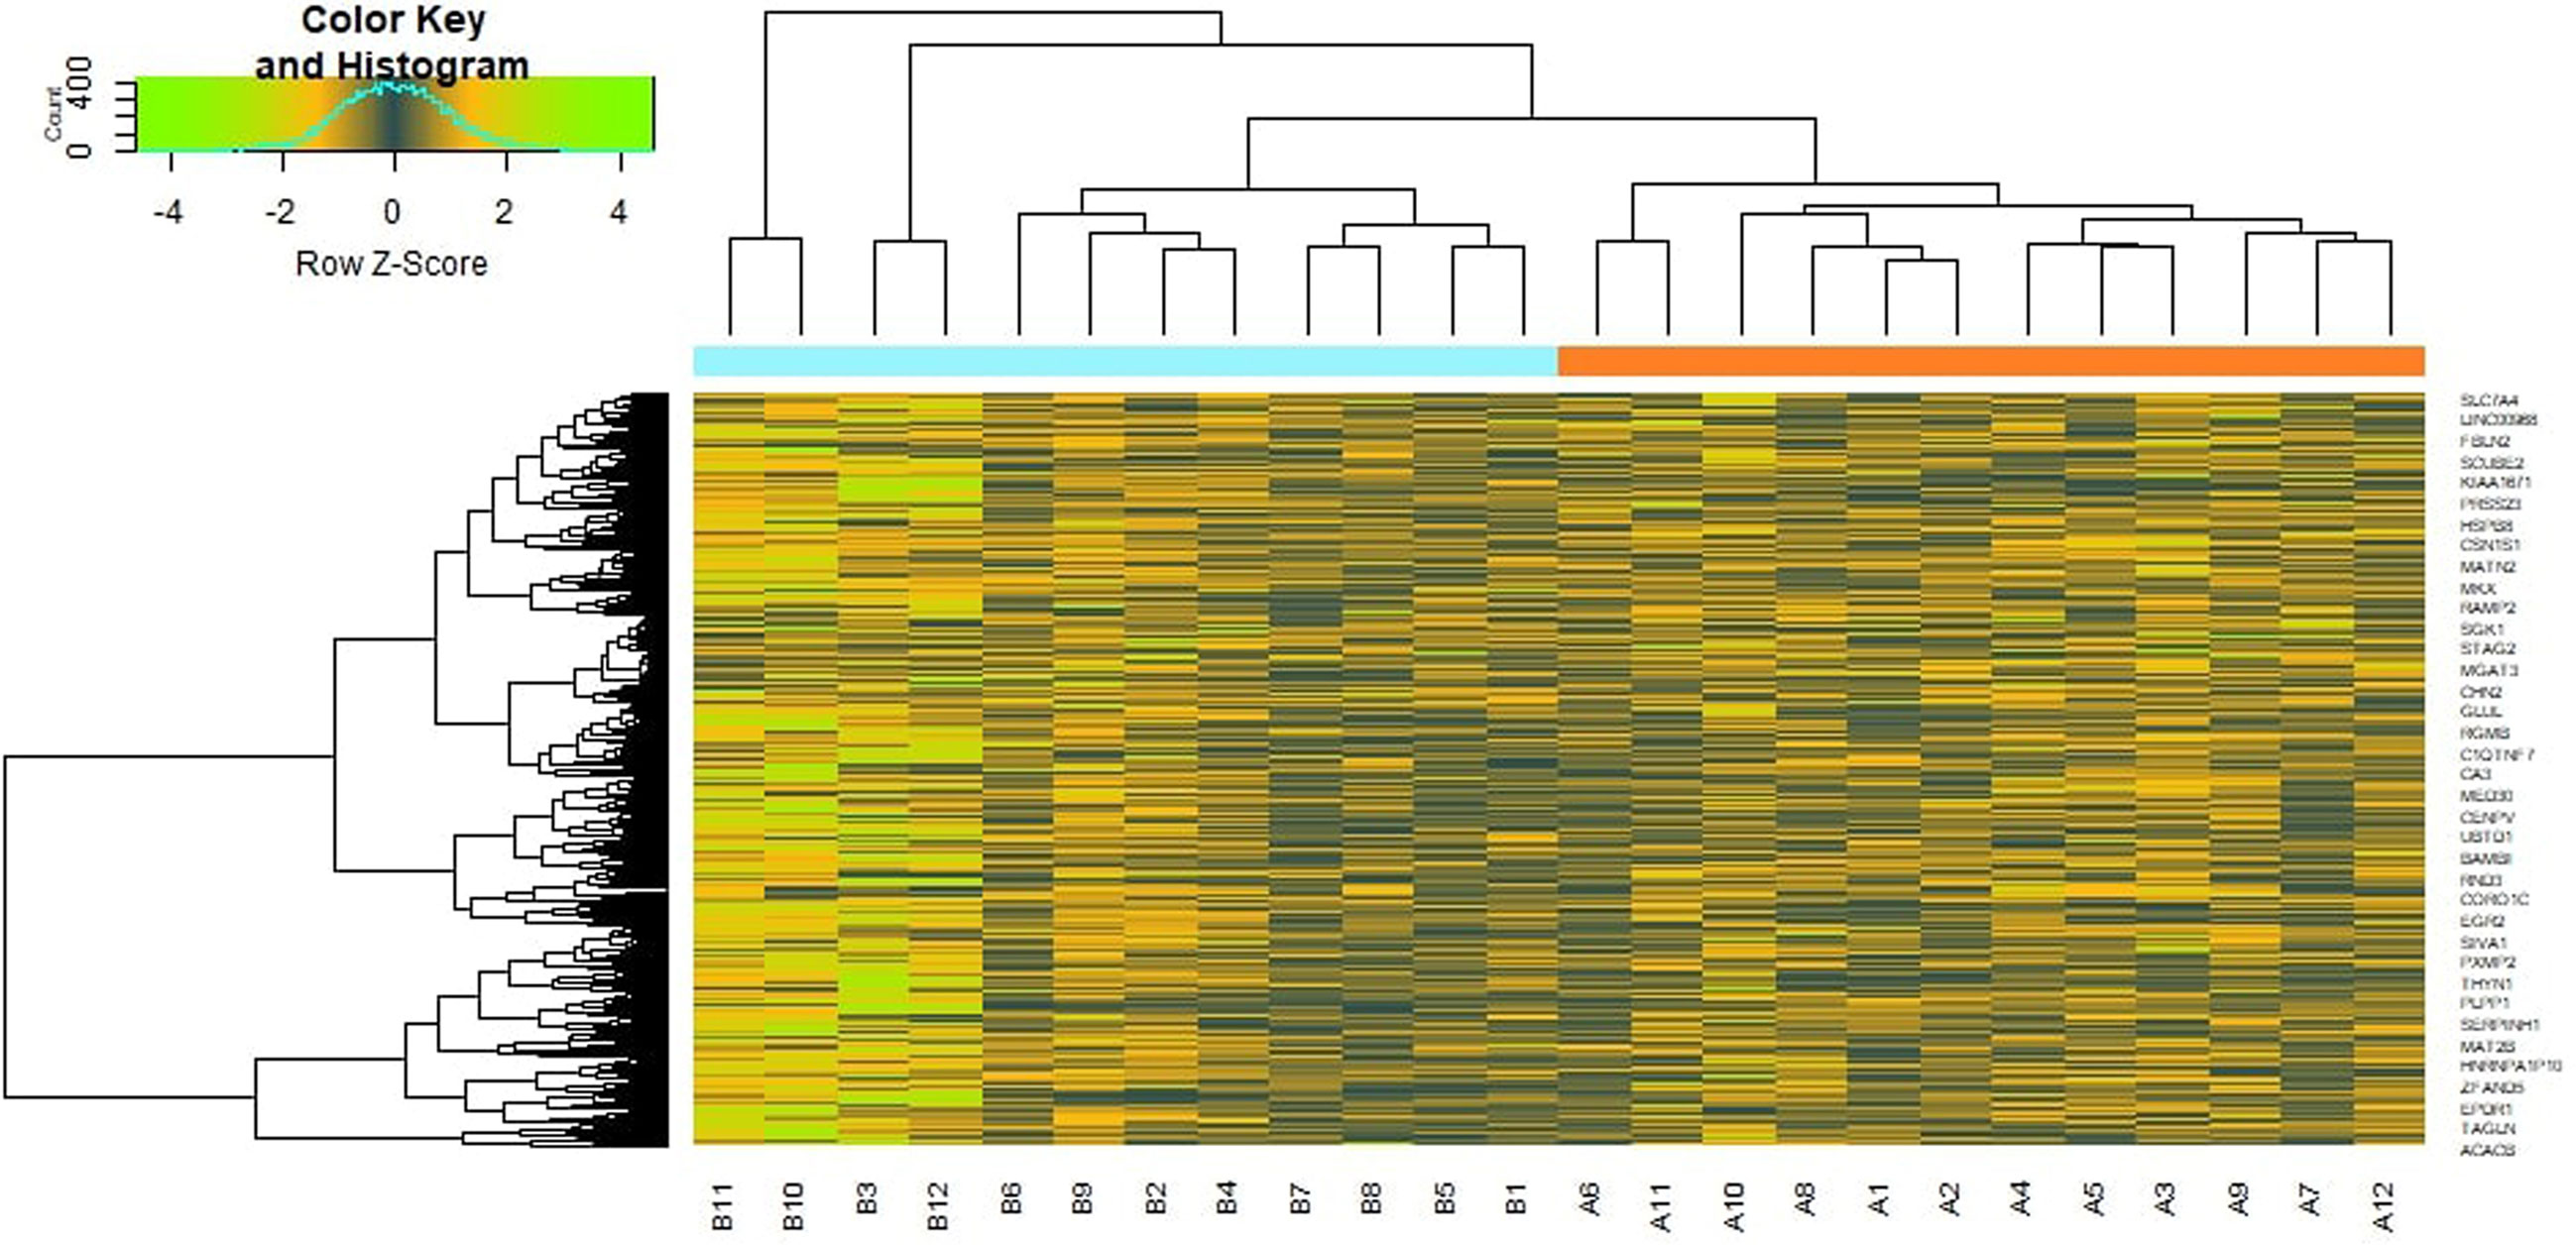
To preliminarily understand the mechanism contributing to the obesity, 24 patients [12 obesity persons and 12 lean persons (normal controls)] were selected for subsequent analysis. Based on the analysis, a total of 876 DEG compose of 438 genes had been expressed highly and about 438 genes had been shown to decrease expression in obesity and are listed in Supplementary Table 2. The FDR <0.05 was as a threshold value. Heat map is shown in Figure 2. Volcano plot for DEGs is shown in Figure 3.
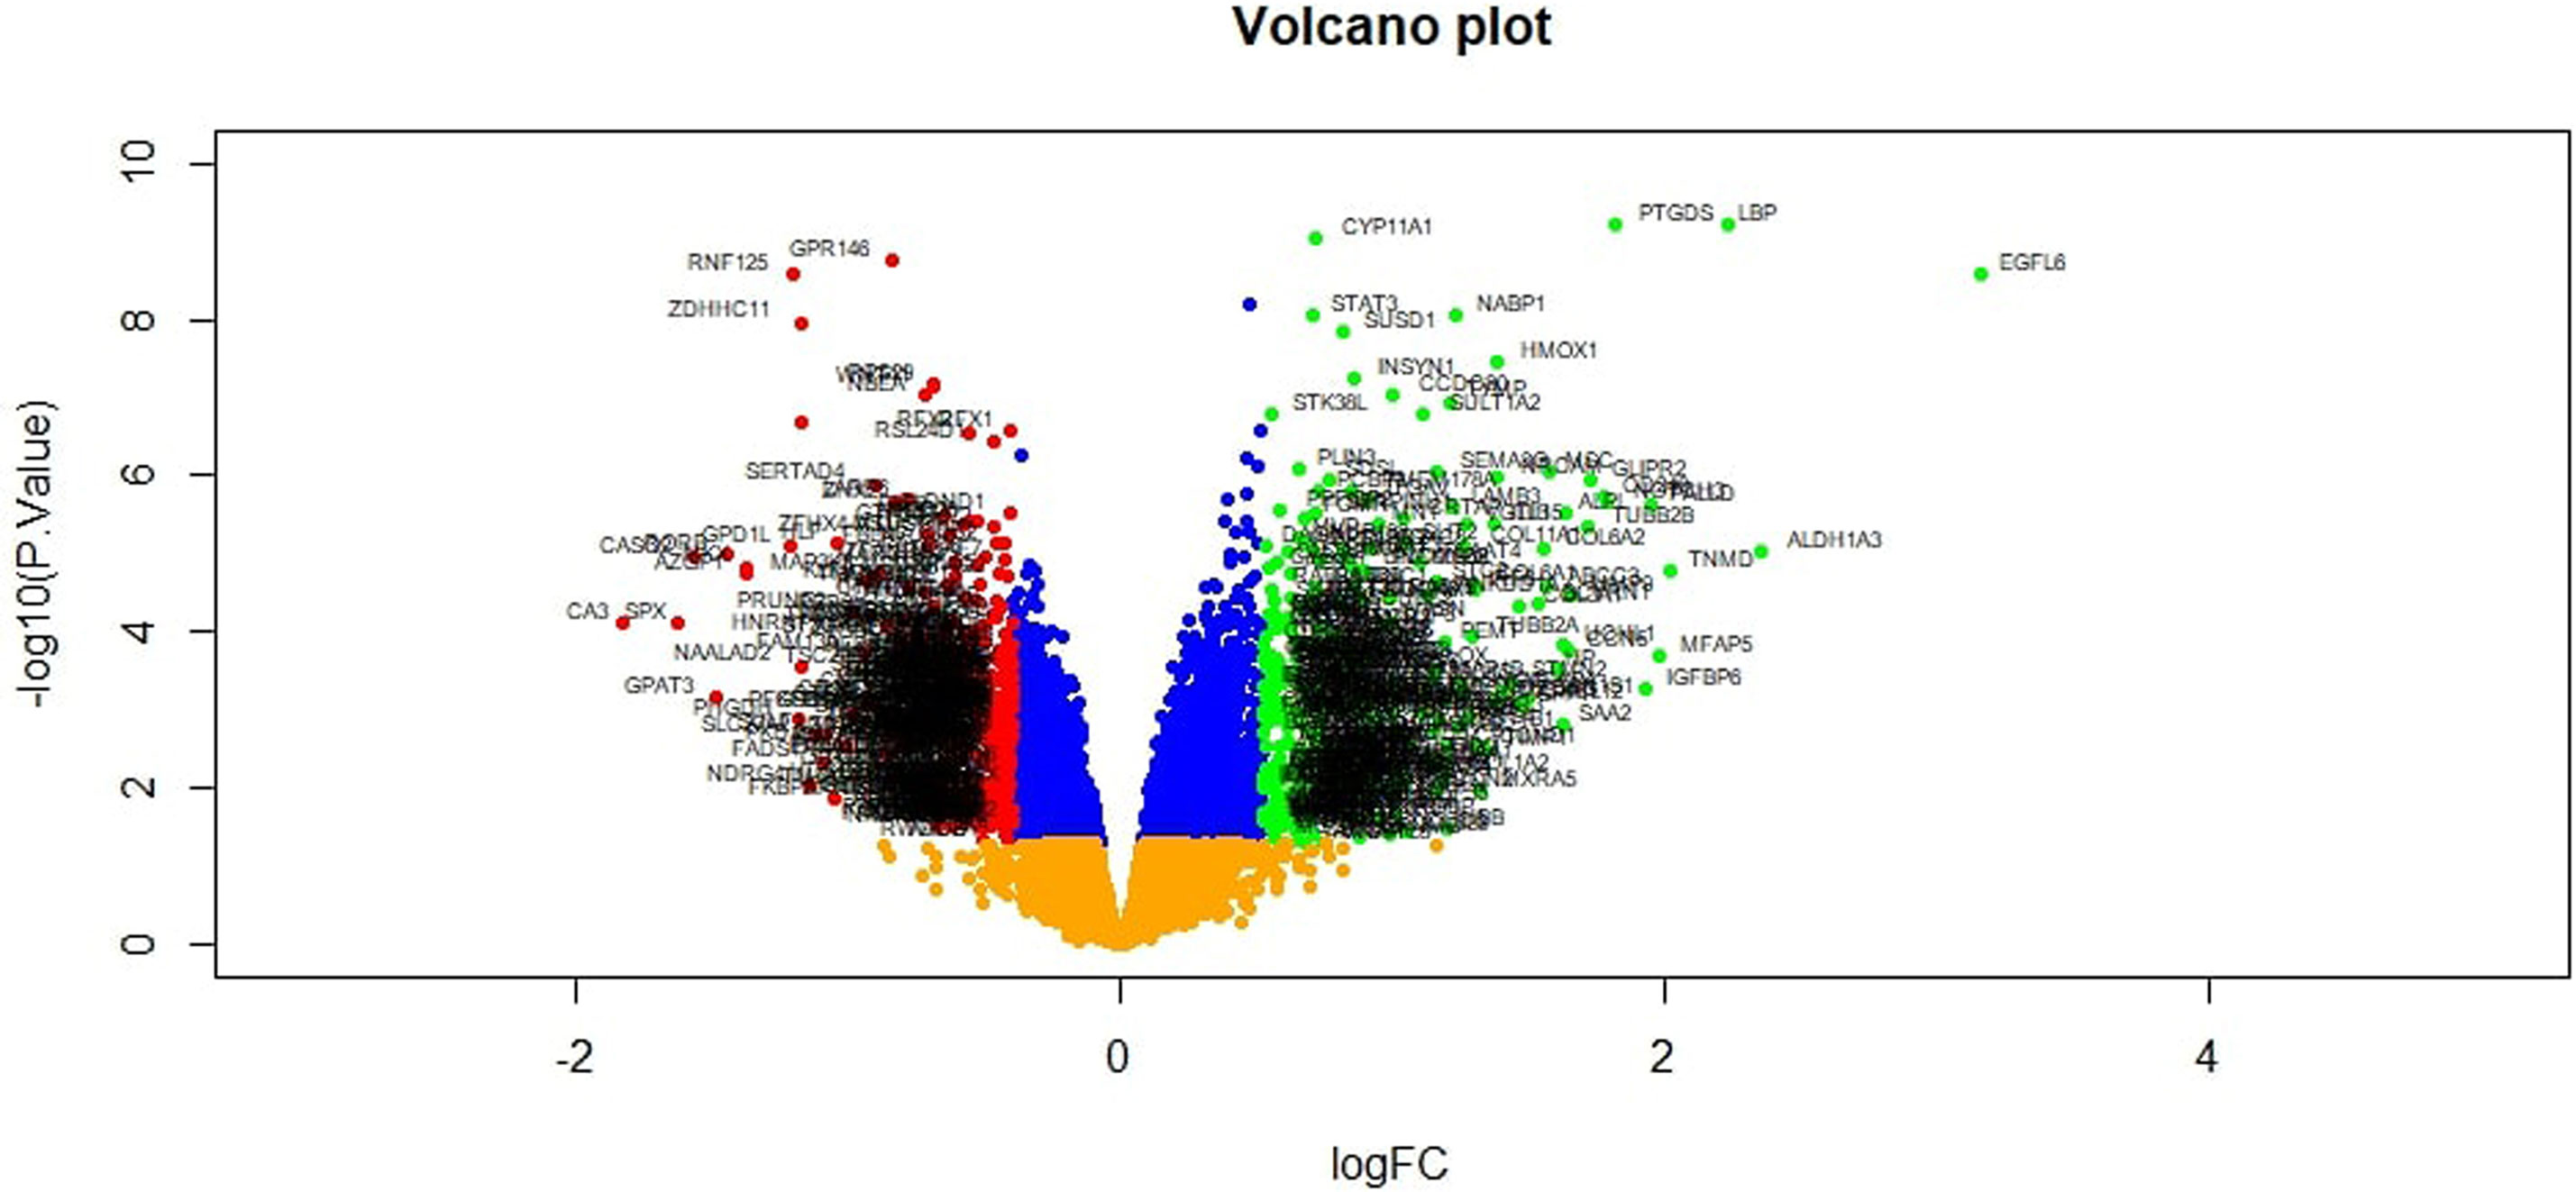
Figure 3 Volcano plot of differentially expressed genes. Genes with a significant change of more than two-fold were selected.
Pathway and Gene Ontology (GO) Enrichment Analysis of DEGs
To further investigate the biologic functions and mechanisms of the DEGs, pathway and GO enrichment analyses were performed using ToppCluster tool. Pathway enrichment analysis revealed that the up regulated genes were mainly enriched in thyroid hormone metabolism II (via conjugation and/or degradation), ECM-receptor interaction, IL6-mediated signaling events, collagen formation, C21 steroid hormone metabolism, genes encoding collagen proteins, integrin signalling pathway, hypertension and suprofen pathway, and are listed in Supplementary Table 3. Similarly, down regulated genes were mainly enriched in superpathway of methionine degradation, ribosome, FoxO family signaling, eukaryotic translation elongation, propanoate metabolism, CDK regulation of DNA replication, p38 MAPK pathway, glycine, serine and threonine metabolic, and glycine, serine and threonine metabolism, and are listed in Supplementary Table 4. GO analysis results showed that up regulated genes were significantly enriched in blood vessel morphogenesis, extracellular matrix and growth factor binding, and are listed in Supplementary Table 5. Similarly, down regulated genes were mainly enriched in organic acid biosynthetic process, cytosolic small ribosomal subunit and structural constituent of ribosome, and are listed in Supplementary Table 6.
Integration of PPI Network and Module Analysis
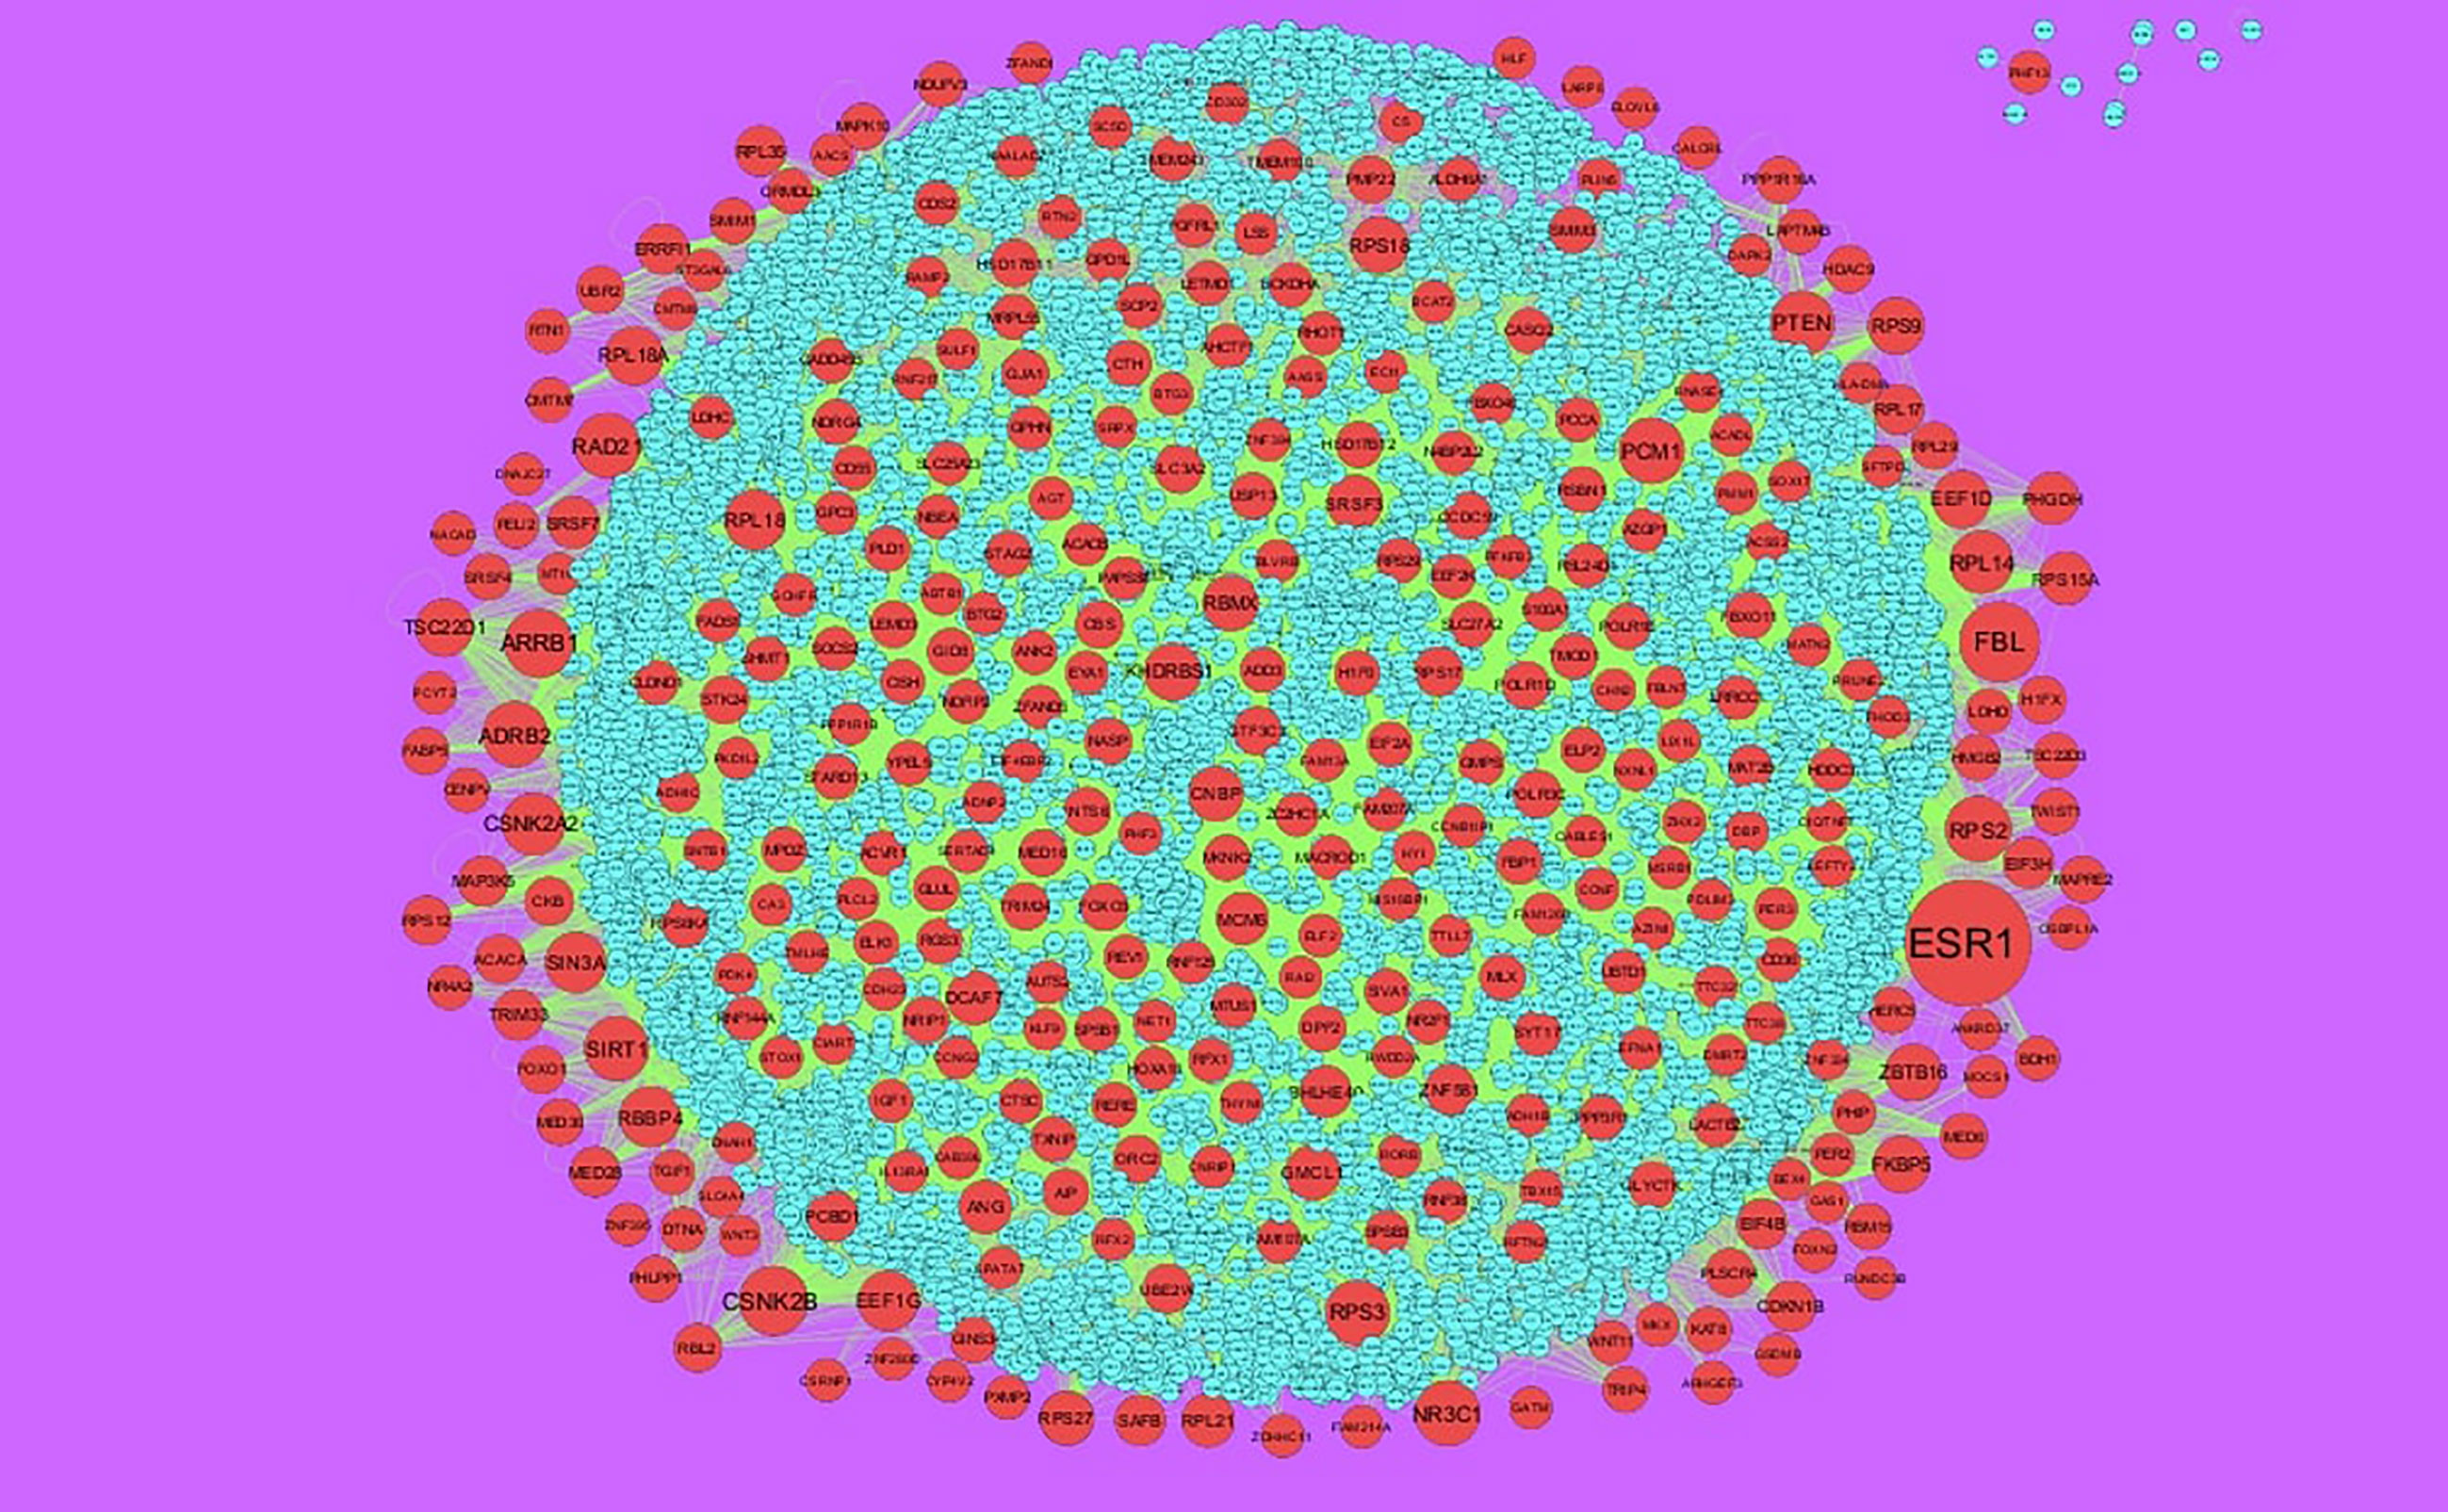
The PPI network of up regulated genes consisted of 7271 nodes and 16270 edges (Figure 4) and down regulated genes consisted of 7276 nodes and 19862 edges (Figure 5) constructed in the mentha database and visualized using Cytoscape software. Based on the mentha database, the DEGs with the highest PPI scores identified by the four centrality methods are shown in Supplementary Table 7. There are 5 up regulated genes selected as hub genes, such as HSPA8, HSPA5, YWHAH, STAT3 and ERBB2, and 5 down regulated genes selected as hub genes, such as ESR1, ARRB1, CSNK2A2, RBBP4 and NR3C1. A significant module was obtained from PPI network of DEGs using PEWCC1, including module 1 contains 49 nodes and 99 edges (Figure 6A) and module 2 contains 66 nodes and 754 edges (Figure 6B). Functional enrichment analysis revealed that genes in these modules were mainly involved in PI3K-Akt signaling pathway, regulation of nuclear SMAD2/3 signaling, ribosome, eukaryotic translation elongation, metabolism of amino acids and derivatives, disease, cellular amide metabolic process, establishment of protein localization to endoplasmic reticulum, monocarboxylic acid biosynthetic process translation, translational initiation, macromolecule catabolic process and cytosolic small ribosomal subunit.
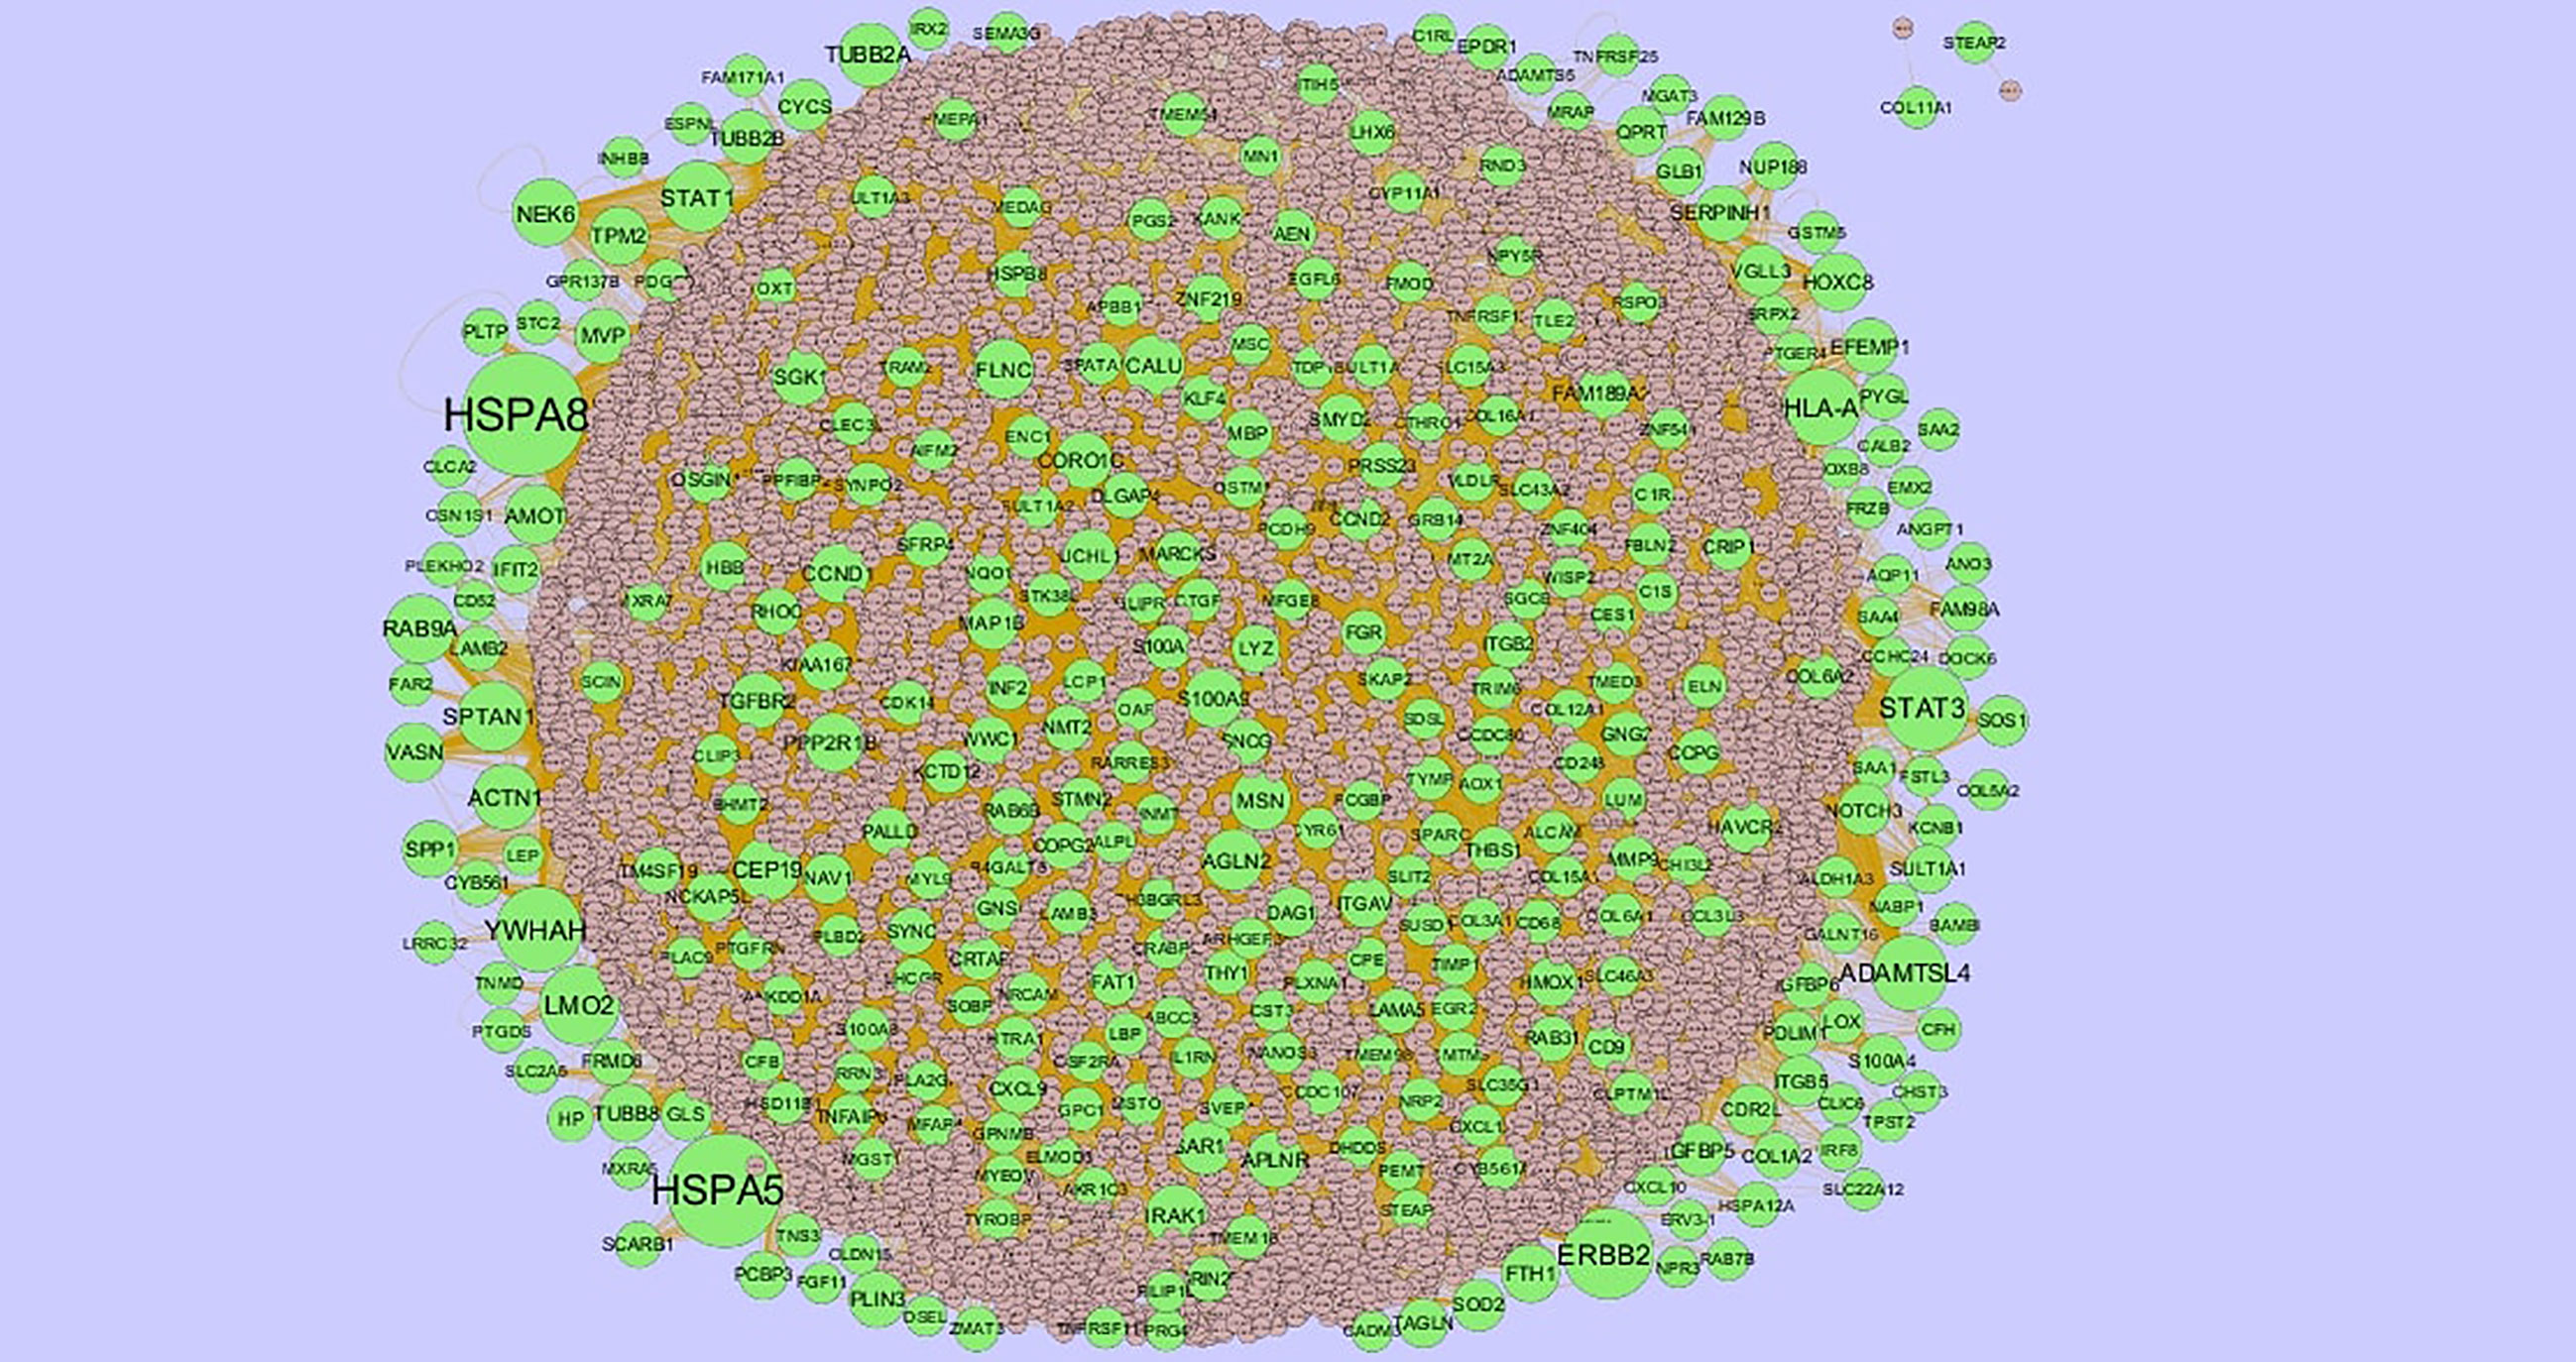
Figure 4 Protein–protein interaction network of up regulated genes. Green nodes denotes up regulated genes.

Figure 6 (A) Module of up regulated genes. The green nodes denote the up regulated genes (B) Module of down regulated genes. The red nodes denote the down regulated genes.
Construction of Target Genes - miRNA Regulatory Network
To further understand the regulatory network between miRNAs and target genes, through miRNet database were constructed by Cytoscape. As shown in Figure 7, the miRNA-regulated network with 2613 nodes (miRNA: 2261; target gene: 352) and 17260 edges was obtained for up regulated target genes and Figure 8, the miRNA-regulated network with 2685 nodes (miRNA: 2327; target gene: 358) and 19827 edges was obtained for down regulated target genes. Different target genes regulated by miRNAs are shown in Supplementary Table 8. SOD2 had been predicted to regulate 257 miRNAs (ex; hsa-mir-3144-3p), CCND1 had been predicted to regulate 251 miRNAs (ex; hsa-mir-7706), TUBB2A had been predicted to regulate 193 miRNAs (ex; hsa-mir-5692c), CCND2 had been predicted to regulate 179 miRNAs (ex; hsa-mir-7162-3p), TMEM189 had been predicted to regulate 146 miRNAs (ex; hsa-mir-548z), BTG2 had been predicted to regulate 247 miRNAs (ex; hsa-mir-6075), TXNIP had been predicted to regulate 228 miRNAs (ex; hsa-mir-3194-3p), MED28 had been predicted to regulate 203 miRNAs (ex; hsa-mir-6861-5p), CNBP had been predicted to regulate 197 miRNAs (ex; hsa-mir-4651) and MKNK2 had been predicted to regulate 195 miRNAs (ex; hsa-mir-3650).
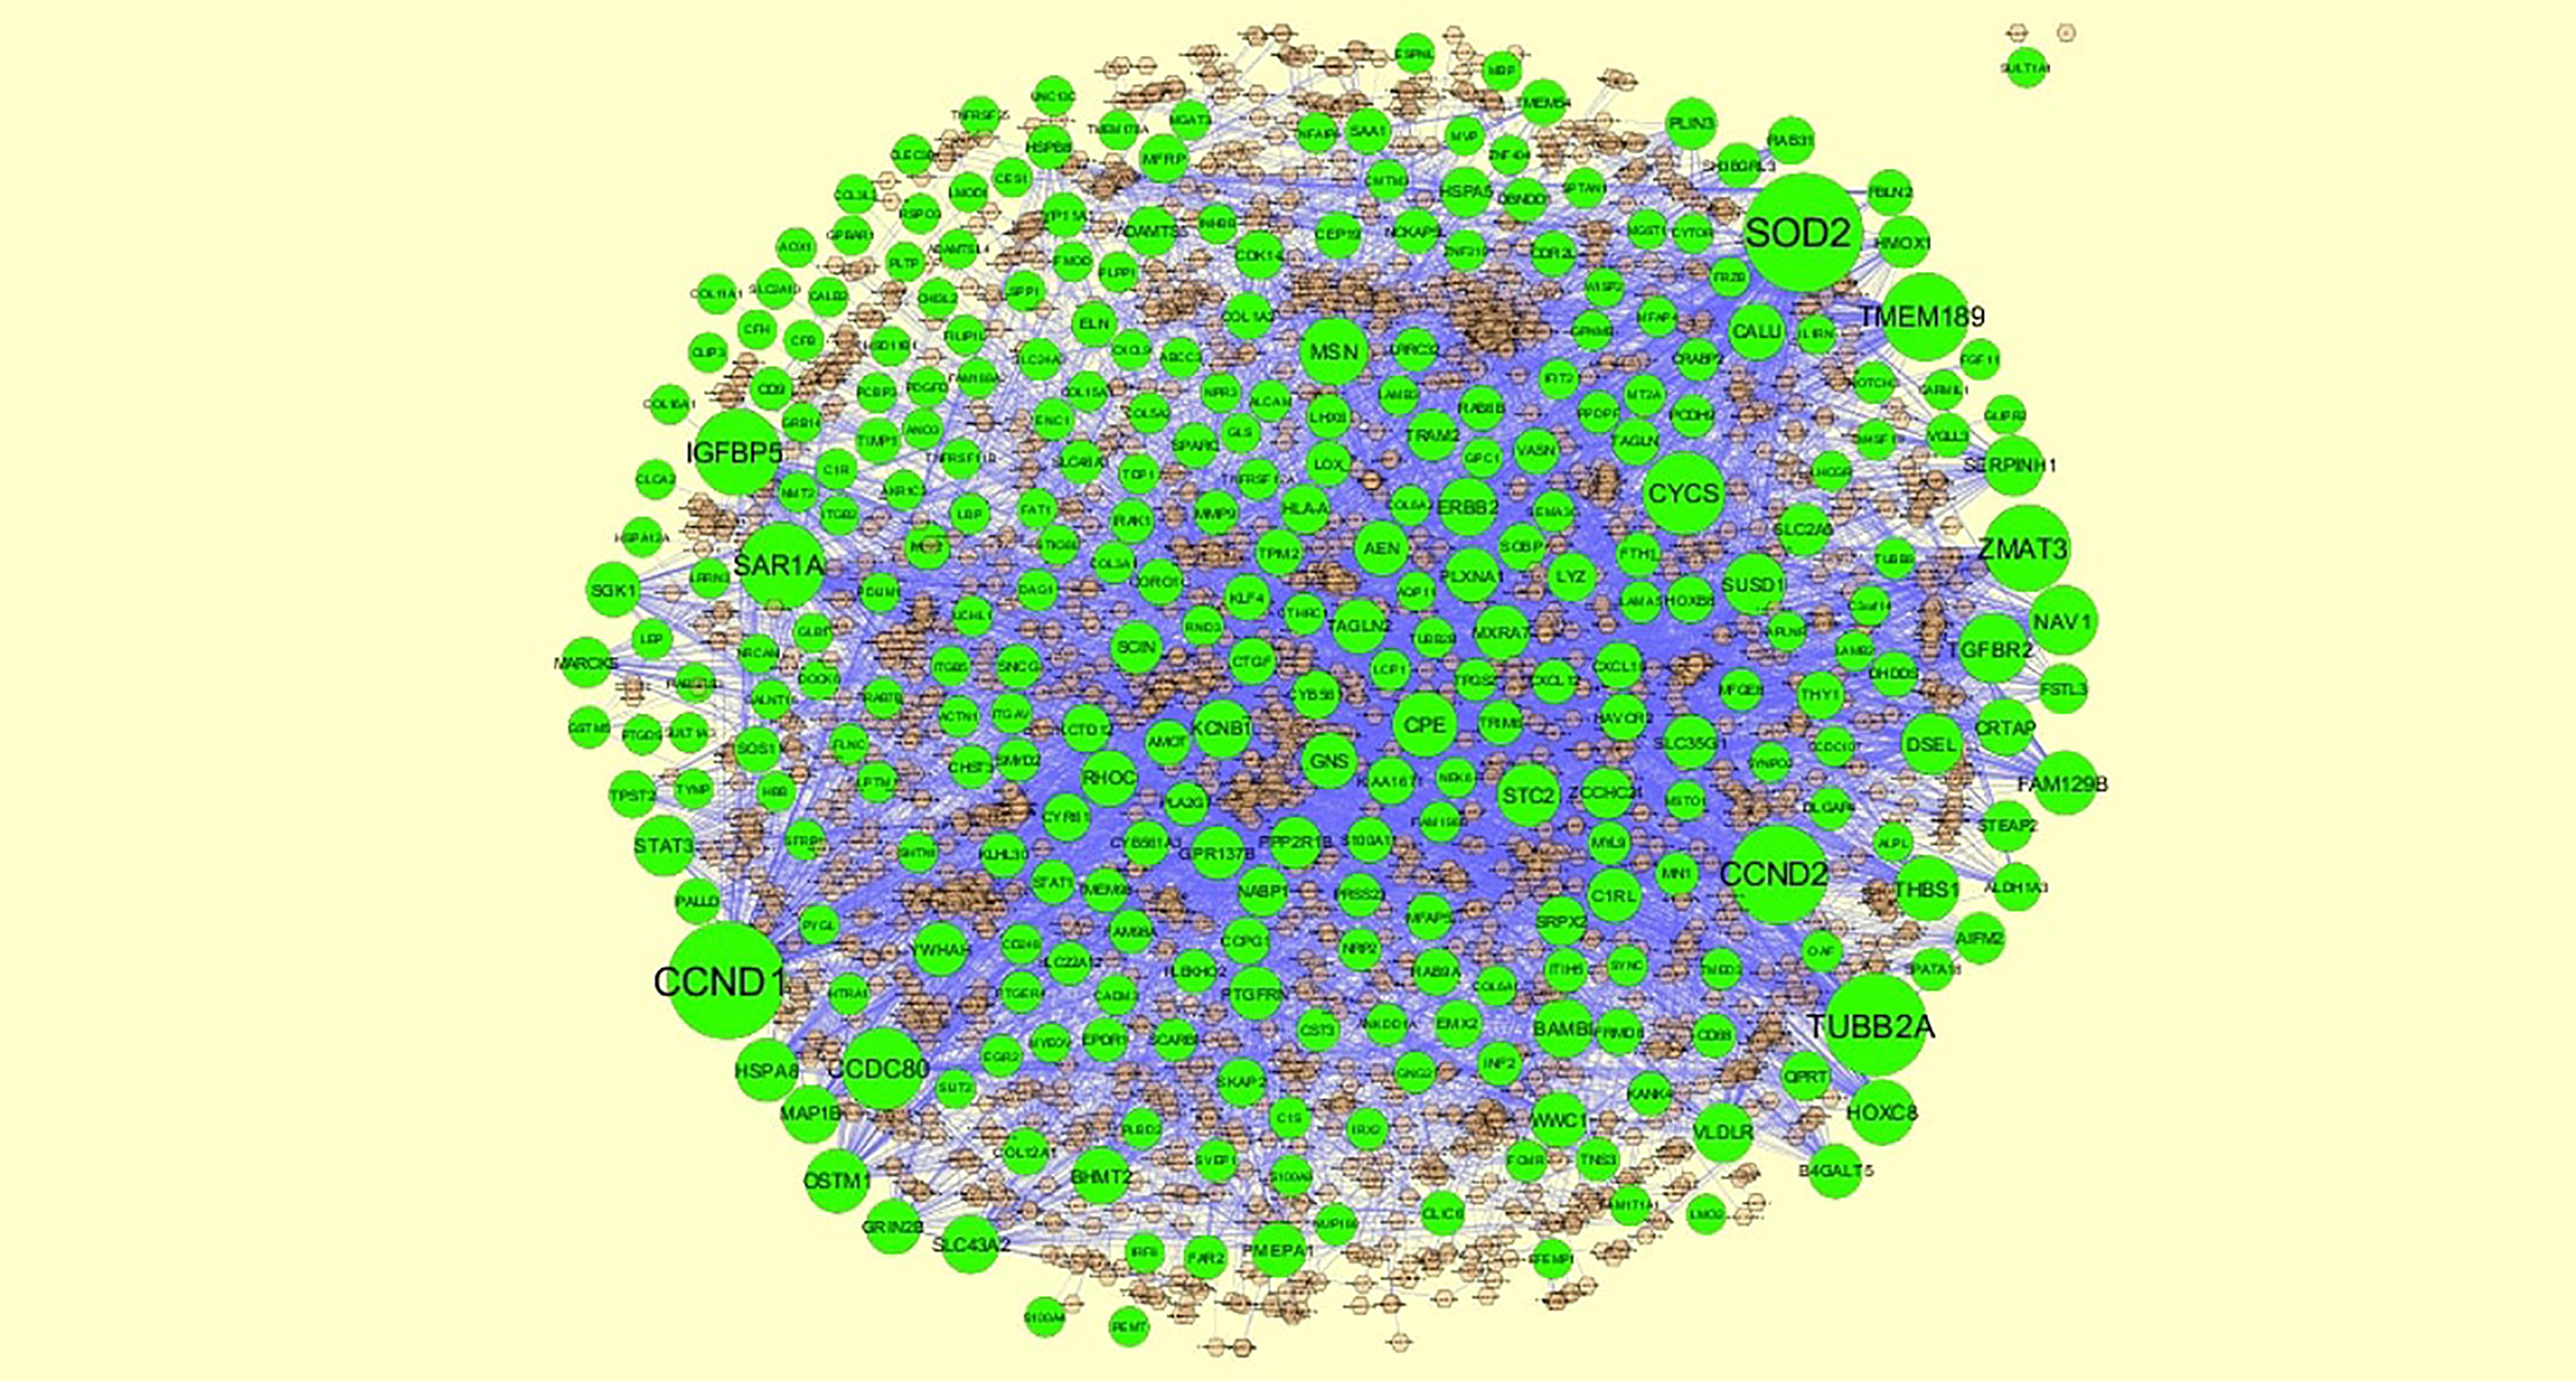
Figure 7 The network of up regulated genes and their related miRNAs. The green circles nodes are the up regulated genes, and chocolate diamond nodes are the miRNAs.
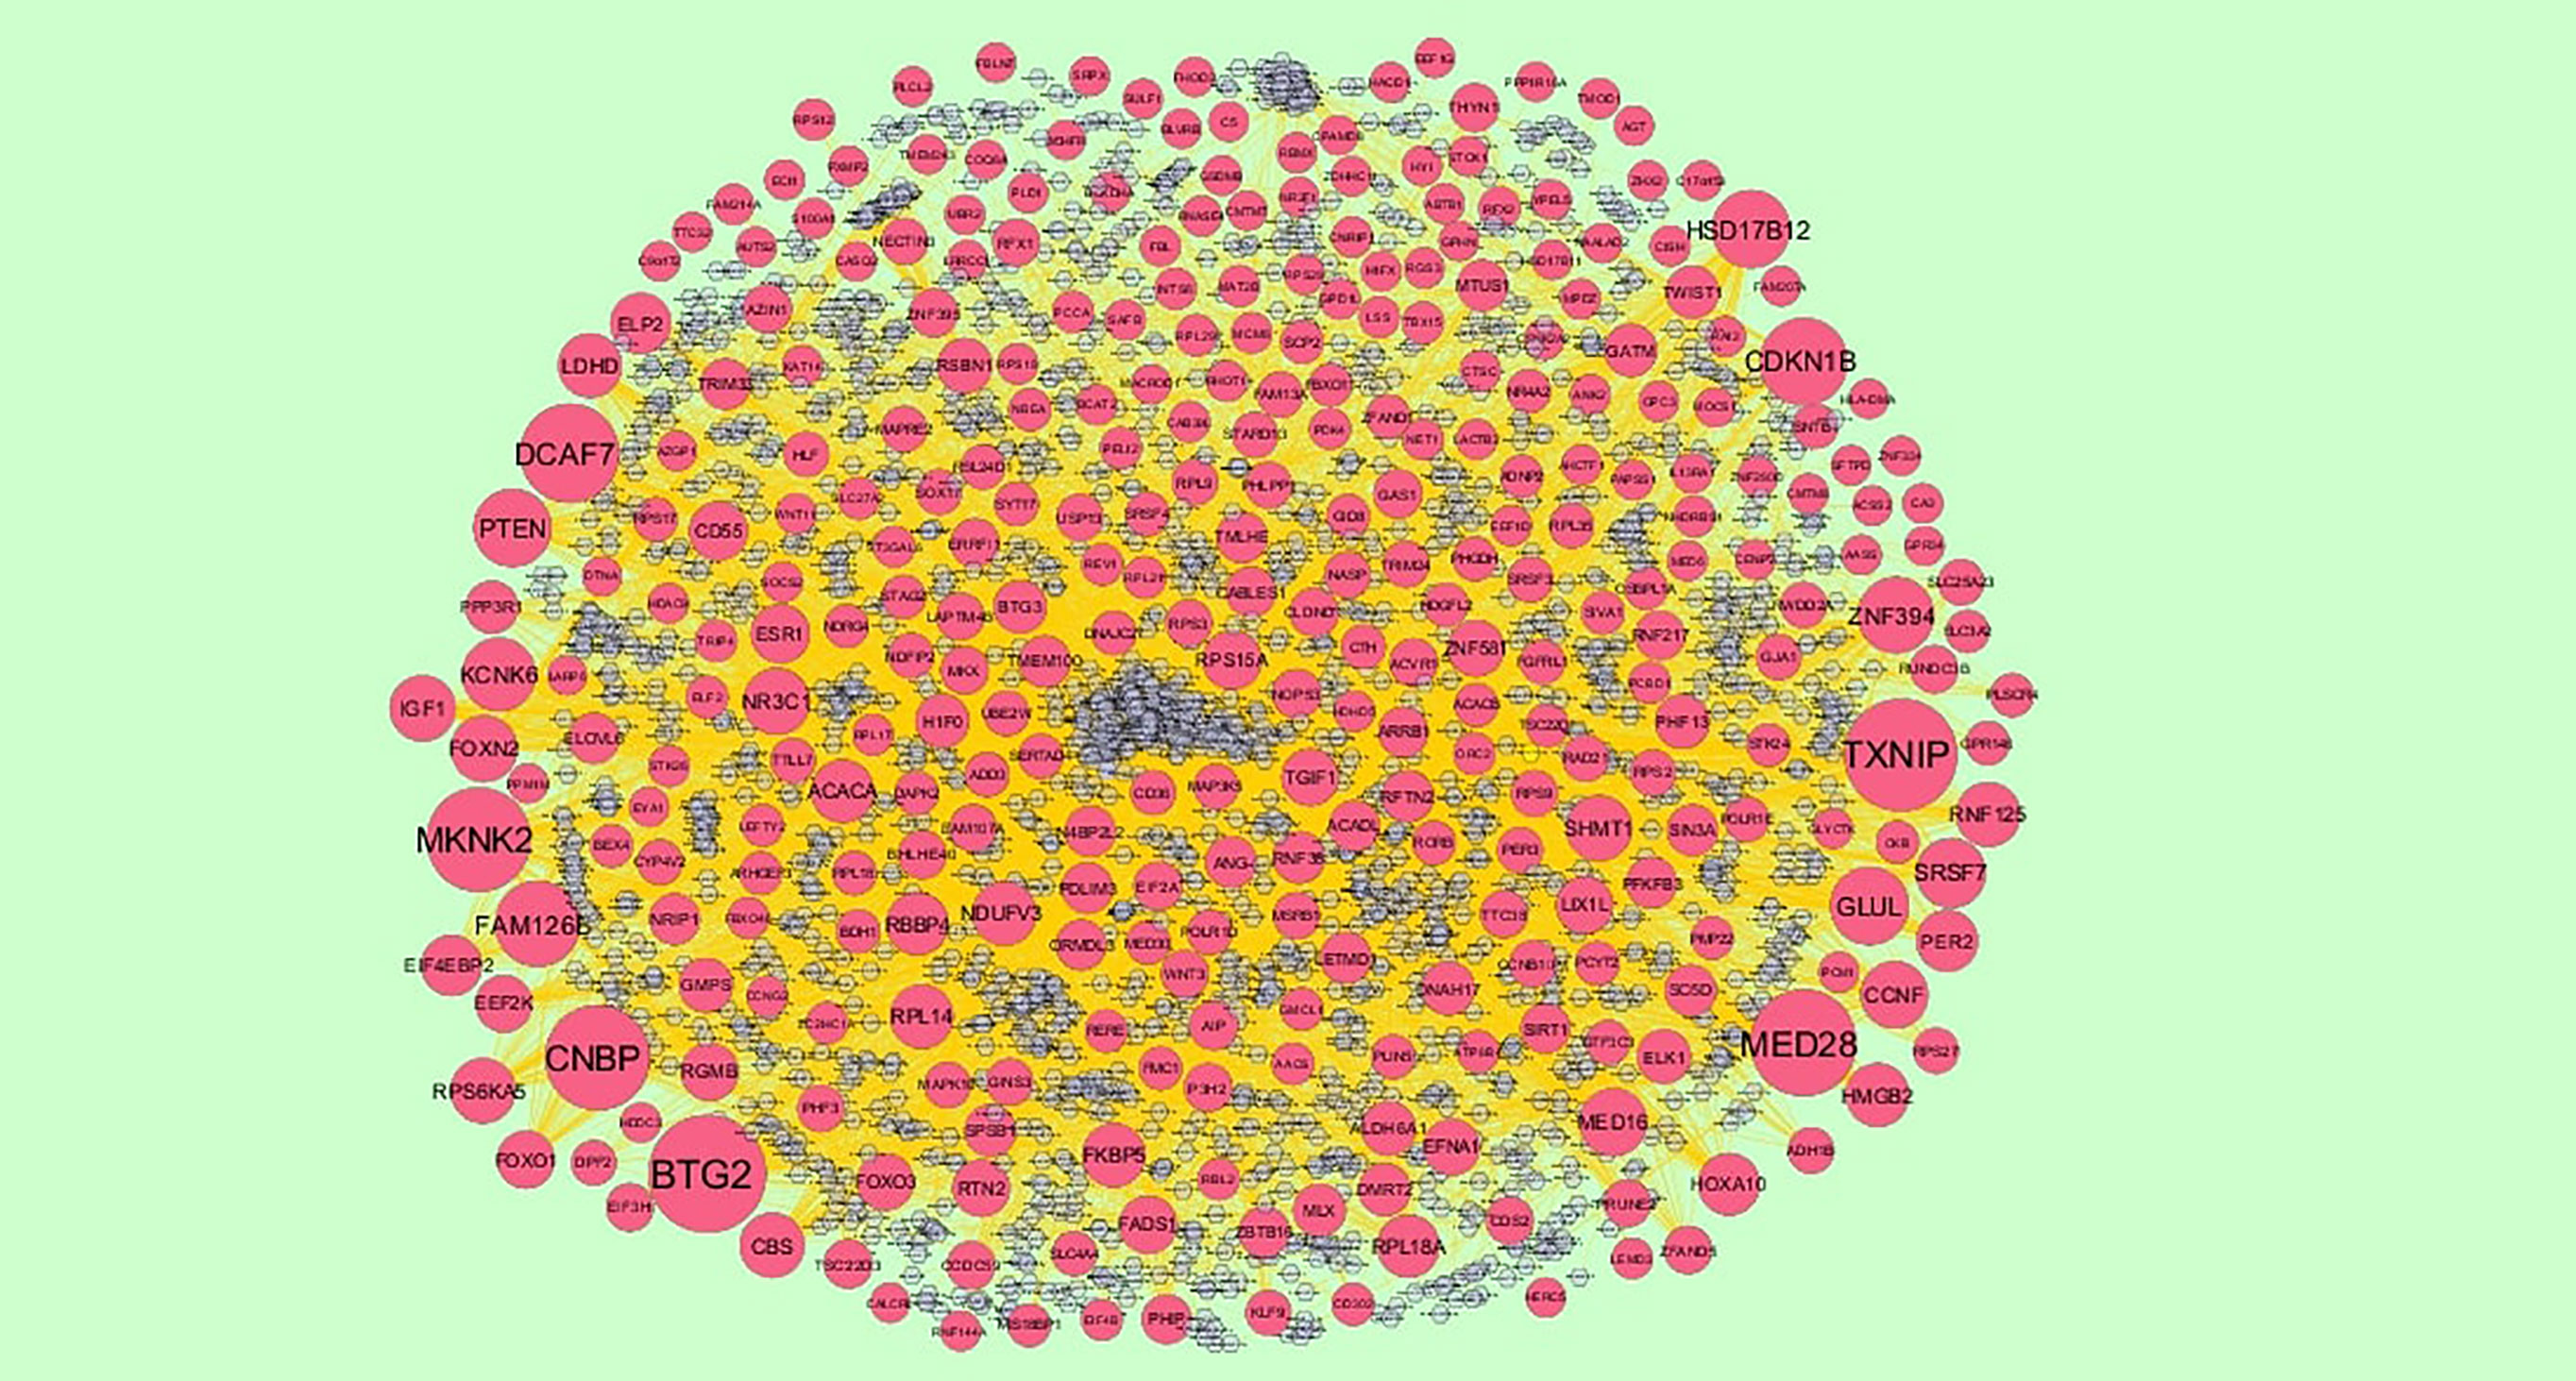
Figure 8 The network of down regulated genes and their related miRNAs. The red circles nodes are the down regulated genes, and chocolate diamond nodes are the miRNAs.
Construction of Target Genes - TF Regulatory Network
To further understand the regulatory network between TFs and target genes, through NetworkAnalyst database were constructed by Cytoscape. As shown in Figure 9, the TF-regulated network with 629 nodes (TF: 336; Gene: 293) and 6293 edges was obtained for up regulated target genes and Figure 10, the TF-regulated network with 2685 nodes (TF: 342; Gene: 299) and 8597 edges was obtained for down regulated target genes. Different target genes regulated by TFs are shown in Supplementary Table 9. YWHAH had been predicted to regulate 70 TFs (ex; MAZ), LYZ had been predicted to regulate 62 TFs (ex; TFDP1), HP had been predicted to regulate 60 TFs (ex; KLF9), TRAM2 had been predicted to regulate 54 TFs (ex; KLF16), CCND1 had been predicted to regulate 51 TFs (ex; EZH2), EFNA1 had been predicted to regulate 91 TFs (ex; TFDP1), MED16 had been predicted to regulate 85 TFs (ex; MAZ), RWDD2A had been predicted to regulate 82 TFs (ex; KDM5B), ADD3 had been predicted to regulate 82 TFs (ex; SAP30) and AIP had been predicted to regulate 82 TFs (ex; PHF8).
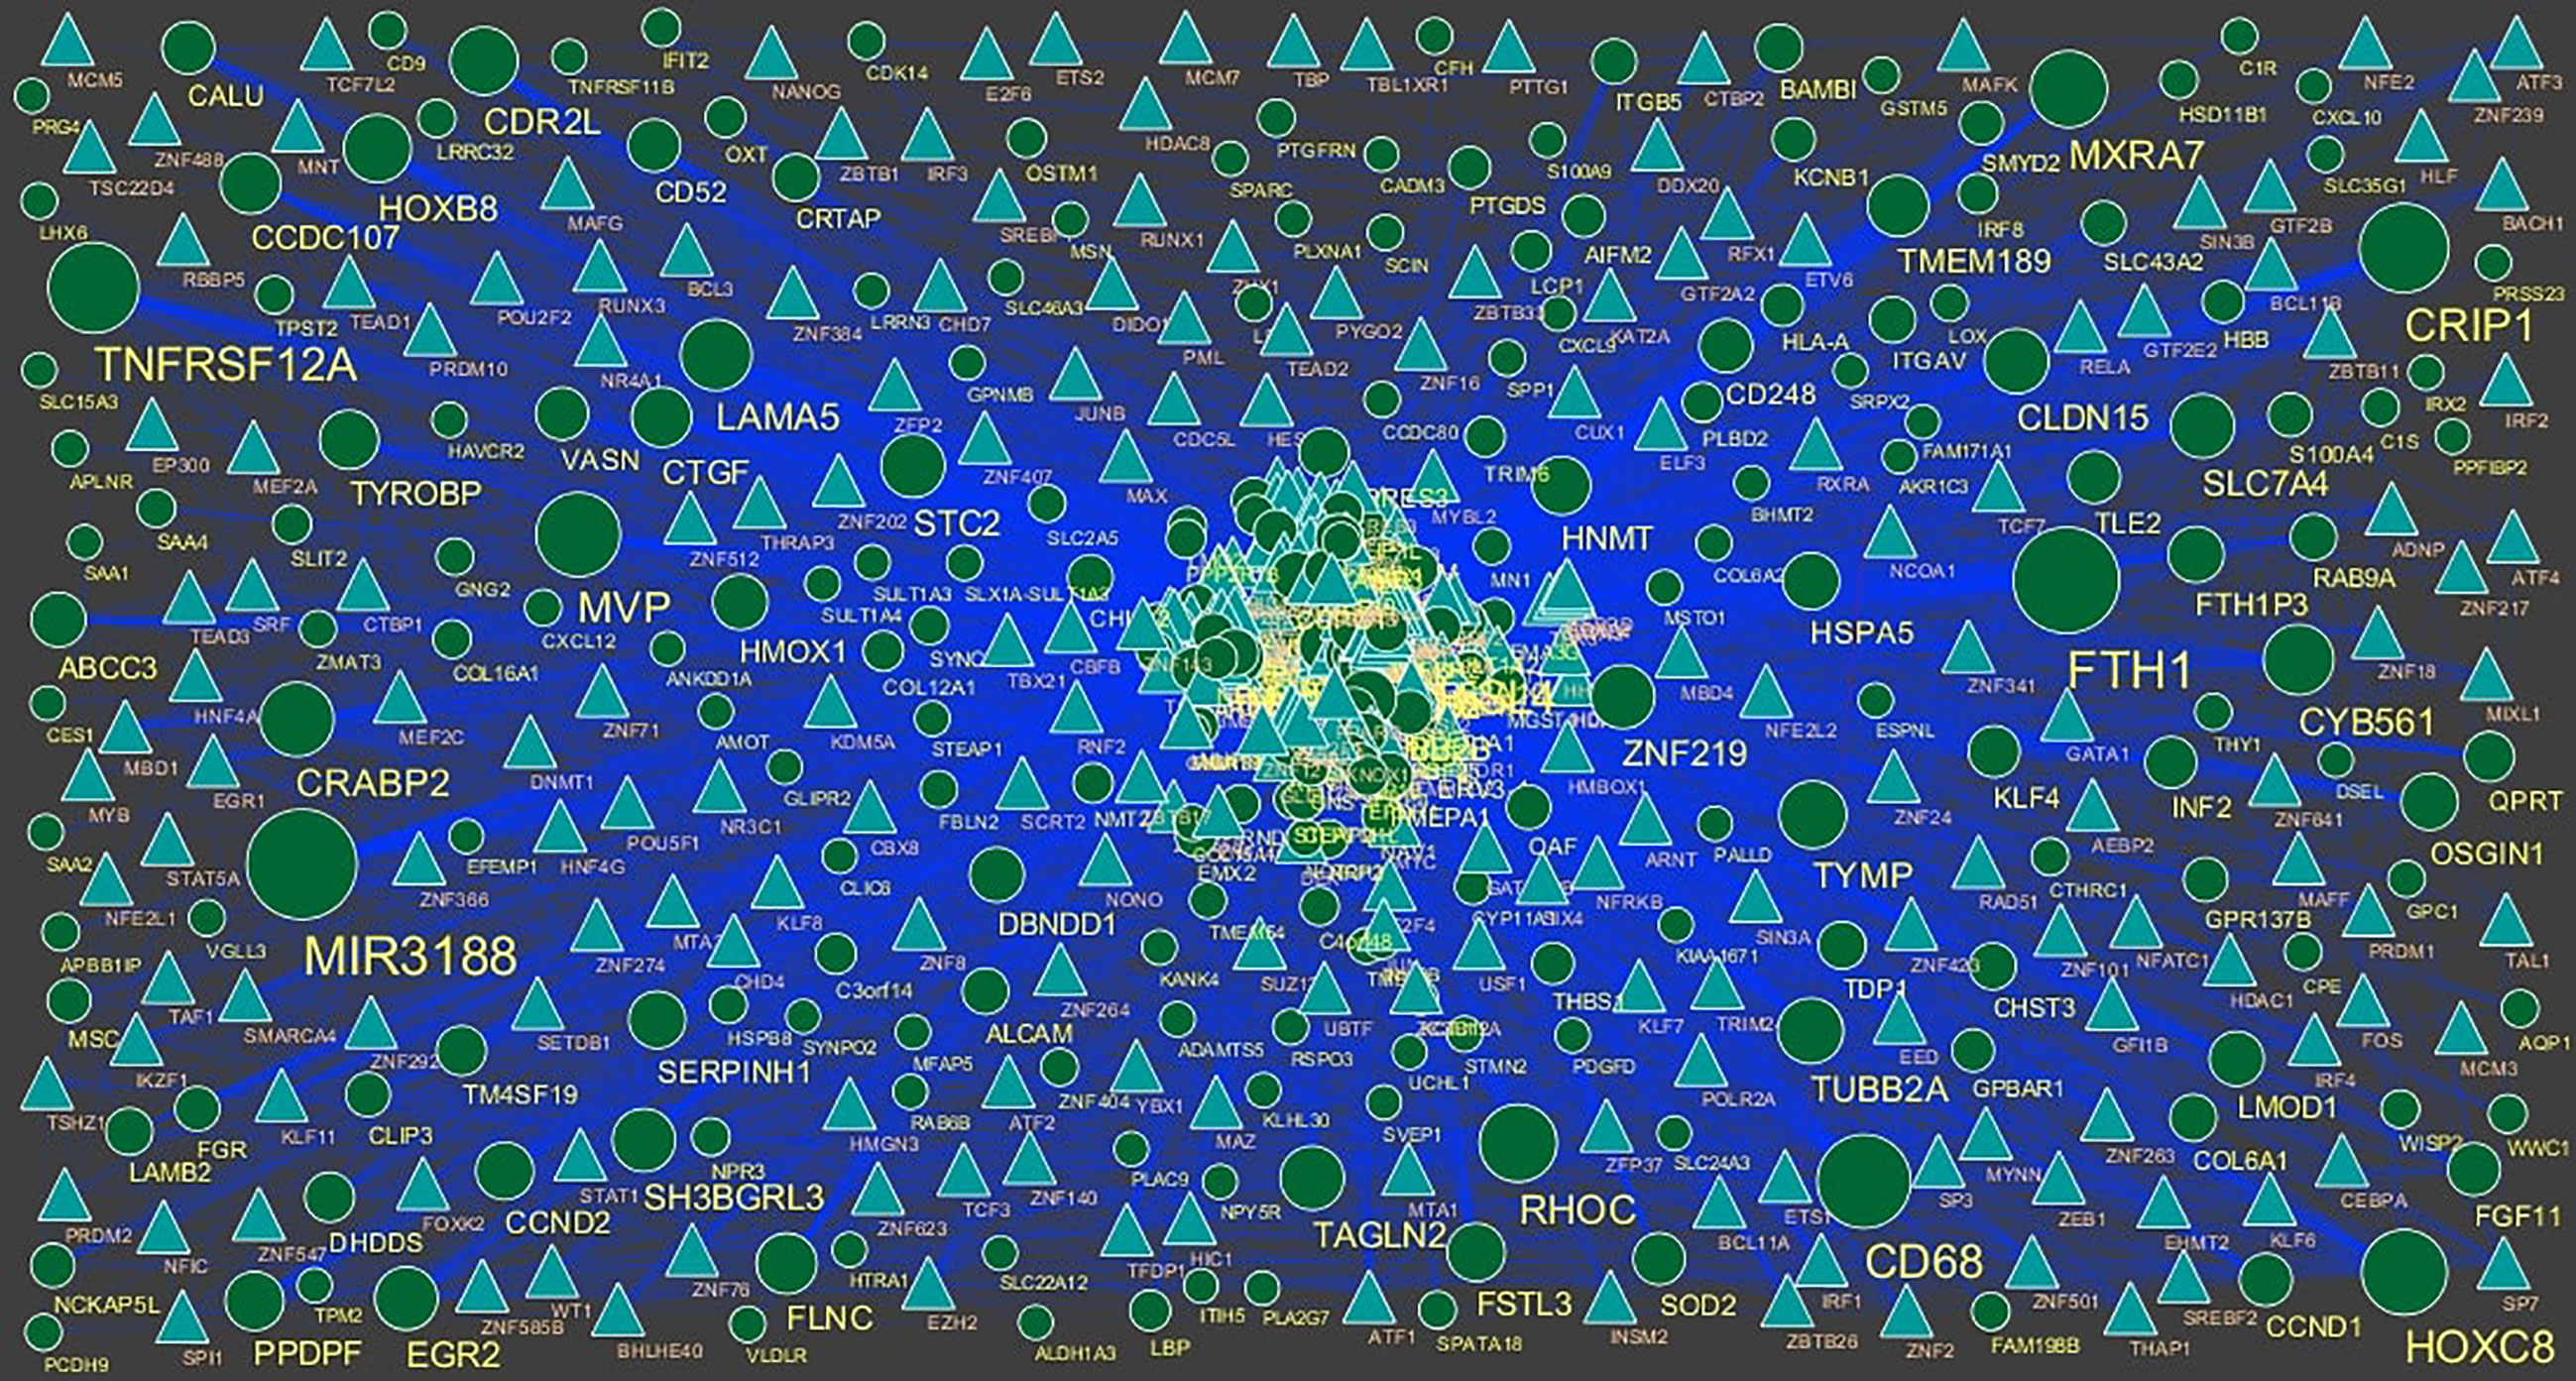
Figure 9 TF ‐ gene network of predicted target up regulated genes. (Blue triangle - TFs and green circles- target up regulated genes).
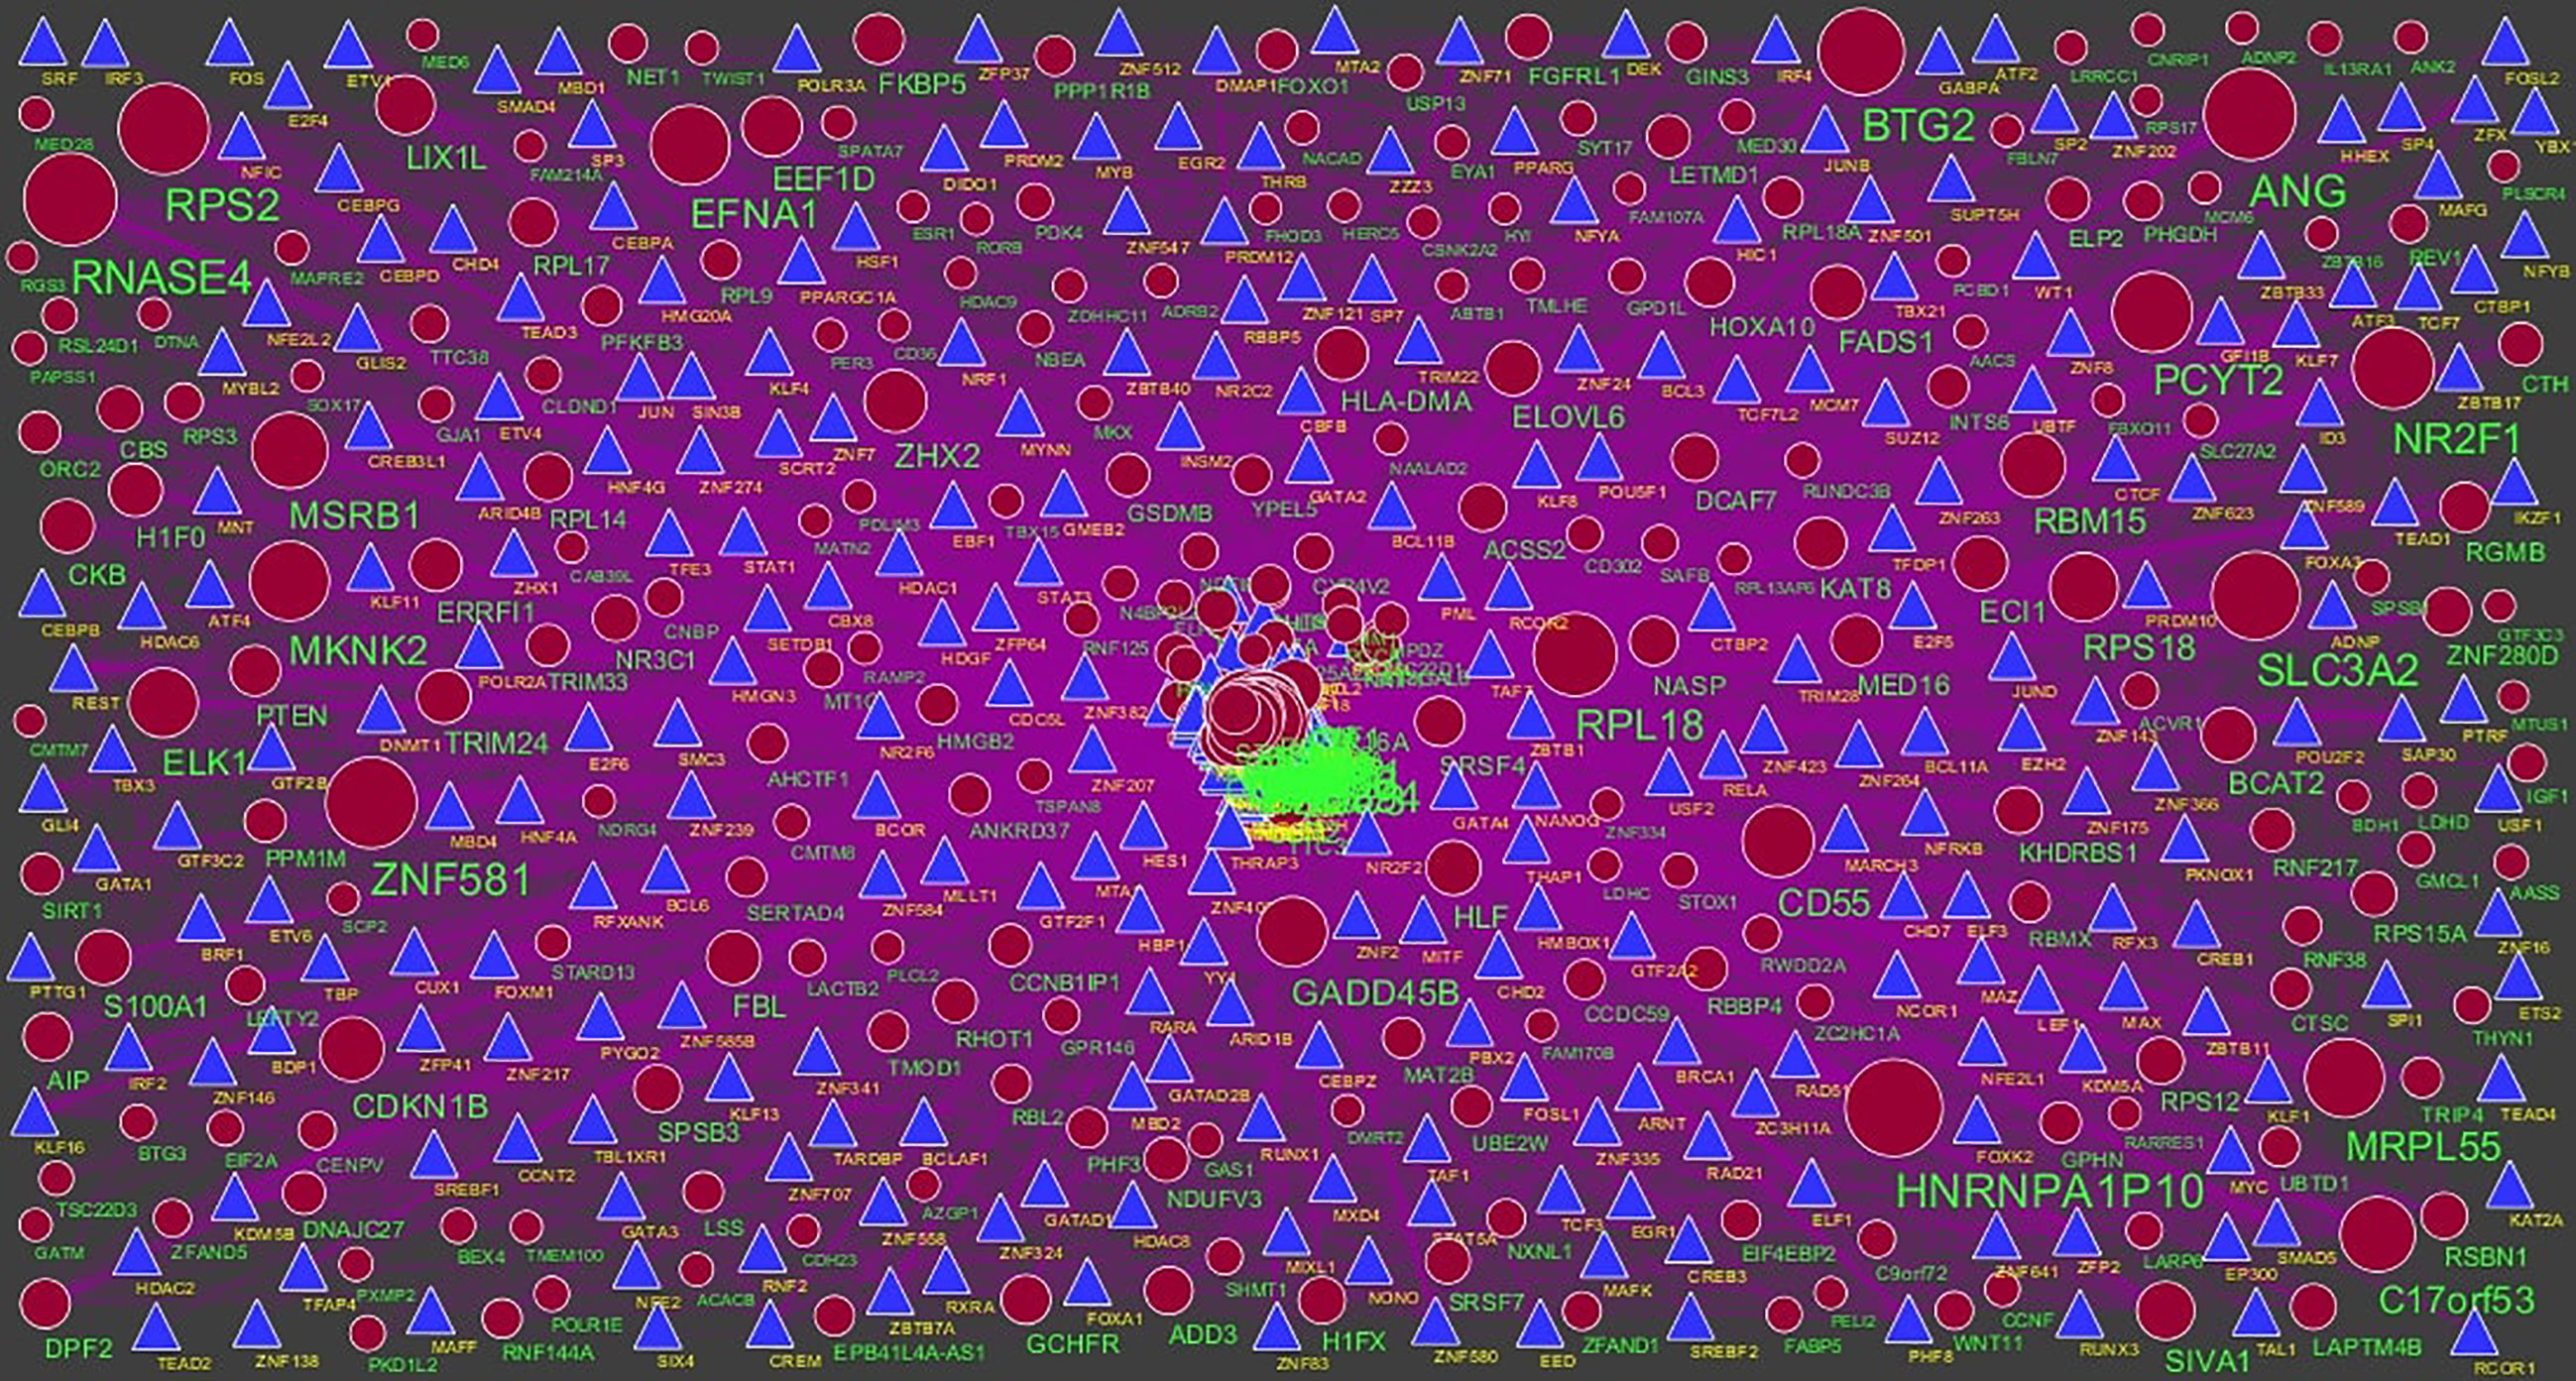
Figure 10 TF‐gene network of predicted target down regulated genes. (Blue triangle - TFs and red circles- target up regulated genes).
Validation of Hub Genes
Immunohistochemical analysis demonstrated that the expression of STAT3, CORO1C, SERPINH1, MVP and ITGB5 were highly expressed in adipose tissues, whereas PCM1, SIRT1, EEF1G, PTEN and RPS2 were low expressed in adipose tissue (Figure 11I) and Box plots is showed in Figure 11II. Validated by ROC curves, we found that 10 hub genes had high sensitivity and specificity, including STAT3 (0.951), CORO1C (0.799), SERPINH1 (0.924), MVP (0.938), ITGB5 (0.938), PCM1 (0.826), SIRT1 (0.799), EEF1G (0.913), PTEN (0.833) and RPS2 (0.840) (Figure 12). The 10 hub genes might be biomarkers of obesity and have positive implications for early medical intervention of the disease.
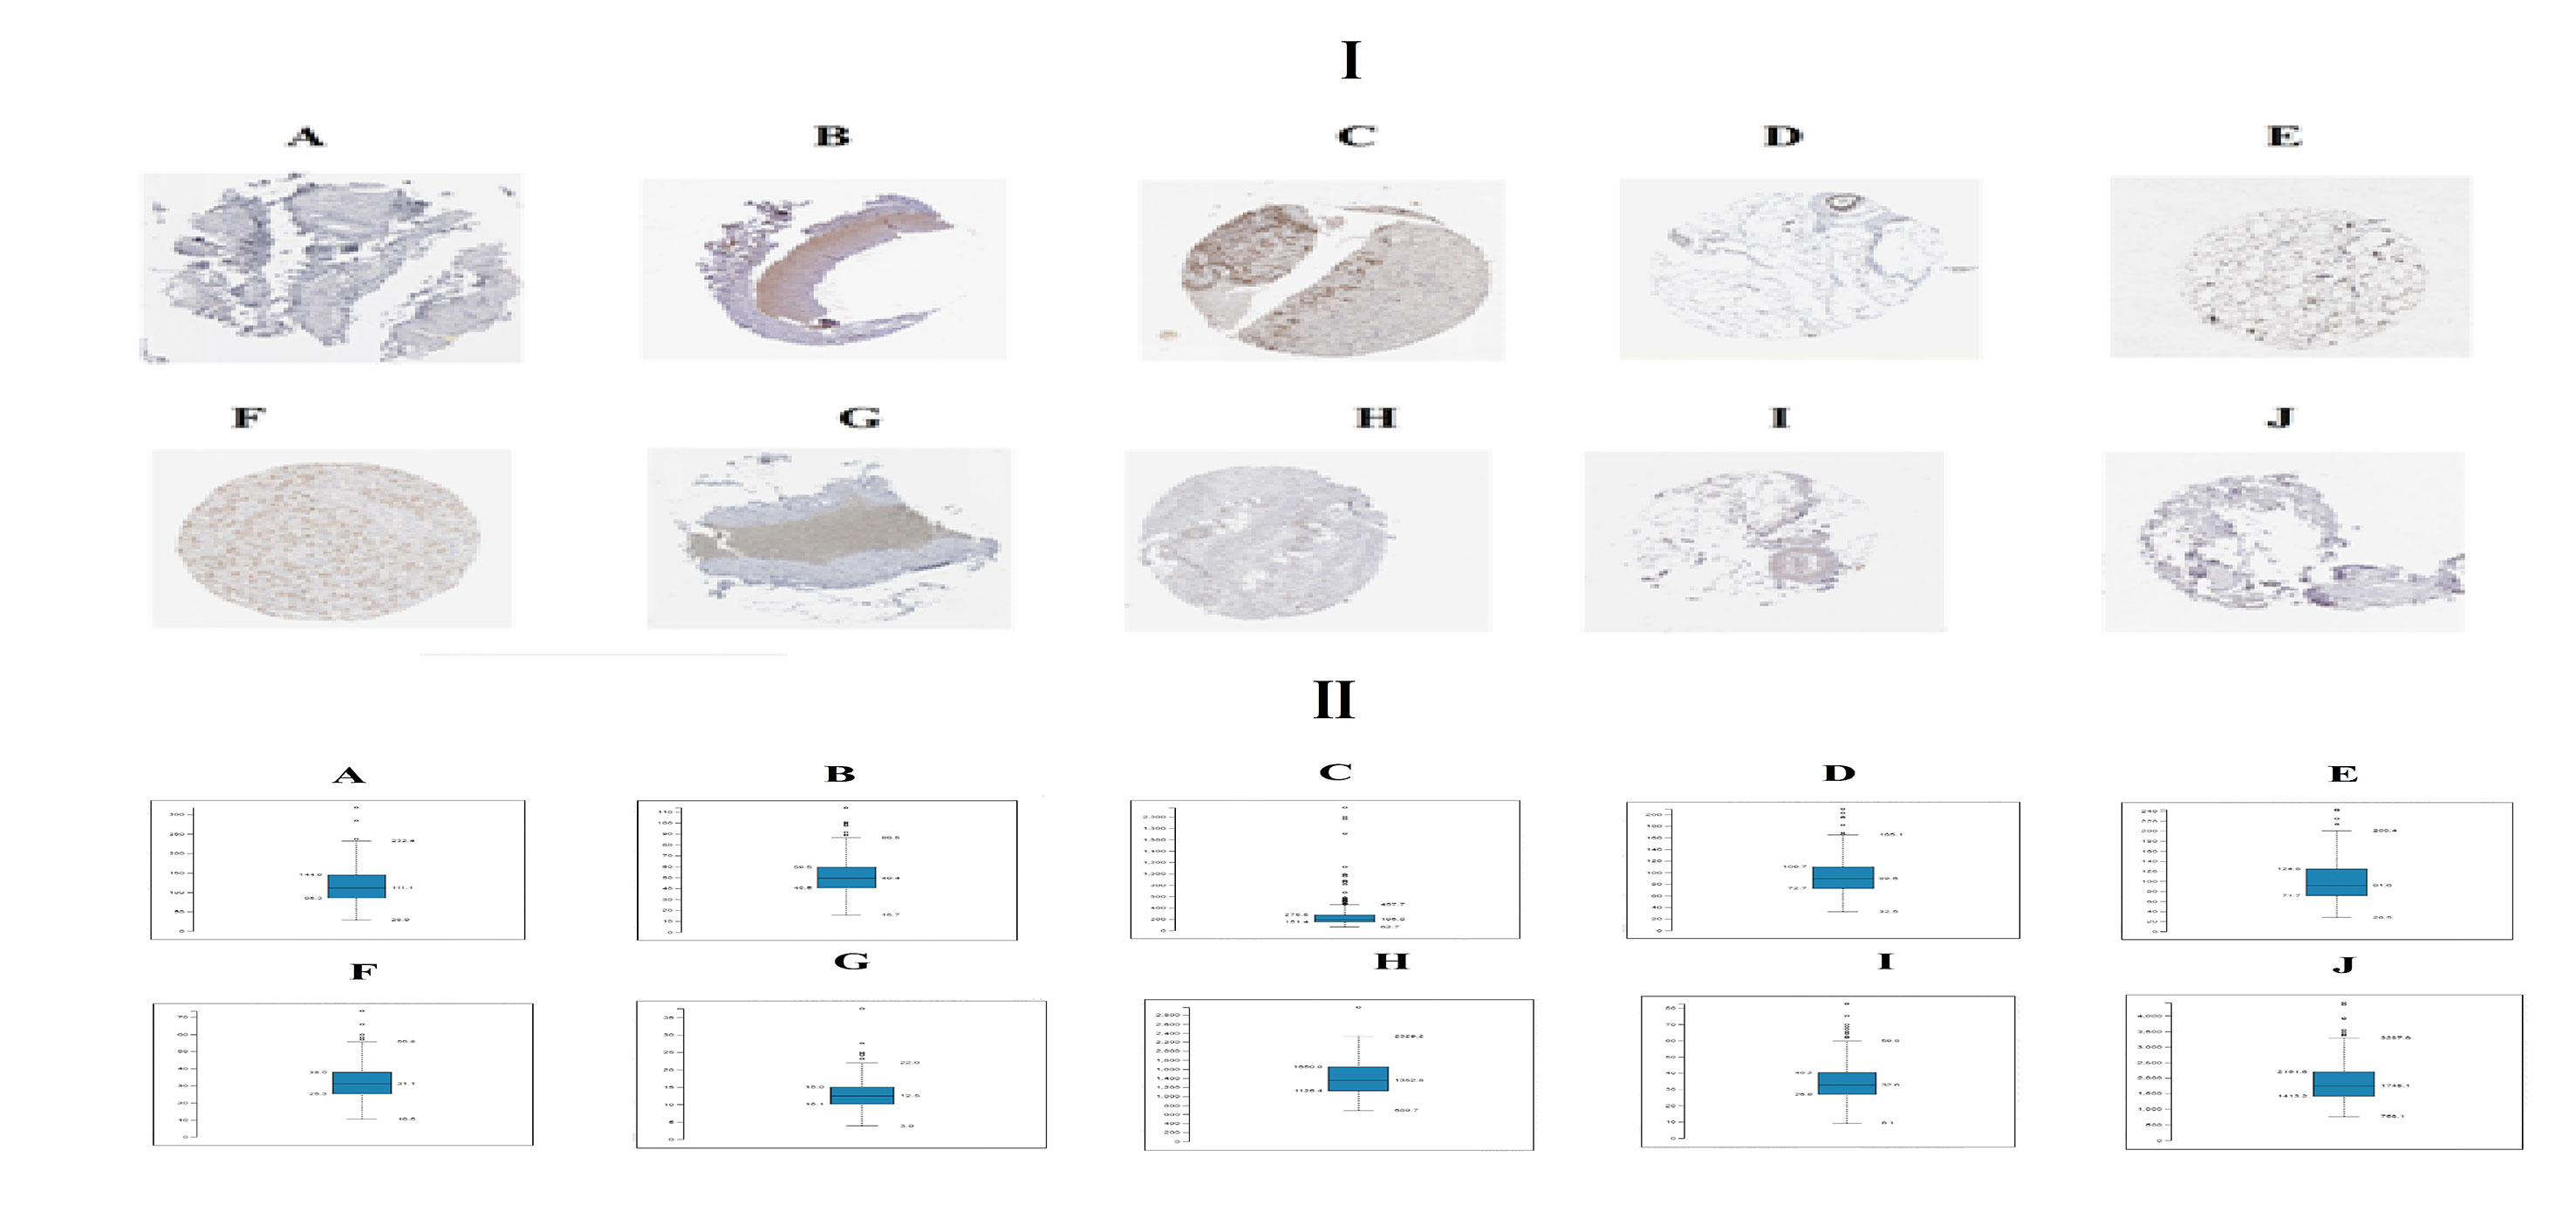
Figure 11 I) Immunohisto chemical l (IHC) analyses of hub genes were produced using the human protein atlas (HPA) online platform. II) Box plot for IHC analysis of hub genes (A) STAT3 (B) CORO1C (C) SERPINH1 (D) MVP (E) ITGB5 (F) PCM1 (G) SIRT1 (H) EEF1G (I) PTEN (J) RPS2.
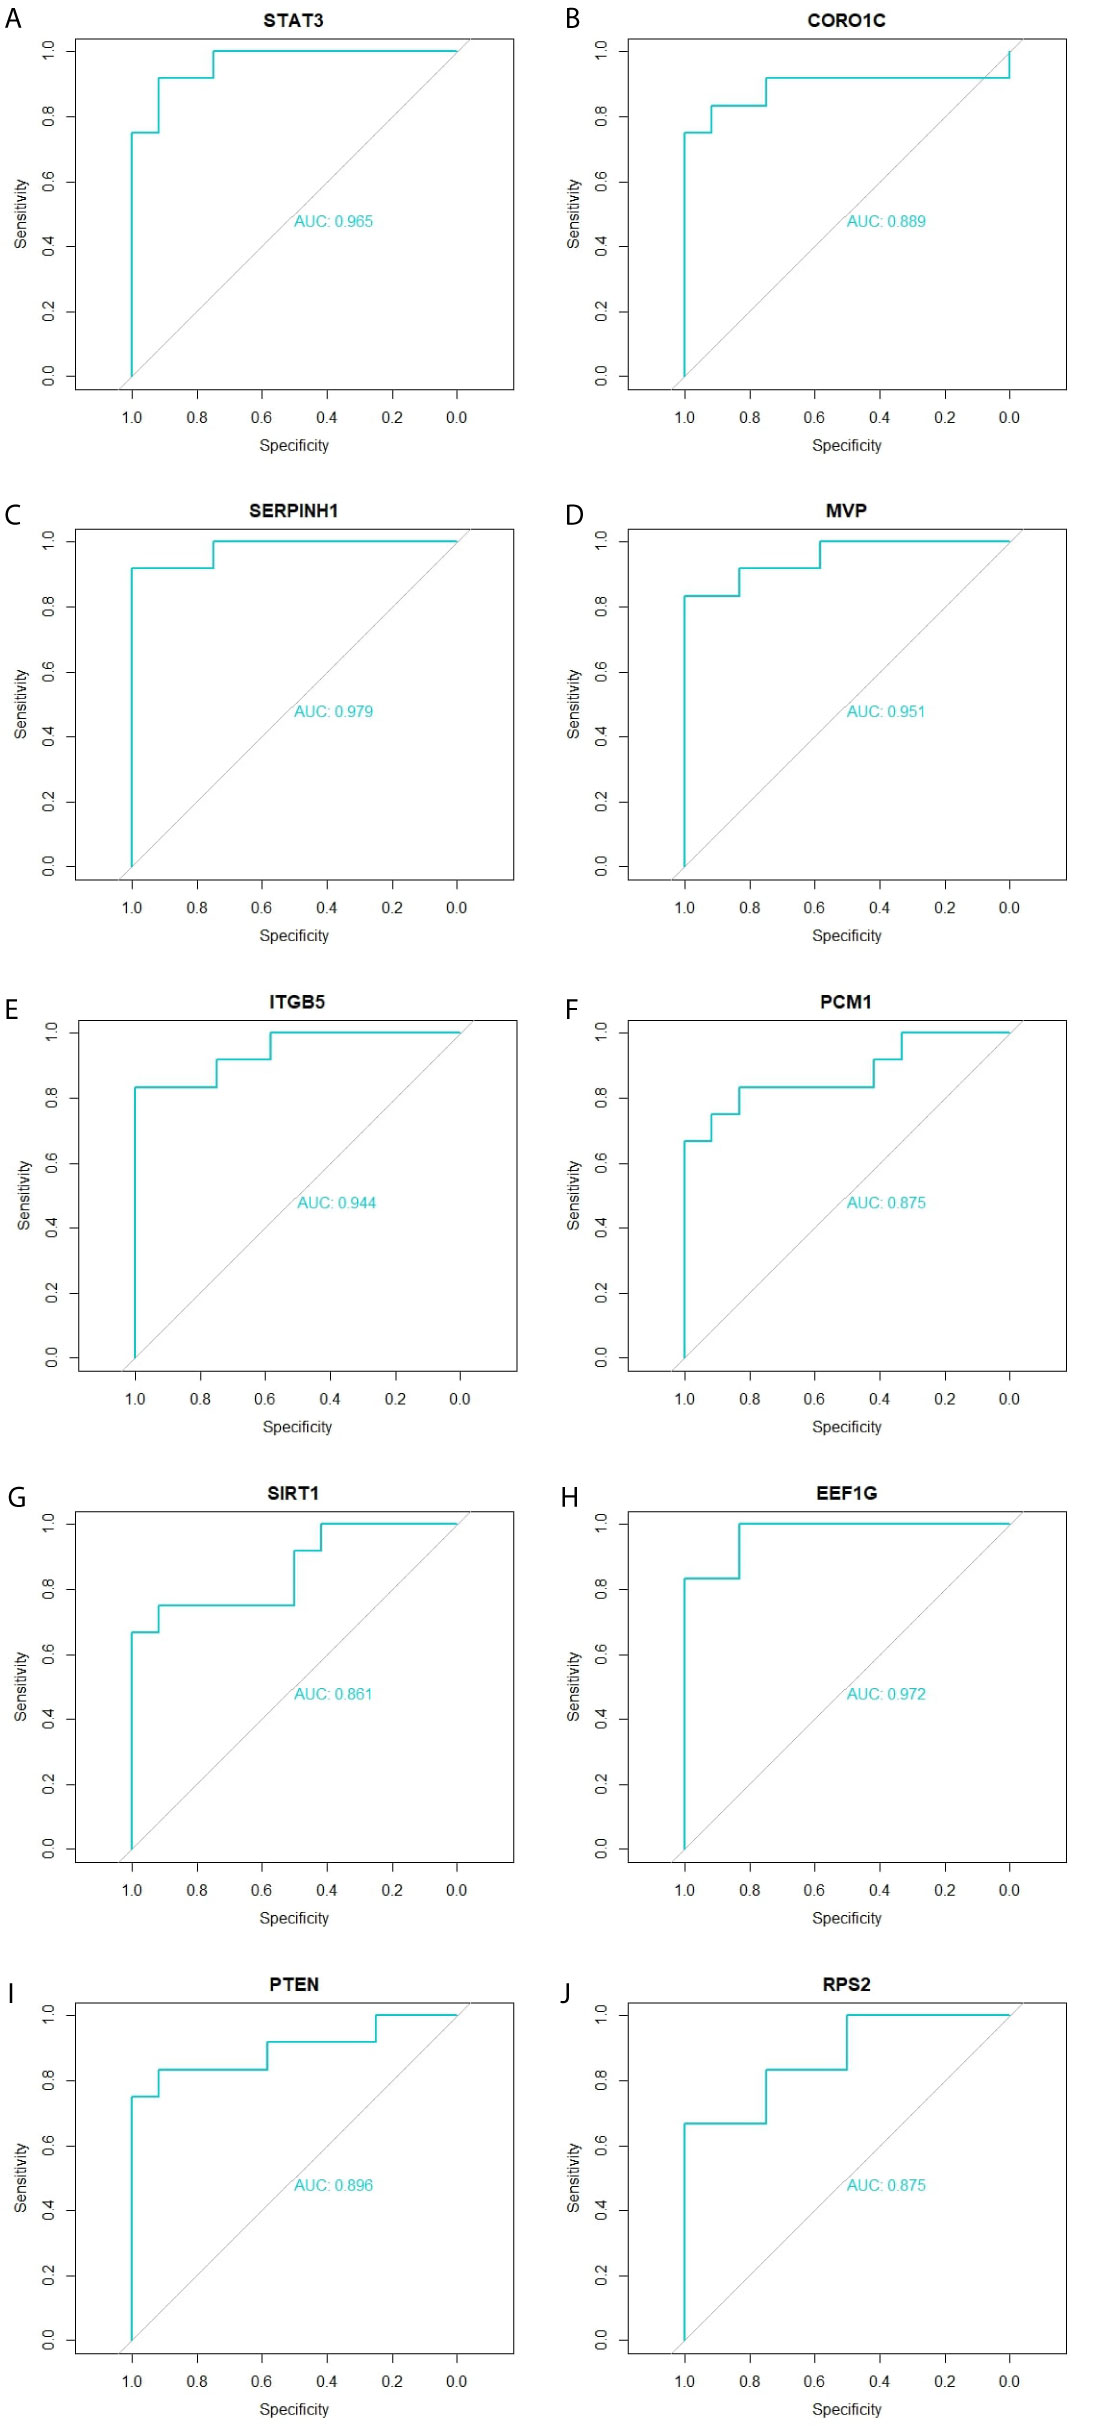
Figure 12 ROC curve validated the sensitivity, specificity of hub genes as a predictive biomarker for obesity prognosis. (A) STAT3 (B) CORO1C (C) SERPINH1 (D) MVP (E) ITGB5 (F) PCM1 (G) SIRT1 (H) EEF1G (I) PTEN (J) RPS2.
Detection of the mRNA Expression of the Hub Genes by RT-PCR
The adipocytes were removed to detect the mRNA expression levels of hub genes in the PPI network, including STAT3, CORO1C, SERPINH1, MVP, ITGB5, PCM1, SIRT1, EEF1G, PTEN and RPS2. It was found that the mRNA expression levels of STAT3, CORO1C, SERPINH1, MVP and ITGB5 were significantly increased in the obesity compared with the control group. Furthermore, the results illustrate that the mRNA expression levels of PCM1, SIRT1, EEF1G, PTEN and RPS2 were significantly decreased in the obesity compared with the control group (Figure 13). Therefore, the RT-PCR results of the hub genes were consistent with the bioinformatics analysis.
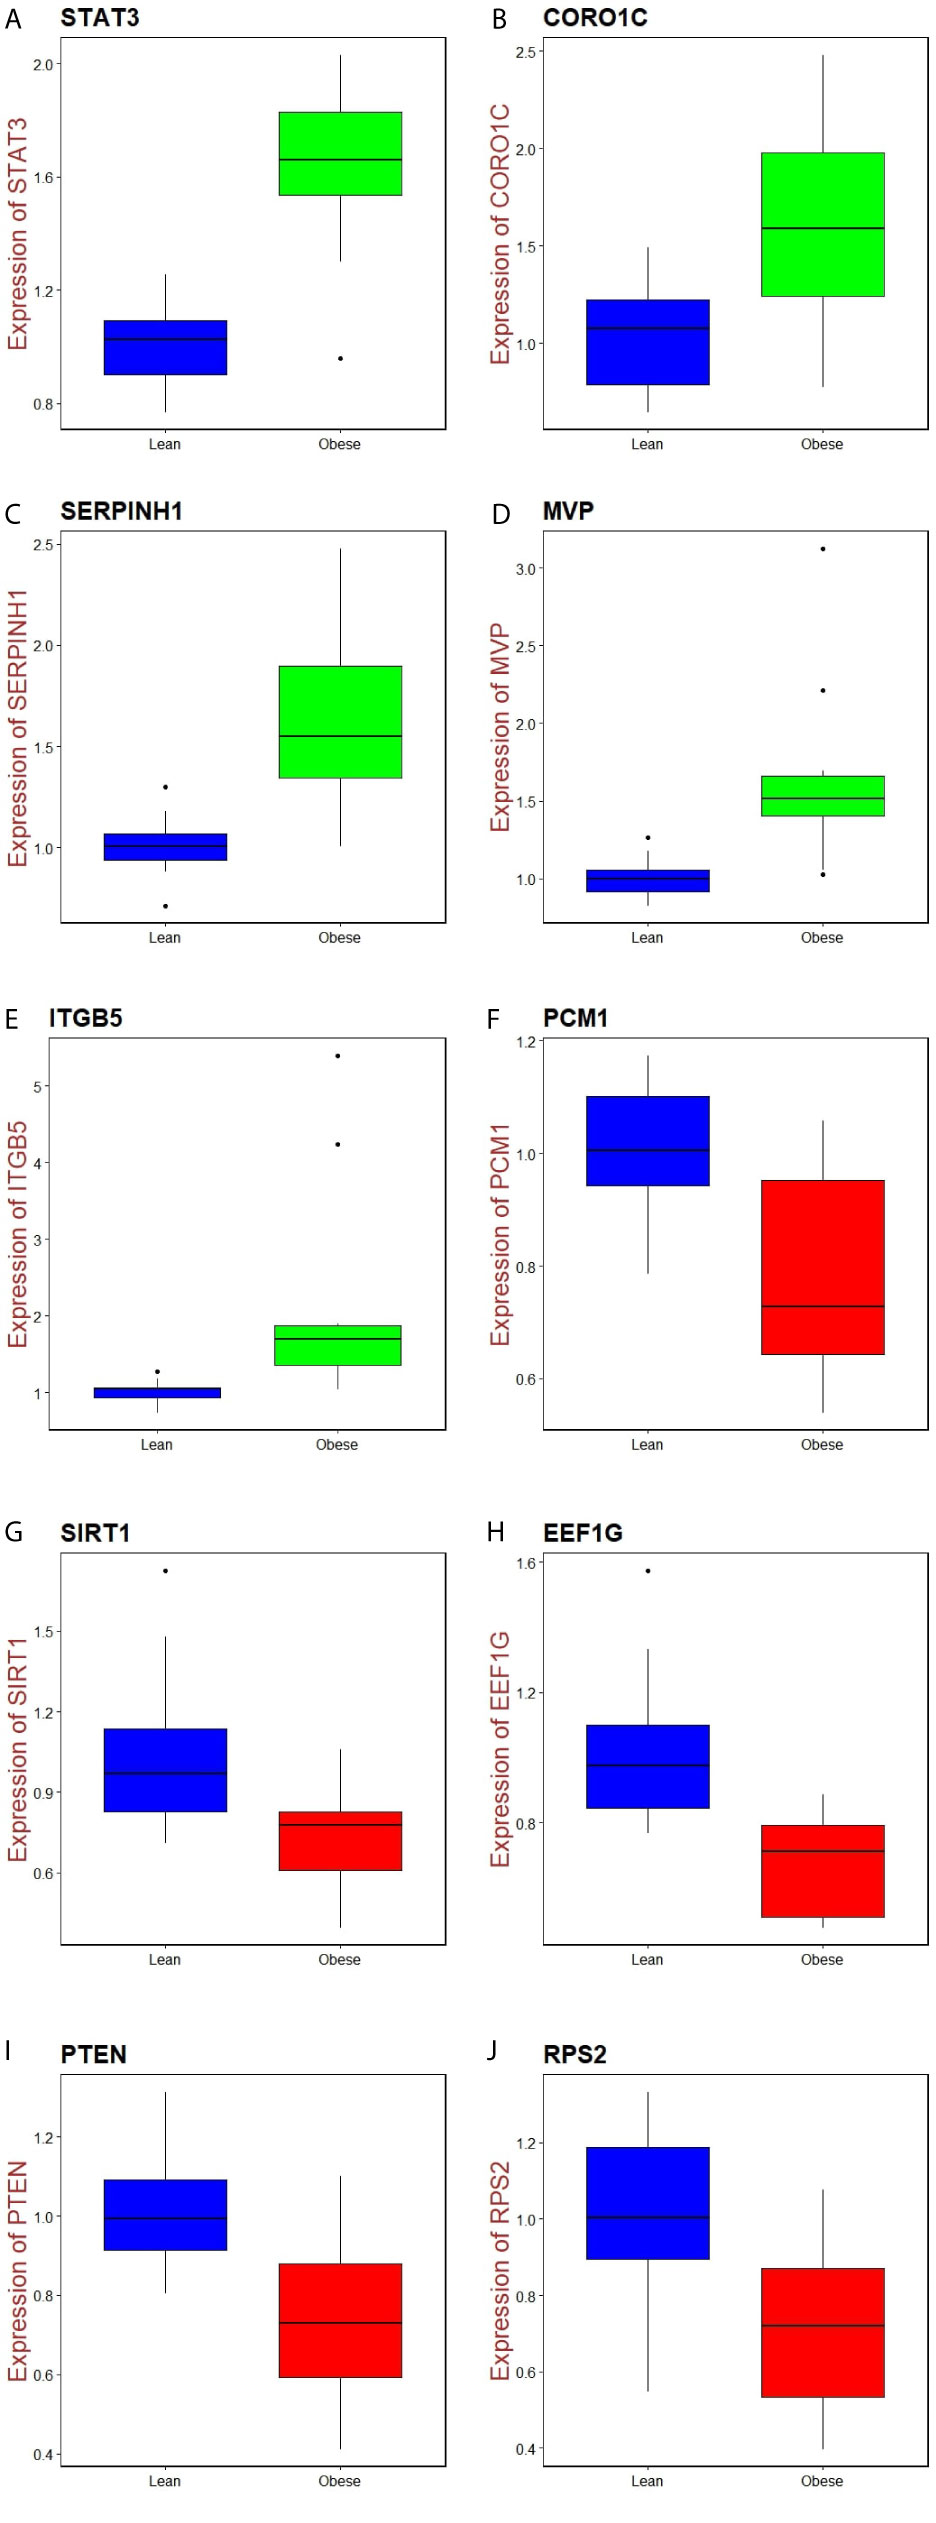
Figure 13 Validation of hub genes by RT- PCR. (A) STAT3 (B) CORO1C (C) SERPINH1 (D) MVP E) ITGB5 (F) PCM1 (G) SIRT1 (H) EEF1G (I) PTEN (J) RPS2.
Molecular Docking Studies
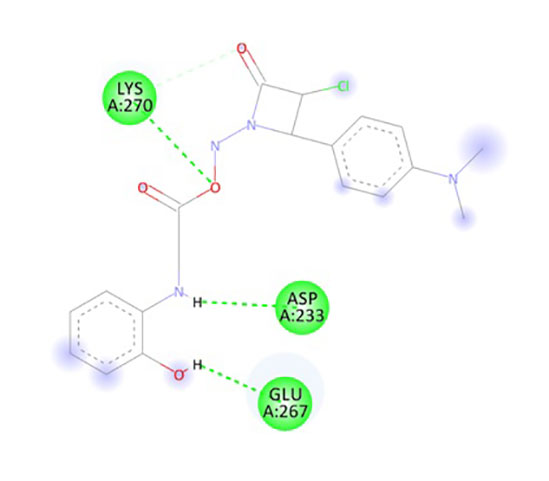
In the present research, the docking simulations are performed to identify the active site conformation and major interactions responsible for complex stability with the ligand receptor. Designed novel molecules containing four membered more sensitive β-lactam ring, the four membered and performed docking studies using Sybyl X 2.1 drug design software. Molecules containing β-lactam ring is designed which is easily reacting group Figure 14A, based on the structure of anti-obesity drug orlistatfour membered ring Figure 14B, has potent pancreatic lipase inhibitory activity. The molecules were designed based on the structure of the standard anti-obesity drug orlistat. The one protein in each of three over expressed genes of ERBB2, its co-crystallized protein of PDB code 1MFL,HSPAB 8its co-crystallized protein of PDB code 5OOW and STAT 3its co-crystallized protein of PDB code of 3CWG respectively selected for docking studies. The investigation of designed molecules was performed to identify the potential molecule. The most of the designed molecules with respect to the standard anti-obesity drug orlistat, obtained C-score greater than 5. The C-score greater than 5 are said to be an active, among total of 32 designed molecules few molecules have excellent good binding energy (C-score) greater than 7 respectively. The molecule ND4, FU5 and PF5 obtained score of 7.242, 7.659 and 7.842 with 1MFL and the molecules PM6, ND1, ND3, ND5, ND6, PF5 and PF6 obtained score of 7.5269, 7.6271, 8.0824, 7.6595, 7.0792 and 7.2659 with 3 CWG and the molecules PM4, PM6, ND1, ND5, ND6, PF4, and PF obtained good binding score of 7.1631, 8.8312, 7.3781, 7.9872, 7.9567, 7.0213 and 7.0386 with 5OOW respectively. The molecules found binding score 5-6 is PM1, PM2, PM3, PM4, PM5, PM6, PM7, PM8, ND1, ND2, ND3, ND5, ND6, ND7, ND8, FU1, FU2, FU3, FU4, FU7, FU8, PF1, PF2, PF3, PF4, PF6, PF7, PF8 and standard olistat (STD) with 1MFL and PM2, PM6, FU17, FU18, FU19, FU20, FU23, PF26, PF27, PF28 and PF32 with 3CWG, and PM1, PM2, PM3, PM5, PM7, PM8, ND2, ND3, ND4, ND7, ND8, FU1, FU2, FU3, FU4, FU5, FU6, FU7, FU8, PF1, PF2, PF3, PF6, PF7 and PF8 5OOW respectively. No molecules obtained binding score with less than 5 respectively; the values are depicted in Supplementary Table 10. The molecule PF5 has good binding score with all three proteins and ND1, ND3, ND5 and ND6 obtained good binding score with 3CWG and 5OOW. The molecule ND5 has highest binding score and is very close with standard olistat, the interaction with protein 5OOW and hydrogen bonding and other bonding interactions with amino acids are depicted by 3D (Figure 15) and 2D (Figure 16) images.
Discussion
Due to the heterogeneity of obesity, obesity was still a disease with high rates of prevalence. This might be due to the scarcity of valid biomarkers for detection of obesity and of valid treatment for obesity. Therefore, molecular mechanisms of obesity are necessary for scientists to find the treat and diagnosis method of obesity. Because of the fast advancement of bioinformatics analysis, it is more convenient to find out the genetic modification in obesity. Bioinformatics analysis enables us to explore the gene, the genetic change in obesity, which had been proved to be a better approach to identify novel biomarkers.
In our study, a total of 876 DEGs were diagnosed from gene expression dataset, consisting of 438 up regulated genes and 438 down regulated genes in obese patients compared to lean persons. Study showed that PTGDS (prostaglandin D2 synthase) (45), LBP (lipopolysaccharide binding protein) (46), EGFL6 (47), STAT3 (48) and HDAC9 (49) were closely associated with obesity. The expression level of CYP11A1 (50) and WNT11 (51) were linked to cancer progression, but these genes might be novel target for obesity. A previous study showed that expression of GPR146 played an important role in insulin resistance (52), but these genes might be novel target for obesity. Aberrant expression of RFX1 (53) and (54) are noticeable factors in the heart disease, but these genes might be novel target for obesity. CLDND1 expression predicted poor therapeutic outcomes of hypertension patients (55).
Functional enrichment analysis of DEGs was implemented. SULT1A1 (56), SULT1A2 (56), COL6A1 (57), COL6A2 (58), SOS1 (59), STAT1 (60), COL5A2 (61), RND3 (62), COL15A1 (63), CBS (cystathionine-beta-synthase) (64), MCM6 (65), TNFRSF12A (66), FMOD (fibromodulin) (67), TYMP (thymidine phosphorylase) (68), ALPL (alkaline phosphatase, biomineralization associated) (69), EFEMP1 (70), MFAP4 (71), IGFBP5 (72), GLUL (glutamate-ammonia ligase) (73), HACD1 (74) and SCP2 (75) have been reported to be biomarkers of heart disease or play a vital role in its pathogenesis, but these genes might be novel target for obesity. Several studies have shown that expressions of COL1A2 (76), COL3A1 (77), EEF2K (78), ANGPT1 (79), NOTCH3 (80) and TGFBR2 (81) can be a strong prognosis biomarker in patients with hypertension, but these genes might be novel target for obesity. DAG1 (82), ITGAV (integrin subunit alpha V) (83), LAMA5 (84), SPP1 (85), COL11A1 (86), COL12A1 (87), SERPINH1 (88), RHOC (89), RPL14 (90), RPL29 (91), RPS12 (92), RPS15A (93), RPS2 (94), RPS27 (95), RPS3 (96), RBL2 (97), EEF1D (98), ACACA (acetyl-CoA carboxylase alpha) (99), ORC2 (100), PHGDH (phosphoglycerate dehydrogenase) (101), SHMT1 (102), NRCAM (neuronal cell adhesion molecule) (103), NRP2 (104), RSPO3 (105), SRPX2 (106), THY1 (107), CD248 (108), CLEC3B (109), CST3 (110), CTHRC1 (111), GPC1 (112), ACSS2 (113) and HSD17B12 (114) have been extensively reported as a tumor biomarkers, but these genes might be novel target for obesity. The results obtained were consistent with studies that role of LAMB3 (115), THBS1 (116), TIMP1 (117), LOX (lysyl oxidase) (118), MMP9 (119), HSD11B1 (120), ITGB2 (121), HMOX1 (122), SOD2 (123), AKR1C3 (124), MAT2B (125), FOXO1 (126), FOXO3 (127), SIRT1 (128), ACACB (acetyl-CoA carboxylase beta) (129), ELK1 (130), MAP3K5 (131), CTH (cystathionine gamma-lyase) (132), AMOT (angiomotin) (133), CCDC80 (134), CXCL10 (135), ERBB2 (136), KLF4 (137), LEP (leptin) (138), MFGE8 (139), SLIT2 (140), TNMD (tenomodulin) (141), ADAMTS5 (142), ELN (elastin) (143), HTRA1 (144), LUM (lumican) (145), MFAP5 (146), IL1RN (147), ACADL (acyl-CoA dehydrogenase long chain) (148), AGT (angiotensinogen) (149), FADS1 (150), PDK4 (151), PER2 (152) and SLC27A2 (153) in obesity. CDKN1B was shown to be a potential predictor of advanced hyperinsulinemia (154), but this gene might be novel target for obesity. Reports illustrate that CXCL12 (155) and IGFBP6 (156) and ELOVL6 (157) were expressed in patients with insulin resistance, but these genes might be novel target for obesity.
Furthermore, by constructing PPI networks and moduleas, we identified some key genes that provide new insights for obesity diagnosis, prognosis, and drug target identification. Expression of the HSPA8 (158) and CKB (159) were correlated with disease grades of hypertension, but these genes might be novel target for obesity. Recent studies have proposed that HSPA5 (160), YWHAH (161), ESR1 (162), PTEN (163), IRAK1 (164), CYR61 (165) and ZBTB16 (166) are involved in obesity. Previous reports demonstrate that SPTAN1 (167), STEAP2 (168), NEK6 (169), ARRB1 (170), FBXO11 (171), UBR2 (172), INTS6 (173), CDK14 (174). LMO2 (175), MSN (176), TAGLN2 (177), SRSF3 (178), SAFB (179), SIN3A (180), TRIM24 (181) and AUTS2 (182) appears to be constitutively activated in cancer, but these genes might be novel target for obesity. CSNK2A2 expression might be regarded as an indicator of susceptibility to heart disease (183), but this gene might be novel target for obesity. COPG2, FBL, CSNK2B, PCM1, ZNF581, KHDRBS1, RBMX, RBBP4 and DCAF7 are novel biomarkers for obesity.
Target genes - miRNA regulatory network and target genes - TF regulatory network were constructed and analyzed. A previous study reported that CCND1 (184) and HP (185) were expressed in obesity. CCND2 (186) and TXNIP (187) are a potential marker for the detection and prognosis of insulin resistance, but these genes might be novel target for obesity. Other research has revealed that BTG2 was expressed in obesity (188). Expression of MED28 (189) and EFNA1 (190) might participate in cancer progression, but these genes might be novel target for obesity. TUBB2A, TMEM189, CNBP, LYZ, TRAM2, MED16, RWDD2A, ADD3 and AIP are a novel biomarkers for obesity.
However, this investigation had some limitations. Primarily, the mechanisms of several hub genes in the pathological process of obesity remain unclear, warranting needs further investigation. Moreover, the success of our small molecule drug compound screening in reducing obesity remains to be assessed.
In conclusion, in this study, we determined that STAT3, CORO1C, SERPINH1, MVP, ITGB5, PCM1, SIRT1, EEF1G, PTEN and RPS2 might be critical genes in the development and prognosis of obesity through bioinformatics analysis combined with validations. However, it is essential that further experiments are carried out and clinical data made available to confirm the results of our investigation and guide the discovery of future gene therapies against obesity.
Data Availability Statement
The datasets supporting the conclusions of this article are available in the ArrayExpress (https://www.ebi.ac.uk/arrayexpress/) repository. [E-MTAB-6728) (https://www.ebi.ac.uk/arrayexpress/experiments/E-MTAB-6728/)].
Author Contributions
HJ: Methodology and validation. BV: Writing original draft, and review and editing. NJ: Software and resources. CV: Investigation and resources. AT: Formal analysis and validation. IK: Supervision and resources. All authors contributed to the article and approved the submitted version.
Conflict of Interest
The authors declare that the research was conducted in the absence of any commercial or financial relationships that could be construed as a potential conflict of interest.
Acknowledgements
We thank Jan-Inge Bjune, Gunnar Mellgren and Simon N Dankel UNIVERSITY IN BERGEN, The Hormone Laboratory, 8.etg Lab Building, Jonas Lies road 91B, 5021 Bergen very much, the authors who deposited their microarray dataset, E-MTAB-6728, into the public Array Express database.
Supplementary Material
The Supplementary Material for this article can be found online at: https://www.frontiersin.org/articles/10.3389/fendo.2021.628907/full#supplementary-material
References
1. Cole TJ, Bellizzi MC, Flegal KM, Dietz WH. Establishing a Standard Definition for Child Overweight and Obesity Worldwide: International Survey. BMJ (2000) 320(7244):1240–3. doi: 10.1136/bmj.320.7244.1240
2. Krotkiewski M, Björntorp P, Sjöström L, Smith U. Impact of Obesity on Metabolism in Men and Women. Importance of Regional Adipose Tissue Distribution. J Clin Invest (1983) 72(3):1150–62. doi: 10.1172/JCI111040
3. Freedman DS, Khan LK, Dietz WH, Srinivasan SR, Berenson GS. Relationship of Childhood Obesity to Coronary Heart Disease Risk Factors in Adulthood: The Bogalusa Heart Study. Pediatrics (2001) 108(3):712–8. doi: 10.1542/peds.108.3.712
4. Locsey L, Asztalos L, Kincses Z, Berczi C, Paragh G. The Importance of Obesity and Hyperlipidaemia in Patients With Renal Transplants. Int Urol Nephrol (1998) 30(6):767–75. doi: 10.1007/BF02564866
5. Becker S, Dossus L, Kaaks R. Obesity Related Hyperinsulinaemia and Hyperglycaemia and Cancer Development. Arch Physiol Biochem (2009) 115(2):86–96. doi: 10.1080/13813450902878054
6. Rahmouni K, Correia ML, Haynes WG, Mark AL. Obesity-Associated Hypertension: New Insights Into Mechanisms. Hypertension (2005) 45(1):9–14. doi: 10.1161/01.HYP.0000151325.83008.b4
7. Lovren F, Teoh H, Verma S. Obesity and Atherosclerosis: Mechanistic Insights. Can J Cardiol (2015) 31(2):177–83. doi: 10.1016/j.cjca.2014.11.031
8. Steppan CM, Bailey ST, Bhat S, Brown EJ, Banerjee RR, Wright CM, et al. The Hormone Resistin Links Obesity to Diabetes. Nature (2001) 409(6818):307–12. doi: 10.1038/35053000
9. Calle EE, Kaaks R. Overweight, Obesity and Cancer: Epidemiological Evidence and Proposed Mechanisms. Nat Rev Cancer (2004) 4(8):579–91. doi: 10.1038/nrc1408
10. Jia JJ, Zhang X, Ge CR, Jois M. The Polymorphisms of UCP2 and UCP3 Genes Associated With Fat Metabolism, Obesity and Diabetes. Obes Rev (2009) 10(5):519–26. doi: 10.1111/j.1467-789X.2009.00569.x
11. Kern PA. Potential Role of TNFalpha and Lipoprotein Lipase as Candidate Genes for Obesity. J Nutr (1997) 127(9):1917S–22S. doi: 10.1093/jn/127.9.1917S
12. Suviolahti E, Oksanen LJ, Ohman M, Cantor RM, Ridderstrale M, Tuomi T, et al. The SLC6A14 Gene Shows Evidence of Association With Obesity. J Clin Invest. (2003) 112(11):1762–72. doi: 10.1172/JCI17491
13. Okada Y, Tateishi K, Zhang Y. Histone Demethylase JHDM2A is Involved in Male Infertility and Obesity. J Androl (2010) 31(1):75–8. doi: 10.2164/jandrol.109.008052
14. Carpenter D, Dhar S, Mitchell LM, Fu B, Tyson J, Shwan NA, et al. Obesity, Starch Digestion and Amylase: Association Between Copy Number Variants at Human Salivary (AMY1) and Pancreatic (AMY2) Amylase Genes. Hum Mol Genet (2015) 24(12):3472–80. doi: 10.1093/hmg/ddv098
15. Tanti JF, Ceppo F, Jager J, Berthou F. Implication of Inflammatory Signaling Pathways in Obesity-Induced Insulin Resistance. Front Endocrinol (Lausanne) (2013) 3:181. doi: 10.3389/fendo.2012.00181
16. Kim KA, Gu W, Lee IA, Joh EH, Kim DH. High Fat Diet-Induced Gut Microbiota Exacerbates Inflammation and Obesity in Mice Via the TLR4 Signaling Pathway. PloS One (2012) 7(10):e47713. doi: 10.1371/journal.pone.0047713
17. Briones AM, Nguyen Dinh Cat A, Callera GE, Yogi A, Burger D, He Y, et al. Adipocytes Produce Aldosterone Through Calcineurin-Dependent Signaling Pathways: Implications in Diabetes Mellitus-Associated Obesity and Vascular Dysfunction. Hypertension (2012) 59(5):1069–78. doi: 10.1161/HYPERTENSIONAHA.111.190223
18. Dann SG, Selvaraj A, Thomas G. Mtor Complex1-S6K1 Signaling: At the Crossroads of Obesity, Diabetes and Cancer. Trends Mol Med (2007) 13(6):252–9. doi: 10.1016/j.molmed.2007.04.002
19. Mattevi VS, Zembrzuski VM, Hutz MH. Association Analysis of Genes Involved in the Leptin-Signaling Pathway With Obesity in Brazil. Int J Obes Relat Metab Disord (2002) 26(9):1179–85. doi: 10.1038/sj.ijo.0802067
20. Li H, Li X, Guo J, Wu G, Dong C, Pang Y, et al. Identification of Biomarkers and Mechanisms of Diabetic Cardiomyopathy Using Microarray Data. Cardiol J (2018) 27(6):807–16. doi: 10.5603/CJ.a2018.0113
21. Wei L, Wang J, Lampert E, Schlanger S, DePriest AD, Hu Q, et al. Intratumoral and Intertumoral Genomic Heterogeneity of Multifocal Localized Prostate Cancer Impacts Molecular Classifications and Genomic Prognosticators. Eur Urol (2017) 71(2):183–92. doi: 10.1016/j.eururo.2016.07.008
22. Yan Y, Xu Z, Qian L, Zeng S, Zhou Y, Chen X, et al. Identification of CAV1 and DCN as Potential Predictive Biomarkers for Lung Adenocarcinoma. Am J Physiol Lung Cell Mol Physiol (2019) 316(4):L630–43. doi: 10.1152/ajplung.00364.2018
23. Fan G, Tu Y, Chen C, Sun H, Wan C, Cai X. DNA Methylation Biomarkers for Hepatocellular Carcinoma. Cancer Cell Int (2018) 18:140. doi: 10.1186/s12935-018-0629-5
24. Jia L, Jia R, Li Y, Li X, Jia Q, Zhang H. LCK as a Potential Therapeutic Target for Acute Rejection After Kidney Transplantation: A Bioinformatics Clue. J Immunol Res (2018) 2018:6451298. doi: 10.1155/2018/6451298
25. Bjune JI, Haugen C, Gudbrandsen O, Nordbø OP, Nielsen HJ, Våge V, et al. IRX5 Regulates Adipocyte Amyloid Precursor Protein and Mitochondrial Respiration in Obesity. Int J Obes (Lond) (2018) 43(11):2151–62. doi: 10.1038/s41366-018-0275-y
26. Dunning MJ, Smith ML, Ritchie ME, Tavaré S. Beadarray: R Classes and Methods for Illumina Bead-Based Data. Bioinformatics (2007) 23(16):2183–4. doi: 10.1093/bioinformatics/btm311
27. Ritchie ME, Phipson B, Wu D, Hu Y, Law CW, Shi W, et al. Limma Powers Differential Expression Analyses for RNA-Sequencing and Microarray Studies. Nucleic Acids Res (2015) 43(7):e47. doi: 10.1093/nar/gkv007
28. Abbas A, Kong XB, Liu Z, Jing BY, Gao X. Automatic Peak Selection by a Benjamini-Hochberg-based Algorithm. PloS One (2013) 8(1):e53112. doi: 10.1371/journal.pone.0053112
29. Kaimal V, Bardes EE, Tabar SC, Jegga AG, Aronow BJ. ToppCluster: A Multiple Gene List Feature Analyzer for Comparative Enrichment Clustering and Network-Based Dissection of Biological Systems. Nucleic Acids Res (2010) 38(Web Server issue):W96–W102. doi: 10.1093/nar/gkq418
30. Calderone A, Castagnoli L, Cesareni G. Mentha: A Resource for Browsing Integrated Protein-Interaction Networks. Nat Methods (2013) 10(8):690–1. doi: 10.1038/nmeth.2561
31. Shannon P, Markiel A, Ozier O, Baliga NS, Wang JT, Ramage D, et al. Cytoscape: A Software Environment for Integrated Models of Biomolecular Interaction Networks. Genome. Res (2003) 3(11):2498–504. doi: 10.1101/gr.1239303
32. Przulj N, Wigle DA, Jurisica I. Functional Topology in a Network of Protein Interactions. Bioinformatics (2004) 20(3):340–8. doi: 10.1093/bioinformatics/btg415
33. Nguyen TP, Liu WC, Jordán F. Inferring Pleiotropy by Network Analysis: Linked Diseases in the Human PPI Network. BMC Syst Biol (2011) 5:179. doi: 10.1186/1471-2105-12-149
34. Shi Z, Zhang B. Fast Network Centrality Analysis Using Gpus. BMC Bioinf (2011) 12:149. doi: 10.1186/1471-2105-12-149
35. Fadhal E, Gamieldien J, Mwambene EC. Protein Interaction Networks as Metric Spaces: A Novel Perspective on Distribution of Hubs. BMC Syst Biol (2014) 8:6. doi: 10.1186/1752-0509-8-6
36. Zaki N, Efimov D, Berengueres J. Protein Complex Detection Using Interaction Reliability Assessment and Weighted Clustering Coefficient. BMC. Bioinf (2013) 14:163. doi: 10.1186/1471-2105-14-163
37. Fan Y, Xia J. Mirnet-Functional Analysis and Visual Exploration of miRNA-Target Interactions in a Network Context. Methods Mol Biol (2018) 1819:215–33. doi: 10.1007/978-1-4939-8618-7_10
38. Zhou G, Soufan O, Ewald J, Hancock REW, Basu N, Xia J. NetworkAnalyst 3.0: A Visual Analytics Platform for Comprehensive Gene Expression Profiling and Meta-Analysis. Nucleic Acids Res (2019) 47(W1):W234–41. doi: 10.1093/nar/gkz240
39. Uhlen M, Oksvold P, Fagerberg L, Lundberg E, Jonasson K, Forsberg M, et al. Towards a Knowledge-Based Human Protein Atlas. Nat Biotechnol (2010) 28(12):1248–50. doi: 10.1038/nbt1210-1248
40. Robin X, Turck N, Hainard A, Tiberti N, Lisacek F, Sanchez JC, et al. pROC: An Open-Source Package for R and S+ to Analyze and Compare ROC Curves. BMC Bioinf (2011) 12:77. doi: 10.1186/1471-2105-12-77
41. Livak KJ, Schmittgen TD. Analysis of Relative Gene Expression Data Using Real-Time Quantitative PCR and the 2(-Delta Delta C(T)) Method. Methods (2001) 25(4):402–8. doi: 10.1006/meth.2001.1262
42. El-Saadi MW, Williams-Hart T, Salvatore BA, Mahdavian E. Use of in-Silico Assays to Characterize the ADMET Profile and Identify Potential Therapeutic Targets of Fusarochromanone, a Novel Anti-Cancer Agent. In Silico Pharmacol (2015) 3(1):6. doi: 10.1186/s40203-015-0010-5
43. Li J, Ma X, Liu C, Li H, Zhuang J, Gao C, et al. Exploring the Mechanism of Danshen Against Myelofibrosis by Network Pharmacology and Molecular Docking. Evid Based Complement Alternat Med (2018) 2018:8363295. doi: 10.1155/2018/8363295
44. Veeramachaneni GK, Raj KK, Chalasani LM, Annamraju SK, Js B, Talluri VR. Shape Based Virtual Screening and Molecular Docking Towards Designing Novel Pancreatic Lipase Inhibitors. Bioinformation (2015) 11(12):535–42. doi: 10.6026/97320630011535
45. Urbanet R, Nguyen Dinh Cat A, Feraco A, Venteclef N, El Mogrhabi S, Sierra-Ramos C, et al. Adipocyte Mineralocorticoid Receptor Activation Leads to Metabolic Syndrome and Induction of Prostaglandin D2 Synthase. Hypertension (2015) 66(1):149–57. doi: 10.1161/HYPERTENSIONAHA
46. Moreno-Navarrete JM, Ortega F, Serino M, Luche E, Waget A, Pardo G, et al. Circulating Lipopolysaccharide-Binding Protein (LBP) as a Marker of Obesity-Related Insulin Resistance. Int J Obes (Lond) (2012) 36(11):1442–9. doi: 10.1038/ijo.2011.256
47. Oberauer R, Rist W, Lenter MC, Hamilton BS, Neubauer H. EGFL6 is Increasingly Expressed in Human Obesity and Promotes Proliferation of Adipose Tissue-Derived Stromal Vascular Cells. Mol Cell Biochem (2010) 343(1-2):257–69. doi: 10.1007/s11010-010-0521-7
48. Ernst MB, Wunderlich CM, Hess S, Paehler M, Mesaros A, Koralov SB, et al. Enhanced Stat3 Activation in POMC Neurons Provokes Negative Feedback Inhibition of Leptin and Insulin Signaling in Obesity. J Neurosci (2009) 29(37):11582–93. doi: 10.1523/JNEUROSCI.5712-08.2009
49. Chatterjee TK, Basford JE, Knoll E, Tong WS, Blanco V, Blomkalns AL, et al. HDAC9 Knockout Mice are Protected From Adipose Tissue Dysfunction and Systemic Metabolic Disease During High-Fat Feeding. Diabetes (2014) 63(1):176–87. doi: 10.2337/db13-1148
50. Zhao L, Triche EW, Walsh KM, Bracken MB, Saftlas AF, Hoh J, et al. Genome-Wide Association Study Identifies a Maternal Copy-Number Deletion in PSG11 Enriched Among Preeclampsia Patients. BMC Pregnancy Childbirth (2012) 12:61. doi: 10.1186/1471-2393-12-61
51. Li W, Geng L, Liu X, Gui W, Qi H. Recombinant Adiponectin Alleviates Abortion in Mice by Regulating Th17/Treg Imbalance Via P38mapk-STAT5 Pathway. Biol Reprod (2019) 100(4):1008–17. doi: 10.1093/biolre/ioy251
52. Kolar GR, Grote SM, Yosten GL. Targeting Orphan G Protein-Coupled Receptors for the Treatment of Diabetes and Its Complications: C-Peptide and GPR146. J Intern Med (2017) 281(1):25–40. doi: 10.1111/joim.12528
53. Du P, Gao K, Cao Y, Yang S, Wang Y, Guo R, et al. RFX1 Downregulation Contributes to TLR4 Overexpression in CD14+ Monocytes Via Epigenetic Mechanisms in Coronary Artery Disease. Clin Epigenet (2019) 11(1):44. doi: 10.1186/s13148-019-0646-9
54. Erbilgin A, Seldin MM, Wu X, Mehrabian M, Zhou Z, Qi H, et al. Transcription Factor Zhx2 Deficiency Reduces Atherosclerosis and Promotes Macrophage Apoptosis in Mice. Arterioscler Thromb Vasc Biol (2018) 38(9):2016–27. doi: 10.1161/ATVBAHA.118.311266
55. Matsuoka H, Tamura A, Kinehara M, Shima A, Uda A, Tahara H, et al. Levels of Tight Junction Protein CLDND1 Are Regulated by microRNA-124 in the Cerebellum of Stroke-Prone Spontaneously Hypertensive Rats. Biochem Biophys Res Commun (2018) 498(4):817–23. doi: 10.1016/j.bbrc.2018.03.063
56. O’Halloran AM, Patterson CC, Horan P, Maree A, Curtin R, Stanton A, et al. Genetic Polymorphisms in Platelet-Related Proteins and Coronary Artery Disease: Investigation of Candidate Genes, Including N-acetylgalactosaminyltransferase 4 (GALNT4) and Sulphotransferase 1A1/2 (SULT1A1/2). J Thromb Thrombolysis (2009) 27(2):175–84. doi: 10.1007/s11239-008-0196-z
57. Davies GE, Howard CM, Farrer MJ, Coleman MM, Bennett LB, Cullen LM, et al. Genetic Variation in the COL6A1 Region is Associated With Congenital Heart Defects in Trisomy 21 (Down’s Syndrome). Ann Hum Genet (1995) 59(3):253–69. doi: 10.1111/j.1469-1809.1995.tb00746.x
58. Grossman TR, Gamliel A, Wessells RJ, Taghli-Lamallem O, Jepsen K, Ocorr K, et al. Over-Expression of DSCAM and COL6A2 Cooperatively Generates Congenital Heart Defects. PloS Genet (2011) 7(11):e1002344. doi: 10.1371/journal.pgen.1002344
59. Roberts AE, Araki T, Swanson KD, Montgomery KT, Schiripo TA, Joshi VA, et al. Germline Gain-of-Function Mutations in SOS1 Cause Noonan Syndrome. Nat Genet (2007) 39(1):70–4. doi: 10.1038/ng1926
60. Chmielewski S, Piaszyk-Borychowska A, Wesoly J, Bluyssen HA. STAT1 and IRF8 in Vascular Inflammation and Cardiovascular Disease: Diagnostic and Therapeutic Potential. Int Rev Immunol (2016) 35(5):434–54. doi: 10.3109/08830185.2015.1087519
61. Azuaje F, Zhang L, Jeanty C, Puhl SL, Rodius S, Wagner DR. Analysis of a Gene Co-Expression Network Establishes Robust Association Between Col5a2 and Ischemic Heart Disease. BMC Med Genomics (2013) 6:13. doi: 10.1186/1755-8794-6-13
62. Yue X, Yang X, Lin X, Yang T, Yi X, Dai Y, et al. Rnd3 Haploinsufficient Mice are Predisposed to Hemodynamic Stress and Develop Apoptotic Cardiomyopathy With Heart Failure. Cell Death Dis (2014) 5:e1284. doi: 10.1038/cddis.2014.235
63. Connelly JJ, Cherepanova OA, Doss JF, Karaoli T, Lillard TS, Markunas CA, et al Epigenetic Regulation of COL15A1 in Smooth Muscle Cell Replicative Aging and Atherosclerosis. Hum Mol Genet (2013) 22(25):5107–20. doi: 10.1093/hmg/ddt365
64. Karamat FA, Oudman I, Ris-Stalpers C, Afink GB, Keijser R, Clark JF, et al Resistance Artery Creatine Kinase mRNA and Blood Pressure in Humans. Hypertension (2014) 63(1):68–73. doi: 10.1161/HYPERTENSIONAHA.113.01352
65. Smith CE, Coltell O, Sorlí JV, Estruch R, Martínez-González MÁ, Salas-Salvadó J, et al. Associations of the MCM6-rs3754686 Proxy for Milk Intake in Mediterranean and American Populations With Cardiovascular Biomarkers, Disease and Mortality: Mendelian Randomization. Sci Rep (2016) 6:33188. doi: 10.1038/srep33188
66. Lyu M, Cui Y, Zhao T, Ning Z, Ren J, Jin X, et al. Tnfrsf12a-Mediated Atherosclerosis Signaling and Inflammatory Response as a Common Protection Mechanism of Shuxuening Injection Against Both Myocardial and Cerebral Ischemia-Reperfusion Injuries. Front Pharmacol (2018) 9:312. doi: 10.3389/fphar.2018.00312
67. Shami A, Tengryd C, Asciutto G, Bengtsson E, Nilsson J, Hultgårdh-Nilsson A, et al. Expression of Fibromodulin in Carotid Atherosclerotic Plaques is Associated With Diabetes and Cerebrovascular Events. Atherosclerosis (2015) 241(2):701–8. doi: 10.1016/j.atherosclerosis.2015.06.023
68. Li W, Yue H. Thymidine Phosphorylase: A Potential New Target for Treating Cardiovascular Disease. Trends Cardiovasc Med (2018) 28(3):157–71. doi: 10.1016/j.tcm.2017.10.003
69. Haarhaus M, Brandenburg V, Kalantar-Zadeh K, Stenvinkel P, Magnusson P. Alkaline Phosphatase: A Novel Treatment Target for Cardiovascular Disease in CKD. Nat Rev Nephrol (2017) 13(7):429–42. doi: 10.1038/nrneph.2017.60
70. Ellinghaus E, Ellinghaus D, Krusche P, Greiner A, Schreiber C, Nikolaus S, et al. Genome-Wide Association Analysis for Chronic Venous Disease Identifies EFEMP1 and KCNH8 as Susceptibility Loci. Sci Rep (2017) 7:45652. doi: 10.1038/srep45652
71. Wulf-Johansson H, Lock Johansson S, Schlosser A, Trommelholt Holm A, Rasmussen LM, Mickley H, et al. Localization of Microfibrillar-Associated Protein 4 (MFAP4) in Human Tissues: Clinical Evaluation of Serum MFAP4 and its Association With Various Cardiovascular Conditions. PloS One (2013) 8(12):e82243. doi: 10.1371/journal.pone.0082243
72. Song SE, Kim YW, Kim JY, Lee DH, Kim JR, Park SY. IGFBP5 Mediates High Glucose-Induced Cardiac Fibroblast Activation. J Mol Endocrinol (2013) 50(3):291–303. doi: 10.1530/JME-12-0194
73. Huggins GS, Berkowitz RI, Blackburn GL, Bray GA, Cheskin L, Clark JM, et al. Prospective Association of GLUL Rs10911021 With Cardiovascular Morbidity and Mortality Among Individuals With Type 2 Diabetes: The Look Ahead Study. Diabetes (2016) 65(1):297–302. doi: 10.2337/db15-0890
74. Konishi H, Okuda A, Ohno Y, Kihara A. Characterization of HACD1 K64Q Mutant Found in Arrhythmogenic Right Ventricular Dysplasia Patients. J Biochem (2010) 148(5):617–22. doi: 10.1093/jb/mvq092
75. He H, Wang J, Yannie PJ, Kakiyama G, Korzun WJ, Ghosh S. Sterol Carrier Protein-2 Deficiency Attenuates Diet-Induced Dyslipidemia and Atherosclerosis in Mice. J Biol Chem (2018) 293(24):9223–31. doi: 10.1074/jbc.RA118.002290
76. Tian DZ, Wei W, Dong YJ. Influence of COL1A2 Gene Variants on the Incidence of Hypertensive Intracerebral Hemorrhage in a Chinese Population. Genet Mol Res (2016) 15(1). doi: 10.4238/gmr.15017369
77. Samokhin AO, Stephens T, Wertheim BM, Wang RS, Vargas SO, Yung LM, et al. NEDD9 Targets COL3A1 to Promote Endothelial Fibrosis and Pulmonary Arterial Hypertension. Sci Transl Med (2018) 10(445). doi: 10.1126/scitranslmed.aap7294
78. Usui T, Okada M, Hara Y, Yamawaki H. Eukaryotic Elongation Factor 2 Kinase Regulates the Development of Hypertension Through Oxidative Stress-Dependent Vascular Inflammation. Am J Physiol Heart Circ Physiol (2013) 305(5):H756–68. doi: 10.1152/ajpheart.00373.2013
79. Andraweera PH, Dekker GA, Thompson SD, North RA, McCowan LM, Roberts CT. A Functional Variant in ANGPT1 and the Risk of Pregnancies With Hypertensive Disorders and Small-for-Gestational-Age Infants. Mol Hum Reprod (2012) 18(6):325–32. doi: 10.1093/molehr/gar081
80. Li X, Zhang X, Leathers R, Makino A, Huang C, Parsa P, et al. Notch3 Signaling Promotes the Development of Pulmonary Arterial Hypertension. Nat Med (2009) 15(11):1289–97. doi: 10.1038/nm.2021
81. Chen J, Zhao X, Wang H, Chen Y, Wang W, Zhou W, et al. Common Variants in TGFBR2 and miR-518 Genes Are Associated With Hypertension in the Chinese Population. Am J Hypertens (2014) 27(10):1268–76. doi: 10.1093/ajh/hpu047
82. Champelovier P, Besse A, Boucard N, Simon A, Leroux D, Pinel N, et al. Dag-1 Carcinoma Cell in Studying the Mechanisms of Progression and Therapeutic Resistance in Bladder Cancer. Eur Urol (2001) 39(3):343–8. doi: 10.1159/000052465
83. Flum M, Kleemann M, Schneider H, Weis B, Fischer S, Handrick R, et al. miR-217-5p Induces Apoptosis by Directly Targeting PRKCI, Bag3, ITGAV and MAPK1 in Colorectal Cancer Cells. J Cell Commun Signal (2018) 12(2):451–66. doi: 10.1007/s12079-017-0410-x
84. Bartolini A, Cardaci S, Lamba S, Oddo D, Marchiò C, Cassoni P, et al. BCAM and LAMA5 Mediate the Recognition Between Tumor Cells and the Endothelium in the Metastatic Spreading of KRAS-Mutant Colorectal Cancer. Clin Cancer Res (2016) 22(19):4923–33. doi: 10.1158/1078-0432.CCR-15-2664
85. Junnila S, Kokkola A, Mizuguchi T, Hirata K, Karjalainen-Lindsberg ML, Puolakkainen P, et al. Gene Expression Analysis Identifies Over-Expression of CXCL1, SPARC, SPP1, and SULF1 in Gastric Cancer. Genes Chromosomes Cancer (2010) 49(1):28–39. doi: 10.1002/gcc.20715
86. García-Pravia C, Galván JA, Gutiérrez-Corral N, Solar-García L, García-Pérez E, García-Ocaña M, et al. Overexpression of COL11A1 by Cancer-Associated Fibroblasts: Clinical Relevance of a Stromal Marker in Pancreatic Cancer. PloS One (2013) 8(10):e78327. doi: 10.1371/journal.pone.0078327
87. Duan S, Gong B, Wang P, Huang H, Luo L, Liu F. Novel Prognostic Biomarkers of Gastric Cancer Based on Gene Expression Microarray: COL12A1, GSTA3, FGA and FGG. Mol Med Rep (2018) 18(4):3727–36. doi: 10.3892/mmr.2018.9368
88. Kamikawaji K, Seki N, Watanabe M, Mataki H, Kumamoto T, Takagi K, et al. Regulation of LOXL2 and SERPINH1 by Antitumor microRNA-29a in Lung Cancer With Idiopathic Pulmonary Fibrosis. J Hum Genet (2016) 61(12):985–93. doi: 10.1038/jhg.2016.99
89. Liu BL, Sun KX, Zong ZH, Chen S, Zhao Y. MicroRNA-372 Inhibits Endometrial Carcinoma Development by Targeting the Expression of the Ras Homolog Gene Family Member C (Rhoc). Oncotarget (2016) 7(6):6649–64. doi: 10.18632/oncotarget.6544
90. Shriver SP, Shriver MD, Tirpak DL, Bloch LM, Hunt JD, Ferrell RE, et al. Trinucleotide Repeat Length Variation in the Human Ribosomal Protein L14 Gene (RPL14): Localization to 3p21.3 and Loss of Heterozygosity in Lung and Oral Cancers. Mutat Res (1998) 406(1):9–23. doi: 10.1016/S1383-5726(98)00006-5
91. Liu JJ, Huang BH, Zhang J, Carson DD, Hooi SC. Repression of HIP/RPL29 Expression Induces Differentiation in Colon Cancer Cells. J Cell Physio (2006) 207(2):287–92. doi: 10.1002/jcp.20589
92. Chen D, Zhang R, Shen W, Fu H, Liu S, Sun K, et al. RPS12-Specific shRNA Inhibits the Proliferation, Migration of BGC823 Gastric Cancer Cells With S100A4 as a Downstream Effector. Int J Oncol (2013) 42(5):1763–9. doi: 10.3892/ijo.2013.1872
93. Zhao X, Shen L, Feng Y, Yu H, Wu X, Chang J, et al. Decreased Expression of RPS15A Suppresses Proliferation of Lung Cancer Cells. Tumour Biol (2015) 36(9):6733–40. doi: 10.1007/s13277-015-3371-9
94. Wang M, Hu Y, Stearns ME. RPS2: A Novel Therapeutic Target in Prostate Cancer. J Exp Clin Cancer Res (2009) 28:6. doi: 10.1186/1756-9966-28-6
95. Dutton-Regester K, Gartner JJ, Emmanuel R, Qutob N, Davies MA, Gershenwald JE, et al. A Highly Recurrent RPS27 5’UTR Mutation in Melanoma. Oncotarget (2014) 5(10):2912–7. doi: 10.18632/oncotarget.2048
96. Youn H, Son B, Kim W, Jun SY, Lee JS, Lee JM, et al. Dissociation of MIF-rpS3 Complex and Sequential NF-κB Activation is Involved in IR-induced Metastatic Conversion of NSCLC. J Cell Biochem (2015) 116(11):2504–16. doi: 10.1002/jcb.25195
97. Zhu Y, Gu J, Li Y, Peng C, Shi M, Wang X, et al. MiR-17-5p Enhances Pancreatic Cancer Proliferation by Altering Cell Cycle Profiles Via Disruption of RBL2/E2F4-Repressing Complexes. Cancer Lett (2018) 412:59–68. doi: 10.1016/j.canlet.2017.09.044
98. Flores IL, Kawahara R, Miguel MC, Granato DC, Domingues RR, Macedo CC, et al. EEF1D Modulates Proliferation and Epithelial-Mesenchymal Transition in Oral Squamous Cell Carcinoma. Clin Sci (Lond) (2016) 130(10):785–99. doi: 10.1042/CS20150646
99. Svensson RU, Parker SJ, Eichner LJ, Kolar MJ, Wallace M, Brun SN, et al. Inhibition of Acetyl-CoA Carboxylase Suppresses Fatty Acid Synthesis and Tumor Growth of Non-Small-Cell Lung Cancer in Preclinical Models. Nat Med (2016) 22(10):1108–19. doi: 10.1038/nm.4181
100. Song B, Liu XS, Rice SJ, Kuang S, Elzey BD, Konieczny SF, et al. Plk1 Phosphorylation of Orc2 and Hbo1 Contributes to Gemcitabine Resistance in Pancreatic Cancer. Mol Cancer Ther (2013) 12(1):58–68. doi: 10.1158/1535-7163.MCT-12-0632
101. Mullarky E, Mattaini KR, Vander Heiden MG, Cantley LC, Locasale JW. PHGDH Amplification and Altered Glucose Metabolism in Human Melanoma. Pigment Cell Melanoma Res (2011) 24(6):1112–5. doi: 10.1111/j.1755-148X.2011.00919.x
102. Komlósi V, Hitre E, Pap E, Adleff V, Réti A, Székely E, et al. SHMT1 1420 and MTHFR 677 Variants Are Associated With Rectal But Not Colon Cancer. BMC Cancer (2010) 10:525. doi: 10.1186/1471-2407-10-525
103. Górka B, Skubis-Zegadło J, Mikula M, Bardadin K, Paliczka E, Czarnocka B. NrCAM, a Neuronal System Cell-Adhesion Molecule, Is Induced in Papillary Thyroid Carcinomas. Br J Cancer (2007) 97(4):531–8. doi: 10.1038/sj.bjc.6603915
104. Yasuoka H, Kodama R, Tsujimoto M, Yoshidome K, Akamatsu H, Nakahara M, et al. Neuropilin-2 Expression in Breast Cancer: Correlation With Lymph Node Metastasis, Poor Prognosis, and Regulation of CXCR4 Expression. BMC Cancer (2009) 9:220. doi: 10.1186/1471-2407-9-220
105. Gong X, Yi J, Carmon KS, Crumbley CA, Xiong W, Thomas A, et al. Aberrant RSPO3-LGR4 Signaling in Keap1-deficient Lung Adenocarcinomas Promotes Tumor Aggressiveness. Oncogene (2015) 34(36):4692–701. doi: 10.1038/onc.2014.417
106. Tanaka K, Arao T, Maegawa M, Matsumoto K, Kaneda H, Kudo K, et al. SRPX2 is Overexpressed in Gastric Cancer and Promotes Cellular Migration and Adhesion. Int J Cancer (2009) 124(5):1072–80. doi: 10.1002/ijc.24065
107. Abeysinghe HR, Cao Q, Xu J, Pollock S, Veyberman Y, Guckert NL, et al. THY1 Expression is Associated With Tumor Suppression of Human Ovarian Cancer. Cancer Genet Cytogenet (2003) 143(2):125–32. doi: 10.1016/S0165-4608(02)00855-5
108. Aquea G, Bresky G, Lancellotti D, Madariaga JA, Zaffiri V, Urzua U, et al. Increased Expression of P2RY2, CD248 and EphB1 in Gastric Cancers From Chilean Patients. Asian Pac J Cancer Prev (2014) 15(5):1931–6. doi: 10.7314/APJCP.2014.15.5.1931
109. Liu J, Liu Z, Liu Q, Li L, Fan X, Wen T, et al. CLEC3B is Downregulated and Inhibits Proliferation in Clear Cell Renal Cell Carcinoma. Oncol Rep (2018) 40(4):2023–35. doi: 10.3892/or.2018.6590
110. Yan Y, Fan Q, Wang L, Zhou Y, Li J, Zhou K. LncRNA Snhg1, a Non-Degradable Sponge for miR-338, Promotes Expression of Proto-Oncogene CST3 in Primary Esophageal Cancer Cells. Oncotarget (2017) 8(22):35750–60. doi: 10.18632/oncotarget.16189
111. Kim HC, Kim YS, Oh HW, Kim K, Oh SS, Kim JT, et al. Collagen Triple Helix Repeat Containing 1 (CTHRC1) Acts Via ERK-Dependent Induction of MMP9 to Promote Invasion of Colorectal Cancer Cells. Oncotarget (2014) 5(2):519–29. doi: 10.18632/oncotarget.1714
112. Duan L, Hu XQ, Feng DY, Lei SY, Hu GH. GPC-1 May Serve as a Predictor of Perineural Invasion and a Prognosticator of Survival in Pancreatic Cancer. Asian J Surg (2013) 36(1):7–12. doi: 10.1016/j.asjsur.2012.08.001
113. Hur H, Kim YB, Ham IH, Lee D. Loss of ACSS2 Expression Predicts Poor Prognosis in Patients With Gastric Cancer. J Surg Oncol (2015) 112(6):585–91. doi: 10.1002/jso.24043
114. Szajnik M, Szczepanski MJ, Elishaev E, Visus C, Lenzner D, Zabel M, et al. 17β Hydroxysteroid Dehydrogenase Type 12 (HSD17B12) is a Marker of Poor Prognosis in Ovarian Carcinoma. Gynecol Oncol (2012) 127(3):587–94. doi: 10.1016/j.ygyno.2012.08.010
115. Jiao H, Kulyté A, Näslund E, Thorell A, Gerdhem P, Kere J, et al. Whole-Exome Sequencing Suggests LAMB3 as a Susceptibility Gene for Morbid Obesity. Diabetes (2016) 65(10):2980–9. doi: 10.2337/db16-0522
116. Matsuo Y, Tanaka M, Yamakage H, Sasaki Y, Muranaka K, Hata H, et al. Thrombospondin 1 as a Novel Biological Marker of Obesity and Metabolic Syndrome. Metabolism (2015) 64(11):1490–9. doi: 10.1016/j.metabol.2015.07.016
117. Meissburger B, Stachorski L, Röder E, Rudofsky G, Wolfrum C. Tissue Inhibitor of Matrix Metalloproteinase 1 (TIMP1) Controls Adipogenesis in Obesity in Mice and in Humans. Diabetologia (2011) 54(6):1468–79. doi: 10.1007/s00125-011-2093-9
118. Chen JY, Tsai PJ, Tai HC, Tsai RL, Chang YT, Wang MC, et al. Increased Aortic Stiffness and Attenuated Lysyl Oxidase Activity in Obesity. Arterioscler Thromb Vasc Biol (2013) 33(4):839–46. doi: 10.1161/ATVBAHA.112.300036
119. Derosa G, Ferrari I, D’Angelo A, Tinelli C, Salvadeo SA, Ciccarelli L, et al. Matrix Metalloproteinase-2 and -9 Levels in Obese Patients. Endothelium (2008) 15(4):219–24. doi: 10.1080/10623320802228815
120. Nascimento FV, Piccoli V, Beer MA, Frankenberg AD, Crispim D, Gerchman F. Association of HSD11B1 Polymorphic Variants and Adipose Tissue Gene Expression With Metabolic Syndrome, Obesity and Type 2 Diabetes Mellitus: A Systematic Review. Diabetol Metab Syndr (2015) 7:38. doi: 10.1186/s13098-015-0036-1
121. Awaya T, Yokosaki Y, Yamane K, Usui H, Kohno N, Eboshida A. Gene-Environment Association of an ITGB2 Sequence Variant With Obesity in Ethnic Japanese. Obes (Silver Spring) (2008) 16(6):1463–6. doi: 10.1038/oby.2008.68
122. Moreno-Navarrete JM, Ortega F, Rodríguez A, Latorre J, Becerril S, Sabater-Masdeu M, et al. HMOX1 as a Marker of Iron Excess-Induced Adipose Tissue Dysfunction, Affecting Glucose Uptake and Respiratory Capacity in Human Adipocytes. Diabetologia (2017) 60(5):915–26. doi: 10.1007/s00125-017-4228-0
123. Aguer C, Pasqua M, Thrush AB, Moffat C, McBurney M, Jardine K, et al. Increased Proton Leak and SOD2 Expression in Myotubes From Obese Non-Diabetic Subjects With a Family History of Type 2 Diabetes. Biochim Biophys Acta (2013) 1832(10):1624–33. doi: 10.1016/j.bbadis.2013.05.008
124. Svensson PA, Gabrielsson BG, Jernås M, Gummesson A, Sjöholm K. Regulation of Human Aldoketoreductase 1C3 (AKR1C3) Gene Expression in the Adipose Tissue. Cell Mol Biol Lett (2008) 13(4):599–613. doi: 10.2478/s11658-008-0025-6
125. Zhao C, Chen X, Wu W, Wang W, Pang W, Yang G. MAT2B Promotes Adipogenesis by Modulating SAMe Levels and Activating AKT/ERK Pathway During Porcine Intramuscular Preadipocyte Differentiation. Exp Cell Res (2016) 344(1):11–21. doi: 10.1016/j.yexcr.2016.02.019
126. Farmer SR. The Forkhead Transcription Factor Foxo1: A Possible Link Between Obesity and Insulin Resistance. Mol Cell (2003) 11(1):6–8. doi: 10.1016/S1097-2765(03)00003-0
127. Boal F, Roumegoux J, Alfarano C, Timotin A, Calise D, Anesia R, et al. Apelin Regulates FoxO3 Translocation to Mediate Cardioprotective Responses to Myocardial Injury and Obesity. Sci Rep (2015) 5:16104. doi: 10.1038/srep16104
128. Zillikens MC, Meurs JB, Rivadeneira F, Amin N, Hofman A, Oostra BA, et al. SIRT1 Genetic Variation is Related to BMI and Risk of Obesity. Diabetes (2009) 58(12):2828–34. doi: 10.2337/db09-0536
129. Riancho JA, Vázquez L, García-Pérez MA, Sainz J, Olmos JM, Hernández JL, et al. Association of ACACB Polymorphisms With Obesity and Diabetes. Mol Genet Metab (2011) 104(4):670–6. doi: 10.1016/j.ymgme.2011.08.013
130. Pang L, You L, Ji C, Shi C, Chen L, Yang L, et al. miR-1275 Inhibits Adipogenesis Via ELK1 and Its Expression Decreases in Obese Subjects. J Mol Endocrinol (2016) 57(1):33–43. doi: 10.1530/JME-16-0007
131. Haim Y, Blüher M, Konrad D, Goldstein N, Klöting N, Harman-Boehm I, et al. ASK1 (MAP3K5) is Transcriptionally Upregulated by E2F1 in Adipose Tissue in Obesity, Molecularly Defining a Human Dys-Metabolic Obese Phenotype. Mol Metab (2017) 6(7):725–36. doi: 10.1016/j.molmet.2017.05.003
132. Cai J, Shi X, Wang H, Fan J, Feng Y, Lin X, et al. Cystathionine γ Lyase-Hydrogen Sulfide Increases Peroxisome Proliferator-Activated Receptor γ Activity by Sulfhydration at C139 Site Thereby Promoting Glucose Uptake and Lipid Storage in Adipocytes. Biochim Biophys Acta (2016) 1861(5):419–29. doi: 10.1016/j.bbalip.2016.03.001
133. Roudier E, Chapados N, Decary S, Gineste C, Le Bel C, Lavoie JM, et al. Angiomotin p80/p130 Ratio: A New Indicator of Exercise-Induced Angiogenic Activity in Skeletal Muscles From Obese and Non-Obese Rats? J Physiol (2009) 587(Pt 16):4105–19. doi: 10.1113/jphysiol.2009.175554
134. Grill JI, Neumann J, Herbst A, Ofner A, Hiltwein F, Marschall MK, et al. Loss of DRO1/CCDC80 Results in Obesity and Promotes Adipocyte Differentiation. Mol Cell Endocrinol (2017) 439:286–96. doi: 10.1016/j.mce.2016.09.014
135. Herder C, Hauner H, Kempf K, Kolb H, Skurk T. Constitutive and Regulated Expression and Secretion of Interferon-Gamma-Inducible Protein 10 (IP-10/CXCL10) in Human Adipocytes. Int J Obes (Lond) (2007) 31(3):403–10. doi: 10.1038/sj.ijo.0803432
136. Mousa U, Onur H, Utkan G. Is Obesity Always a Risk Factor for All Breast Cancer Patients? c-erbB2 Expression is Significantly Lower in Obese Patients With Early Stage Breast Cancer. Clin Transl Oncol (2012) 14(12):923–30. doi: 10.1007/s12094-012-0878-z
137. Wang C, Ha X, Li W, Xu P, Gu Y, Wang T, et al. Correlation of A2bAR and KLF4/KLF15 With Obesity-Dyslipidemia Induced Inflammation in Uygur Population. Mediators Inflammation (2016) 2016:7015620. doi: 10.1155/2016/7015620
138. Mammès O, Betoulle D, Aubert R, Giraud V, Tuzet S, Petiet A, et al. Novel Polymorphisms in the 5’ Region of the LEP Gene: Association With Leptin Levels and Response to Low-Calorie Diet in Human Obesity. Diabetes (1998) 47(3):487–9. doi: 10.2337/diabetes.47.3.487
139. Khalifeh-Soltani A, McKleroy W, Sakuma S, Cheung YY, Tharp K, Qiu Y, et al. Mfge8 Promotes Obesity by Mediating the Uptake of Dietary Fats and Serum Fatty Acids. Nat Med (2014) 20(2):175–83. doi: 10.1038/nm.3450
140. Lim R, Lappas M. Slit2 Exerts Anti-Inflammatory Actions in Human Placenta and is Decreased With Maternal Obesity. Am J Reprod Immunol (2015) 73(1):66–78. doi: 10.1111/aji.12334
141. Saiki A, Olsson M, Jernås M, Gummesson A, McTernan PG, Andersson J, et al. Tenomodulin is Highly Expressed in Adipose Tissue, Increased in Obesity, and Down-Regulated During Diet-Induced Weight Loss. J Clin Endocrinol Metab (2009) 94(10):3987–94. doi: 10.1210/jc.2009-0292
142. Bauters D, Spincemaille P, Geys L, Cassiman D, Vermeersch P, Bedossa P, et al. ADAMTS5 Deficiency Protects Against Non-Alcoholic Steatohepatitis in Obesity. Liver Int (2016) 36(12):1848–59. doi: 10.1111/liv.13181
143. Martinez-Santibanez G, Singer K, Cho KW, DelProposto JL, Mergian T, Lumeng CN. Obesity-Induced Remodeling of the Adipose Tissue Elastin Network is Independent of the Metalloelastase MMP-12. Adipocyte (2015) 4(4):264–72. doi: 10.1080/21623945.2015.1027848
144. Tiaden AN, Bahrenberg G, Mirsaidi A, Glanz S, Blüher M, Richards PJ. Novel Function of Serine Protease HTRA1 in Inhibiting Adipogenic Differentiation of Human Mesenchymal Stem Cells Via MAP Kinase-Mediated MMP Upregulation. Stem Cells (2016) 34(6):1601–14. doi: 10.1002/stem.2297
145. Wolff G, Taranko AE, Meln I, Weinmann J, Sijmonsma T, Lerch S, et al. Diet-Dependent Function of the Extracellular Matrix Proteoglycan Lumican in Obesity and Glucose Homeostasis. Mol Meta (2019) 19:97–106. doi: 10.1016/j.molmet.2018.10.007
146. Vaittinen M, Kolehmainen M, Rydén M, Eskelinen M, Wabitsch M, Pihlajamäki J, et al. MFAP5 is Related to Obesity-Associated Adipose Tissue and Extracellular Matrix Remodeling and Inflammation. Obes (Silver Spring) (2015) 23(7):1371–8. doi: 10.1002/oby.21103
147. Somm E, Cettour-Rose P, Asensio C, Charollais A, Klein M, Theander-Carrillo C, et al. Interleukin-1 Receptor Antagonist is Upregulated During Diet-Induced Obesity and Regulates Insulin Sensitivity in Rodents. Diabetologia (2006) 49(2):387–93. doi: 10.1007/s00125-005-0046-x
148. Zhang D, Christianson J, Liu ZX, Tian L, Choi CS, Neschen S, et al. Resistance to High-Fat Diet-Induced Obesity and Insulin Resistance in Mice With Very Long-Chain acyl-CoA Dehydrogenase Deficiency. Cell Metab (2010) 11(5):402–11. doi: 10.1016/j.cmet.2010.03.012
149. Giacchetti G, Faloia E, Sardu C, Camilloni MA, Mariniello B, Gatti C, et al. Gene Expression of Angiotensinogen in Adipose Tissue of Obese Patients. Int J Obes Relat Metab Disord (2000) 24 Suppl 2:S142–3. doi: 10.1038/sj.ijo.0801305
150. Dumont J, Goumidi L, Grenier-Boley B, Cottel D, Marécaux N, Montaye M, et al. Dietary Linoleic Acid Interacts With FADS1 Genetic Variability to Modulate HDL-cholesterol and Obesity-Related Traits. Clin Nutr (2018) 37(5):1683–9. doi: 10.1016/j.clnu.2017.07.012
151. Wan Z, Frier BC, Williams DB, Wright DC. Epinephrine Induces PDK4 mRNA Expression in Adipose Tissue From Obese, Insulin Resistant Rats. Obes (Silver Spring) (2012) 20(2):453–6. doi: 10.1038/oby.2011.252
152. Milagro FI, Gómez-Abellán P, Campión J, Martínez JA, Ordovás JM, Garaulet M. Clock, PER2 and BMAL1 DNA Methylation: Association With Obesity and Metabolic Syndrome Characteristics and Monounsaturated Fat Intake. Chronobiol Int (2012) 29(9):1180–94. doi: 10.3109/07420528.2012.719967
153. Caimari A, Oliver P, Rodenburg W, Keijer J, Palou A. Slc27a2 Expression in Peripheral Blood Mononuclear Cells as a Molecular Marker for Overweight Development. Int J Obes (Lond) (2010) 34(5):831–9. doi: 10.1038/ijo.2010.17
154. Uchida T, Nakamura T, Hashimoto N, Matsuda T, Kotani K, Sakaue H, et al. Deletion of Cdkn1b Ameliorates Hyperglycemia by Maintaining Compensatory Hyperinsulinemia in Diabetic Mice. Nat Med (2005) 11(2):175–82. doi: 10.1038/nm1187
155. Kim D, Kim J, Yoon JH, Ghim J, Yea K, Song P, et al. CXCL12 Secreted From Adipose Tissue Recruits Macrophages and Induces Insulin Resistance in Mice. Diabetologia (2014) 57(7):1456–65. doi: 10.1007/s00125-014-3237-5
156. Lu S, Purohit S, Sharma A, Zhi W, He M, Wang Y, et al. Serum Insulin-Like Growth Factor Binding Protein 6 (IGFBP6) is Increased in Patients With Type 1 Diabetes and Its Complications. Int J Clin Exp Med (2012) 5(3):229–37.
157. Matsuzaka T, Shimano H, Yahagi N, Kato T, Atsumi A, Yamamoto T, et al. Crucial Role of a Long-Chain Fatty Acid Elongase, Elovl6, in Obesity-Induced Insulin Resistance. Nat Med (2007) 13(10):1193–202. doi: 10.1038/nm1662
158. Oguri M, Kato K, Yokoi K, Watanabe S, Metoki N, Yoshida H, et al. Association of Polymorphisms of THBS2 and HSPA8 With Hypertension in Japanese Individuals With Chronic Kidney Disease. Mol Med Rep (2009) 2(2):205–11. doi: 10.3892/mmr_00000085
159. Karamat FA, Oudman I, Ris-Stalpers C, Afink GB, Keijser R, Clark JF, et al. Resistance Artery Creatine Kinase mRNA and Blood Pressure in Humans. Hypertension (2014) 63(1):68–73. doi: 10.1161/HYPERTENSIONAHA.113.01352
160. Xiang R, Fan LL, Huang H, Chen YQ, He W, Guo S, et al. Increased Reticulon 3 (Rtn3) Leads to Obesity and Hypertriglyceridemia by Interacting With Heat Shock Protein Family A (Hsp70) Member 5 (HSPA5). Circulation (2018) 138(17):1828–38. doi: 10.1161/CIRCULATIONAHA.117.030718
161. Capobianco V, Nardelli C, Ferrigno M, Iaffaldano L, Pilone V, Forestieri P, et al. miRNA and Protein Expression Profiles of Visceral Adipose Tissue Reveal miR-141/YWHAG and miR-520e/RAB11A as Two Potential miRNA/protein Target Pairs Associated With Severe Obesity. J Proteome Res (2012) 11(6):3358–69. doi: 10.1021/pr300152z
162. Liou TH, Chen HH, Wang W, Wu SF, Lee YC, Yang WS, et al ESR1, FTO, and UCP2 Genes Interact With Bariatric Surgery Affecting Weight Loss and Glycemic Control in Severely Obese Patients. Obes Surg (2011) 21(11):1758–65. doi: 10.1007/s11695-011-0457-3
163. Pal A, Barber TM, Bunt M, Rudge SA, Zhang Q, Lachlan KL, et al. PTEN Mutations as a Cause of Constitutive Insulin Sensitivity and Obesity. N Engl J Med (2012) 367(11):1002–11. doi: 10.1056/NEJMoa1113966
164. Ahmad R, Shihab PK, Thomas R, Alghanim M, Hasan A, Sindhu S, et al. Increased Expression of the Interleukin-1 Receptor-Associated Kinase (IRAK)-1 is Associated With Adipose Tissue Inflammatory State in Obesity. Diabetol Metab Syndr (2015) 7:71. doi: 10.1186/s13098-015-0067-7
165. Bouchard L, Tchernof A, Deshaies Y, Lebel S, Hould FS, Marceau P, et al. CYR61 Polymorphisms Are Associated With Plasma HDL-cholesterol Levels in Obese Individuals. Clin Genet (2007) 72(3):224–9. doi: 10.1111/j.1399-0004.2007.00855.x
166. Bendlová B, Vaňková M, Hill M, Vacínová G, Lukášová P, VejraŽková D, et al. ZBTB16 Gene Variability Influences Obesity-Related Parameters and Serum Lipid Levels in Czech Adults. Physiol Res 66(Supplementum (2017) 3):S425–31. doi: 10.33549/physiolres.933731
167. Hinrichsen I, Ernst BP, Nuber F, Passmann S, Schäfer D, Steinke V, et al. Reduced Migration of MLH1 Deficient Colon Cancer Cells Depends on SPTAN1. Mol Cancer (2014) 13:11. doi: 10.1186/1476-4598-13-11
168. Whiteland H, Spencer-Harty S, Morgan C, Kynaston H, Thomas DH, Bose P, et al. A Role for STEAP2 in Prostate Cancer Progression. Clin Exp Metastasis (2014) 31(8):909–20. doi: 10.1007/s10585-014-9679-9
169. Cao X, Xia Y, Yang J, Jiang J, Chen L, Ni R, et al. Clinical and Biological Significance of Never in Mitosis Gene A-Related Kinase 6 (NEK6) Expression in Hepatic Cell Cancer. Pathol Oncol Res (2012) 18(2):201–7. doi: 10.1007/s12253-011-9429-0
170. Zecchini V, Madhu B, Russell R, Pértega-Gomes N, Warren A, Gaude E, et al. Nuclear ARRB1 Induces Pseudohypoxia and Cellular Metabolism Reprogramming in Prostate Cancer. EMBO J (2014) Jun 1733(12):1365–82. doi: 10.15252/embj.201386874
171. Xue J, Chi Y, Chen Y, Huang S, Ye X, Niu J, et al. MiRNA-621 Sensitizes Breast Cancer to Chemotherapy by Suppressing FBXO11 and Enhancing p53 Activity. Oncogene (2016) 35(4):448–58. doi: 10.1038/onc.2015.96
172. Mao J, Liang Z, Zhang B, Yang H, Li X, Fu H, et al. Ubr2 Enriched in P53 Deficient Mouse Bone Marrow Mesenchymal Stem Cell-Exosome Promoted Gastric Cancer Progression Via Wnt/β-Catenin Pathway. Stem Cells (2017) 35(11):2267–79. doi: 10.1002/stem.2702
173. Peng H, Ishida M, Li L, Saito A, Kamiya A, Hamilton JP, et al. Pseudogene INTS6P1 Regulates Its Cognate Gene INTS6 Through Competitive Binding of miR-17-5p in Hepatocellular Carcinoma. Oncotarget (2015) 6(8):5666–77. doi: 10.18632/oncotarget.3290
174. Liou TH, Chen HH, Wang W, Wu SF, Lee YC, Yang WS, et al. Esr1, FTO, and UCP2 Genes Interact With Bariatric Surgery Affecting Weight Loss and Glycemic Control in Severely Obese Patients. Obes Surg (2011) 21(11):1758–65. doi: 10.1007/s11695-011-0457-3
175. Ma S, Guan XY, Beh PS, Wong KY, Chan YP, Yuen HF, et al. The Significance of LMO2 Expression in the Progression of Prostate Cancer. J Pathol (2007) 211(3):278–85. doi: 10.1002/path.2109
176. Wang CC, Liau JY, Lu YS, Chen JW, Yao YT, Lien HC. Differential Expression of Moesin in Breast Cancers and Its Implication in Epithelial-Mesenchymal Transition. Histopathology (2012) 61(1):78–87. doi: 10.1111/j.1365-2559.2012.04204.x
177. Yoshino H, Chiyomaru T, Enokida H, Kawakami K, Tatarano S, Nishiyama K, et al. The Tumour-Suppressive Function of miR-1 and miR-133a Targeting TAGLN2 in Bladder Cancer. Br J Cancer (2011) 104(5):808–18. doi: 10.1038/bjc.2011.23
178. Gautrey H, Jackson C, Dittrich AL, Browell D, Lennard T, Tyson-Capper A. SRSF3 and Hnrnp H1 Regulate a Splicing Hotspot of HER2 in Breast Cancer Cells. RNA Biol (2015) 12(10):1139–51. doi: 10.1080/15476286.2015.1076610
179. Hammerich-Hille S, Bardout VJ, Hilsenbeck SG, Osborne CK, Oesterreich S. Low SAFB Levels Are Associated With Worse Outcome in Breast Cancer Patients. Breast Cancer Res Treat (2010) 121(2):503–9. doi: 10.1007/s10549-008-0297-6
180. Ellison-Zelski SJ, Alarid ET. Maximum Growth and Survival of Estrogen Receptor-Alpha Positive Breast Cancer Cells Requires the Sin3A Transcriptional Repressor. Mol Cancer (2010) 9:263. doi: 10.1186/1476-4598-9-263
181. Tsai WW, Wang Z, Yiu TT, Akdemir KC, Xia W, Winter S, et al. TRIM24 Links a non-Canonical Histone Signature to Breast Cancer. Nature (2010) 468(7326):927–32. doi: 10.1038/nature09542
182. Han Y, Ru GQ, Mou X, Wang HJ, Ma Y, He XL, et al. AUTS2 is a Potential Therapeutic Target for Pancreatic Cancer Patients With Liver Metastases. Med Hypotheses (2015) 85(2):203–6. doi: 10.1016/j.mehy.2015.04.029
183. Saxena R, Bjonnes A, Prescott J, Dib P, Natt P, Lane J, et al. Genome-Wide Association Study Identifies Variants in Casein Kinase II (CSNK2A2) to be Associated With Leukocyte Telomere Length in a Punjabi Sikh Diabetic Cohort. Circ Cardiovasc Genet (2014) 7(3):287–95. doi: 10.1161/CIRCGENETICS.113.000412
184. Thun GA, Imboden M, Berger W, Rochat T, Probst-Hensch NM. The Association of a Variant in the Cell Cycle Control Gene CCND1 and Obesity on the Development of Asthma in the Swiss SAPALDIA Study. J Asthma. (2013) 50(2):147–54. doi: 10.3109/02770903.2012.757776
185. Chiellini C, Bertacca A, Novelli SE, Görgün CZ, Ciccarone A, Giordano A, et al. Obesity Modulates the Expression of Haptoglobin in the White Adipose Tissue Via TNFalpha. J Cell Physiol (2002) 190(2):251–8. doi: 10.1002/jcp.10061
186. Yaghootkar H, Stancáková A, Freathy RM, Vangipurapu J, Weedon MN, Xie W, et al. Association Analysis of 29,956 Individuals Confirms That a Low-Frequency Variant at CCND2 Halves the Risk of Type 2 Diabetes by Enhancing Insulin Secretion. Diabetes (2015) 64(6):2279–85. doi: 10.2337/db14-1456
187. Chutkow WA, Birkenfeld AL, Brown JD, Lee HY, Frederick DW, Yoshioka J, et al. Deletion of the Alpha-Arrestin Protein Txnip in Mice Promotes Adiposity and Adipogenesis While Preserving Insulin Sensitivity. Diabetes (2010) 59(6):1424–34. doi: 10.2337/db09-1212
188. Kim S, Hong JW, Park KW. B Cell Translocation Gene 2 (Btg2) is Regulated by Stat3 Signaling and Inhibits Adipocyte Differentiation. Mol Cell Biochem (2016) 413(1-2):145–53. doi: 10.1007/s11010-015-2648-z
189. Lee MF, Pan MH, Chiou YS, Cheng AC, Huang H. Resveratrol Modulates MED28 (Magicin/Eg-1) Expression and Inhibits Epidermal Growth Factor (EGF)-Induced Migration in MDA-MB-231 Human Breast Cancer Cells. J Agric Food Chem (2011) 59(21):11853–61. doi: 10.1021/jf202426k
Keywords: adiposities, obesity, differentially expressed genes, modules, protein–protein interaction network
Citation: Joshi H, Vastrad B, Joshi N, Vastrad C, Tengli A and Kotturshetti I (2021) Identification of Key Pathways and Genes in Obesity Using Bioinformatics Analysis and Molecular Docking Studies. Front. Endocrinol. 12:628907. doi: 10.3389/fendo.2021.628907
Received: 13 November 2020; Accepted: 19 May 2021;
Published: 24 June 2021.
Edited by:
Stephen Atkin, Royal College of Surgeons in Ireland, BahrainCopyright © 2021 Joshi, Vastrad, Joshi, Vastrad, Tengli and Kotturshetti. This is an open-access article distributed under the terms of the Creative Commons Attribution License (CC BY). The use, distribution or reproduction in other forums is permitted, provided the original author(s) and the copyright owner(s) are credited and that the original publication in this journal is cited, in accordance with accepted academic practice. No use, distribution or reproduction is permitted which does not comply with these terms.
*Correspondence: Chanabasayya Vastrad, Y2hhbm51LnZhc3RyYWRAZ21haWwuY29t
†ORCID: Harish Joshi, orcid.org/0000-0002-3817-5194
Basavaraj Vastrad, orcid.org/0000-0003-2202-7637
Nidhi Joshi, orcid.org/0000-0001-8067-3448
Chanabasayya Vastrad, orcid.org/0000-0003-3615-4450
Anandkumar Tengli, orcid.org/0000-0001-8076-928X
Iranna Kotturshetti, orcid.org/0000-0003-1988-7345
 Harish Joshi1†
 Basavaraj Vastrad
 Chanabasayya Vastrad
 Anandkumar Tengli