- 1Department of Orthopedics, The Second People’s Hospital of Hefei, Hefei, China
- 2Department of Endocrinology, The First Affiliated Hospital of Anhui Medical University, Hefei, China
Background: Osteoporosis is a metabolic bone disease characterized by decreased bone mineral density and abnormal bone quality. Monocytes can secret cytokines for bone resorption, resulting in bone mass loss. However, the mechanism by which monocytes subpopulations lead to osteoporosis remains unclear. The aim of this study was to identify genes associated with osteoporosis in monocytes subsets.
Methods: Three microarray datasets including GSE7158 (transcription of low/high-peak bone mass), GSE101489 (transcription of CD16+/CD16− monocyte) and GSE93883 (miRNA expression profile of primary osteoporosis) were derived from the Gene Expression Omnibus (GEO) database and analyzed with GEO2R tool to identify differentially expressed genes (DEGs). Functional enrichment was analyzed using Metascape database and GSEA software. STRING was utilized for the Protein–Protein Interaction Network construct. The hub genes were screened out using the Cytoscape software. Related miRNAs were predicted in miRWalk, miRDB, and TargetScan databases.
Results: Total 368 DEGs from GSE7158 were screened out, which were mostly enriched in signaling, positive regulation of biological process and immune system process. The hub genes were clustered into two modules by PPI network analysis. We identified 15 overlapping DGEs between GSE101489 and GSE7158 microarray datasets. Moreover, all of them were up-regulated genes in both datasets. Then, nine key genes were screened out from above 15 overlapping DEGs using Cytoscape software. It is a remarkable fact that the nine genes were all in one hub gene module of GSE7158. Additionally, 183 target miRNAs were predicted according to the above nine DEGs. After cross-verification with miRNA express profile dataset for osteoporosis (GSE93883), 12 DEmiRNAs were selected. Finally, a miRNA-mRNA network was constructed with the nine key genes and 12 miRNAs, which were involved in osteoporosis.
Conclusion: Our analysis results constructed a gene expression framework in monocyte subsets for osteoporosis. This approach could provide a novel insight into osteoporosis.
Introduction
Osteoporosis is a metabolic bone disease that causes bone mass loss and fragility fracture (1). It is known that postmenopausal women and elderly people are at higher risk for osteopenia and osteoporosis. Osteoporotic fractures, leading to serious physical, emotional, and financial consequences, are becoming an ever-growing public health problem (2).
Developed from the monocyte–macrophage hematopoietic lineage cell, osteoclasts adhere to the bone and secrete acid to dissolve the bone mineral. Then, they will undergo apoptosis after resorption (3, 4). Attenuated monocyte apoptosis has been demonstrated to be critical in osteoporosis (5). A higher percentage of monocytes may be a potential predictor of rheumatic diseases and osteoporosis (6, 7). Changes in gene or miRNA expression were observed in different samples, such as bone trabecula, serum, as well as peripheral blood monocytes (8–10). Moreover, a network analysis of gene modules related to bone mineral density demonstrated that particular expression of monocytes affects bone mass (11).
According to the surface antigens, human monocyte subsets can be divided into classical (CD14+CD16−), intermediate (CD14+CD16+), and non-classical (CD14−CD16+) monocytes, which have different abilities to secret cytokines (12). Classical monocytes play a vital role in the initial inflammatory response and cause chronic diseases. Intermediate and non-classical monocytes are grouped together as CD16+ monocytes in many studies. Non-classical monocyte functions are less clear in chronic disease, although their roles in atherosclerosis, ischemic reperfusion injury, rheumatoid arthritis and other disease have been reported (13). The composition of CD14+CD16+ monocytes was increased in multiple myeloma patients with osteolytic bone disease. Therefore, CD14+CD16+ monocyte might become a candidate marker for osteolytic bone destruction (14).
Monocytes serve as early progenitors of osteoclasts, which alter bone metabolism and bone mass. It is necessary to elucidate the role of monocytes in the progression of osteoporosis. Recent evidences have emerged that explorations of gene profile by bioinformatics analyses promote investigation of the molecular mechanisms for kinds of disease (15, 16). However, the relationship between osteoporosis and monocytes subsets gene variation is rarely reported. Therefore, we identified low-peak bone mass (LPBM) and CD16+ monocytes through cross-validation data sets Co-expressed genes in subpopulations. Based on the identified differentially expressed genes (DEGs), we screened out the hub genes and predicted their targeted miRNA. We constructed a CD16+ monocytes subsets miRNA-mRNA regulatory network in the context of LPBM, which might provide a new insight into pathophysiological mechanism and therapy for osteoporosis.
Materials and Methods
Microarray Data Source
Gene expression profiles were downloaded from the Gene Expression Omnibus (GEO, https://www.ncbi.nlm.nih.gov/geo/). The microarray profile dataset GSE7158, deposited by Lei et al., was conducted on circulating monocytes from 14 samples of extremely high-peak bone mass (HPBM) and 12 samples of extremely low-peak bone mass (LPBM). The dataset was based on the GPL570 [HG-U133_Plus_2] Affymetrix Human Genome U133 Plus 2.0 Array platform. Besides, the gene expression dataset GSE101489, provided by Cole S et al., was selected for containing CD16− classical monocytes samples and CD16+ non-classical monocytes samples. The dataset was based on the GPL10904 Illumina HumanHT-12 V4.0 expression beadchip platform. The miRNA expression profile GSE93883 included 12 patients with osteoporosis (six samples with fracture and six samples without fracture) and six non-osteoporotic patients. This dataset was based on GPL18058 Exiqon miRCURY LNA microRNA array, 7th generation [miRBase v18, condensed Probe_ID version] platform.
Data Processing
The online analysis tool GEO2R (https://www.ncbi.nlm.nih.gov/geo/geo2r/) was used to detect the DEGs between HPBM and LPBM samples. Genes that met the criteria, the P-value <0.05, |log2 (Fold-Change)|≥ 1 were considered as DEGs. Venn diagram webtool (http://bioinformatics.psb.ugent.be/webtools/Venn/) was used to identify the related genes.
Functional and Pathway Enrichment Analysis
Metascape online database (17) (http://metascape.org) was used for Gene Ontology (GO) annotation analysis of DEGs and Kyoto Encyclopedia of Genes and Genomes (KEGG) pathway enrichment analysis. GO annotation analysis includes biological process (BP), molecular function (MF), and cellular component (CC) (18). Using KEGG pathway analysis, a set of molecular interaction, reaction and relationship networks of DEGs were constructed (19). The gene expression information of all peak bone mass samples was uploaded to the GSEA software for further analysis (20, 21). The hallmark gene set database was selected as the reference gene set. The gene set was filtered with the minimum number of 15 genes and the maximum number of 500 genes by default. Normalized enrichment score (NES) >1, Nominal P-value <0.01, and FDR q-value <0.25 were set as the cut-off criteria.
Protein−Protein Interaction Network Analysis and Hub Gene Identification
The Search Tool for the Retrieval of Interacting Genes (STRING) database (http://string-db.org/) was used to construct PPI network (22). To identify hub genes, the cytoHubba plugin was used in the Cytoscape software (version 3.7.2) based on the nodal degree (the number of genes connected to the target gene).
Prediction of Potential miRNA
TargetScan, miRDB and miRWalk databases were used to predict target miRNAs (23–25). Only the intersection of the miRNA which expressed in all the three database and the differentially expressed miRNA (DEmiRNA) in GSE93883 was considered the target miRNA.
Results
Identification and Enrichment of Differentially Expressed Genes in Low-Peak Bone Mass Monocytes
In the dataset GSE7158 contained 12 LPBM samples and 14 HPBM samples, a total of 368 DEGs were identified, including 308 up-regulated genes and 60 down-regulated genes (Figure 1A).
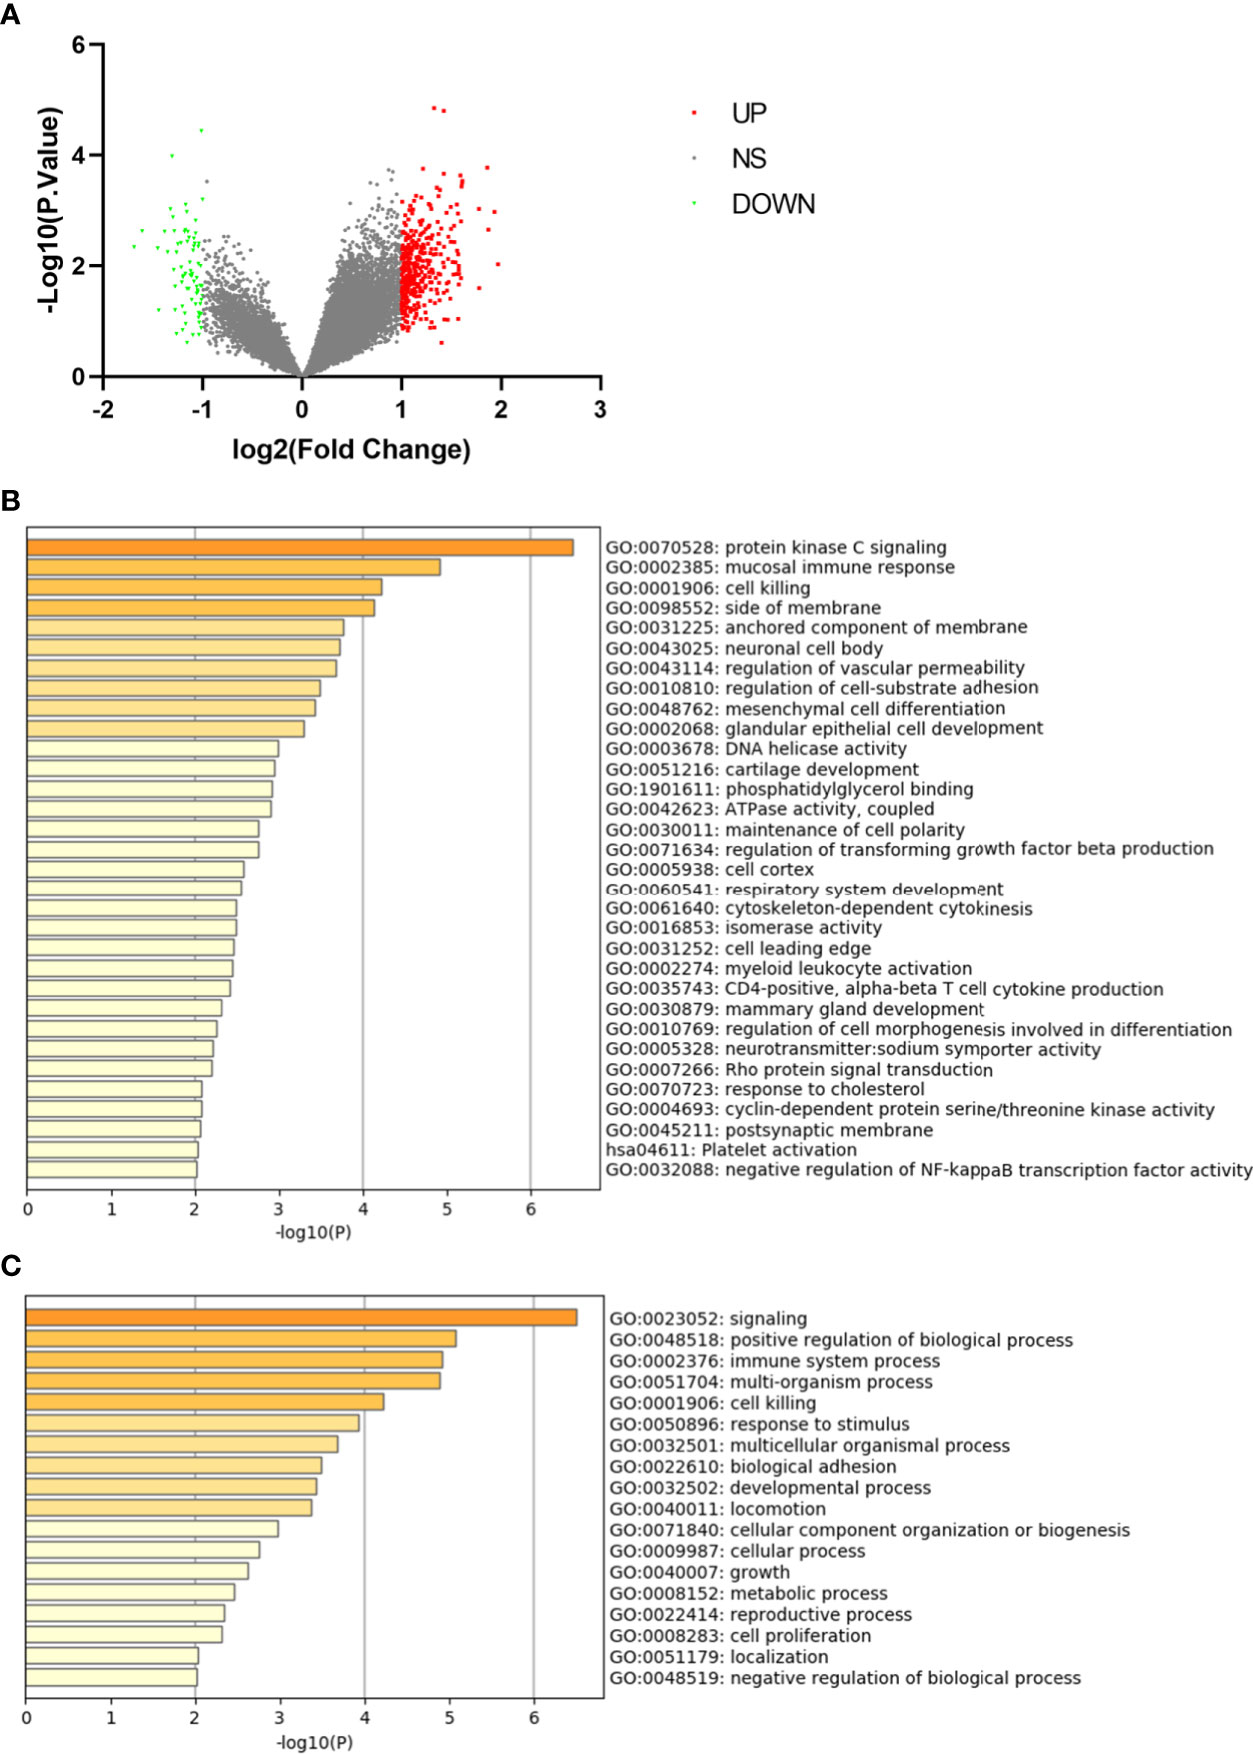
Figure 1 Differentially expressed genes in monocytes from low-peak bone mass. (A) Volcano plot for differentially expressing genes between low and high-peak bone mass samples. Red dots represent significantly up-regulated genes, green dots represent significantly down-regulated genes. (B) Heatmap of Gene Ontology (GO) and Kyoto Encyclopedia of Genes and Genomes (KEGG) enriched clusters colored by P-value. (C) The top-level Gene Ontology biological processes.
The GO and KEGG enrichment analyses of DEGs were performed using Metascape online tools. In the enriched functional category terms, 31 enriched GO terms and one KEGG pathway were identified (Figure 1B). KEGG pathway analysis showed that platelet activation was the most significant pathway. Enriched GO terms are presented in Table 1. The most affected GO biological processes included signaling, positive regulation of biological process and immune system process (Figure 1C). The network of GO and KEGG enriched terms were visualized by P-value (Supplemental Figure 1A) and clusters (Supplemental Figure 1B).
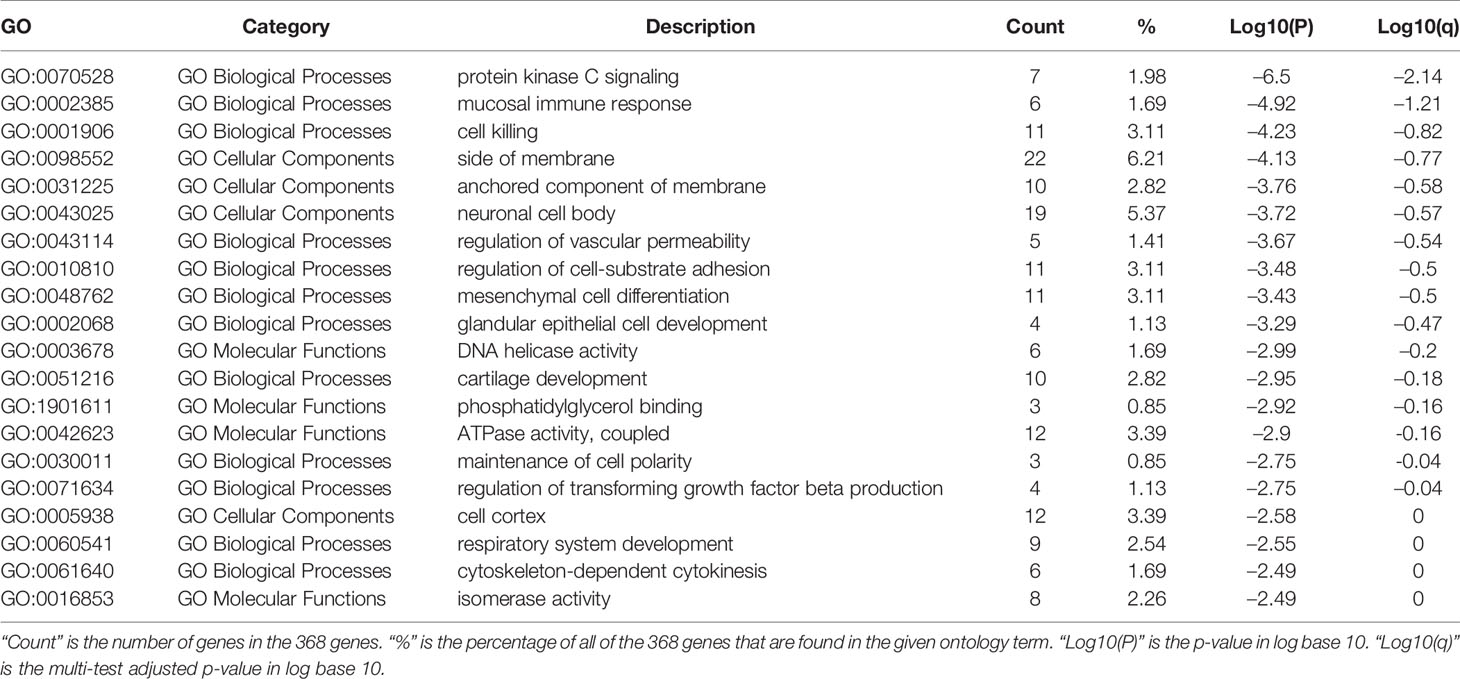
Table 1 Top 20 enriched terms for differentially expressed genes in monocytes of low peak bone mass (LPBM).
GSEA of Low-Peak Bone Mass-Related Genes
The Molecular Signatures Database was used to analyze genes in expression profile at a holistic level using GSEA software. Compared with HPBM samples a total of 12 gene sets were up-regulated in the LPBM samples, of which 10 gene sets were significantly enriched at FDR <0.25 and five gene sets were significantly enriched at nominal P value <0.01. As shown in Figure 2, the significant gene sets were enriched in interferon-α/γ response, TNF-α signaling via NF-κB, apoptosis, and coagulation.
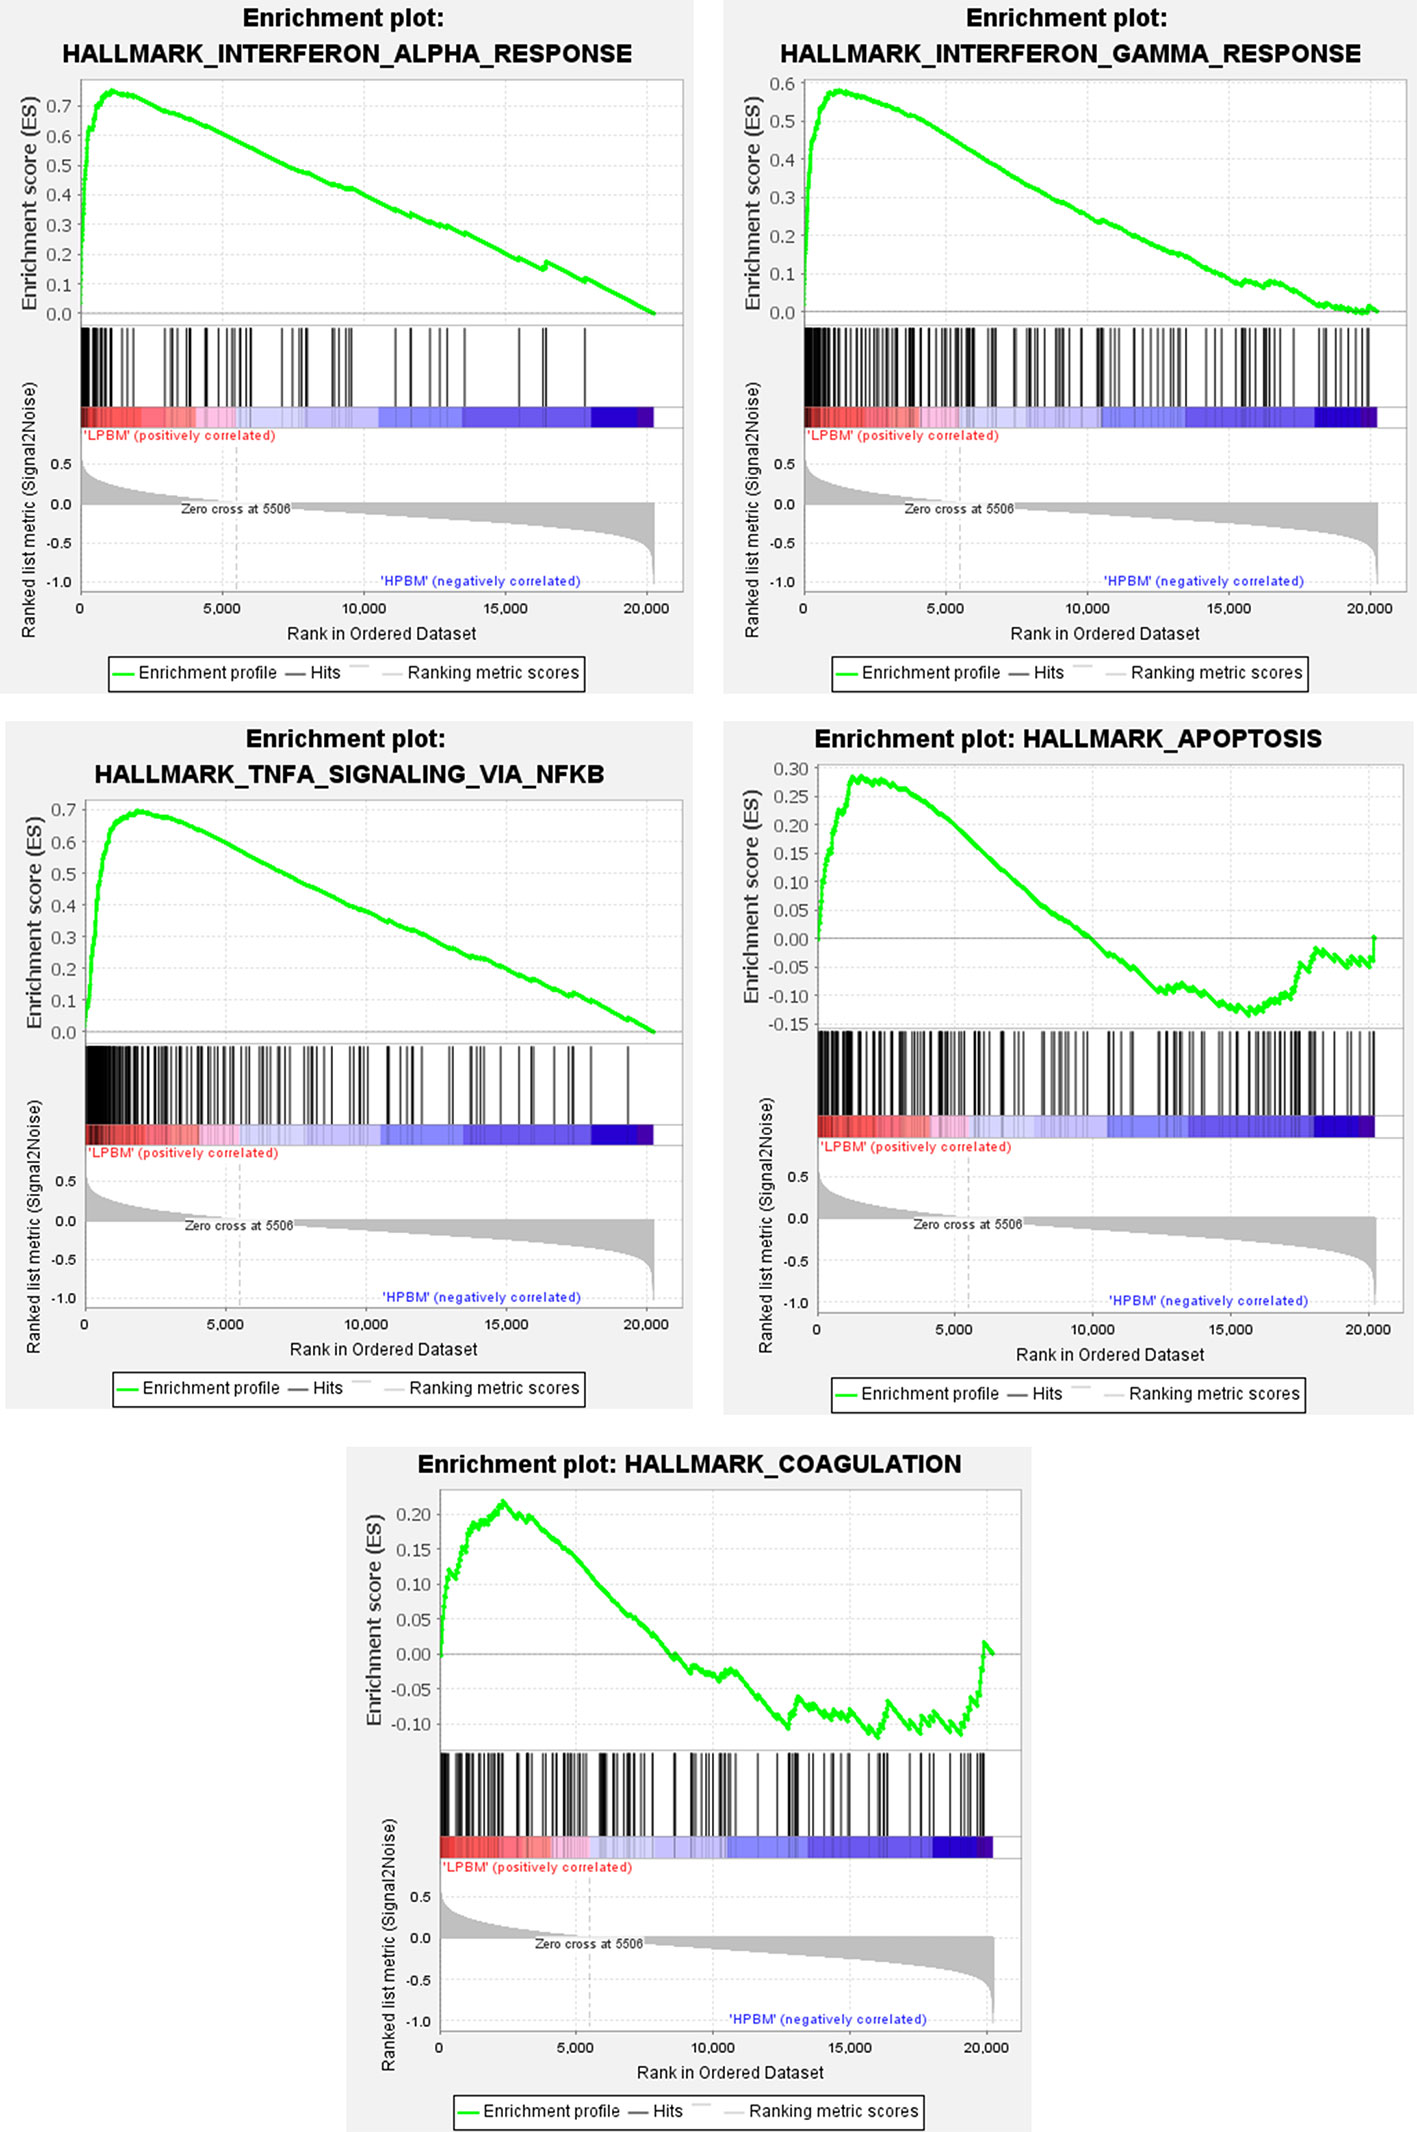
Figure 2 The whole gene expression value of low and high-peak bone mass samples was analyzed using GSEA software. Significant gene set criteria were set as NES >1, FDR <0.25 and P-value <0.01.
Protein–Protein Interaction Network Analysis and Hub Gene Identification of Differentially Expressed Genes in Low-Peak Bone Mass Monocytes
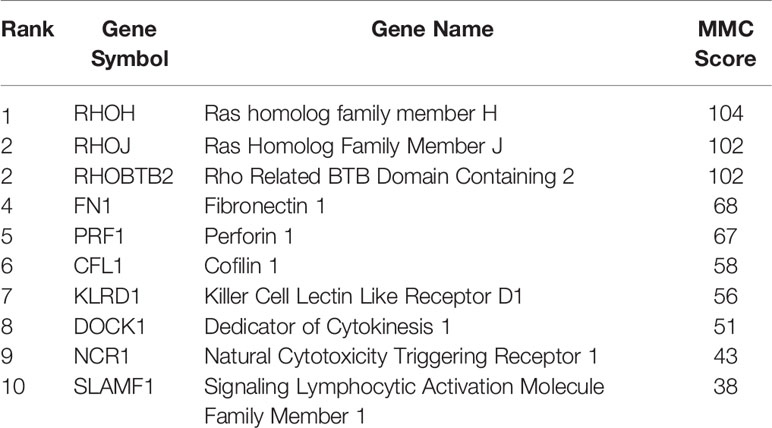
Using the STRING tools, a total of 294 nodes and 298 edges were predicted in the PPI network with interaction ≥0.4 (Supplemental Figure 2). In order to identify hub genes in network, the cytoHubba plugin in Cytoscape software was used to cluster the network genes. The 10 hub genes with the highest MMC scores are listed in Table 2. As shown in Figure 3, the top 10 hub genes with their neighbors and expended genes were divided into two linkage modules.
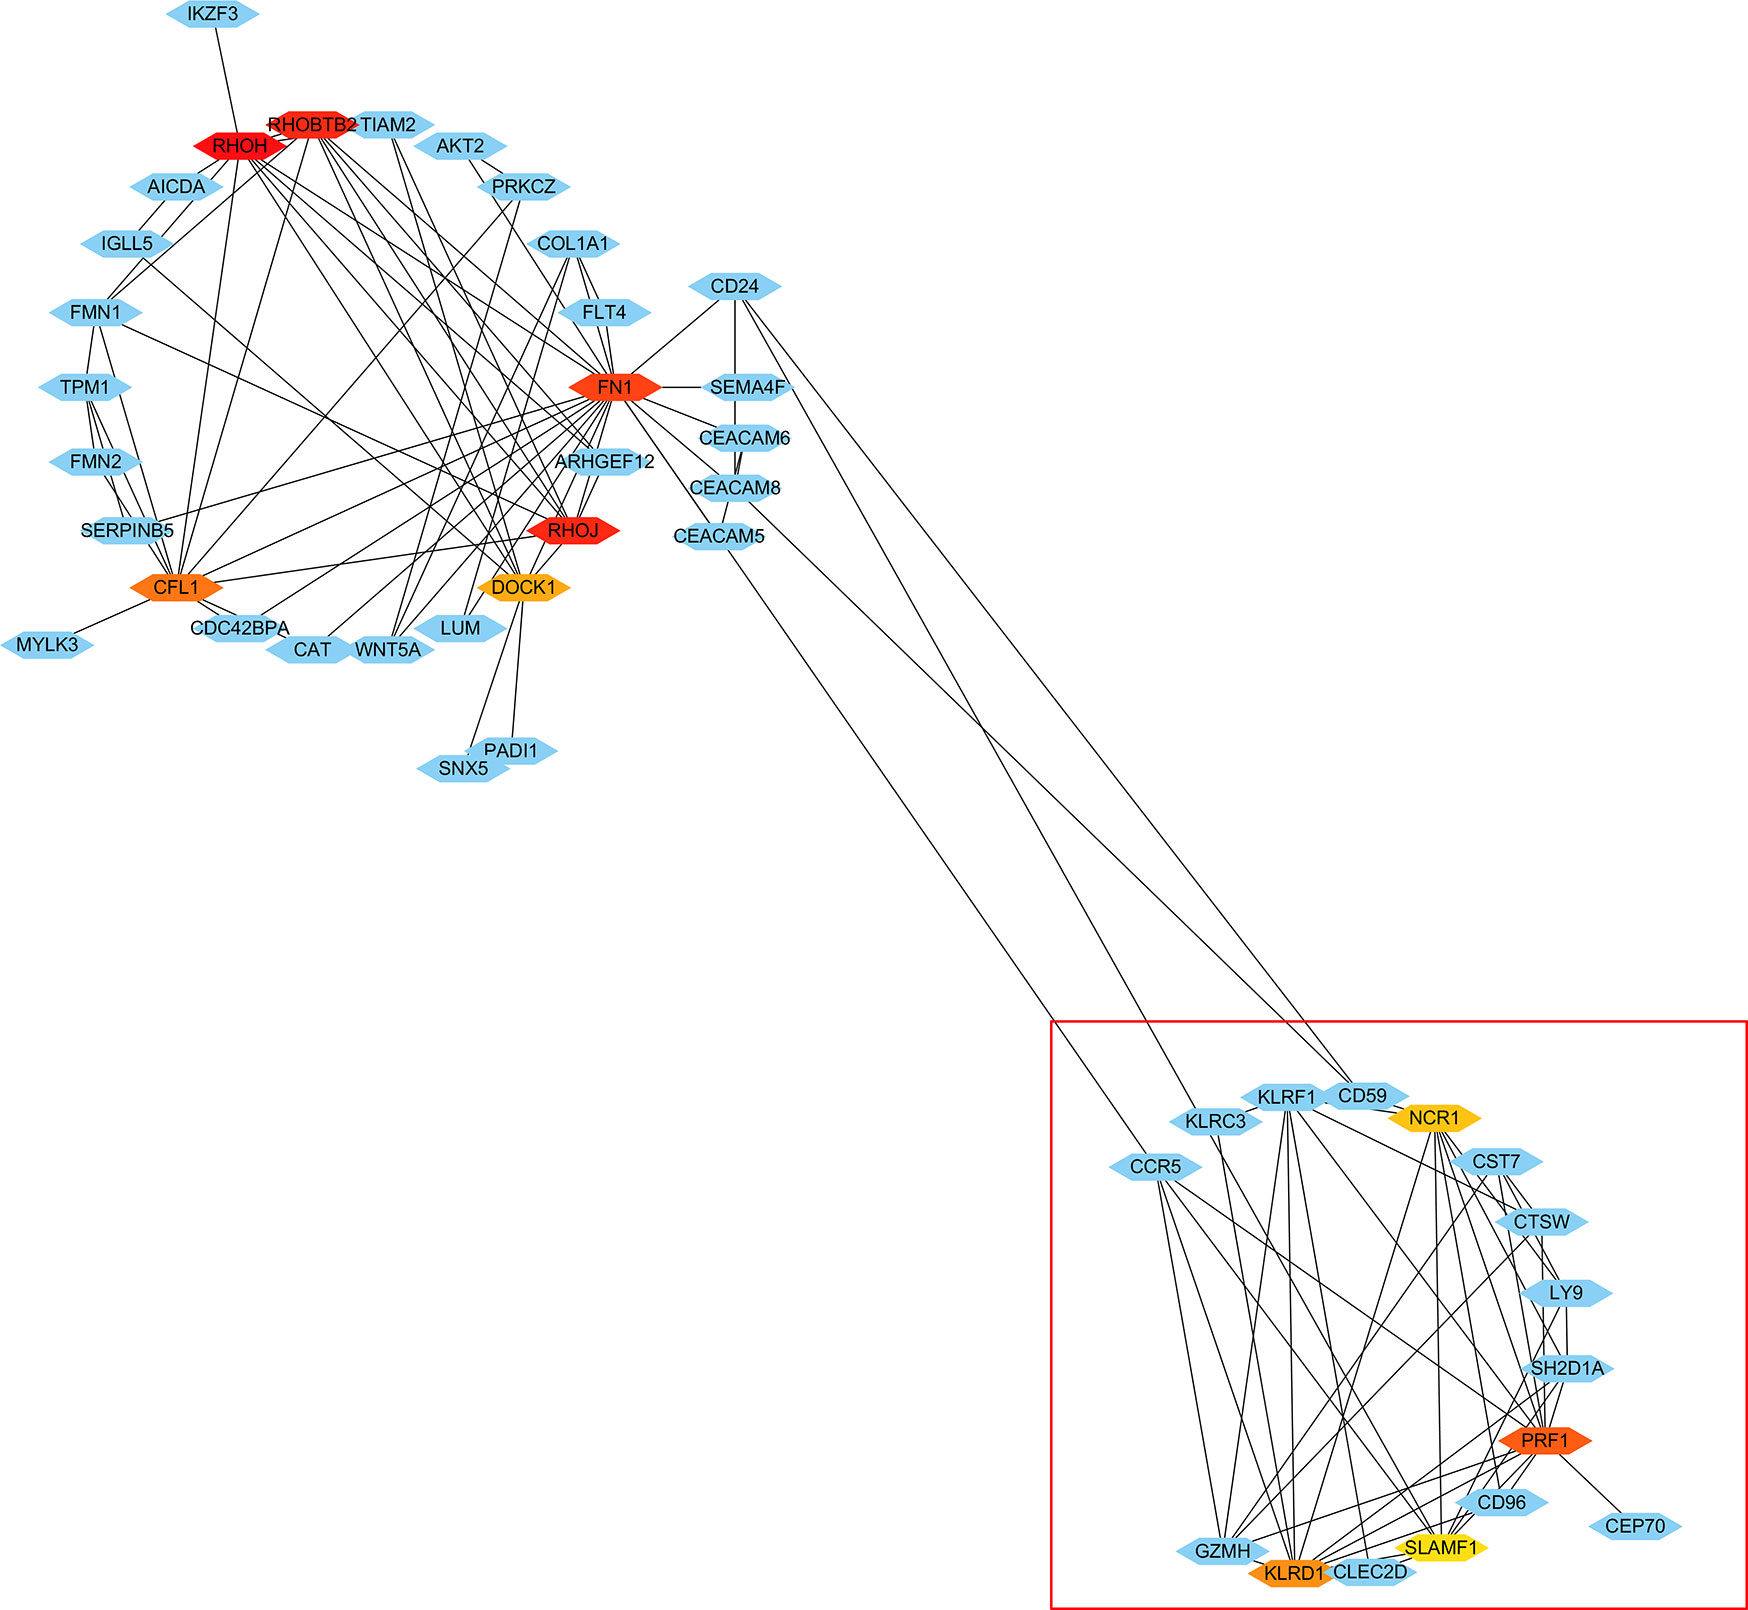
Figure 3 Cytoscape network clustering visualization of hub DEGs in monocytes from low-peak bone mass samples. The nodes represent genes and the edges represent links between genes. The red/orange/yellow color means the MMC scores is highest/moderate high/mild high.
Identification and Enrichment of Differentially Expressed Genes in CD16+ Monocytes
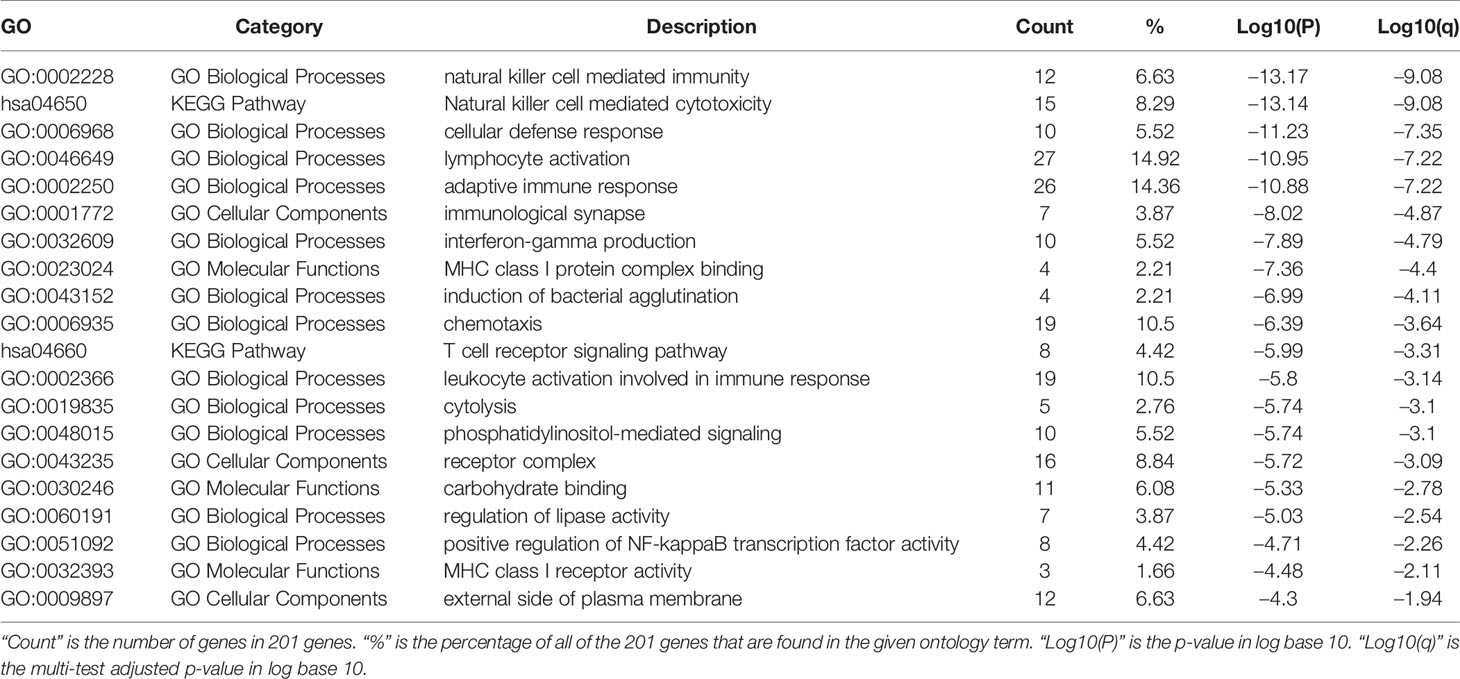
The microarray expression dataset GSE101489 was download. The analysis was performed to acquire DEGs between CD16+ monocytes and CD16- monocytes (Figure 4A). A total of 201 DEGs were identified including 169 up-regulated genes and 32 down-regulated genes. Enriched GO terms and KEGG pathways were identified using Metascape online tools. Natural killer cell mediated cytotoxicity, T cell receptor signaling pathway and apoptosis were significantly enriched in the KEGG pathway (Figure 4B). The enriched GO terms included immune system process, response to stimulus and cell killing (Figure 4C). The enriched terms are presented in Table 3.
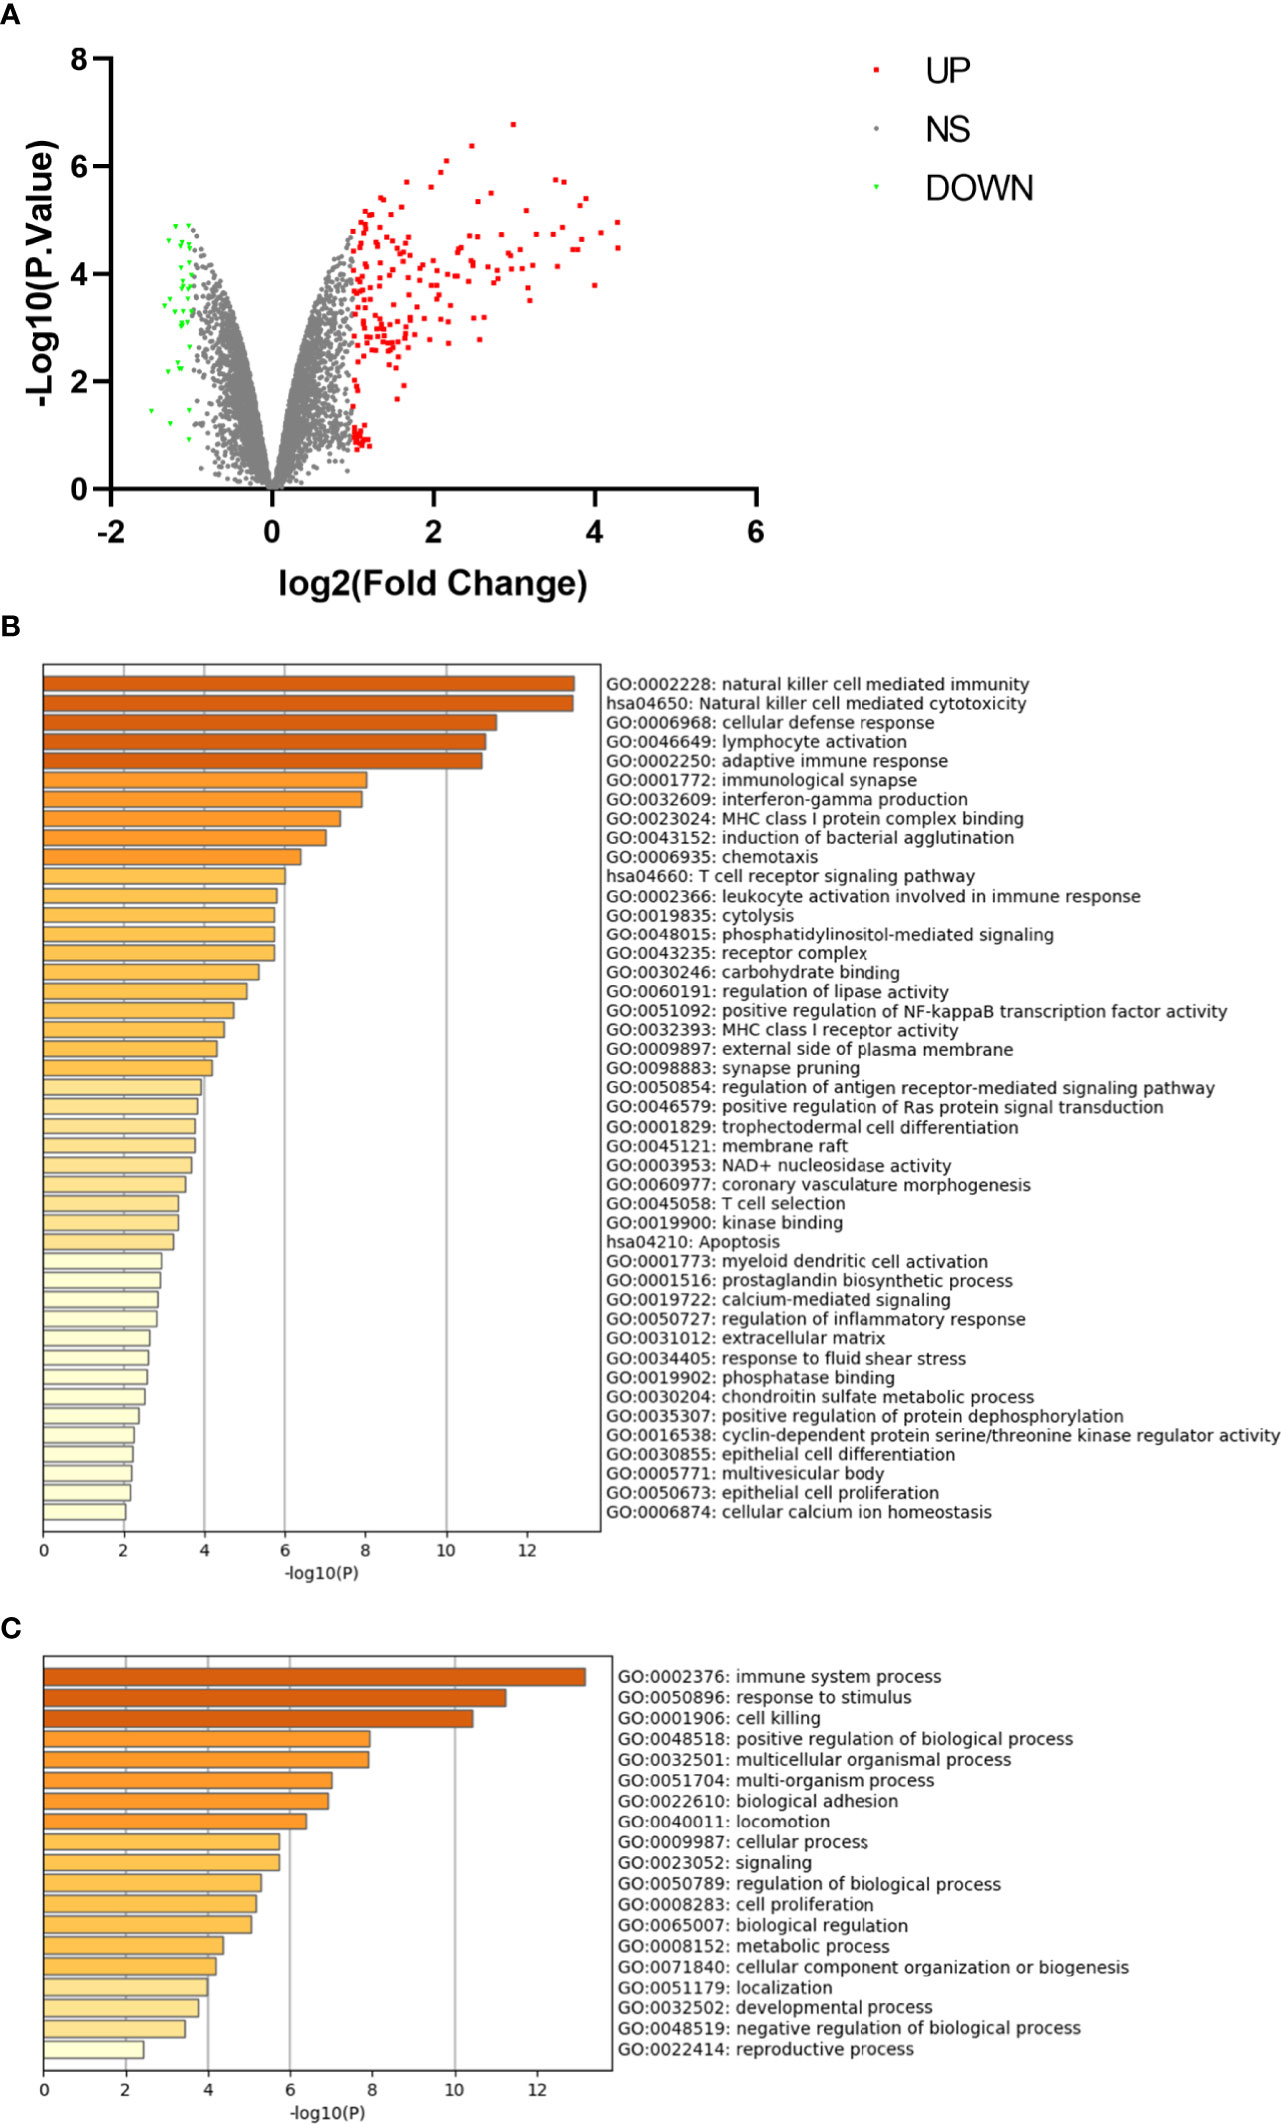
Figure 4 Differentially expressed genes in CD16+ monocyte samples. (A) Volcano plot for differentially expressing genes between CD16+ and CD16− monocyte samples. Red dots represent significantly upregulated genes, green dots represent significantly downregulated genes. (B) Heatmap of Gene Ontology (GO) and Kyoto Encyclopedia of Genes and Genomes (KEGG) enriched clusters colored by P-value. (C) The top-level Gene Ontology biological processes.
Protein–Protein Interaction Network Analysis of Differentially Expressed Genes in CD16+ Monocytes
A PPI network with an interaction score >0.4 was obtained based on the STRING online database (Figure 5A). The hub genes were clustered using the cytoHubba plugin in Cytoscape software. As shown in Figure 5B, the top 10 nodes ranked by MCC were clustered. Moreover, all of them were the up-regulated genes in CD16+ monocytes.
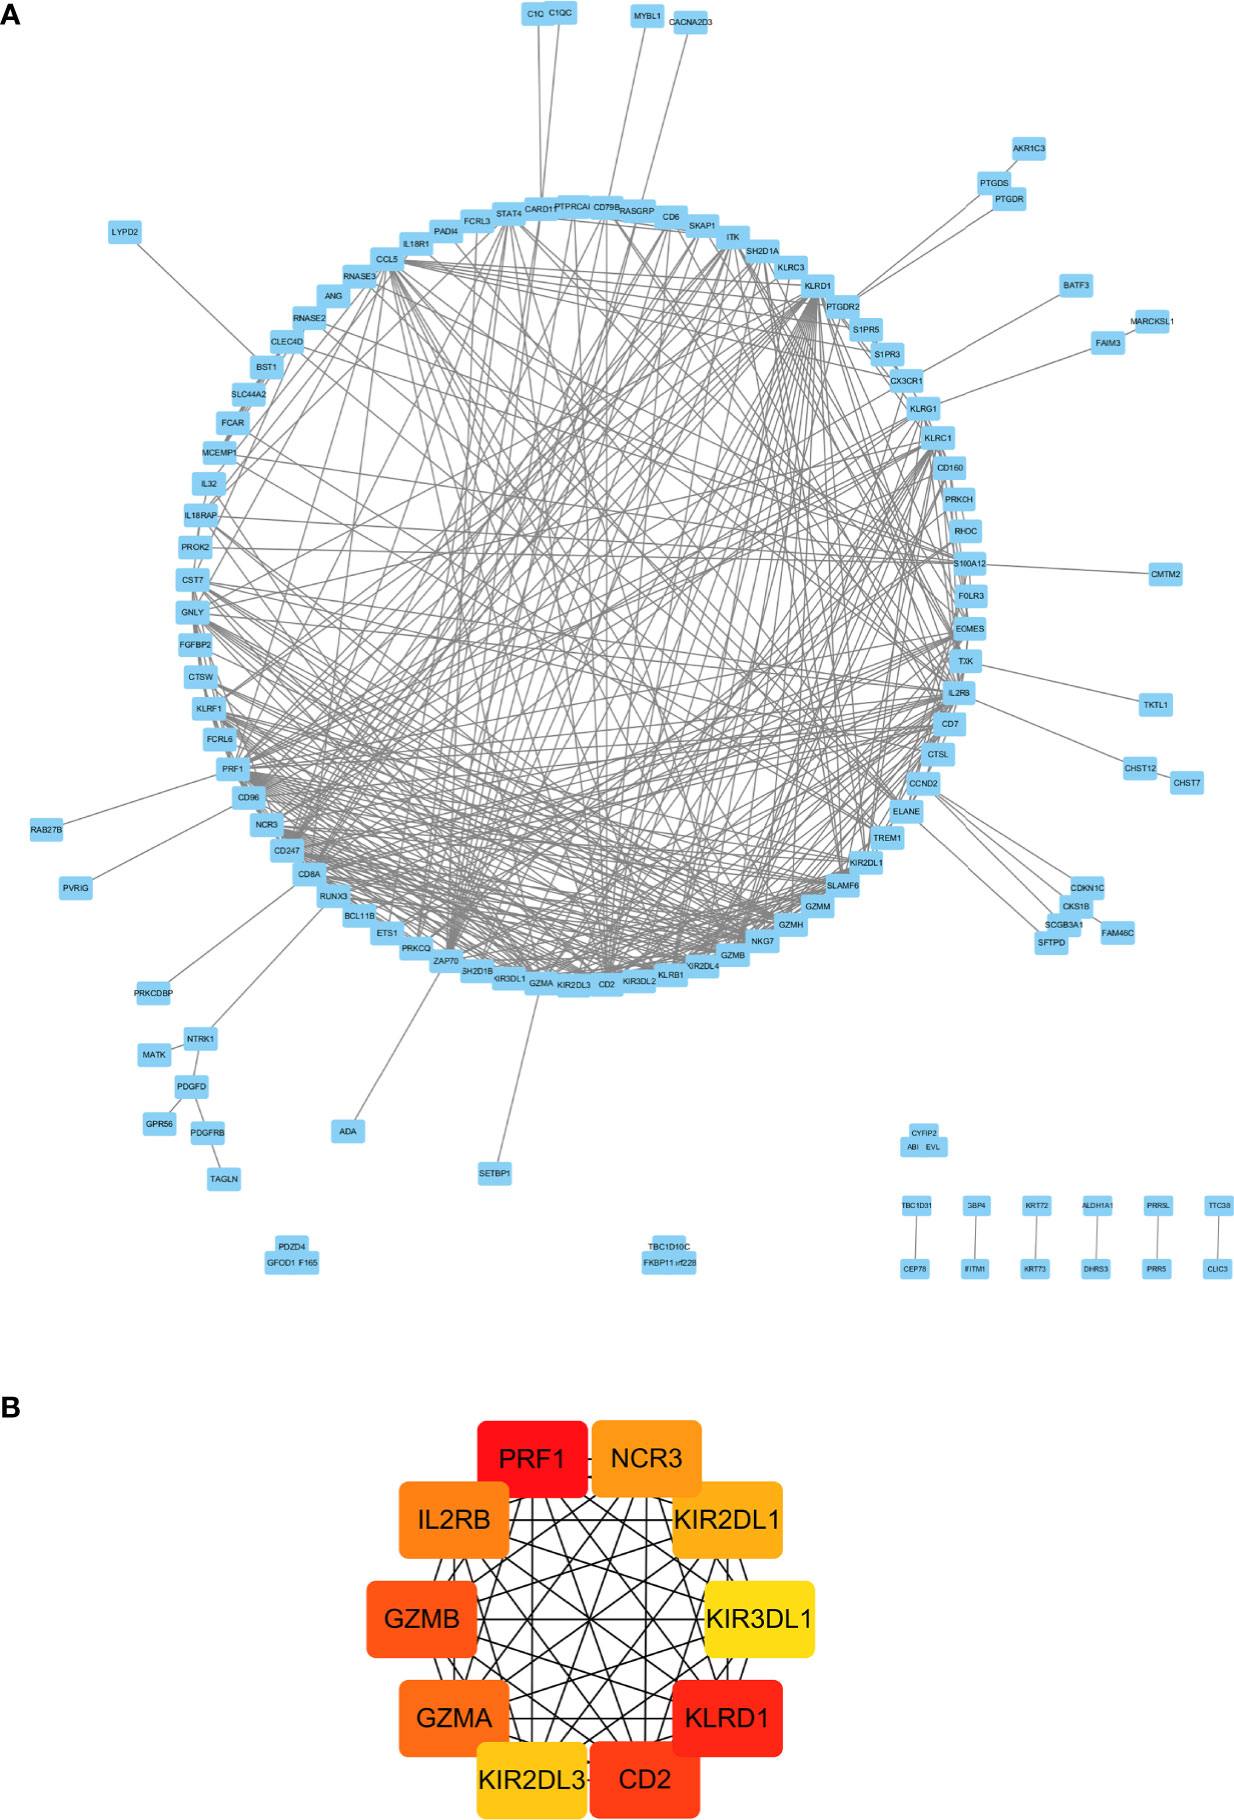
Figure 5 PPI network analysis of DEGs in CD16+ monocytes. (A) PPI network of differentially expression genes in CD16+ monocytes. (B) Hub genes in the PPI network.
Identification and Cluster Analysis of Overlapping Genes
As shown in Figure 6A, there were 15 genes overlapping between the 368 DEGs in LPBM and 201 DEGs in CD16+ monocytes. Moreover, all the 15 genes were the up-regulated DEGs in both datasets. Then, cluster analysis was performed to visualize the interactional relationship between the LPBM and CD16+ monocytes subset. Network analysis and gene clustering were carried out using Cytoscape software. In the Figure 6B, ten key PPI modules were identified from the 15 overlapping genes. Moreover, nine of them (KLRF1, GZMH, CTSW, KLRD1, CST7, KLRC3, SH2D1A, CD96, PRF1) existed in a hub gene module of LPBM DEGs (a red box in Figure 3). It reveals that the nine genes in CD16+ monocytes play an important role in the process of bone mass loss.
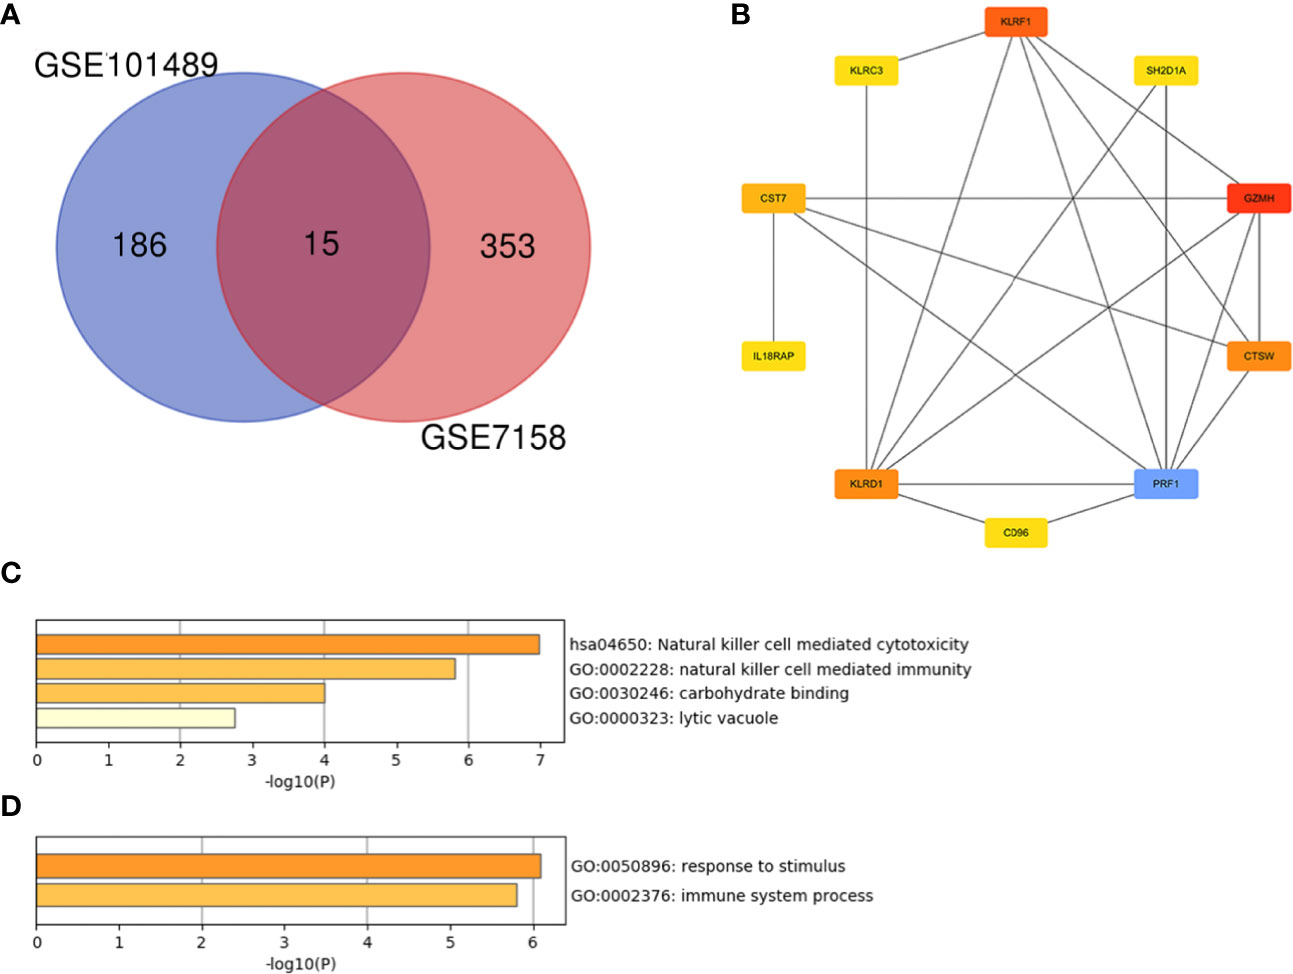
Figure 6 (A) Venn diagram of differentially expressed genes between the low-peak bone mass in GSE7158 and CD16+ monocytes subset in GSE101489. (B) Analysis of hub genes using cytoHubba for the 15 overlapping genes. (C) Heatmap of Gene Ontology (GO) and Kyoto Encyclopedia of Genes and Genomes (KEGG) enriched clusters colored by P-value. (D) The top-level Gene Ontology biological processes.
Further functional enrichment analysis for the nine hub genes were performed using Metascape online tool. The natural killer cell mediated cytotoxicity was significantly enriched in the KEGG pathway (Figure 6C). The enriched terms are presented in Table 4. The GO terms included carbohydrate binding in the MF category, lytic vacuole in the CC category and natural killer cell mediated immunity in the MF category. The top-level GO biological processes were present in Figure 6D, including response to stimulus and immune system process.
Prediction and Confirmation of Target miRNA for Hub Genes
Based on the miRDB, TargetScan and miRWalk online databases, 467, 4,008, and 5,540 target miRNAs were predicted for the nine hub genes. After intersection, 183 miRNAs were selected, which were all expressed in three databases.
The DEmiRNAs in primary osteoporotic patients without or with vertebral fractures were obtained by analyzing the GSE 93883 dataset (Figures 7A, B). After intersection with the 183 predicted miRNAs, 12 miRNAs were screen out (Figure 7C). The miRNA–mRNA regulatory network of monocytes in patients with osteoporosis was established based on the predicted miRNA–RNA pairs (Figure 7D).
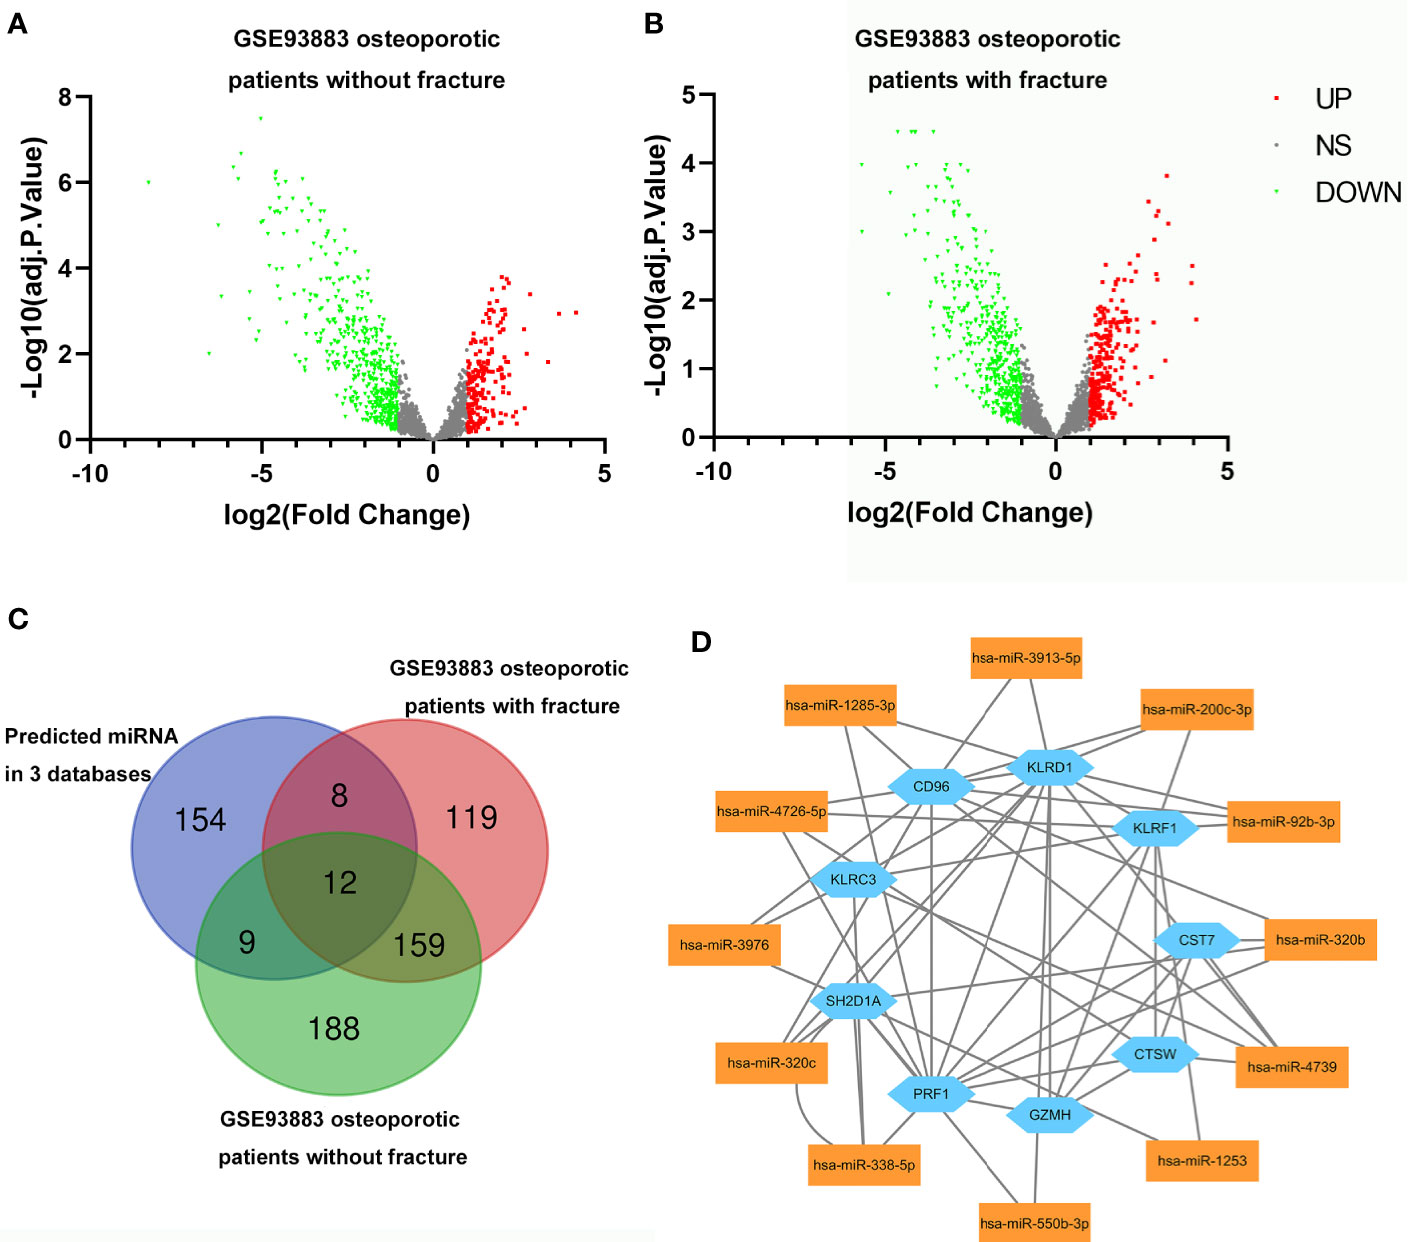
Figure 7 Volcano plots for differentially expressing miRNAs (DEmiRNAs) in osteoporotic patients without (A)/with fracture (B). Red dots represent significantly upregulated miRNAs, green dots represent significantly downregulated miRNAs. (C) Venn diagram showing the numbers of predicted miRNAs, DEmiRNAs in osteoporotic patients with fracture and those without fracture from GSE93883 dataset. (D) The relationship between nine hub genes and 12 selected miRNAs (miRNA-mRNA regulatory network).
Discussion
Osteoporosis is a common disease characterized by reduced bone mass, deteriorated bone tissue and increased susceptibility to fracture. Monocytes are the largest type of leukocytes, which can differentiate into myeloid lineage dendritic cells and macrophages. Cytokines and growth factors secreted by monocytes can affect bone (26, 27). In addition, osteoclast is a kind of bone-resorbing macrophage polykaryon, which is differentiated from monocyte/macrophage precursor (28, 29). Therefore, monocytes have been studied with the osteoporotic pathophysiology for several years (30, 31). Distinct population of monocytes display considerable heterogeneity based on their phenotype and function (32). Hence, we hypothesized that the phenotypes of LPBM were influenced by the aberrant expansion of monocyte subsets. However, the relationship between the gene expression profile of monocytes subsets and the pathogenesis of osteoporosis is rarely reported. To support this hypothesis, we identified 368 DEGs in monocytes of peak bone mass (LPBM vs. HPBM) patients, 201 DEGs in monocyte subsets (CD16+ vs. CD16−) through integrative analysis of GEO data. In order to validate the biologic relevance of these modules, the intersection of DEGs in the two series were performed and 15 overlapping DEGs were screened out. Moreover, the 15 genes were up-regulated in both datasets. PPI analysis and hub gene identification revealed that nine key genes in monocytes (KLRF1, GZMH, CTSW, KLRD1, CST7, KLRC3, SH2D1A, CD96, PRF1) might play a vital role in osteoporosis. Based on the prediction of hub genes and cross-validation with miRNA expression profile, 12 miRNAs were picked out and a potential miRNA–mRNA network was constructed.
The subjects with high or low peak bone mass in GSE7158 were recruited from a healthy premenopausal female population. At the age from 20 to 45 years, women’s bone mineral density (BMD) is in a relative balance because the peak bone mass is reached (33). The expression of relevant genes which reflects bone metabolism is much less influenced by hormones and nutrition. Therefore, it would be appropriate opportunity to explore the genetic factors responsible for BMD variation at peak bone mass (34). Hundreds of genes have been confirmed to be involved as osteoporosis is a polygenetic disease. Pathways related to bone metabolism and immune system were reported to be involved in the biological processes, including extracellular matrix metabolism, the cytokine and cytokine receptor network, as well as Wnt signaling and so on (35). Previous study demonstrated that interferon could induce vital intermediate expression in osteoblasts in response to the stimulation for proliferation/differentiation (36). Blocking the TNF-α pathway could prevent bone loss in murine model for hemophilic arthropathy (37). Consistent with our data, GSEA analysis results showed that interferon-α/γ response, TNF-α signaling via NF-κB, apoptosis and coagulation were the significantly enriched pathways. Additionally, our enrichment analysis demonstrated that DEGs between HPBM and LPBM were mainly enriched in signaling, positive regulation of biological process and immune system process. Therefore, our data-mining results confirmed that the immune system played a critical role in the etiology of osteoporosis. It was consistent with previous report that cytokines and immune factors produced by immune cells could regulate bone resorption and formation (38). Such as T cells could regulate bone homeostasis by secreting pro-osteoclastogenic cytokines and anti-osteoclastogenic cytokines (39–41). Moreover, bone homeostasis could be regulated by immune cells of the bone marrow (42).
Inflammation and the innate defense in mammals can be linked to adaptive immune responses through monocytes, which means that monocytes is a kind of accessory cell (43). Monocyte subsets are identified based on their surface antigens with unique transcriptional and functional characteristics (44). Although non-classical monocytes are widely regarded as protective cells, their role in chronic disease remains unclear. Previous study showed that aberrant expansion of (CD14+CD16+) monocyte subsets contributed to the enhanced apoptotic phenotype in the pathogenesis of IgA nephropathy (45). In the disease with inflammation-driven bone loss, the composition of CD14+CD16+ vs. CD14+CD16− monocytes altered, which led to an increase in osteoclast formation (46). Since CD16 is the main surface marker expressed by monocytes, these cell types deserve further analysis. However, monocyte subset gene identification for osteoporosis is rarely reported. Therefore, our research first time elucidated gene profile identification of monocyte subsets in different bone mass population by cross-validation of data. The functional analysis of DEGs on CD16+ monocytes in our study demonstrated that the most significant pathways were natural killer cell mediated cytotoxicity, T cell receptor signaling pathway and apoptosis. The enriched GO terms included immune system process, response to stimulus and cell killing. These enriched terms are similar to the enrichment analysis for osteoporosis above (35).
The enrichment analysis of nine hub genes in the 15 overlapping DEGs showed that the top one enriched KEGG pathway was natural killer cell mediated cytotoxicity. According to the GeneCards database (https://www.genecards.org/), all the nine genes play a vital role in immunity. Killer Cell Lectin Like Receptor D1(KLRD1), Killer Cell Lectin Like Receptor F1 (KLRF1), Killer Cell Lectin Like Receptor C3 (KLRC3) and Granzyme H (GZMH) are expressed primarily in natural killer (NK) cells and participate in cytokine release. NK cells mediate cytotoxic activity and secrete cytokines in response to immune stimulation. Cathepsin W (CTSW) may play a role in the regulation of T-cell cytolytic activity. SH2 Domain Containing 1A (SH2D1A) can modify signal transduction pathways by binding to the surface molecules on activated T, B, and NK cells. CD96 participates in the adhesion interaction between activated T cells and NK cells in the immune response. Perforin 1 (PRF1) participates in killing other cells that cannot be recognized as families. Cystatin F (CST7) may inhibit a unique target in the hematopoietic system and regulate immune process. In addition, the nine genes all existed in one modules of hub gene for DEGs of LPBM. Therefore, we speculated that the up-regulated nine key genes in CD16+ monocytes might play a vital role in immune response during bone loss process. The datasets for peak bone mass and miRNAs profiles in osteoporotic patients were all from Asian population. Therefore, the key genes identified in this study will be further investigated with human samples in follow-up study.
In summary, we screened out 15 DEGs from two datasets and identified nine hub genes by constructing a PPI network. Moreover, 12 target miRNAs were predicted with three databases and confirmed using miRNA expression profiling data. Then, a miRNA–mRNA network was constructed. Our study provided a reliable comprehensive analysis on the DEGs profile in monocyte subsets for bone loss. Further studies are required to explore the mechanism of these potential genes associated with osteoporosis in CD16+ monocytes.
Data Availability Statement
The original contributions presented in the study are included in the article/Supplementary Material; further inquiries can be directed to the corresponding authors.
Author Contributions
BH analyzed part of the data and wrote the manuscript. XK, LL, and FD collected the data and analyzed part of the data. QZ contributed to the discussion and reviewed the manuscript. RS involved in the overall study, designed the analysis plan, performed the statistical analyses guidance and revised the manuscript. All authors contributed to the article and approved the submitted version.
Conflict of Interest
The authors declare that the research was conducted in the absence of any commercial or financial relationships that could be construed as a potential conflict of interest.
Supplementary Material
The Supplementary Material for this article can be found online at: https://www.frontiersin.org/articles/10.3389/fendo.2020.581878/full#supplementary-material
References
1. Cosman F, de Beur SJ, LeBoff MS, Lewiecki EM, Tanner B, Randall S, et al. Clinician’s Guide to Prevention and Treatment of Osteoporosis. Osteoporosis Int J Established As Result Cooperation Between Eur Foundation Osteoporosis Natl Osteoporosis Foundation USA (2014) 25(10):2359–81. doi: 10.1007/s00198-014-2794-2
2. Wright NC, Looker AC, Saag KG, Curtis JR, Delzell ES, Randall S, et al. The recent prevalence of osteoporosis and low bone mass in the United States based on bone mineral density at the femoral neck or lumbar spine. J Bone Mineral Res Off J Am Soc Bone Mineral Res (2014) 29(11):2520–6. doi: 10.1002/jbmr.2269
3. Eastell R, Szulc P. Use of bone turnover markers in postmenopausal osteoporosis. Lancet Diabetes Endocrinol (2017) 5(11):908–23. doi: 10.1016/S2213-8587(17)30184-5
4. Boyle WJ, Simonet WS, Lacey DL. Osteoclast differentiation and activation. Nature (2003) 423(6937):337–42. doi: 10.1038/nature01658
5. Liu YZ, Zhou Y, Zhang L, Li J, Tian Q, Zhang JG, et al. Attenuated monocyte apoptosis, a new mechanism for osteoporosis suggested by a transcriptome-wide expression study of monocytes. PloS One (2015) 10(2):e0116792. doi: 10.1371/journal.pone.0116792
6. Su YJ, Chen CT, Tsai NW, Huang CC, Wang HC, Kung CT, et al. The Role of Monocyte Percentage in Osteoporosis in Male Rheumatic Diseases. Am J Men’s Health (2017) 11(6):1772–80. doi: 10.1177/1557988317721642
7. Gao K, Zhu W, Liu W, Ma D, Li H, Yu W, et al. The predictive role of monocyte-to-lymphocyte ratio in osteoporosis patient. Medicine (2019) 98(34):e16793. doi: 10.1097/MD.0000000000016793
8. Zhou Y, Xu C, Zhu W, He H, Zhang L, Tang B, et al. Long Noncoding RNA Analyses for Osteoporosis Risk in Caucasian Women. Calcified Tissue Int (2019) 105(2):183–92. doi: 10.1007/s00223-019-00555-8
9. De-Ugarte L, Yoskovitz G, Balcells S, Güerri-Fernández R, Martinez-Diaz S, Mellibovsky L, et al. MiRNA profiling of whole trabecular bone: identification of osteoporosis-related changes in MiRNAs in human hip bones. BMC Med Genomics (2015) 8:75. doi: 10.1186/s12920-015-0149-2
10. Weilner S, Skalicky S, Salzer B, Keider V, Wagner M, Hildner F, et al. Differentially circulating miRNAs after recent osteoporotic fractures can influence osteogenic differentiation. Bone (2015) 79:43–51. doi: 10.1016/j.bone.2015.05.027
11. Farber CR. Identification of a gene module associated with BMD through the integration of network analysis and genome-wide association data. J Bone Mineral Res Off J Am Soc Bone Mineral Res (2010) 25(11):2359–67. doi: 10.1002/jbmr.138
12. Passlick B, Flieger D, Ziegler-Heitbrock HW. Identification and characterization of a novel monocyte subpopulation in human peripheral blood. Blood (1989) 74(7):2527–34. doi: 10.1182/blood.V74.7.2527.2527
13. Narasimhan PB, Marcovecchio P, Hamers AAJ, Hedrick CC. Nonclassical Monocytes in Health and Disease. Annu Rev Immunol (2019) 37:439–56. doi: 10.1146/annurev-immunol-042617-053119
14. ?>Petitprez V, Royer B, Desoutter J, Guiheneuf E, Rigolle A, Marolleau JP, et al. CD14+ CD16+ monocytes rather than CD14+ CD51/61+ monocytes are a potential cytological marker of circulating osteoclast precursors in multiple myeloma. A preliminary study. Int J Lab Hematol (2015) 37(1):29–35. doi: 10.1111/ijlh.12216
15. Wang H, Zhu H, Zhu W, Xu Y, Wang N, Han B, et al. Bioinformatic Analysis Identifies Potential Key Genes in the Pathogenesis of Turner Syndrome. Front Endocrinol (2020) 11:104. doi: 10.3389/fendo.2020.00104
16. Madireddy L, Patsopoulos NA, Cotsapas C, Bos SD, Beecham A, McCauley J. A systems biology approach uncovers cell-specific gene regulatory effects of genetic associations in multiple sclerosis. Nat Commun (2019) 10(1):2236. doi: 10.1038/s41467-019-10951-1
17. Zhou Y, Zhou B, Pache L, Chang M, Khodabakhshi AH, Tanaseichuk O, et al. Metascape provides a biologist-oriented resource for the analysis of systems-level datasets. Nat Commun (2019) 10(1):1523. doi: 10.1038/s41467-019-09234-6
18. Ashburner M, Ball CA, Blake JA, Botstein D, Butler H, Cherry JM, et al. Gene ontology: tool for the unification of biology. The Gene Ontology Consortium. Nat Genet (2000) 25(1):25–9. doi: 10.1038/75556
19. Kanehisa M, Goto S. KEGG: kyoto encyclopedia of genes and genomes. Nucleic Acids Res (2000) 28(1):27–30. doi: 10.1093/nar/28.1.27
20. Mootha VK, Lindgren CM, Eriksson KF, Subramanian A, Sihag S, Lehar J, et al. PGC-1alpha-responsive genes involved in oxidative phosphorylation are coordinately downregulated in human diabetes. Nat Genet (2003) 34(3):267–73. doi: 10.1038/ng1180
21. Subramanian A, Tamayo P, Mootha VK, Mukherjee S, Ebert BL, Gillette MA, et al. Gene set enrichment analysis: a knowledge-based approach for interpreting genome-wide expression profiles. Proc Natl Acad Sci U States A (2005) 102(43):15545–50. doi: 10.1073/pnas.0506580102
22. Szklarczyk D, Gable AL, Lyon D, Junge A, Wyder S, Huerta-Cepas J, et al. STRING v11: protein-protein association networks with increased coverage, supporting functional discovery in genome-wide experimental datasets. Nucleic Acids Res (2019) 47(D1):D607–d13. doi: 10.1093/nar/gky1131
23. Chen Y, Wang X. miRDB: an online database for prediction of functional microRNA targets. Nucleic Acids Res (2020) 48(D1):D127–d31. doi: 10.1093/nar/gkz757
24. Lewis BP, Burge CB, Bartel DP. Conserved seed pairing, often flanked by adenosines, indicates that thousands of human genes are microRNA targets. Cell (2005) 120(1):15–20. doi: 10.1016/j.cell.2004.12.035
25. Agarwal V, Bell GW, Nam JW, Bartel DP. Predicting effective microRNA target sites in mammalian mRNAs. eLife (2015) 4. doi: 10.7554/eLife.05005
26. Gowen M, Wood DD, Ihrie EJ, McGuire MK, Russell RG. An interleukin 1 like factor stimulates bone resorption in vitro. Nature (1983) 306(5941):378–80. doi: 10.1038/306378a0
27. Dominguez JH, Mundy GR. Monocytes mediate osteoclastic bone resorption by prostaglandin production. Calcified Tissue Int (1980) 31(1):29–34. doi: 10.1007/BF02407164
28. Udagawa N, Takahashi N, Akatsu T, Tanaka H, Sasaki T, Nishihara T, et al. Origin of osteoclasts: mature monocytes and macrophages are capable of differentiating into osteoclasts under a suitable microenvironment prepared by bone marrow-derived stromal cells. Proc Natl Acad Sci U States A (1990) 87(18):7260–4. doi: 10.1073/pnas.87.18.7260
29. Shalhoub V, Elliott G, Chiu L, Manoukian R, Kelley M, Hawkins N, et al. Characterization of osteoclast precursors in human blood. Br J Haematol (2000) 111(2):501–12. doi: 10.1111/j.1365-2141.2000.02379.x
30. Xiao K-W, Li J-L, Zeng Z-H, Liu Z-B, Hou Z-Q, Yan X, et al. Monocytes affect bone mineral density in pre- and postmenopausal women through ribonucleoprotein complex biogenesis by integrative bioinformatics analysis. Sci Rep (2019) 9(1):17290. doi: 10.1038/s41598-019-53843-6
31. Zhou Y, Deng HW, Shen H. Circulating monocytes: an appropriate model for bone-related study. Osteoporosis Int J Established As Result Cooperation Between Eur Foundation Osteoporosis Natl Osteoporosis Foundation USA (2015) 26(11):2561–72. doi: 10.1007/s00198-015-3250-7
32. Ziegler-Heitbrock L. Monocyte subsets in man and other species. Cell Immunol (2014) 289(1-2):135–9. doi: 10.1016/j.cellimm.2014.03.019
33. Yao WJ, Wu CH, Wang ST, Chang CJ, Chiu NT, Yu CY. Differential changes in regional bone mineral density in healthy Chinese: age-related and sex-dependent. Calcified Tissue Int (2001) 68(6):330–6. doi: 10.1007/s002230001210
34. Deng FY, Liu YZ, Li LM, Jiang C, Wu S, Chen Y, et al. Proteomic analysis of circulating monocytes in Chinese premenopausal females with extremely discordant bone mineral density. Proteomics (2008) 8(20):4259–72. doi: 10.1002/pmic.200700480
35. Guo L, Han J, Guo H, Lv D, Wang Y. Pathway and network analysis of genes related to osteoporosis. Mol Med Rep (2019) 20(2):985–94. doi: 10.3892/mmr.2019.10353
36. Grewal TS, Genever PG, Brabbs AC, Birch M, Skerry TM. Best5: a novel interferon-inducible gene expressed during bone formation. FASEB J Off Publ Fed Am Soc Exp Biol (2000) 14(3):523–31. doi: 10.1096/fasebj.14.3.523
37. Haxaire C, Hakobyan N, Pannellini T, Carballo C, McIlwain D, Mak TW, et al. Blood-induced bone loss in murine hemophilic arthropathy is prevented by blocking the iRhom2/ADAM17/TNF-α pathway. Blood (2018) 132(10):1064–74. doi: 10.1182/blood-2017-12-820571
38. Charles JF, Aliprantis AO. Osteoclasts: more than ‘bone eaters’. Trends Mol Med (2014) 20(8):449–59. doi: 10.1016/j.molmed.2014.06.001
39. Weitzmann MN, Pacifici R. Estrogen deficiency and bone loss: an inflammatory tale. J Clin Investigation (2006) 116(5):1186–94. doi: 10.1172/JCI28550
40. Lei H, Schmidt-Bleek K, Dienelt A, Reinke P, Volk H-D. Regulatory T cell-mediated anti-inflammatory effects promote successful tissue repair in both indirect and direct manners. Front Pharmacol (2015) 6:184–. doi: 10.3389/fphar.2015.00184
41. John V, Hock JM, Short LL, Glasebrook AL, Galvin RJ. A role for CD8+ T lymphocytes in osteoclast differentiation in vitro. Endocrinology (1996) 137(6):2457–63. doi: 10.1210/endo.137.6.8641199
42. Pacifici R. The immune system and bone. Arch Biochem Biophysics (2010) 503(1):41–53. doi: 10.1016/j.abb.2010.05.027
43. Auffray C, Sieweke MH, Geissmann F. Blood monocytes: development, heterogeneity, and relationship with dendritic cells. Annu Rev Immunol (2009) 27:669–92. doi: 10.1146/annurev.immunol.021908.132557
44. Karlmark KR, Tacke F, Dunay IR. Monocytes in health and disease - Minireview. Eur J Microbiol Immunol (2012) 2(2):97–102. doi: 10.1556/EuJMI.2.2012.2.1
45. Cox SN, Serino G, Sallustio F, Blasi A, Rossini M, Pesce F, et al. Altered monocyte expression and expansion of non-classical monocyte subset in IgA nephropathy patients. Nephrol Dialysis Transplant Off Publ Eur Dialysis Transplant Assoc Eur Renal Assoc (2015) 30(7):1122–232. doi: 10.1093/ndt/gfv017
Keywords: osteoporosis, peak bone mass, monocyte subsets, differentially expressed genes, Microarrary gene expression data
Citation: Hu B, Kong X, Li L, Dai F, Zhang Q and Shi R (2021) Integrative Analyses of Genes Associated With Osteoporosis in CD16+ Monocyte. Front. Endocrinol. 11:581878. doi: 10.3389/fendo.2020.581878
Received: 10 July 2020; Accepted: 02 December 2020;
Published: 21 January 2021.
Edited by:
Gudrun Stenbeck, Brunel University London, United KingdomReviewed by:
Filippo Maffezzoni, Civil Hospital of Brescia, ItalyUday Kishore, Brunel University London, United Kingdom
Copyright © 2021 Hu, Kong, Li, Dai, Zhang and Shi. This is an open-access article distributed under the terms of the Creative Commons Attribution License (CC BY). The use, distribution or reproduction in other forums is permitted, provided the original author(s) and the copyright owner(s) are credited and that the original publication in this journal is cited, in accordance with accepted academic practice. No use, distribution or reproduction is permitted which does not comply with these terms.
*Correspondence: Ruifeng Shi, c3JmX3NobWlseUAxMjYuY29t; Qiu Zhang, YXluZm1rQDE2My5jb20=
†These authors have contributed equally to this work
 Bin Hu1†
 Ruifeng Shi