
95% of researchers rate our articles as excellent or good
Learn more about the work of our research integrity team to safeguard the quality of each article we publish.
Find out more
ORIGINAL RESEARCH article
Front. Endocrinol. , 17 April 2020
Sec. Obesity
Volume 11 - 2020 | https://doi.org/10.3389/fendo.2020.00216
This article is part of the Research Topic Unanswered Questions in Obesity/Metabolic Surgery View all 12 articles
 Giuseppe Daniele1
 Beatrice Campi2
 Alessandro Saba3,4
 Simone Codini1Annamaria Ciccarone1
 Laura Giusti1Stefano Del Prato1Russel L. Esterline5Ele Ferrannini2*
Background: N-acetylaspartate (NAA) is synthesized only by neurons and is involved in neuronal metabolism and axonal myelination. NAA is the strongest signal on brain magnetic resonance spectroscopy, and its concentration have been associated with cognitive dysfunction in neurodegenerative diseases, obesity, and type 2 diabetes (T2D).
Materials and Methods: We explored the impact of obesity and T2D on circulating NAA as well as the impact of bariatric surgery and antidiabetic treatments. We developed an LC-MS method for the accurate measurements of fasting plasma NAA levels in 505 subjects (156 subjects with normal glucose tolerance, 24 subjects with impaired glucose tolerance, and 325 patients with T2D) to examine the associations of NAA with obesity and dysglycemia. To validate cross-sectional findings, plasma NAA was measured 6 months after Roux-en-Y Gastric Bypass (RYGB) in 55 morbidly obese subjects, and after 1 year of antidiabetic treatment (with dapagliflozin, exenatide, or dapagliflozin plus exenatide) in 192 T2D patients.
Results: In the whole population, NAA was associated with age (r = 0.31, p <0.0001) and BMI (r = −0.20, p <0.0001). Independently of age and BMI, NAA was reciprocally related to HbA1c and fasting plasma glucose (partial r = −0.13, both p = 0.01). Surgically-induced weight loss raised NAA (by 18 nmol/L on average, p <0.02). Glucose lowering treatment increased NAA in proportion to the drop in HbA1c (r = 0.31, p <0.0001) regardless of the agent used.
Conclusions: Circulating NAA concentrations are modulated by age, obesity, and glycemic control. Whether they may mark for the corresponding metabolic effects on brain function remains to be established by joint measurements of spectroscopic signal and cognitive function.
Type 2 diabetes (T2D) and obesity increase the risk of serious complications in multiple organs, including the brain (1). Obesity and T2D are associated with a higher prevalence of cognitive dysfunction, dementia, and neurodegenerative diseases, including Alzheimer and Parkinson diseases (2–5). Microvascular disease induced by hyperglycemia is responsible for disruption of the blood-brain barrier (BBB) through pericyte depletion, possibly caused by excess superoxide produced during enhanced mitochondrial respiration (6, 7). Loss of the BBB ability to protect the brain from circulating substances results in neurotoxicity and neuronal cell death (8). Neuroimaging has documented several structural and functional alterations in numerous brain regions of patients with T2D (9–11). Magnetic resonance spectroscopy (MRS) has provided details regarding metabolite changes in the brain that might be related to functional and structural alterations. Recent MRS-based analyses carried out in humans have suggested that N-acetylaspartate (NAA), the most concentrated metabolite in the brain (~10 mM) (12–14), is significantly reduced in several diseases including Alzheimer (15, 16), Huntington disease (17), bipolar disorder (18), schizophrenia (19), multiple sclerosis (20), and T2D (21–25).
NAA is reputed to be a marker of neuronal number and viability (26) but its role in brain metabolism and function in humans is far from being fully elucidated. NAA is synthesized in neuronal mitochondria and then transported by a sodium/dicarboxylate symporter (27) to aspartoacylase-containing oligodendrocytes (28) and astrocytes. NAA has two primary roles, as a facilitator of energy metabolism in neuronal mitochondria (29) and a source of acetate for fatty acid and steroid synthesis necessary for axonal myelination by oligodendrocytes (30, 31). Astrocytes, which represent the main cell type within the BBB structure, play a role in the removal of NAA from the extracellular space; a continuous NAA efflux from the brain to the circulation has been proposed (32). Therefore, plasma NAA levels might be used as a marker of central NAA alterations in neurodegenerative diseases and T2D-related brain damage. One difficulty is that the few studies measuring circulating NAA concentrations report widely different values even in healthy controls, ranging from a mean 0.11 mmol/L (33) to 0.44 μmol/L (34), very likely due to assay differences.
To the best of our knowledge, the impact of obesity and T2D on circulating NAA has not been previously explored. We therefore set forth to measure plasma NAA in non-diabetic obese and T2D subjects and the effect of treatment on plasma NAA.
This was a data pooling project of different cohort studies. A total of 505 study subjects included patients with T2D or impaired glucose tolerance (IGT) and non-diabetic obese subjects. Two subgroups of participants were studied: (i) to assess the impact of major weight loss on circulating NAA levels, we included obese subjects undergoing Roux-en-Y Gastric Bypass (RYGB) between 2015 and 2018; (ii) to evaluate the effect of glycemic control, we included T2D patients from the DURATION-8 study (NCT02229396), which was a 52-week, multicenter, double-blind, randomized, active-controlled phase 3 trial. In DURATION-8, participants were randomly assigned to receive once-weekly exenatide (2 mg) by subcutaneous injection plus once-daily dapagliflozin (10 mg) (EQW+Dapa), exenatide with dapagliflozin-matched oral placebo (EQW), or dapagliflozin with exenatide-matched placebo injections (Dapa+Plb) (35). Lean healthy subjects with normal glucose tolerance (NGT) were included as control group. Exclusion criteria were: type 1 diabetes, psychiatric disorders, severe cognitive impairment, neurodegenerative diseases, epilepsy, depression treatment, traumatic brain injury over the preceding months, liver function enzymes higher more than two times the upper limit, heart failure (NYHA III-IV), GFR <60 ml/min/1.73 m2, diabetes treatment other than metformin, or sulphonylureas. The ethical committee approvals refers to specific ethical approval of each study included in the pooled analysis. All procedure performed were in accordance with the Helsinki Declaration of 1975 as revised 1983.
All plasma samples were obtained in the overnight fasted [10–14 h) state, and stored at −80°C for NAA analysis. Baseline and post-treatment samples were assayed in the same run to reduce within-subject variability.
NAA and internal standard N-Acetyl-L-aspartic acid-1,2,3,4-13C4 (IS, 13C4-NAA) as well as acetonitrile (LC-MS grade), ultra-pure water (LC-MS grade), formic acid (MS grade), and 3N hydrochloric acid in butan-1-ol were provided by Sigma-Aldrich (Saint Louis, MO, USA).
An Agilent 1290 Infinity UHPLC system (Santa Clara, CA, USA), including binary pump, autosampler, and column oven, fitted with a Kinetex C18 (100Å, 2.6 μm, 50 ×2.10 mm ID) HPLC column (Phenomenex, Torrance, CA, USA), protected by a KrudKatcher Ultra HPLC in-line filter (0.5 μm depth ×0.004 in ID), was used for sample injection and chromatographic separation. This latter was carried out under the gradient conditions at a flow rate of 400 μL/min, by using H2O + 0.1% formic acid (FA) as an aqueous solvent and ACN + 20% MeOH + 0.1% FA as an organic solvent. The injection volume of samples was 5 μL.
Mass spectrometry runs were carried out by an AB Sciex API 4000 triple quadrupole mass spectrometer (Concord, ON, Canada), equipped with an electrospray (ESI) Turbo-V ion source. The MS method was based on positive ion mode selected reaction monitoring (SRM) and made use of parameters optimized in order to get the best possible sensitivity and selectivity. In particular, SRM acquisitions were based on transitions 288.2 → 143.9 Da (quantifier, Q) and 288.2 → 186.1 Da (qualifier, q) for NAA and 292 → 146.9 Da (Q), 292 → 189.1 Da (q) for 13C4-NAA.
Sample preparation was carried out as follows: plasma samples were thawed at room temperature, vortexed (15 min), and a 100 μL aliquot was added with 300 μL of acetonitrile, formic acid 1% (V%), and internal standard. The obtained suspensions were vortexed (15 min) and centrifuged (18,620 × g, 15 min). Then, 300 μL of supernatants were collected and dried under stream of N2 at 40°C. The samples were derivatized to butyl esters (Fischer esterification reaction) by adding 100 μL 3N 1-butanol/ HCl, vortexing (15 min), heating at 60°C for 40 min. The reaction products were dried under a gentle stream of nitrogen and the dry residues were reconstituted with 100 μL ACN/H2O (20/80; V/V), vortexed (15 min), and 5 μL of the obtained solutions were injected into the LC-MS-MS system.
The analytical method, which is not the main subject of this paper and that will be extensively described in a paper under preparation, was validated in compliance with EMA guidelines (36) for sample stability, linearity, lower limits of detection and quantitation (LLOD and LLOQ), matrix effect, recovery, selectivity, precision, and accuracy.
Data are given as mean ± SD. Because of their skewed distribution, plasma NAA concentrations were summarized as median [interquartile range, IQR], and logarithmically transformed for use in parametric statistical tests. Group values were compared by the Mann-Whitney U-test, paired values by the Wilkinson signed-rank test. Change by treatment were analyzed by MANOVA for repeated measures. Univariate and multivariate linear regressions were carried out by standard methods. Data analyses were performed using JMP® 7.0 (SAS Institute Inc., 2007); p ≤ 0.05 was considered statistically significant.
In the study population (259 women, 246 men), 156 subjects had normal glucose tolerance (NGT), 325 had T2D, and 24 had IGT; age ranged from 23 to 78 years, and BMI ranged from 20.1 to 57.9 kg/m2 (Figure 1). In the whole data set, fasting plasma NAA concentrations ranged from 94 to 567 nmol/L, with a significantly (p <0.0001) skewed distribution. Compared to NGT, T2D/IGT subjects were older (p <0.0001) and more often men (p = 0.002) (Table 1). Plasma NAA concentrations were higher in men than women (p <0.02), were positively associated with age, and negatively related to BMI (Figure 2). In the 63 NGT, normal-weight (i.e., BMI ≤ 25 kg/m2) subjects aged <65 years (42 women, 21 men), plasma NAA ranged 143–407 nmol/L (median 204, IQR 110 nmol/L) in men and 101–378 nmol/L (median 239, IQR 95) in women. By adjusting the entire data set for gender, age, and BMI, plasma NAA levels were inversely related to both FPG and HbA1c (Figure 3); in this model, age was still a positive (p <0.0001), and BMI a negative (p = 0.044), covariate. To characterize the clinical phenotype of subjects with low plasma NAA levels, we split the NAA distribution into quartiles. In the lower quartile of plasma NAA levels there were more women, a younger age and higher BMI, and a worse glycemic control (Table 2).
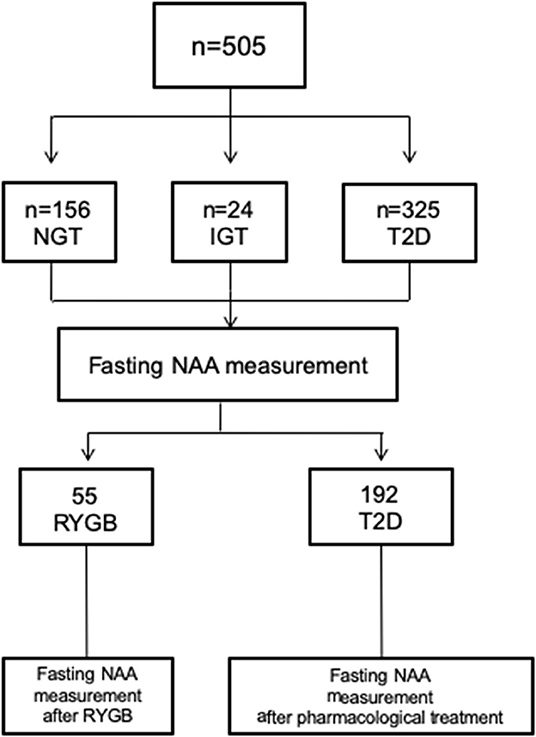
Figure 1. Participants flow chart. NGT, normal glucose tolerance; IGT, Impaired glucose regulation; T2D; type 2 diabetes.
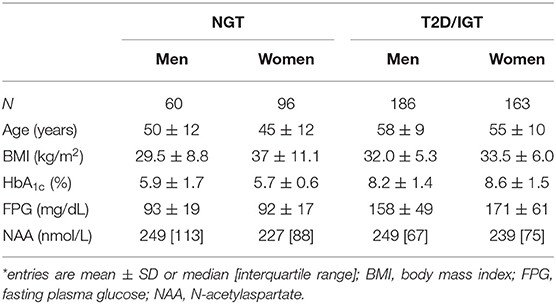
Table 1. Characteristics of the study subjects*.
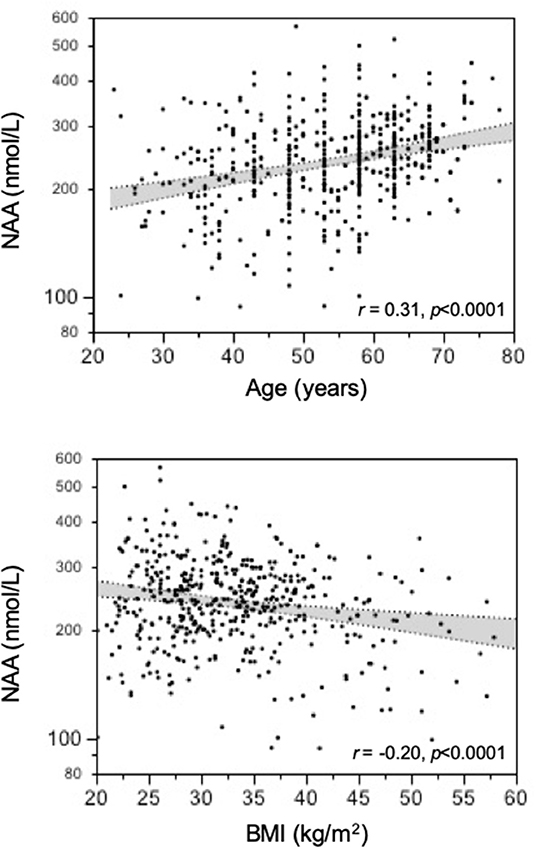
Figure 2. Association of plasma N-acetylaspartate (NAA) concentrations with age and BMI.
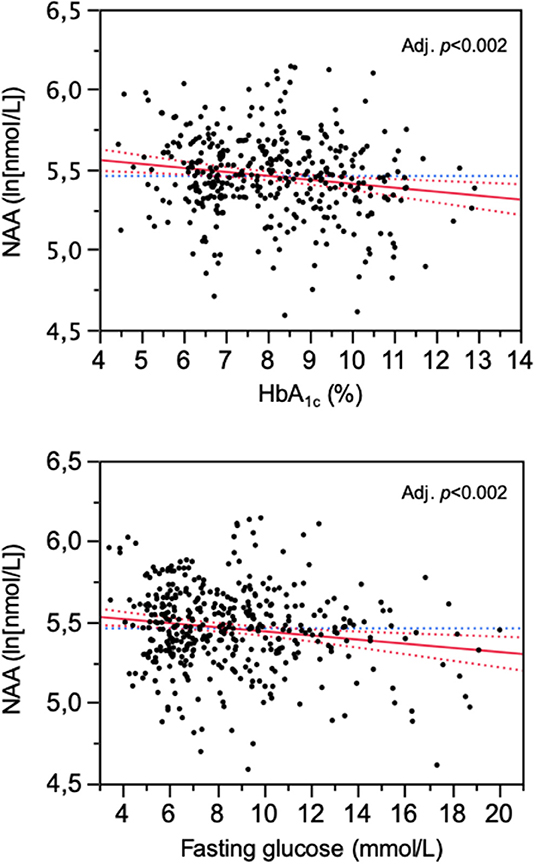
Figure 3. Association of plasma N-acetylaspartate (NAA) concentrations with HbA1c and fasting glucose levels. The plots are for logNAA residuals after controlling for gender, age, and BMI.
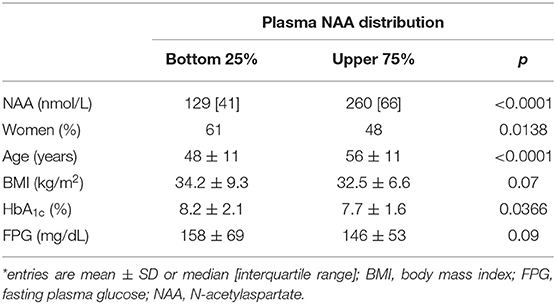
Table 2. Clinical phenotype of subjects by quartile of NAA distribution*.
In the 55 subjects (45 NGT and 10 T2D) who underwent bariatric surgery, the change in BMI at 6 months post-surgery averaged −11.5 ± 3.6 kg/m2 (p <0.0001), and was similar in NGT and T2D. Fasting plasma glucose dropped by 10 ± 16 mg/dL in NGT and by 95 ± 77 mg/dL in T2D (p <0.0001 for both), and plasma NAA increased by 18 (37) μmol/L (p <0.02).
Out of the 265 T2D patients, 192 individuals were randomized to receive dapagliflozin + placebo (Dapa+Plb), exenatide once weekly (EQW), or the combination (EQW+Dapa) in a 1:1:1 ratio for 1 year. At 52 weeks, NAA values were higher than at baseline [248 [94] vs. 239 [83] nmol/L, delta = 13 (38), p = 0.0013] across treatment. Each treatment resulted in significant reductions in BMI, fasting glucose, and HbA1c, and an increase in plasma NAA; the changes were (for BMI, FPG, and NAA) or tended to be (for HbA1c) accentuated with the combination as compared to either agent alone (Table 3). In the pooled data from all treatment arms, the changes in plasma NAA were inversely related to the concomitant changes in both HbA1c (Figure 4). The regression predicts a mean NAA increase of 16 nmol/L for a 2% decrement in HbA1c.
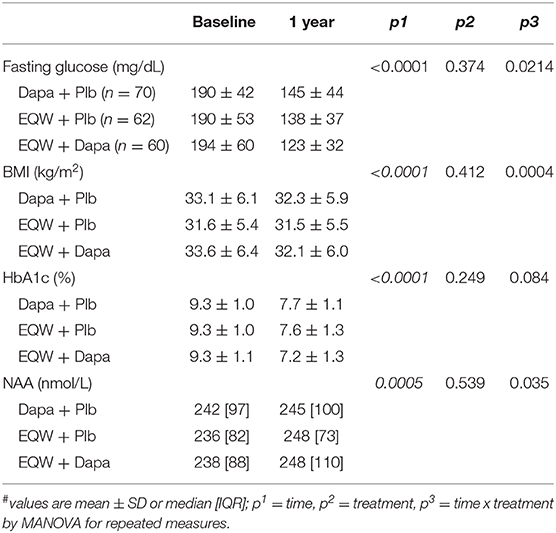
Table 3. Variables by time and treatment#.
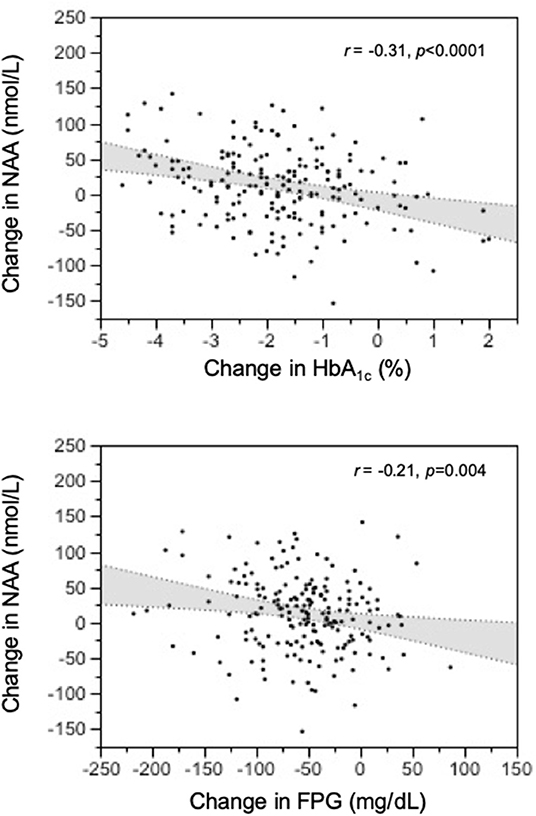
Figure 4. Relation of treatment-induced changes in plasma N-acetylaspartate (NAA) concentrations to the corresponding changes in HbA1c and fasting glucose levels at 1-year post-treatment.
The data of this study allowed us to establish normative circulating NAA metrics, namely, median fasting concentrations of 230 nmol/L in non-obese, non-diabetic subjects below 65 years of age, and consistent, if not large, deviations with age and obesity (in opposite direction). Additionally, we report for the first time an inverse relation of plasma NAA to glycemic indices—HbA1c and fasting glucose—even after controlling for sex, age, and BMI. The intervention protocols provided a prospective confirmation of this relationship by showing a consistent increase in plasma NAA concentrations following antidiabetic treatment (Figure 3).
It should be emphasized that no information is available on the acute changes in circulating NAA following physiological stimuli, e.g., a meal or a bout of physical exercise. More importantly, changes in plasma levels could reflect changes in NAA production/spillover from the brain into the bloodstream or changes in NAA removal from the plasma (or a combination thereof) (26). Thus, dysfunctional neurons might synthetize less NAA and/or the activity of the NAA-cleaving enzyme in glial cells [but also in brown adipocytes (39) and enterocytes (40)] might be increased: either process would reduce circulating NAA concentrations. The resulting clinical phenotype would resemble that profiled in subjects with lower NAA concentration (Table 3).
With regard to the effect of age, our finding of an independent, direct relationship between plasma NAA and age conflicts with two studies from the same group showing an age-related decline in serum NAA levels (41, 42). In the latter studies, however, the measured NAA concentrations were in the millimolar range, whereas reported values—including ours—are in the nanomolar range (34). Therefore, rather than a reflection of increased neuronal mass/function [i.e., an implausible correlate of aging (43)], our finding may suggest an age-related decrease in aspartoacylase, resulting in higher NAA levels. The extreme of this phenomenon would be Canavan disease, an autosomal-recessive mutation of the aspartoacylase gene associated with severe neurodegeneration (44).
The current finding of decreasing plasma NAA levels with increasing BMI is in line with the suggested role of obesity in NAA metabolism. By magnetic resonance spectroscopy (MRS), a higher BMI is associated with lower concentrations of NAA in brain frontal, parietal, and temporal white matter as well as in frontal gray matter and hippocampus (45, 46), and with progressive neuronal impairment and loss. Obesity can lead to astrogliosis, which is characterized by an increase in the number of primary astrocytic processes as well as in the length of these processes, leading to a more extensive contact between these cells and the local vasculature (47, 48). Astrocytes can be activated early after high-fat intake (49, 50) as a neuroprotective response to the rise in the concentration of fatty acids reaching the brain via the BBB (51–53). These structural changes could modify the ability of astrocytes to transport substances from the brain to the circulation, including a reduced release of NAA (54). Several studies have documented changes in urinary NAA excretion or expression of NAA producing enzymes in association with obesity and/or diabetes (39, 40, 55–57). In the present study, the body weight reduction induced by bariatric surgery was associated to a significant increase in circulating NAA. One can therefore speculate that weight loss might have had multiple favorable consequences on central and peripheral NAA metabolism, including the reduction of brain astrogliosis.
Hyperglycemia dramatically increases neuronal glucose levels, which leads to neuronal damage, a phenomenon known as glucose neurotoxicity (58). Several mechanisms have been proposed for glucose neurotoxicity, including glucose-driven oxidative stress, and protein glycation. In line with this in vitro evidence, it has been shown that NAA/creatine ratio is decreased in the frontal brain cortex in diabetic patients with poor glycemic control (25). High glucose has a dramatic impact on astrocyte phenotype by inhibiting its proliferation and disrupting its energy flow (59, 60). Moreover, high glucose is associated with an increased expression and secretion of inflammatory cytokines (interleukin-6 and interleukin-8) by astrocytes (61). These hyperglycemia-induced abnormalities of astrocyte-neuron coupling may underlie the reduced central NAA concentrations and NAA spill-over into the peripheral circulation.
Although peripheral NAA levels alone cannot be taken to reflect spill-over or astrocyte-neuron coupling, our finding of consensual changes in glycemic indices and plasma NAA (Figure 3) does lend support to the possibility that long-term changes in circulating NAA may be markers for brain dysfunction. Clearly, simultaneous measurements of plasma NAA, brain NAA signal in relevant areas, and cognitive function before and after antihyperglycemic treatment would conclusively establish origin and value of peripheral NAA assessment.
Of note is that glucagon-like peptide 1 (GLP-1) receptors are expressed in neurons, in particular pyramidal neurons in the hippocampus and neocortex, which suggests that they may play a role in neuronal activity and synaptic transmission (62–64). Glia cells also express the receptor (65). GLP-1 analogs have demonstrated an impressive range of protective effects on neurogenesis, synaptogenesis, cell repair, and reduced inflammation, which is consistent with the profile of growth factor activity (37, 66–70). In this context, it is intriguing that patients in either EQW treatment arm showed a significantly greater change in plasma NAA than patients in the Dapa+placebo arm (Table 2), suggesting a potential effect of GLP-1 receptor agonists/analogs independently of the glucose lowering effect (38, 71).
The strength of the study is based on a large population including subjects with a wide range of age and body weight, and well-characterized in terms of glucose metabolism and comorbidity. In both T2D and morbidly obese groups, psychiatric disorders, intellectual disability, severe cognitive impairment, neurodegenerative diseases, epilepsy, depression treatment, and traumatic brain injury over the preceding months were exclusion criteria, which reduced the chances of NAA alterations being due to specific brain abnormalities.
The main limitation of the present study is its retrospective nature. Consequently, the NAA associations we describe, whether cross-sectional or longitudinal, do not necessarily intimate a causative role of glucose metabolism for plasma NAA or a direct relation of plasma NAA to brain NAA metabolism. The results of the study provide preliminary, inferential evidence, which remains to be confirmed by multilevel prospective studies.
All datasets generated for this study are included in the article/supplementary material.
The studies involving human participants were reviewed and approved by University of Pisa. The patients/participants provided their written informed consent to participate in this study. Written informed consent was obtained from the individual(s) for the publication of any potentially identifiable images or data included in this article.
EF and GD conceived the experimental design, analyzed the data, wrote and edited the manuscript. AS developed the tandem mass spectrometry-based assay and directed its validation. BC and SC performed LC-MS. AC and LG provided clinical samples. SD and RE provided feedback and contributed to the write-up and review of the manuscript. EF directed the study and is the guarantor of this work and, as such, had full access to all the data in the study and takes responsibility for the integrity of the data and accuracy of the data analysis. All authors read and approved the final manuscript.
The authors declare that this study received funding from AstraZeneca Pharmaceutical; the company, however, had no role in its conception, execution or write up.
SD has served on advisory panels for Abbott, AstraZeneca, Boehringer Ingelheim, Eli Lilly and Co., GlaxoSmithKline, Merck & Co., Novartis Pharmaceuticals, Novo Nordisk, Sanofi, Laboratoires Servier, and Takeda Pharmaceuticals and been given research support from AstraZeneca, Boehringer Ingelheim, Merck & Co., and Novartis Pharmaceuticals. RE is an employee of and holds stock in AstraZeneca. EF has participated in scientific advisory boards for Boehringer Ingelheim, Eli Lilly, and Sanofi; has performed ad hoc consulting for Janssen, AstraZeneca, Mitsubishi Tanabe; has participated in occasional speaking engagements for AstraZeneca, Novo Nordisk, Sanofi, Mitsubishi Tanabe, Eli Lilly, Boehringer Ingelheim, Merck Sharp & Dohme; and has received research grant support from Boehringer Ingelheim and AstraZeneca.
The remaining authors declare that the research was conducted in the absence of any commercial or financial relationships that could be construed as a potential conflict of interest.
We thank Simona Baldi for assisting in the lab work.
NAA, N-acetylaspartate; T2DM, type 2 diabetes; IGT, impaired glucose tolerance; NGT, normal glucose tolerance; RYGB, Roux-en-Y Gastric Bypass; FPG, Fasting plasma glucose; MRS, magnetic resonance spectroscopy; BBB, blood-brain barrier; GLP-1RAs, GLP-1 receptor agonists/analogs; Dapa+Plb, dapagliflozin + placebo; EQW, exenatide once weekly; EQW+Dapa, exenatide-dapagliflozin combination.
1. Klein JP, Waxman SG. The brain in diabetes: molecular changes in neurons and their implications for end-organ damage. Lancet Neurol. (2003) 2:548–54. doi: 10.1016/S1474-4422(03)00503-9
2. Biessels GJ, Staekenborg S, Brunner E, Brayne C, Scheltens P. Risk of dementia in diabetes mellitus: a systematic review. Lancet Neurol. (2006) 5:64–74. doi: 10.1016/S1474-4422(05)70284-2
3. Gustafson D, Rothenberg E, Blennow K, Steen B, Skoog I. An 18-year follow-up of overweight and risk of Alzheimer disease. Arch Intern Med. (2003) 163:1524–8. doi: 10.1001/archinte.163.13.1524
4. Whitmer RA, Gunderson EP, Barrett-Connor E, Quesenberry CP Jr, Yaffe K. Obesity in middle age and future risk of dementia: a 27-year longitudinal population based study. BMJ. (2005) 330:1360. doi: 10.1136/bmj.38446.466238.E0
5. Xu WL, Atti AR, Gatz M, Pedersen NL, Johansson B, Fratiglioni L. Midlife overweight and obesity increase late-life dementia risk: a population-based twin study. Neurology. (2011) 76:1568–74. doi: 10.1212/WNL.0b013e3182190d09
6. Shah GN, Morofuji Y, Banks WA, Price TO. High glucose-induced mitochondrial respiration and reactive oxygen species in mouse cerebral pericytes is reversed by pharmacological inhibition of mitochondrial carbonic anhydrases: implications for cerebral microvascular disease in diabetes. Biochem Biophys Res Commun. (2013) 440:354–8. doi: 10.1016/j.bbrc.2013.09.086
7. Liu Y, Fiskum G, Schubert D. Generation of reactive oxygen species by the mitochondrial electron transport chain. J Neurochem. (2002) 80:780–7. doi: 10.1046/j.0022-3042.2002.00744.x
8. Huber JD, VanGilder RL, Houser KA. Streptozotocin-induced diabetes progressively increases blood-brain barrier permeability in specific brain regions in rats. Am J Physiol Heart Circ Physiol. (2006) 291:H2660–8. doi: 10.1152/ajpheart.00489.2006
9. Musen G, Jacobson AM, Bolo NR, Simonson DC, Shenton ME, McCartney RL, et al. Resting-state brain functional connectivity is altered in type 2 diabetes. Diabetes. (2012) 61:2375–9. doi: 10.2337/db11-1669
10. Climie RE, Moran C, Callisaya M, Blizzard L, Sharman JE, Venn A, et al. Abdominal obesity and brain atrophy in type 2 diabetes mellitus. PLoS ONE. (2015) 10:e0142589. doi: 10.1371/journal.pone.0142589
11. Zhang Y, Lu S, Liu C, Zhang H, Zhou X, Ni C, et al. Altered brain activation and functional connectivity in working memory related networks in patients with type 2 diabetes: an ICA- based analysis. Sci Rep. (2016) 6:23767. doi: 10.1038/srep23767
12. Tallan HH. Studies on the distribution of N-acetyl-L-aspartic acid in brain. J Biol Chem. (1957) 224:41–5.
13. Tallan HH, Moore S, Stein WH. N-Acetyl-L-aspartic acid in brain. J Biol Chem. (1956) 219:257–64.
14. Miyake M, Kakimoto Y, Sorimachi M. A gas chromatographic method for the determination of N-acetyl-L-aspartic acid, N-acetyl-aspar- tylglutamic acid and beta-citryl-L-glutamic acid and their distributions in the brain and other organs of various species of animals. J Neurochem. (1981) 36:804–10. doi: 10.1111/j.1471-4159.1981.tb01665.x
15. Kwo-On-Yuen PF, Newmark RD, Budinger TF, Kaye JA, Ball MJ, Jagust WJ. BrainN-acetyl-L-aspartic acid in Alzheimer's disease: a proton magnetic resonance spectroscopy study. Brain Res. (1994) 667: 167–74. doi: 10.1016/0006-8993(94)91494-X
16. Zhu X, Schuff N, Kornak J, Soher B, Yaffe K, Kramer JH, et al. Previous magnetic resonance (MR) spectroscopy studies of Alzheimer disease (AD) reporting reduced N-acetyl aspartate (NAA), Alzheimer disease. Assoc Disord. (2006) 20:77–85. doi: 10.1097/01.wad.0000213809.12553.fc
17. Tsai G, Coyle JT. N-acetylaspartate in neuropsychiatric disorders, Prog Neurobiol. (1995) 46:531–40 doi: 10.1016/0301-0082(95)00014-M
18. Winsberg ME, Sachs N, Tate DL, Adalsteinsson E, Spielman D, Ketter TA. Decreased dorsolateral prefrontal N-acetyl aspartate in bipolar disorder. Biol Psychiatry. (2000) 47:475–81. doi: 10.1016/S0006-3223(99)00183-3
19. Molina V, Sánchez J, Reig S, Sanz J, Benito C, Santamarta C, et al. N-acetyl-aspartate levels in the dorsolateral prefrontal cortex in the early years of schizophrenia are inversely related to disease duration. Schizophr Res. (2005) 73:209–19. doi: 10.1016/j.schres.2004.02.001
20. Teunissen CE, Iacobaeus E, Khademi M, Brundin L, Norgren N, Koel-Simmelink MJA, et al. Combination of CSF N-acetylaspartate and neurofilaments in multiple sclerosis. Neurology. (2009) 72: 1322–9. doi: 10.1212/WNL.0b013e3181a0fe3f
21. Sinha S, Ekka M, Sharma U, Raghunandan P, Pandey RM, Jagannathan NR. Assessment of 17 changes in brain metabolites in Indian patients with type-2 diabetes mellitus 18 using proton magnetic resonance spectroscopy. BMC Res Notes. (2014) 7:41. doi: 10.1186/1756-0500-7-41
22. Lin Y, Zhou J, Sha L, Li Y, Qu X, Liu L, et al. Metabolite differences in the lenticular nucleus in type 2 diabetes mellitus 22 shown by proton MR spectroscopy. AJNR Am J Neuroradiol. (2013) 34:1692–6. doi: 10.3174/ajnr.A3492
23. Duarte JM. Metabolic alterations associated to brain dysfunction in diabetes. Aging Dis. (2015) 6:304–21. doi: 10.14336/AD.2014.1104
24. Duarte JM. Metabolism in the diabetic brain neurochemical profiling by 1H magnetic resonance spectroscopy. J Diabetes Metab Disord. (2016) 3:011. doi: 10.24966/DMD-201X/100011
25. Sahin I, Alkan A, Keskin L, Cikim A, Karakas HM, Firat AK, et al. Evaluation of in vivo cerebral metabolism on proton magnetic resonance spectroscopy in patients with impaired glucose tolerance and type 2 diabetes mellitus. J Diabetes Complicat. (2008) 22:254–60. doi: 10.1016/j.jdiacomp.2007.03.007
26. John R, Moffett JR, Brian Ross B, Peethambaran Arun P, Chikkathur N, Madhavarao CN, et al. N-Acetylaspartate in the CNS: from neurodiagnostics to neurobiology. Progr Neurobiol. (2007) 81:89–131. doi: 10.1016/j.pneurobio.2006.12.003
27. Fujita T, Katsukawa H, Yodoya E, Wada M, Shimada A, Okada N, et al. Transport characteristics of N-acetyl-L-aspartate in rat astrocytes: involvement of sodium-coupled high-affinity carboxylate transporter NaC3/ NaDC3-mediated transport system. J Neurochem. (2005) 93:706–14. doi: 10.1111/j.1471-4159.2005.03067.x
28. Madhavarao CN, Moffett JR, Moore RA, Viola RE, Namboodiri MA, Jacobowitz DM. Immunohistochemical localization of aspartoacylase in the rat central nervous system. J Comp Neurol. (2004) 472:318–29. doi: 10.1002/cne.20080
29. Clark JB. N-acetyl aspartate: a marker for neuronal loss or mitochondrial dysfunction. Dev Neurosci. (1998) 20:271–6. doi: 10.1159/000017321
30. Chakraborty G, Mekala P, Yahya D, Wu G, Ledeen RW. Intraneuronal N-acetylaspartate supplies acetyl groups for myelin lipid synthesis: evidence for myelin-associated aspartoacylase. J. Neurochem. (2001) 78:736–45. doi: 10.1046/j.1471-4159.2001.00456.x
31. D'Adamo AF Jr, Yatsu FM. Acetate metabolism in the nervous system. N-acetyl-L-aspartic acid and the biosynthesis of brain lipids. J Neurochem. (1966) 13:961–5. doi: 10.1111/j.1471-4159.1966.tb10292.x
32. Kelley RI, Stamas JN. Quantification of N-acetyl-L-aspartic acid in urine by isotope dilution gas chromatography-mass spectrometry. J Inherit Metab Dis. (1992) 15:97–104. doi: 10.1007/BF01800351
33. Tortorella C, Ruggieri M, Di Monte E, Ceci E, Iaffaldano P, Direnzo V, et al. Serum and CSF N-acetyl aspartate levels differ in multiple sclerosis and neuromyelitis optica. J Neurol Neurosurg Psychiatry. (2011) 82:1355–9. doi: 10.1136/jnnp.2011.241836
34. Jakobs C, Brink HJ, Langelaar SA, Zee T, Stellaard F, Macek M, et al. Stable isotope dilution analysis of N-acetylaspartic acid in CSF, blood, urine and amniotic fluid: accurate postnatal diagnosis and the potential for prenatal diagnosis of canavan disease. J Inherit Metab Dis. (1991) 14:653–60. doi: 10.1007/BF01799929
35. Frías JP, Guja C, Hardy E, Ahmed A, Dong F, Öhman P, et al. Exenatide once weekly plus dapagliflozin once daily versus exenatide or dapagliflozin alone in patients with type 2 diabetes inadequately controlled with metformin monotherapy (DURATION-8): a 28 week, multicentre, double-blind, phase 3, randomised controlled trial. Lancet Diabetes Endocrinol. (2016) 4:1004–16. doi: 10.1016/S2213-8587(16)30267-4
36. European Medicines Agency. Guidelines on Bioanalytical Method Validation. Available online at: http://www.ema.europa.eu/docs/en_GB/document_library/Scientific_guideline/2011/08/WC500109686.pdf (accessed 1 October, 2011).
37. McClean PL, Gault VA, Harriott P, Hölscher C. Glucagon-like peptide-1 analogues enhance synaptic plasticity in the brain: a link between diabetes and Alzheimer's disease. Eur J Pharmacol. (2010) 630:158–62. doi: 10.1016/j.ejphar.2009.12.023
38. Gejl M, Gjedde A, Egefjord L, Moller A, Hansen SB, Vang K, et al. In Alzheimer's disease, 6-month treatment with GLP-1 analog prevents decline of brain glucose metabolism: randomized, placebo-controlled, double-blind clinical trial. Front Aging Neurosci. (2016) 8:108. doi: 10.3389/fnagi.2016.00108
39. Pessentheiner AR, Pelzmann HJ, Walenta E, Schweiger M, Groschner LN, Graier WF, et al. NAT8L (N-acetyltransferase 8-like) accelerates lipid turnover and increases energy expenditure in brown adipocytes. J Biol Chem. (2013) 288:36040–51. doi: 10.1074/jbc.M113.491324
40. Surendran S, Matalon R, Tyring SK. Upregulation of aspartoacylase activity in the duodenum of obesity induced diabetes mouse: implications on diabetic neuropathy. Biochem Biophys Res Commun. (2006) 345:973–5. doi: 10.1016/j.bbrc.2006.04.179
41. Ruggieri M, Tortorella C, Ceci E, Paolicelli D, Solfrizzi V, Di Bitonto G, et al. Age-related changes of serum N-acetyl-aspartate in healthy controls. Age Ageing. (2011) 40:391–5. doi: 10.1093/ageing/afr021
42. Simone IL, Ruggieri M, Tortelli R, Ceci E, D'Errico E, Leo A, et al. Serum N-acetylaspartate level in amyotrophic lateral sclerosis. Arch Neurol. (2011) 68:1308–12. doi: 10.1001/archneurol.2011.217
43. Arai H, Satake S, Kozaki K. Cognitive frailty in geriatrics. Clin Geriatr Med. (2018) 34:667–75. doi: 10.1016/j.cger.2018.06.011
44. Namboodiri AM, Peethambaran A, Mathew R, Sambhu PA, Hershfield J, Moffett JR, et al. Canavan disease and the role of N-acetylaspartate in myelin synthesis. Mol Cell Endocrinol. (2006) 252:216–23. doi: 10.1016/j.mce.2006.03.016
45. Gazdzinski S Kornak J, Weiner MW, Meyerhoff DJ. Body mass index and magnetic resonance markers of brain integrity in adults. Ann Neurol. (2008) 63:652–7. doi: 10.1002/ana.21377
46. Coplan JD, Fathy HM, Abdallah CG, Ragab SA, Kral JG, Mao X, et al. Reduced hippocampal N-acetyl-aspartate (NAA) as a biomarker for overweight. Neuroimage Clin. (2014) 4:326–35. doi: 10.1016/j.nicl.2013.12.014
47. Thaler JP, Yi CX, Schur EA, Guyenet SJ, Hwang BH, Dietrich MO, et al. Obesity is associated with hypothalamic injury in rodents and humans. J Clin Invest. (2012) 122:153–62. doi: 10.1172/JCI59660
48. Buckman LB, Thompson MM, Lippert RN, Blackwell TS, Yull FE, Ellacott KLJ. Evidence for a novel funcional role of astrocytes in the acute homeostatic response to HFD. Mol Metab. (2014) 4:58–63. doi: 10.1016/j.molmet.2014.10.001
49. Garcia-Caceres C, Fuente-Martin E, Burgos-Ramos E, Granado M, Frago LM, Barrios V, et al. Differential acute and chronic effects of leptin on hypothalamic astrocyte morphology and synaptic protein levels. Endocrinology. (2011) 152:1809–18. doi: 10.1210/en.2010-1252
50. Fuente-Martin E, Garcia-Caceres C, Granado M, De Ceballos ML, Sanchez- Garrido MA, Sarman B, et al. Leptin regulates glutamate and glucose transporters in hypothalamic astrocytes. J Clin Invest. (2012) 122:3900–13. doi: 10.1172/JCI64102
51. Dhopeshwarkar GA, Mead JF. Uptake and transport of fatty acids into the brain and the role of the blood-brain barrier system. Adv Lipid Res. (1973) 11:109–42. doi: 10.1016/B978-0-12-024911-4.50010-6
52. Miller JC, Gnaedinger JM, Rapoport SI. Utilization of plasma fatty acid in rat brain: distribution of [14C] palmitate between oxidative and synthetic pathways. J Neurochem. (1987) 49:1507–14. doi: 10.1111/j.1471-4159.1987.tb01021.x
53. Smith QR, Nagura H. Fatty acid uptake and incorporation in brain: studies with the perfusion model. J Mol Neurosci. (2001) 16:167–72. doi: 10.1385/JMN:16:2-3:167
54. Horvath TL, Sarman B, Garcia-Caceres C, Enriori PJ, Sotonyi P, Shanabrough M, et al. Synaptic input organization of the melanocortin system predicts diet- induced hypothalamic reactive gliosis and obesity. Proc Natl Acad Sci USA. (2010) 107:14875–80. doi: 10.1073/pnas.1004282107
55. Won EY, Yoon MK, Kim SW, Jung Y, Bae HW, Lee D, et al. Gender-specific metabolomic profiling of obesity in leptin-deficient ob/ob mice by 1H NMR spectroscopy. PLoS ONE. (2013) 8:e75998. doi: 10.1371/journal.pone.0075998
56. Hardy OT, Perugini RA, Nicoloro SM, Gallagher-Dorval K, Puri V, Straubhaar J, et al. Body mass index-independent inflammation in omental adipose tissue associated with insulin resistance in morbid obesity. Surg Obes Relat Dis. (2011) 7:60–7. doi: 10.1016/j.soard.2010.05.013
57. Salek RM, Maguire ML, Bentley E, Rubtsov DV, Hough T, Cheeseman M, et al. A metabolomic comparison of urinary changes in type 2 diabetes in mouse, rat, and human. Physiol Genomics. (2007) 29:99–108. doi: 10.1152/physiolgenomics.00194.2006
58. Tomlinson DR, Gardiner NJ. Glucose neurotoxicity. Nat Rev Neurosci. (2008) 9:36–45. doi: 10.1038/nrn2294
59. Jacob RJ, Fan X, Evans ML, Dziura J, Sherwin RS. Brain glucose levels are elevated in chronically hyperglycemic diabetic rats: no evidence for protective adaptation by the blood brain barrier. Metabolism. (2002) 51:1522–4. doi: 10.1053/meta.2002.36347
60. Salceda R, Vilchis C, Coffe V, Hernandez-Munoz R. Changes in the redox state in the retina and brain during the onset of diabetes in rats. Neurochem Res. (1998) 23:893–7. doi: 10.1023/A:1022467230259
61. Bahniwal M, Little JP, Klegeris A. High glucose enhances neurotoxicity and inflammatory cytokine secretion by stimulated human astrocytes. Curr Alzheimer Res. (2017) 14:731–41. doi: 10.2174/1567205014666170117104053
62. During MJ, Cao L, Zuzga DS, Francis JS, Fitzsimons HL, Jiao X, et al. Glucagon-likepeptide-1 receptor is involved in learning and neuroprotection. Nat Med. (2003) 9:1173–9. doi: 10.1038/nm919
63. Perry T, Holloway HW, Weerasuriya A, Mouton PR, Duffy K, Mattison JA, et al. Evidence of GLP-1-mediated neuroprotection in an animal model of pyridoxine-induced peripheral sensory neuropathy. Exp Neurol. (2007) 203:293–301. doi: 10.1016/j.expneurol.2006.09.028
64. Hamilton A, Holscher C. Receptors for the insulin-like peptide GLP-1 are expressed on neurons in the CNS. Neuroreport. (2009) 20:1161–6. doi: 10.1097/WNR.0b013e32832fbf14
65. Iwai T, Ito S, Tanimitsu K, Udagawa S, Oka J. Glucagon-like peptide-1 inhibits LPS-induced IL-1beta production in cultured rat astrocytes. Neurosci Res. (2006) 55:352–60. doi: 10.1016/j.neures.2006.04.008
66. Gengler S, McClean P, McCurtin R, Gault VA, Hölscher C. Val(8)GLP-1 rescues synaptic plasticity and reduces dense core plaques in APP/PS1 mice. Neurobiol Aging. (2012) 33:265–76. doi: 10.1016/j.neurobiolaging.2010.02.014
67. Wang XH, Li L, Holscher C, Pan YF, Chen XR, QI JS. Val8-glucagon-like pep- tide-1 protects against Aβ 1-40-induced impairment of hippocampal late-phase long-term potentiation and spatial learning in rats. Neuroscience. (2010) 170:1239–48. doi: 10.1016/j.neuroscience.2010.08.028
68. Han W-N, Holscher C, Yuan L, Yang W, Wang XH, Wu MN, et al. Liraglutide protects against amyloid-β protein-induced impairment of spatial learning and memory in rats. Neurobiol Aging. (2012) 34:576-88. doi: 10.1016/j.neurobiolaging.2012.04.009
69. Perry T, Haughey NJ, Mattson MP, Egan JM, Greig NH. Protection and reversal of excitotoxic neuronal damage by glucagon-like peptide-1 and exendin-4. J Pharmacol Exp Ther. (2002) 302:881–8. doi: 10.1124/jpet.102.037481
70. Perry T, Lahiri DK, Sambamurti K, Chen D, Mattson MP, Egan JM, et al. Glucagon-like peptide-1 decreases endogenous amyloid-beta peptide (Abeta) levels and protects hippocampal neurons from death induced by Abeta and iron. J Neurosci Res. (2003) 72:603–12. doi: 10.1002/jnr.10611
Keywords: N-acetylaspartate, neuronal function, type 2 diabetes, obesity, dapagliflozin, exenatide, bariatric surgery, glucose metabolism
Citation: Daniele G, Campi B, Saba A, Codini S, Ciccarone A, Giusti L, Del Prato S, Esterline RL and Ferrannini E (2020) Plasma N-Acetylaspartate Is Related to Age, Obesity, and Glucose Metabolism: Effects of Antidiabetic Treatment and Bariatric Surgery. Front. Endocrinol. 11:216. doi: 10.3389/fendo.2020.00216
Received: 07 November 2019; Accepted: 25 March 2020;
Published: 17 April 2020.
Edited by:
Alexander Miras, Imperial College London, United KingdomReviewed by:
Thomas Alexander Lutz, University of Zurich, SwitzerlandCopyright © 2020 Daniele, Campi, Saba, Codini, Ciccarone, Giusti, Del Prato, Esterline and Ferrannini. This is an open-access article distributed under the terms of the Creative Commons Attribution License (CC BY). The use, distribution or reproduction in other forums is permitted, provided the original author(s) and the copyright owner(s) are credited and that the original publication in this journal is cited, in accordance with accepted academic practice. No use, distribution or reproduction is permitted which does not comply with these terms.
*Correspondence: Ele Ferrannini, ZmVycmFubmlAaWZjLmNuci5pdA==
Disclaimer: All claims expressed in this article are solely those of the authors and do not necessarily represent those of their affiliated organizations, or those of the publisher, the editors and the reviewers. Any product that may be evaluated in this article or claim that may be made by its manufacturer is not guaranteed or endorsed by the publisher.
Research integrity at Frontiers
Learn more about the work of our research integrity team to safeguard the quality of each article we publish.