 Abigail Livny1,2
 Michal Schnaider Beeri1,3,4
 Anthony Heymann5,6
 James Schmeidler3
 Erin Moshier3Ruth Tzukran1Galia Tsarfaty2,7
 Derek Leroith8Rachel Preiss6
 Laili Soleimani3
 Elizabeth Guerrero-Berroa3
 Jeremy M. Silverman3
 Barbara Bendlin9
 Andrew Levy10
 Ramit Ravona-Springer1,7,11*
- 1The Joseph Sagol Neuroscience Center, Sheba Medical Center, Ramat Gan, Israel
- 2Department of Diagnostic Imaging, Sheba Medical Center affiliated to Tel Aviv University, Tel Aviv, Israel
- 3The Department of Psychiatry, Icahn School of Medicine at Mount Sinai, New York, NY, United States
- 4Interdisciplinary Center, Baruch Ivcher School of Psychology, Herzliya, Israel
- 5Department of Family Medicine, Tel Aviv University, Tel Aviv, Israel
- 6Maccabi Health Services, Tel Aviv, Israel
- 7Sackler Faculty of Medicine, Tel Aviv University, Tel Aviv, Israel
- 8Department of Medicine, Icahn School of Medicine at Mount Sinai, New York, NY, United States
- 9Geriatric Research Education and Clinical Center, William S. Middleton Memorial Veterans Hospital, Madison, WI, United States
- 10Rambam Medical Center, Technion Institute of Technology, Haifa, Israel
- 11Psychiatric Division, Sheba Medical Center, Ramat Gan, Israel
Aim: Depression is highly prevalent in type 2 diabetes and is associated with lower adherence to medical treatments, worse glycemic control, and increased risk for diabetes-related complications. The mechanisms underlying depression in type 2 diabetes are unclear. The haptoglobin (Hp) genotype is associated with type 2 diabetes related complications including increased risk for cerebrovascular pathology and worse cognitive performance. Its relationship with depression is unknown. We investigated the role of Hp genotype on the association of depression with brain and white matter hyperintensities (WMH) volumes.
Methods: Depressive symptoms (measured with the 15-item Geriatric Depression Scale), brain MRI, and Hp genotypes, were examined in elderly subjects with type 2 diabetes [29 (13.8%) Hp 1–1 carriers and 181 (86.2%) non-carriers]. The interaction of Hp genotype with number of depressive symptoms on regional brain measures was assessed using regression analyses.
Results: The significant interactions were such that in Hp 1–1 carriers but not in non-carriers, number of depressive symptoms was associated with overall frontal cortex (p = 0.01) and WMH (p = 0.04) volumes but not with middle temporal gyrus volume (p = 0.43).
Conclusions: These results suggest that subjects with type 2 diabetes carrying the Hp 1–1 genotype may have higher susceptibility to depression in the context of white matter damage and frontal lobe atrophy. The mechanisms underlying depression in diabetes may differ by Hp genotype.
Introduction
Depressive syndromes and symptoms, especially at sub-syndromal levels, are very common in old age (>65), reaching prevalence rates of 8–14% for minor depression (1), and 27% for depressive symptoms (2). Even in the absence of major depression, depressive symptoms in the elderly are associated with compromised aging, as reflected in poorer functional capacity and quality of life (3), and with increased morbidity and mortality (4). Depressive symptoms carry a poor prognosis, with lower response rates to antidepressant medications and tendency for recurrence, chronicity (4), and exacerbation (4). The risk for depression is doubled in the presence of type 2 diabetes [6], with a prevalence of 22–33% in elderly with diabetes (5), and is associated with lower adherence to medical treatments, worse glycemic control, and increased risk for diabetes-related complications (6). Development of better treatment and prevention strategies for depression in old age in the presence of diabetes requires better understanding of the underlying mechanisms.
Several mechanisms have been suggested for the association of depression and diabetes, including structural brain changes such as cerebral atrophy and cerebrovascular disease, which have been widely demonstrated in diabetes (7, 8).
Hp is an acute-phase protein, which binds to free hemoglobin and acts as an antioxidant (9). Two classes of alleles exist in humans: Hp 1 and Hp 2, yielding three genotypes (Hp 1–1, 2–1, and 2–2). Difference between these allelic protein products in structure and function are clinically relevant primarily to patients with diabetes, and less so to non-diabetic subjects (9). The Hp 2 allele is associated with increased risk for peripheral cardiovascular complication in diabetes (9), while the Hp 1 allele has been associated with increased risk for cerebrovascular morbidity (10), worse cognitive performance (11) and higher susceptibility of the hippocampus to the insults of poor glycemic control (12).
Previous studies have demonstrated brain volume abnormalities in subjects with depression and diabetes, specifically in the prefrontal cortex (13). Additionally, cerebrovascular abnormalities have been implicated as causal factors for depression in diabetes (14). There is scarce knowledge on role of these brain regions/abnormalities in depressive symptoms, which comprise the most prevalent clinical presentation of depression in the elderly (2)—rather than major depression—and specifically in diabetes. We have recently shown differential associations of the Hp genotype with hippocampal volume in diabetic elderly (12), but its contribution to the associations of depressive symptoms with brain volume is yet to be elucidated. Such differentiation may be of critical importance, as the efficacy of some interventions aimed at prevention of other diabetes-related complications (e.g., Vitamin E) differs by Hp genotype (15).
The present study aimed to assess whether the relationship of depressive symptoms with structural brain damage differs by Hp genotype in a cohort of elderly subjects with type 2 diabetes participating in the Israel Diabetes and Cognitive Decline (IDCD) study. Our study focused on the frontal lobe and on white matter hyperintensities (WMH) based on previous evidence consistently indicating structural and functional abnormalities of the frontal lobe region in depression (16), and on the role of vascular abnormalities in the form of WMH, specifically in old age depression (8).
Methods
The IDCD is a collaboration of the Icahn School of Medicine at Mount Sinai, NY, the Sheba Medical Center, Israel, and the Maccabi Health Services (MHS), Israel. The study was approved by all three IRB committees.
Subjects
Participants are elderly (≥65 years old) with type 2 diabetes, who are engaged in the IDCD study, a longitudinal investigation assessing the relationship of long-term type 2 diabetes characteristics and cognitive decline. The study was initiated in 2009. The present results are based on baseline data only; longitudinal follow ups are ongoing. The IDCD methods have been described in detail elsewhere (17). Briefly, IDCD participants were selected randomly from the ~11,000 elderly with diabetes listed in the diabetes registry of the MHS, the second largest HMO in Israel. The MHS diabetes registry was established in 1998 to facilitate disease management and to improve treatment, and has collected detailed information on laboratory, medication, and diagnoses. Entry criteria to the registry are any of the following: (1) HbA1c > 55.7 mmol/mol (7.25%), (2) Glucose >200 mg/dl on two exams more than three months apart, (3) purchase of anti-diabetic medication twice within 3 months supported by a HbA1c > 47.4 mmol/mol (6.5%) or Glucose > 125 mg/dl within half a year, (4) diagnosis of Type 2 diabetes (ICD9 code) by a general practitioner, internist, endocrinologist, ophthalmologist, or diabetes advisor, supported by a HbA1c > 47.4 mmol/mol (6.5%), or Glucose > 125 mg/dl within half a year.
Subjects are eligible for the IDCD study if they are: listed in the MHS diabetes registry, live in the central area of Israel, diagnosed as suffering from type 2 diabetes, are ≥65 years of age, identified as cognitively normal at baseline (based on a multidisciplinary weekly consensus conference), do not suffer from major medical, psychiatric, or neurological conditions that affect cognitive performance, have ≥3 HbA1c measurements in the diabetes registry, speak Hebrew fluently and have an informant.
Subject recruitment process has been described in detail previously (17). In short, the MHS team performs a thorough screening of the Diabetes Registry in order to identify potential subjects, excluding anyone with an ICD code for dementia/dementia subtypes, treatment with prescribed cholinesterase inhibitors, or with a major psychiatric or neurological condition (e.g., schizophrenia or Parkinson's disease) that could affect cognitive performance. After random selection of subjects, letters are sent by MHS to the primary care physicians, asking for permission to contact each patient regarding the study. If the doctors agree, letters are sent to the subjects briefly describing the study and saying that they will be contacted by phone in the following 2 week period. Then the MHS team calls the subjects and asks for their participation after determining that they are fluent in Hebrew and have a family member or caregiver who is willing to be an informant for the study. Subjects who are willing to participate in the study are assessed at their residence (or come to the Sheba Medical Center memory clinic, according to their preference) in two phases. First they are visited by a study physician who, after each subject has signed the informed consent form, performs medical, neurological, and geriatric assessments and draws blood for inflammatory markers (Il-6, CRP), Haptoglobin and APOE genotypes. In the second phase (optimally 2 weeks after the physician's visit), the subjects are visited by a neuropsychologist who administers a cognitive battery (described below), and questionnaires to the subject and informant for cognitive and functional impairment and for depression and behavioral disturbances characteristic of dementia. All subjects' cognitive data are discussed by a multidisciplinary consensus conference team in order to define the subjects' cognitive status (as cognitively normal, MCI, or dementia and their subtypes). If the subject is cognitively normal at baseline, the IDCD study has follow up interviews at 18 months intervals. Subjects, who are diagnosed as MCI at baseline, are not included in the study, however, subjects who convert from cognitive normal status to MCI during follow up, continue their participation in the study until conversion to dementia.
Depressive Symptoms Assessment
The assessment of depression was performed using the 15- item version of the Geriatric Depression Scale (GDS) (18), a self-report scale designed to be simple to administer and not to require the skills of a trained interviewer. This questionnaire is suitable for large scale studies of depression and advantageous in the context of elderly with diabetes since it has little focus on somatic symptoms which could be confounded by diabetes symptoms such as neuropathy (18).
Cognitive Assessment
A thorough neuropsychological battery that characterizes the breadth of cognitive functions is administered by experienced and certified interviewers which are blind to the diabetes related data. This battery covers four domains of cognitive functions: (1) Memory [Alzheimer's Disease Assessment Scale [ADAS] Word List Immediate Recall, Delayed Recall, and Recognition; (19)], (2) Attention/working memory [Diamond Cancellation, Digit Span forward, and backward (20)], (3) Executive functions [Trails Making Test A and B (21), Digit Symbol Substitution Test (20)], and (4) Semantic categorization [Similarities (20), Category Fluency (22)]. Composite measures of the four cognitive domains are calculated at baseline by converting each test score to a z-score and then summing the z-scores. An overall measure summing the scores was computed (overall cognitive score).
MRI Procedures
All IDCD participants were offered to undergo a brain magnetic resonance imaging (MRI) scan. Those who agreed and did not have contraindications (e.g., claustrophobia, carriers of metallic grafts or pacemakers) were invited, by order of their expression of consent, to the Sheba Medical Center, diagnostic imaging department. Scans were performed using a 3 Tesla scanner (GE, Signa HDxt, v16VO2). High-resolution (1 mm3) images were acquired using a 3D inversion recovery prepared spoiled gradient-echo (FSPGR) T1-weighted sequence (TR/TE = 7.3/2.7s, 20o flip angle, TI 450 ms). The T1 weighted anatomical images for each subject were processed using the Voxel Based Morphometry [VBM (15)] toolbox, developed by Gaser (http://www.fil.ion.ucl.ac.uk/spm/ext/#VBMtools) and implemented in Statistical Parametric Mapping (SPM8) software. This procedure included automated iterative skull stripping, segmentation of the images into gray matter (GM), white matter (WM), and cerebrospinal fluid probability images, and spatial normalization of the GM images to a customized GM template in standard MNI (Montreal Neurological Institute) space. In order to optimize signal to noise, the GM maps were smoothed using an 8 mm Gaussian kernel. GM probability maps were thresholded at 0.1 to minimize inclusion of incorrect tissue types. Total intracranial volume (TICV) was calculated using the segmented and thresholded images (TICV = GM+WM+CSF). Based on our a-priori hypothesis, regions of interest (ROI) approach was used centered on the frontal cortex, specifically, the superior, middle, and inferior frontal gyri and the middle temporal gyrus identified by using the “Human Automated Anatomical Labeling (AAL) atlas” within the Wake Forest University PickAtlas (http://www.rad.wfubmc.edu/fmri) and extracted using the MarsBaR ROI toolbox as implemented in SPM8.
WMH Segmentation
We used SPM8 software (www.fil.ion.ucl.ac.uk/spm) and its VBM8 Lesion Segmentation Toolbox (LST), following previously described methods (23). The LST automated method for quantifying white matter damage is reliable and has been shown to have a high degree of agreement with manual delineation of WMH in fluid-attenuated inversion recovery images (23). The default LST settings were used with the exception of κ (k), a value indicating the threshold for the initial lesion mask. Visual inspection of the probability maps across participants by using various k values, to maximize sensitivity while reducing false positive results, indicated that a k = 0.15 was the optimal value for our sample images. This procedure generated one binary lesion image per participant from which a total lesion volume (in milliliters) map was calculated.
Hp Genotyping
Blood samples for Hp typing were taken during the physician assessment. Bloods were drawn into an EDTA-containing vacutainer tube and immediately placed in an ice box until handling at Sheba Medical Center. Bloods were centrifuged and serum was stored at −70°C Within up to 6 h from phlebotomy (as recommended), until determination. Hp typing was performed on stored plasma samples by polyacrylamide gel electrophoresis as previously described (24).
IDCD participants included in the present analysis are those with full data on depression, cognition, brain imaging, diabetes, and Hp genotype-related data (Figure 1). This report is based on data collected at IDCD baseline. Subjects' diabetes- related data since 1998 or since entry into the diabetes registry (if after 1998) was available to us through MHS.
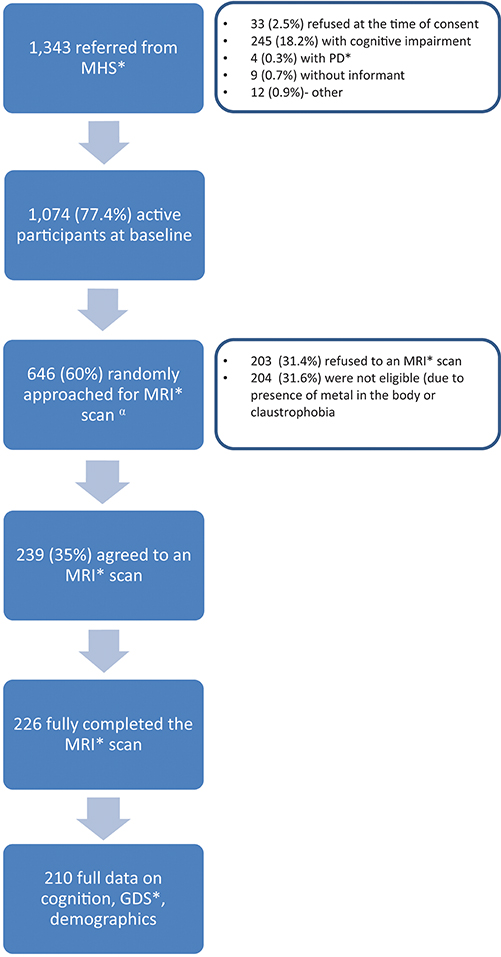
Figure 1. Study flow chart. MHS, Maccabi Health Services; PD, Parkinson's disease; MRI, Magnetic Resonance Imaging; GDS, Geriatric Depression Scale.
Statistical Analysis
Differences between Hp genotypes on the predictors and brain outcomes were evaluated by Student's t-test, and Pearson's chi-square for categorical variables. We compared the genotypes on the relationships of each brain measure with the number of depressive symptoms. Based on similar relationships between Hp 1–1 carriers and the two groups of non-Hp 1–1 (i.e., Hp 1–2 and Hp 2–2) in cognitive outcomes (11), and in order to minimize multiple comparisons, we compared Hp 1–1 carriers to all Hp 1–1 non-carriers. Analysis of the interaction of Hp genotype with number of depressive symptoms in a regression analysis for a brain measure requires three predictors- Hp genotype, the number of depressive symptoms and their product- and tests the product, controlling for its two variables. The regression analysis included additional covariates–age, sex, number of follow up years in the registry (a surrogate of duration of type 2 diabetes), mean level of HbA1c across all measures available in the diabetes registry for each subject, overall cognition (a summary of the z-score of all cognitive tests performed in the IDCD study) and total intracranial volume. For Hp 1–1, non-Hp 1–1, and the full sample, we described the relationship of number of depressive symptoms with brain measures using partial correlations controlling for the same covariates. A p-value of 0.05 (two sided) was used to determine statistical significance level. For analysis, we used SPSS 22.0 (IBM Corp, Armonk, NY, USA).
Results
Two hundred and ten subjects with full data on cognition, GDS score, demographic variables and MRI were included in the analysis, 29 with Hp 1–1 (13.8%) and 181 with non-Hp 1–1 genotype. Subjects' mean age was 70.47 (SD = 4.11), 41% were female, with mean duration of follow up in the diabetes registry of 9.46 years (SD = 4.48). Subjects with Hp 1–1 genotype did not differ significantly from non-Hp 1–1 in demographic or cognitive variables, GDS score or in any of the frontal lobe measures, middle temporal gyrus, or white matter hyperintensities volume (see Table 1).
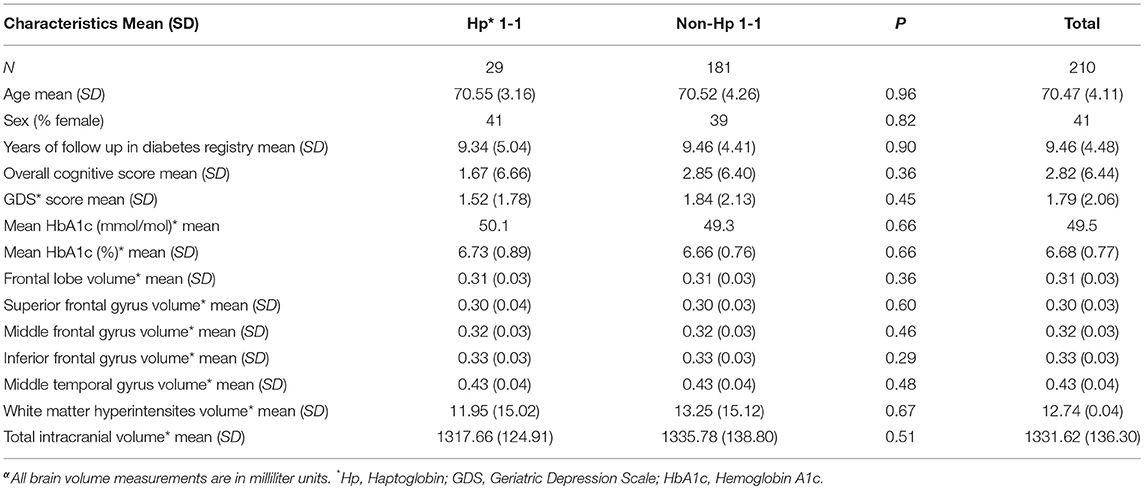
Table 1. Sample characteristicsα.
Overall, for the entire sample, there were no correlations between number of depressive symptoms and regional brain or WMH volume (Table 2). The interaction of Hp genotype with depressive symptoms was significant for overall frontal cortex volume (p = 0.01), specifically, the superior frontal gyrus (p = 0.01); and approached significance for middle frontal gyrus (p = 0.09; see Table 2). There was no interaction for the inferior frontal gyrus (p = 0.61) nor with the middle temporal gyrus (p = 0.43). To describe the direction of the interactions, we performed partial correlations stratifying for Hp genotype (Hp 1–1 vs. non-Hp 1–1) using the same covariates as in the main analyses. As shown in Table 2, the partial correlation of more depressive symptoms with lower total frontal lobe (r = −0.35) and superior frontal gyrus (r = −0.42) were substantially stronger for Hp 1–1 carriers than non-carriers. The interaction for white matter hyperintensities volume was also significant (p = 0.04) such that depressive symptoms were associated with higher volume of white matter hyperintensities in Hp 1–1 (r = 0.45; p = 0.03) but not in Hp 1–1 non-carriers (r = −0.04; p = 0.64).
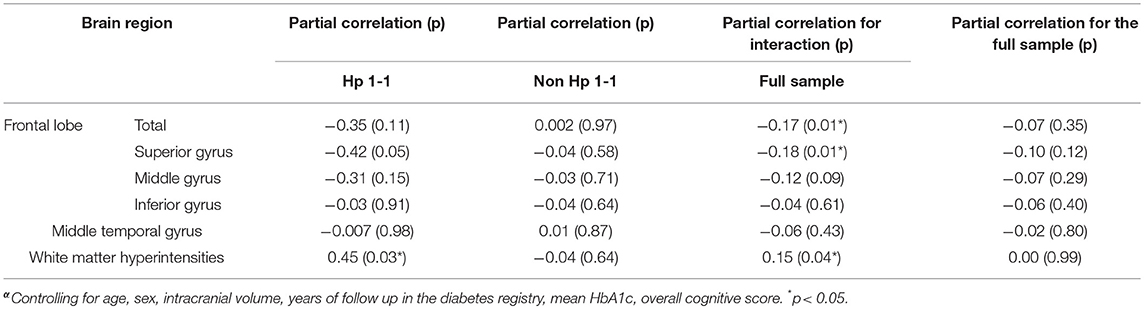
Table 2. Interaction of Hp genotype with depressive symptoms in brain volumesα.
Since the volume of white matter hyperintensities may be related to smaller frontal lobe volumes (25), we assessed in secondary analyses whether white matter hyperintensities volume mediates the interaction analyses for frontal lobe and superior frontal gyrus, the two frontal lobe measures for which interaction of depression symptoms with Hp genotype was significant, by including it as a covariate. Results were essentially unaffected by the inclusion of white matter hyperintensities (partial correlation for interaction on total frontal lobe r = −0.16; p = 0.03, and on superior frontal gyrus r = −0.16; p = 0.02). Similarly, additional secondary analyses added a cardiovascular risk composite to the primary model, which was the first principal component of a factor analysis consisting of systolic and diastolic blood pressure, LDL and HDL, cholesterol, and creatinine (26); or levels of inflammatory markers (CRP and Il-6). Results were mildly attenuated, and remained significant for the interaction of Hp genotype and depressive symptoms on total frontal lobe volume and superior frontal gyrus and trend level for the interaction on white matter hyperintensities volume (Supplementary Table 1).
Discussion
The present study demonstrates that in elderly patients with T2D, depressive symptoms are modestly associated with larger volume of white matter hyperintensities, and with reduced frontal lobe volume, specifically, superior frontal gyrus, in Hp 1–1 genotype carriers but not in non-carriers. A similar pattern, though not reaching statistical significance, was observed for the middle frontal gyrus. Analysis was adjusted for potential demographic and diabetes-related factors. Adding inflammatory, and cardiovascular potential confounders mildly attenuated the results. These findings may suggest that patients with diabetes who are Hp 1–1 carriers are more susceptible to depression in the context of white matter damage and frontal lobe atrophy, and that the mechanisms underlying depressive symptoms in diabetes may differ by Hp genotype.
Consistent with our results, Maes et al. have shown an association of carrying the Hp 1 allele and hyperhaptoglobinemia with major depression in young to middle aged adults (27). The diabetes status of the sample was not specified, suggesting that the results reflected primarily non-diabetic participants. Our study adds new evidence in several aspects as the study examined the inter-relationships of Hp with number of depressive symptoms (rather than major depression) on brain abnormalities, suggesting potential underlying mechanisms for these relationships. In addition, all our participants were elderly diabetics for whom depressive symptoms are highly prevalent (1, 2), with substantial implications on health, functional capacity, and quality of life (3, 4).
Hp 1–1 genotype has been found to be associated with greater risk for white matter hyperintensities (10), of which the volume is a biomarker for cerebrovascular pathology (28). White matter hyperintensities, in turn, have been demonstrated to be strongly associated with depression, especially in late life (8, 29), supporting the vascular depression hypothesis (8). In the present study, the number of depression symptoms was associated with WMH volume in subjects with Hp 1–1 but not in other Hp genotypes, suggesting that a common mechanism may underlie larger WMH volume and more depressive symptoms in Hp 1–1 carriers. Such a mechanism may be linked to inflammation, which is associated with WMH (30), Hp genotype (31), and depression (32). Since the IDCD study collects CRP and Il-6, we repeated the analysis controlling for these inflammatory factors, and the associations were mildly attenuated, suggesting that inflammation may contribute to the relationship of WMH with depression in T2D subjects carrying the Hp1–1 genotype, but, that additional mechanisms are probably involved. Alternatively, these peripheral markers of inflammation may not fully reflect brain inflammatory processes.
Abnormalities in structure and function of the frontal lobes have been shown to contribute to depression. The dorsolateral prefrontal cortex, formed mainly by the superior and middle frontal gyri, has been shown to be involved in prevention of depression by refuting negative emotions through reappraisal and suppression strategies, and to play a key role in the maintenance of spontaneous optimistic self-evaluative tendencies (16). Accordingly, hypoacitivity of the dorsolateral prefrontal cortex has been demonstrated in depression (16). Elderly subjects with depression had smaller volume of the orbitofrontal cortex compared to non-depressed elderly (33). In the present study, although subjects with Hp 1–1 genotype did not differ in brain volumetrics or in number of depression symptoms, the number of depression symptoms was associated with reduced frontal—specifically superior frontal—gyrus volume. The presence of this relationship only in Hp 1–1 may be attributed to their higher susceptibility to cerebrovascular pathology (34) which in turn, has been associated with brain atrophy, especially in the frontal lobes (25). In the present study, in order to assess whether cerebrovascular pathology mediates the inter-relationships of Hp genotype, depressive symptoms, and frontal lobe volume, we further adjusted the analysis of interaction of Hp genotype with number of depression symptoms on total frontal lobe and superior frontal gyrus volumes for white matter hyperintensities volume, but the results were only mildly attenuated. The vulnerability of subjects with Hp 1–1 genotype to depression symptoms in the presence of frontal lobe atrophy may be attributed to other mechanisms such as compromised endothelial function found in Hp 1–1 carriers (35). Endothelial dysfunction may precede structural vascular changes (36) and lead to brain atrophy (37). It has also been shown to be a risk factor for depression, especially in patients with diabetes (38). This explanation is supported by lower counts of endothelial progenitor cells (involved in endothelial repair) demonstrated in subjects with lacunar strokes carrying the Hp 1–1 genotype (35).
Study strengths include the random selection of participants from the IDCD study, a cohort representative of elderly with type 2 diabetes in Israel; the highly valid diagnosis of type 2 diabetes; the availability of demographic, long-term diabetes-related, genetic and brain imaging variables; and verification of cognitive function, a major confounder for depressive symptoms (39)
The study is limited by its cross-sectional design, precluding identifying the directionality of the relationships found—whether Hp 1–1 carriers are more susceptible for depression in the context of lower frontal lobe volume or higher volume of white matter hyperintensities, or, alternatively, depressive symptoms lead to more brain damage in Hp 1–1 carriers but not in non-carriers. The definition of depression-related outcome in the study is based on the GDS score rather than clinical diagnosis. Although the results are robust and significant, the relatively modest sample size of Hp 1–1 carriers requiring confirmation in future studies. Measurement of endothelial function was not available, preventing evaluation of the contribution of functional cerebrovascular pathology to brain volume and to depression symptoms in different Hp genotypes.
In conclusion: the present study demonstrates interactions between Hp genotype and symptoms of depression on regional brain volumes in elderly non-demented subjects with type 2 diabetes—higher number of depressive symptoms were associated with lower frontal lobe volume and higher volume of WMH in Hp 1–1 carriers but not in non-carriers. The longitudinal phase of the IDCD will elucidate the directionality of the relationships found and will serve as basis for future studies aimed at unraveling the mechanisms involved, in diabetics, and in non-diabetics.
Ethics Statement
This study was carried out in accordance with the recommendations of the Sheba Medical Center, Maccabi Health Services and the Mount Sinai School of Medicine IRB committees. All subjects gave written informed consent in accordance with the Declaration of Helsinki.
Author Contributions
ALe and AL: acquisition, analysis and interpretation of data, critical revision of article, and approval of final version. MS, AH, and RR-S: conception and design of study, data analysis and interpretation, critical revision of article, and approval of final version. JS and EM: analysis and interpretation of data, critical revision of article, and approval of final version. RT, GT, and RP: acquisition of data, critical revision of article, and approval of final version. DL: critical revision of article and approval of final version. LS, EG-B, JMS, and BB: interpretation of data, critical revision of article, and approval of final version.
Funding
This study was supported by the National Institute on Aging (grants R01 AG 061093 and AG051545 to MB, P50 AG05138 to Mary Sano), and the Leroy Schecter Foundation Award and the Bader Foundation (to MB).
Conflict of Interest Statement
The authors declare that the research was conducted in the absence of any commercial or financial relationships that could be construed as a potential conflict of interest.
Supplementary Material
The Supplementary Material for this article can be found online at: https://www.frontiersin.org/articles/10.3389/fendo.2019.00068/full#supplementary-material
References
1. Polyakova M, Sonnabend N, Sander C, Mergl R, Schroeter ML, Schroeder J, et al. Prevalence of minor depression in elderly persons with and without mild cognitive impairment: a systematic review. J Affect Disord. (2014) 152–154:28–38. doi: 10.1016/j.jad.2013.09.016
2. Blazer D, Hughes DC, George LK. The epidemiology of depression in an elderly community population. Gerontologist (1987) 27:281–7. doi: 10.1093/geront/27.3.281
3. Jeste DV, Savla GN, Thompson WK, Vahia IV, Glorioso DK, Martin AS, et al. Association between older age and more successful aging: critical role of resilience and depression. Am J Psychiatry (2013) 170:188–96. doi: 10.1176/appi.ajp.2012.12030386
4. Beekman AT, Geerlings SW, Deeg DJ, Smit JH, Schoevers RS, De Beurs E, et al. The natural history of late-life depression: a 6-year prospective study in the community. Arch Gen Psychiatry (2002) 59:605–11. doi: 10.1001/archpsyc.59.7.605
5. Kirkman MS, Briscoe VJ, Clark N, Florez H, Haas LB, Halter JB, et al. Diabetes in older adults. Diabetes Care (2012) 35:2650–64. doi: 10.2337/dc12-1801
6. Anderson RJ, Freedland KE, Clouse RE, Lustman PJ. The prevalence of comorbid depression in adults with diabetes: a meta-analysis. Diabetes Care (2001) 24:1069–78. doi: 10.2337/diacare.24.6.1069
7. Van Harten B, De Leeuw FE, Weinstein HC, Scheltens P, Biessels GJ. Brain imaging in patients with diabetes: a systematic review. Diabetes Care (2006) 29:2539–48. doi: 10.2337/dc06-1637
8. Taylor WD, Aizenstein HJ, Alexopoulos GS. The vascular depression hypothesis: mechanisms linking vascular disease with depression. Mol Psychiatry (2013) 18:963–74. doi: 10.1038/mp.2013.20
9. Langlois MR, Delanghe JR. Biological and clinical significance of haptoglobin polymorphism in humans. Clin Chem. (1996) 42:1589–600.
10. Costacou T, Rosano C, Aizenstein H, Mettenburg JM, Nunley K, Ferrell RE, et al. The haptoglobin 1 allele correlates with white matter hyperintensities in middle-aged adults with type 1 diabetes. Diabetes (2015) 64:654–9. doi: 10.2337/db14-0723
11. Ravona-Springer R, Heymann A, Schmeidler J, Guerrero-Berroa E, Sano M, Preiss R, et al. Haptoglobin 1-1 genotype is associated with poorer cognitive functioning in type 2 diabetic elderly. Diabetes Care (2013) 36:3139–45. doi: 10.2337/dc12-2250
12. Livny A, Ravona-Springer R, Heymann A, Priess R, Kushnir T, Tsarfaty G, et al. The haptoglobin 1-1 genotype modulates the association of glycemic control with hippocampal volume in elderly with type 2 diabetes. Diabetes (2017) 66:2927–32. doi: 10.2337/db16-0987
13. Ajilore O, Narr K, Rosenthal J, Pham D, Hamilton L, Watari K, et al. Regional cortical gray matter thickness differences associated with type 2 diabetes and major depression. Psychiatry Res (2010) 184:63–70. doi: 10.1016/j.pscychresns.2010.07.003
14. Bruce DG, Casey G, Davis WA, Starkstein SE, Clarnette RC, Foster JK, et al. Vascular depression in older people with diabetes. Diabetologia (2006) 49:2828–36. doi: 10.1007/s00125-006-0478-y
15. Vardi M, Blum S, Levy AP. Haptoglobin genotype and cardiovascular outcomes in diabetes mellitus - natural history of the disease and the effect of vitamin E treatment. Meta-analysis of the medical literature Eur J Intern Med. (2012) 23:628–32. doi: 10.1016/j.ejim.2012.04.009
16. Wu J, Dong D, Jackson T, Wang Y, Huang J, Chen H. The neural correlates of optimistic and depressive tendencies of self-evaluations and resting-state default mode network. Front Hum Neurosci. (2015) 9:618. doi: 10.3389/fnhum.2015.00618
17. Beeri MS, Ravona-Springer R, Moshier E, Schmeidler J, Godbold J, Karpati T, et al. The israel diabetes and cognitive decline (IDCD) study: design and baseline characteristics. Alzheimers Dement. (2014) 10:769–78. doi: 10.1016/j.jalz.2014.06.002
18. Sheikh JL, Yesavage JA. Geriatric Depression Scale (GDS): a recent evidence and development of a shorter version. Clin Gerontol. (1986) 5:165–73. doi: 10.1300/J018v05n01_09
19. Welsh KA, Butters N, Mohs RC, Beekly D, Edland S, Fillenbaum G, et al. The consortium to establish a registry for alzheimer's disease (CERAD). Part V A normative study of the neuropsychological battery. Neurology (1994) 44:609–14. doi: 10.1212/WNL.44.4.609
20. Wechsler D. Wechsler Memory Scale-Revised Manual. San Antonio, TX: The Psychological Corporation (1987).
21. Reitan RM. The relation of the trail making test to organic brain damage. J Consult Psychol. (1955) 19:393–4. doi: 10.1037/h0044509
22. Fernaeus SE, Almkvist O. Word production: dissociation of two retrieval modes of semantic memory across time. J Clin Exp Neuropsychol. (1998) 20:137–43. doi: 10.1076/jcen.20.2.137.1170
23. Schmidt P, Gaser C, Arsic M, Buck D, Forschler A, Berthele A, et al. An automated tool for detection of FLAIR-hyperintense white-matter lesions in Multiple Sclerosis. Neuroimage (2012) 59:3774–83. doi: 10.1016/j.neuroimage.2011.11.032
24. Koch W, Latz W, Eichinger M, Roguin A, Levy AP, Schomig A, et al. Genotyping of the common haptoglobin Hp 1/2 polymorphism based on PCR. Clin Chem. (2002) 48:1377–82.
25. Fein G, Di Sclafani V, Tanabe J, Cardenas V, Weiner MW, Jagust WJ, et al. Hippocampal and cortical atrophy predict dementia in subcortical ischemic vascular disease. Neurology (2000) 55:1626–35. doi: 10.1212/WNL.55.11.1626
26. Livny A, Ravona-Springer R, Heymann A, Priess R, Kushnir T, Tsarfaty G, et al. Long-term variability in glycemic control is associated with white matter hyperintensities in APOE4 genotype carriers with type 2 diabetes. Diabetes Care (2016) 39:1056–9. doi: 10.2337/dc15-2331
27. Maes M, Delanghe J, Scharpe S, Meltzer HY, Cosyns P, Suy E, et al. Haptoglobin phenotypes and gene frequencies in unipolar major depression. Am J Psychiatry (1994) 151:112–6. doi: 10.1176/ajp.151.1.112
28. Oda K, Okubo Y, Ishida R, Murata Y, Ohta K, Matsuda T, et al. Regional cerebral blood flow in depressed patients with white matter magnetic resonance hyperintensity. Biol Psychiatry (2003) 53:150–6. doi: 10.1016/S0006-3223(02)01548-2
29. Aizenstein HJ, Andreescu C, Edelman KL, Cochran JL, Price J, Butters MA, et al. fMRI correlates of white matter hyperintensities in late-life depression. Am J Psychiatry (2011) 168:1075–82. doi: 10.1176/appi.ajp.2011.10060853
30. Satizabal CL, Zhu YC, Mazoyer B, Dufouil C, Tzourio C. Circulating IL-6 and CRP are associated with MRI findings in the elderly: the 3C-Dijon Study. Neurology (2012) 78:720–7. doi: 10.1212/WNL.0b013e318248e50f
31. Erdem M, Celik C, Cayci T, Ozdemir B, Kurt YG, Akgul EO, et al. Serum haptoglobin levels in patients with melancholic and nonmelancholic major depression. Prog Neuropsychopharmacol Biol Psychiatry (2011) 35:944–7. doi: 10.1016/j.pnpbp.2011.01.009
32. Dinan TG. Inflammatory markers in depression. Curr Opin Psychiatry (2009) 22:32–6. doi: 10.1097/YCO.0b013e328315a561
33. Taylor WD, Macfall JR, Payne ME, Mcquoid DR, Steffens DC, Provenzale JM, et al. Orbitofrontal cortex volume in late life depression: influence of hyperintense lesions and genetic polymorphisms. Psychol Med. (2007) 37:1763–73. doi: 10.1017/S0033291707000128
34. Costacou T, Ferrell RE, Ellis D, Orchard TJ. Haptoglobin genotype and renal function decline in type 1 diabetes. Diabetes (2009) 58:2904–9. doi: 10.2337/db09-0874
35. Rouhl RP, Van Oostenbrugge RJ, Damoiseaux JG, Debrus-Palmans LL, Theunissen RO, Knottnerus IL, et al. Haptoglobin phenotype may alter endothelial progenitor cell cluster formation in cerebral small vessel disease. Curr Neurovasc Res. (2009) 6:32–41. doi: 10.2174/156720209787466082
36. Halcox JP, Donald AE, Ellins E, Witte DR, Shipley MJ, Brunner EJ, et al. Endothelial function predicts progression of carotid intima-media thickness. Circulation (2009) 119:1005–12. doi: 10.1161/CIRCULATIONAHA.108.765701
37. Cumming TB, Brodtmann A. Can stroke cause neurodegenerative dementia? Int J Stroke (2011) 6:416–24. doi: 10.1111/j.1747-4949.2011.00666.x
38. Kheirabadi GR, Toghani F, Kousha M, Hashemi M, Maracy MR, Sharifi MR, et al. Is there any association of anxiety-depressive symptoms with vascular endothelial function or systemic inflammation? J Res Med Sci. (2013) 18:979–83.
Keywords: haptoglobin genotype, type 2 diabetes, depression, brain volume, frontal lobe, white matter hyperintensities
Citation: Livny A, Schnaider Beeri M, Heymann A, Schmeidler J, Moshier E, Tzukran R, Tsarfaty G, Leroith D, Preiss R, Soleimani L, Guerrero-Berroa E, Silverman JM, Bendlin B, Levy A and Ravona-Springer R (2019) The Association of Depressive Symptoms With Brain Volume Is Stronger Among Diabetic Elderly Carriers of the Haptoglobin 1-1 Genotype Compared to Non-carriers. Front. Endocrinol. 10:68. doi: 10.3389/fendo.2019.00068
Received: 23 October 2018; Accepted: 24 January 2019;
Published: 12 February 2019.
Edited by:
Ondřej Šeda, Charles University, CzechiaReviewed by:
Jose Mario Franco De Oliveira, Universidade Federal Fluminense, BrazilRyan Wellington Logan, University of Pittsburgh, United States
Copyright © 2019 Livny, Schnaider Beeri, Heymann, Schmeidler, Moshier, Tzukran, Tsarfaty, Leroith, Preiss, Soleimani, Guerrero-Berroa, Silverman, Bendlin, Levy and Ravona-Springer. This is an open-access article distributed under the terms of the Creative Commons Attribution License (CC BY). The use, distribution or reproduction in other forums is permitted, provided the original author(s) and the copyright owner(s) are credited and that the original publication in this journal is cited, in accordance with accepted academic practice. No use, distribution or reproduction is permitted which does not comply with these terms.
*Correspondence: Ramit Ravona-Springer, cmFtaXQucmF2b25hQHNoZWJhLmhlYWx0aC5nb3YuaWw=