 Tarryn Willmer
 Rabia Johnson1,2
 Carmen Pheiffer
95% of researchers rate our articles as excellent or good
Learn more about the work of our research integrity team to safeguard the quality of each article we publish.
Find out more
REVIEW article
Front. Endocrinol. , 04 December 2018
Sec. Clinical Diabetes
Volume 9 - 2018 | https://doi.org/10.3389/fendo.2018.00744
This article is part of the Research Topic Role of Epigenetic Modifications on Diet-Induced Metabolic Diseases View all 16 articles
Type 2 diabetes (T2D) is a leading cause of death and disability worldwide. It is a chronic metabolic disorder that develops due to an interplay of genetic, lifestyle, and environmental factors. The biological onset of the disease occurs long before clinical symptoms develop, thus the search for early diagnostic and prognostic biomarkers, which could facilitate intervention strategies to prevent or delay disease progression, has increased considerably in recent years. Epigenetic modifications represent important links between genetic, environmental and lifestyle cues and increasing evidence implicate altered epigenetic marks such as DNA methylation, the most characterized and widely studied epigenetic mechanism, in the pathogenesis of T2D. This review provides an update of the current status of DNA methylation as a biomarker for T2D. Four databases, Scopus, Pubmed, Cochrane Central, and Google Scholar were searched for studies investigating DNA methylation in blood. Thirty-seven studies were identified, and are summarized with respect to population characteristics, biological source, and method of DNA methylation quantification (global, candidate gene or genome-wide). We highlight that differential methylation of the TCF7L2, KCNQ1, ABCG1, TXNIP, PHOSPHO1, SREBF1, SLC30A8, and FTO genes in blood are reproducibly associated with T2D in different population groups. These genes should be prioritized and replicated in longitudinal studies across more populations in future studies. Finally, we discuss the limitations faced by DNA methylation studies, which include including interpatient variability, cellular heterogeneity, and lack of accounting for study confounders. These limitations and challenges must be overcome before the implementation of blood-based DNA methylation biomarkers into a clinical setting. We emphasize the need for longitudinal prospective studies to support the robustness of the current findings of this review.
Diabetes mellitus is a leading cause of death and disability worldwide, affecting 415 million people in 2017, and this figure is expected to increase to 592 million by 2035 (1, 2). Type 2 diabetes (T2D) accounts for over 90% of diabetes mellitus cases and its incidence is increasing globally in response to escalating rates of obesity and insulin resistance. Indeed, according to the World Health Organization, over 90% of patients with T2D are overweight or obese (3). T2D is a progressive, chronic disorder with a long asymptomatic phase. The early stages of disease can remain undetected for many years, during which time micro- and macro-vascular complications may occur (4, 5). Identification of individuals during the asymptomatic phase would not only permit opportunities for early interventions to prevent the development of overt diabetes, but may also lead to better management of the disease. A major area of current research has thus been to search for robust, sensitive, and readily accessible biomarkers of T2D. In this regard, a striking amount of evidence has accumulated to suggest that changes to the epigenetic landscape in insulin-responsive tissues play an important role in the pathogenesis of obesity, insulin resistance, and T2D, and if reflected in blood, may represent potential biomarker candidates (6–8).
Epigenetics is defined as heritable changes that affect gene expression without altering the underlying genomic sequence (9). These processes include DNA methylation, chromatin modifications such as histone acetylation and methylation, and non-coding RNAs that act as regulatory molecules (9). DNA methylation is the most widely studied and best characterized epigenetic mechanism, and involves the covalent addition of a methyl group to carbon C5 of cytosine nucleotides to create 5-methylcytosine (5 mC) (10). Cytosine methylation occurs in cytosine-guanine dinucleotides (CpG) sites, which tend to cluster together as repetitive sequences known as CpG islands, which are primarily found within promoter regions of genes, or regions with increased centromeric tandem repeat units (9, 10). CpG methylation within promoter regions is generally associated with gene silencing, although recent studies have provided evidence of the importance of non-CpG and non-promoter methylation in development and disease (11, 12). DNA methylation alterations can occur in response to biological (13, 14), lifestyle (15, 16), and environmental (17) factors and associate with gene expression changes and pathological dysfunctions. Moreover, DNA methylation is reversible, and therefore aberrant DNA methylation modifications have attracted increased interest as drug targets. As such, the interest in dissecting the impact of epigenetic variation on human diseases, including T2D, has increased over the last decade (18–23).
For numerous epidemiological studies, it is not always possible to access human tissues central to the pathogenesis of disease. Importantly, T2D-associated DNA methylation changes in pancreatic ß-cells and insulin-responsive tissues (liver, muscle, and adipose tissue) have been reported to be reflected in the blood, thus offering an opportunity to use alternative, non-invasive clinical samples for methylation analysis (7, 8, 24). Peripheral blood is relatively quick and easy to collect, with minimal side effects and much higher patient acceptability. As blood collection is already a part of routine medical checkups in both developed and developing countries, identification of blood-based DNA methylation alterations would greatly facilitate biomarker discovery for T2D screening. This, together with the chemical and biological stability of DNA methylation signatures, mark them as attractive and feasible prognostic/diagnostic tools.
Despite the exponential rise in epigenetic research over the last decade, the current status of DNA methylation alterations in blood from human T2D subjects still remains limited. Indeed, most recent reviews have focused on DNA methylation signatures in pancreatic islets and peripheral tissues (liver, skeletal muscle, and adipose tissue), which are not feasible tissue sources for biomarker generation. The aim of this review is to summarize, discuss, and integrate the most recent available evidence of the potential of blood-based DNA methylation alterations as candidate biomarkers for T2D prevention and treatment.
Four databases, Scopus, PubMed, Cochrane Central, and Google Scholar, were searched to identify published studies reporting DNA methylation changes in blood between January 2008 to July 2018. The following keywords: “DNA methylation,” AND “blood,” OR “peripheral blood,” OR “peripheral blood mononuclear cells,” OR “peripheral blood leukocytes” OR “peripheral blood lymphocytes” OR “white blood cells” AND “type 2 diabetes” AND “human” were used. Studies were considered eligible if they were original articles, investigated DNA methylation patterns in relationship with T2D and if the study was published in English. Reference lists of included studies were also hand-searched to identify other potentially eligible studies. Both cross-sectional, case control, and longitudinal studies that provided sufficient information were included. The study methods included global DNA methylation studies, candidate-gene methylation studies, and genome-wide association studies (GWAS).
Global DNA methylation, referred to as the total methylation status that occurs across the genome, has been reported to be one of the earliest molecular changes in the transition of a cell from a normal to a diseased state (25). Technological advances have resulted in an increase in global DNA methylation studies. Current methods to quantify global DNA methylation include enzyme-linked immunosorbent assays (ELISA), methylation-sensitive restriction enzymes, liquid chromatography coupled with mass spectrometry, flow cytometry, and quantification of DNA methylation within repetitive elements using bisulfite pyrosequencing (26). Global DNA methylation studies are advanced in cancer research, with a blood-based candidate diagnostic biomarker for colorectal cancer already commercially available (27). In recent years, global DNA has attracted considerable interest as a biomarker for T2D. Studies that have quantified global DNA methylation in peripheral blood of T2D subjects are summarized in Table 1.
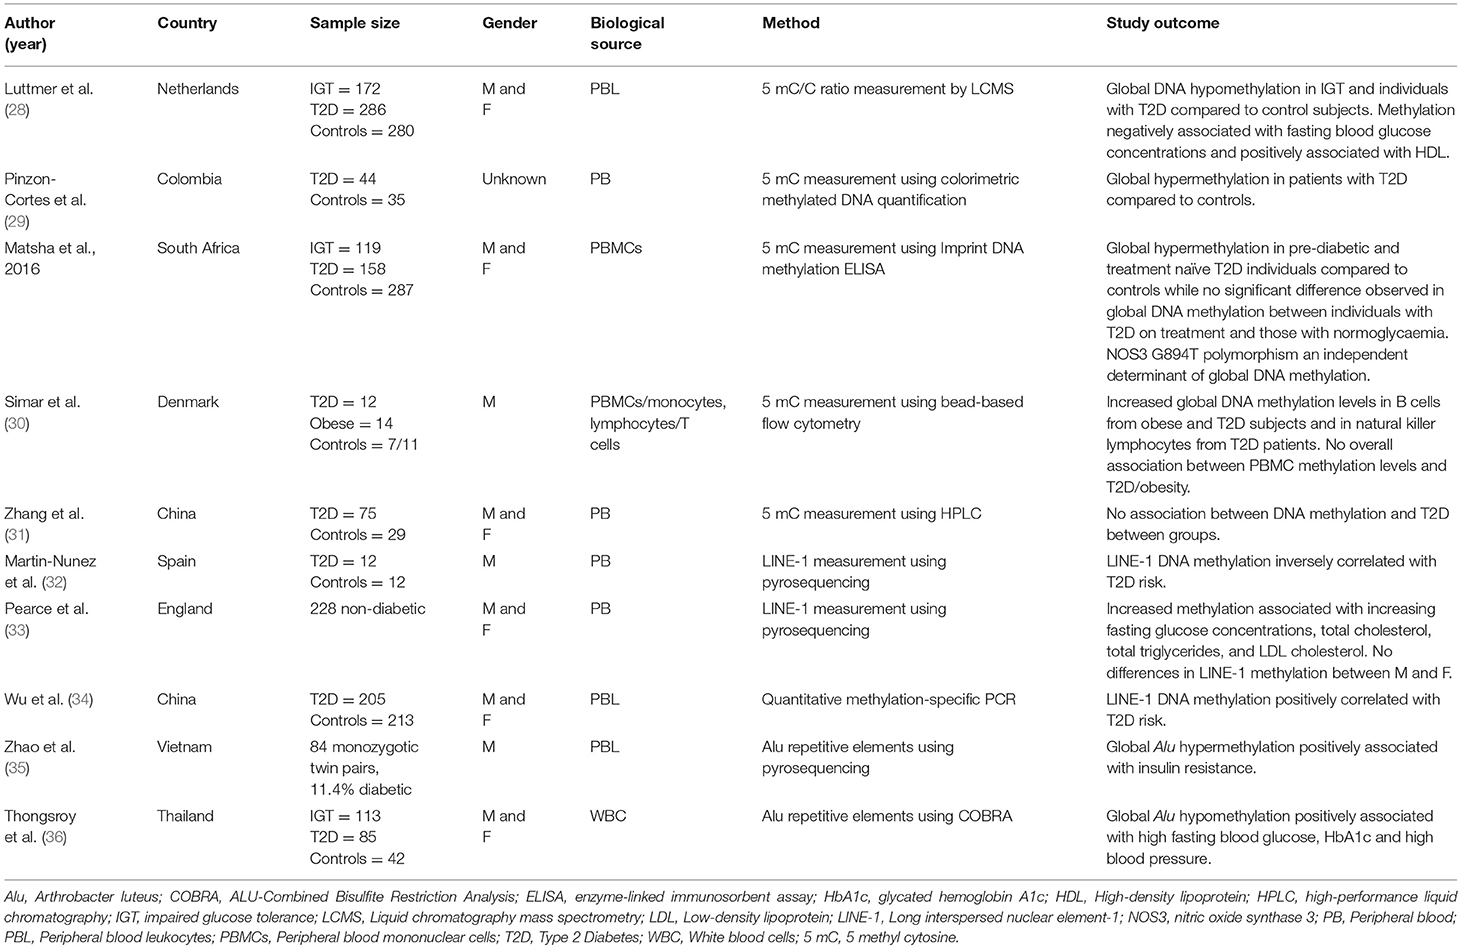
Table 1. Main findings from T2D studies investigating global DNA methylation in blood.
Luttmer et al. quantified global DNA methylation levels in peripheral blood leukocytes of 738 individuals from the Netherlands Hoorn Study cohort and reported a progressive decrease in global DNA methylation in individuals with T2D compared to those with impaired glucose tolerance and normoglycaemia. Moreover, DNA hypomethylation in these subjects was independently associated with hyperglycaemia and high-density lipoprotein (HDL) cholesterol (28). In contrast, a Colombian study using a smaller patient group, observed a global increase in DNA methylation in 44 subjects with T2D compared to 35 healthy controls, which correlated with the percentage of glycated hemoglobin A1c (HbA1c) (29). Similar findings were reported by Matsha et al. using a South African population consisting of 158 individuals with T2D, 119 with dysglycaemia, and 287 healthy controls. They showed that levels of global DNA methylation were higher in individuals with impaired glucose tolerance or treatment-naïve T2D compared to those with normoglycaemia (29, 30). Interestingly, no difference in global DNA methylation was observed between diabetic individuals on treatment and normoglycaemic subjects, prompting the authors to speculate that glucose management caused the reversal of aberrant DNA methylation patterns during T2D (30).
An innovative study by Simar et al. measured global DNA methylation levels of different subtypes of peripheral blood mononuclear cells in obese and T2D individuals, using a flow cytometry bead-based method. They reported that global DNA methylation levels were increased in B cells from obese individuals and subjects with T2D, and in natural killer lymphocytes from patients with T2D, while no overall difference was observed in the mixed population of blood mononuclear cells from these individuals. DNA methylation in B cells and natural killer lymphocytes correlated positively with insulin resistance, suggesting an association between DNA methylation alterations, immune function, and metabolic disorders (31). These findings highlight the importance for not only tissue specific but also cell type specific epigenetic studies, which may improve sensitivity and specificity.
Repetitive elements, such as long interspersed nuclear element-1 (LINE-1) are highly represented throughout the genome and as such, methylation of these elements is generally considered to correlate with global genomic DNA methylation (38). Martin-Núñez (33) demonstrated that LINE-1 methylation was decreased in peripheral blood from a small Spanish group of 12 individuals with T2D compared to 12 normoglycaemic individuals (33). Conversely, a study using 228 non-diabetic individuals reported that LINE-1 DNA hypermethylation is associated with increasing fasting glucose, total cholesterol, triglycerides, low-density lipoprotein (LDL) cholesterol, and risk of developing T2D (34). These findings were later supported by Wu and colleagues who reported a significant increase in LINE-1 methylation in a group of 205 Chinese patients with T2D compared to 213 healthy controls (35). Using a similar approach, Zhao and colleagues assessed methylation of Arthrobacter luteus (Alu) elements as a proxy for global DNA methylation by performing quantitative bisulfite pyrosequencing. They found that hypermethylation of these elements in peripheral blood leukocytes from 84 monozygotic twin pairs discordant for T2D was significantly associated with insulin resistance (36). More recently, Alu methylation levels were also investigated in white blood cells from 85 individuals with T2D, 113 with impaired glucose tolerance, and 42 healthy control subjects, using Alu-Combined Bisulfite Restriction Analysis (COBRA). Interestingly, in contrast to the findings of Zhao et al. (36), they reported that individuals with T2D exhibited the lowest Alu methylation compared to controls, which directly correlated with higher fasting blood glucose and HbA1c concentrations and high blood pressure (37). Taken together, the results from global DNA methylation analysis are mostly inconsistent and more studies are needed to consolidate the findings on the association between blood-based global DNA methylation and T2D.
Despite being a robust measure of overall genomic methylation, global DNA does not have the resolution to measure methylation within specific genes (39). Thus, a candidate gene approach to quantify the methylation status of specific CpG sites within genes associated with T2D are increasingly being investigated (40). Methods used in these studies include methylated DNA immunoprecipitation (MeDIP), methylation specific PCR, mass spectrometry combined with RNA base-specific cleavage, as well as bisulfite pyrosequencing (41). Genes investigated include fat mass and obesity-associated protein (FTO), peroxisome proliferator–activated receptor gamma (PPARγ), pyruvate dehydrogenase lipoamide kinase isozyme 4 (PDK4), transcription factor 7-like 2 (TCF7L2), monocyte chemoattractant protein-1 (MCP-1), glucokinase (GCK), protein kinase C zeta (PRCKZ), B-cell lymphoma/leukemia 11A (BCL11A), gastric inhibitory polypeptide receptor (GIPR), solute carrier family 30 member 8 (SLC30A8), insulin-like growth factor-binding protein 7 (IGFNP-7), protein tyrosine phosphatase, non-receptor type 1 (PTPN1), calmodulin 2 (CALM2), CRY2 cryptochrome circadian regulator 2 (CRY2), Ca2+/calmodulin-dependent protein kinase 1 subfamily of serine/threonine kinases (CAMK1D), toll-like receptor (TLR) 2, and 4, and free fatty acid receptor 3 (FFAR3), which are discussed in further detail below and summarized in Table 2
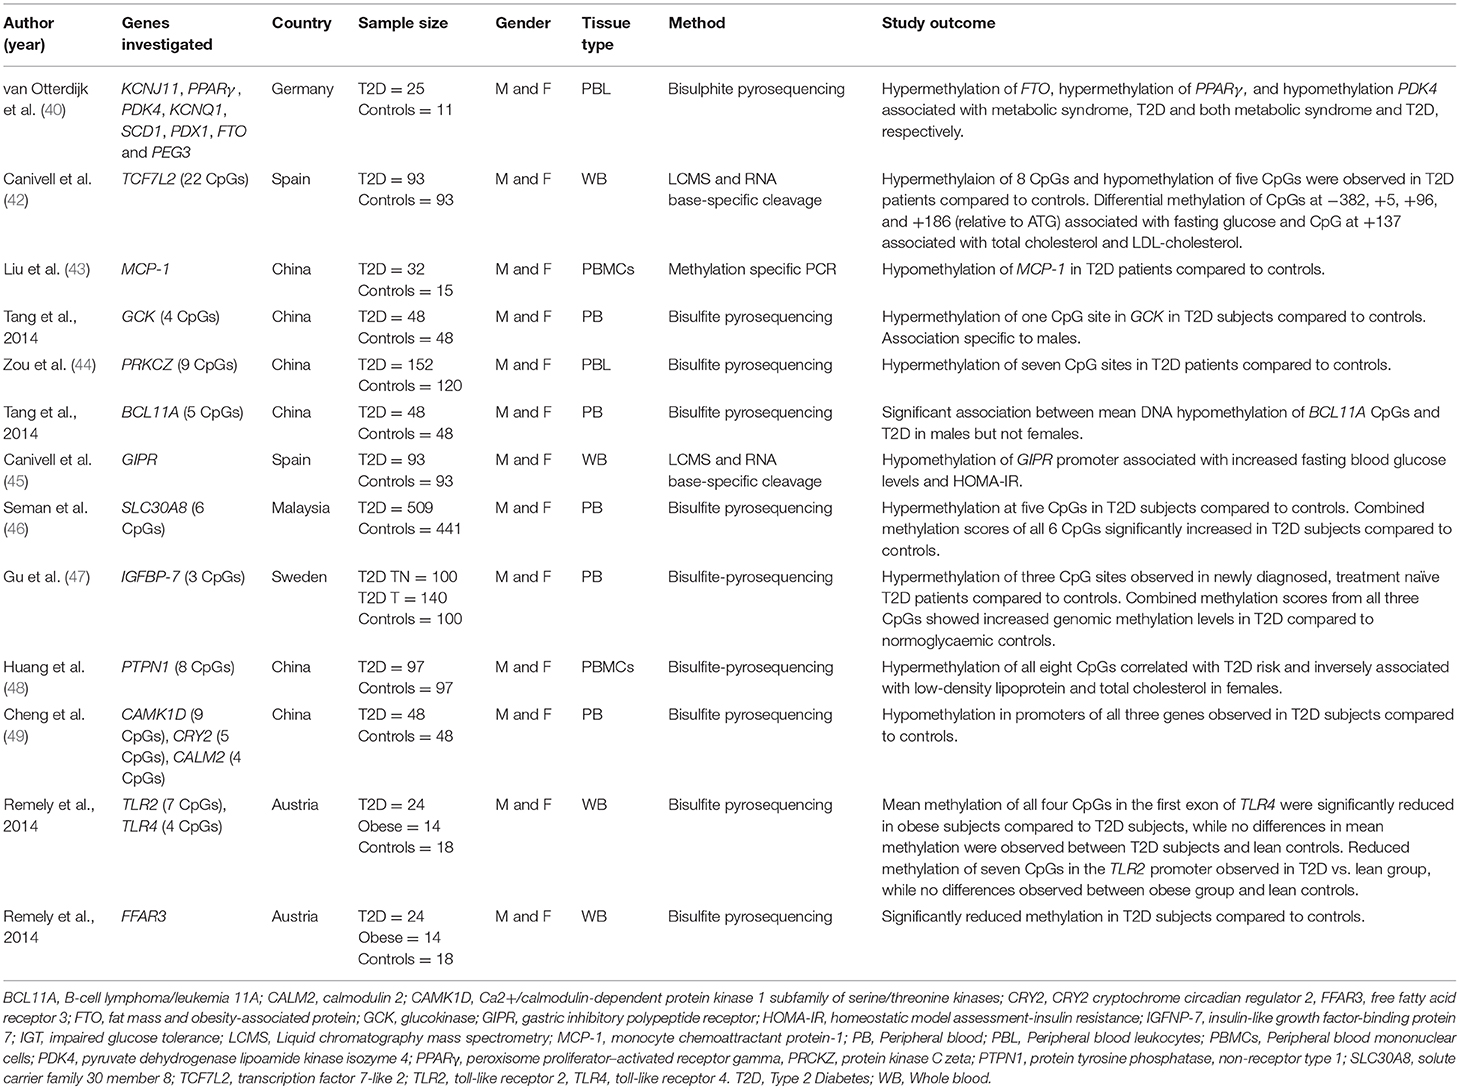
Table 2. Main findings from T2D studies investigating candidate gene methylation in blood.
The FTO gene encodes a 2-oxoglutarate-dependent nucleic acid demethylase and various studies have reported that variants in the FTO locus are strongly linked with obesity and can predict risk of T2D and cardiovascular disease (53–57). The methylation status of FTO was analyzed by van Otterdijk et al. who identified hypermethylation of one CpG locus in the promoter region in peripheral blood leukocytes from 25 individuals with T2D compared to 11 control healthy subjects (40). The same study also identified hyper- and hypomethylation of CpG sites in the promoters of the PPARγ and PDK4 genes, respectively, in patients with T2D vs. healthy controls. PPARγ is a transcription factor that plays major roles in adipogenesis and insulin sensitivity, and agonists are currently being used as anti-diabetic agents (58). PDK4 is reported to play a role in the regulation of glucose metabolism and mitochondrial function, and hypomethylation of this gene has also been reported in skeletal muscle of diabetic patients compared to controls (59). TCF7L2 is involved in glucose homeostasis and was reported to be differentially methylated in 13 of its promoter CpGs (eight hypermethylated and five hypomethylated) between treatment-naïve patients with T2D and matched controls (42). Furthermore, methylation at specific CpG sites of the TCF7L2 promoter correlated significantly with fasting glucose concentrations, total cholesterol, LDL-cholesterol, as well as the homeostatic model assessment for insulin resistance (HOMA-IR) (47).
MCP-1 is a chemokine that regulates macrophage migration and infiltration into adipose tissue and in this way, contributes to insulin resistance and decreased glucose uptake during obesity and T2D (60). Interestingly, hypomethylation of the MCP-1 promoter associated with increased serum MCP-1 levels, HbA1c, and fasting blood glucose levels in patients with T2D compared to healthy controls (43). The GCK gene encodes glucokinase, a key glycolytic enzyme that catalyzes the first step in hepatic and pancreatic islet glucose utilization pathways (61). Tang et al. (44) evaluated GCK methylation in T2D subjects and matched controls, and identified significant hypermethylation of one intragenic CpG site exclusively in male patients with T2D compared to healthy controls, which also correlated with total cholesterol levels. The results for this association indicate an interaction between gender and T2D-associated methylation alterations.
PRKCZ, a member of the PKC family of serine/threonine kinases, functions downstream of phosphatidylinositol 3-kinase (PI3K) to positively regulate the insulin signaling pathway and contributes to the translocation of glucose transporter type 4 (GLUT4) from the cytoplasm to the membrane, where it facilitates glucose uptake (62). A comparison between the PRKCZ promoter sequence in peripheral blood leukocytes from Chinese individuals with either T2D or normoglycaemia showed that seven CpG sites were methylated in the T2D group whereas only one CpG site was methylated in the control group (45). Furthermore, the protein expression levels of PRKCZ in the serum of the group with T2D was significantly reduced compared to the control group, suggesting that PRKCZ promoter activity and gene expression are regulated by methylation (45). The BCL11A gene, encoding a CH2H2 type zinc-finger transcription factor, has also been associated with T2D risk. BCL11A plays a normal physiological role in lymphocyte production but variants of this gene have been shown to affect insulin response to glucose, as well glucagon secretion (63, 64). Tang et al. investigated the correlation between BCL11A methylation at one intragenic and four promoter CpG sites and T2D risk (46). They found a significant decrease in the mean DNA methylation levels across these CpG sites in males with T2D compared to normoglycaemic controls (46). Interestingly, these differences were not observed in females.
The GIPR gene encodes a receptor of the incretin, GIP, a gastrointestinal hormone that stimulates insulin response after ingesting food. Canivell et al. performed DNA methylation profiling of the GIPR promoter in peripheral blood DNA and identified differential methylation at nine CpG sites located upstream of the first exon between patients with T2D and controls. On average, these nine CpG sites were hypomethylated in patients with T2D and significantly correlated with waist circumference and fasting glucose concentrations (47). SLC30A8 encodes a pancreas-specific, zinc efflux transporter, and reduced levels or activity of SLC30A8 hinder glucose-induced insulin secretion, as zinc is required for the crystallization of insulin within secretory granules (65). Seman et al. analyzed DNA methylation alterations in the SLC30A8 promoter in peripheral blood from a large Malay population and identified hypermethylation of five CpG sites in patients with T2D compared to controls (48).
Another insulin associated gene that has been linked to T2D is IGFBP-7, a member of the insulin growth factor binding family. The expression of IGFBP-7 was previously found to be increased in the serum of subjects with T2D compared to controls, and significantly associated with insulin resistance (49, 66, 67). Gu et al. studied the correlation between IGFBP-7 promoter methylation and T2D in peripheral blood from a large Swedish cohort of subjects. They identified increased IGFBP-7 methylation in three CpG sites in newly diagnosed men with T2D, but not in women, compared to non-diabetic individuals (49). Interestingly, no significant differences in serum IGFBP-7 expression were observed between groups (49). These results are conflicting with previous studies that reported increased serum IGFBP-7 concentrations in T2D subjects compared to healthy individuals. The discrepancies in these results may be due to the use of a much larger sample size in the study by Gu et al. (140 T2D subjects and 100 controls), as well as differences in the selection criteria of the patients with T2D between studies (49, 66, 67). While Gu et al. (49) studied newly diagnosed, treatment naïve T2D subjects, the previous studies included participants on chronic pharmacological therapies, including insulin, oral hypoglycaemic agents, statins, fibrates, blood pressure–lowering agents, and aspirin (49, 66, 67).
More recently, Huang et al. investigated the methylation status of another key regulator of the insulin signaling pathway, PTPN1, in relation to T2D susceptibility (50). PTPN1 encodes the protein-tyrosine phosphatase 1B protein, which attenuates the insulin signaling pathway by decreasing the phosphorylation of the insulin receptor and/or insulin receptor substrate 1 (68). In the study, DNA methylation of the PTPN1 promoter region was quantified in peripheral blood mononuclear cells from 97 Chinese patients with T2D and 97 age- and gender-matched healthy controls, using bisulfite pyrosequencing. The results revealed a significant correlation between PTPN1 promoter methylation and increased T2D risk in females, but not in males. Furthermore, PTPN1 methylation was also inversely associated with low-density lipoprotein and total cholesterol levels in females. These results indicate that PTPN1 promoter hypermethylation is a risk factor for T2D in the female Chinese population.
Cheng et al. investigated DNA methylation in the promoters of CALM2, CRY2, and CAMK1D, based on previous reports linking variants of these genes with T2D susceptibility (51). They demonstrated that four, five, and nine CpGs within the CALM2, CRY2, and CAMK1D gene promoters, respectively, were significantly hypomethylated in the peripheral blood of subjects with T2D compared to healthy controls. CRY2 plays a role in circadian rhythm which, when desynchronized, results in metabolic disturbances including increased insulin and postprandial glucose levels, increased arterial blood pressure, and decreased leptin levels, which may predispose individuals to T2D (69). Variants in the CALM2 gene, a member of the calmodulin family, have been associated with dialysis survival in T2D-associated renal disease, as well as arrhythmia susceptibility in infants (70). CAMK1D plays a key role in granulocyte function and reactive oxygen species (ROS) inhibition through the chemokine signal transduction pathway, and consequently, non-functional variants or hypomethylation of this gene may result in apoptosis and consequently, reduced β-cell mass (71).
Remely et al. investigated DNA methylation of two genes involved in innate immunity and inflammation, TLR 2, and 4, in response to changes in gut microbiota in individuals with T2D (72–74). This investigation was prompted by a spate of recent studies to show that changes in gut microbiota composition can lead to chronic low-grade inflammation, metabolic dysregulation, and T2D (75, 76). Remely et al. investigated three groups of subjects: patients with T2D using glucagon-like peptide-1 (GLP-1) agonist therapy, obese individuals without established insulin resistance, and a normal-weight control group. The authors identified four significantly hypomethylated CpGs in the first exon of TLR4 in obese individuals compared to healthy controls, while methylation of seven CpGs in the promoter region of TLR2 was significantly lower in subjects with T2D compared to obese subjects and normal-weight controls, which correlated with body mass index (BMI) (52). Furthermore, distinct changes in gut microbiota composition were observed between the three groups, the most significant being a high abundance of lactic acid bacteria in individuals with T2D.
Gut microbiota contribute to energy metabolism through the production of short chain fatty acids (SCFA) during fermentation in the colon. SCFAs are believed to alter DNA methylation patterns of genes involved in inflammatory reactions, including genes encoding free fatty acid receptors (FFARs) (77, 78). Based on this as well as their previous findings, a follow up study conducted by Remely et al. investigated the effect of gut microbiota and SCFA production on DNA methylation of FFAR3 in blood from the same cohort described previously (52). Their results showed differential composition of gut microbiota in the T2D and obese subjects, and significantly higher methylation in five CpGs in the FFAR3 promoter region in normal-weight controls compared to obese subjects with the lowest methylation in subjects with T2D (77). Taken together, these two studies provide evidence that differential composition of gut microbiota in obesity and T2D is associated with epigenetic gene regulation. The authors thus proposed that improvements in diet targeted to restore gut microbial balance may ameliorate aberrant epigenetics and be effective as a preventative treatment for metabolic syndrome (52).
With technological advances, the focus of epigenetics studies has shifted from candidate regions to high throughput, genome wide association studies (GWAS). In the past few years, as a result of a widespread use of techniques, including the Infinium Beadchip Arrays and methylation pull-down sequencing assays, major insights into DNA methylation changes associated with T2D have been obtained, which are summarized in Table 3.
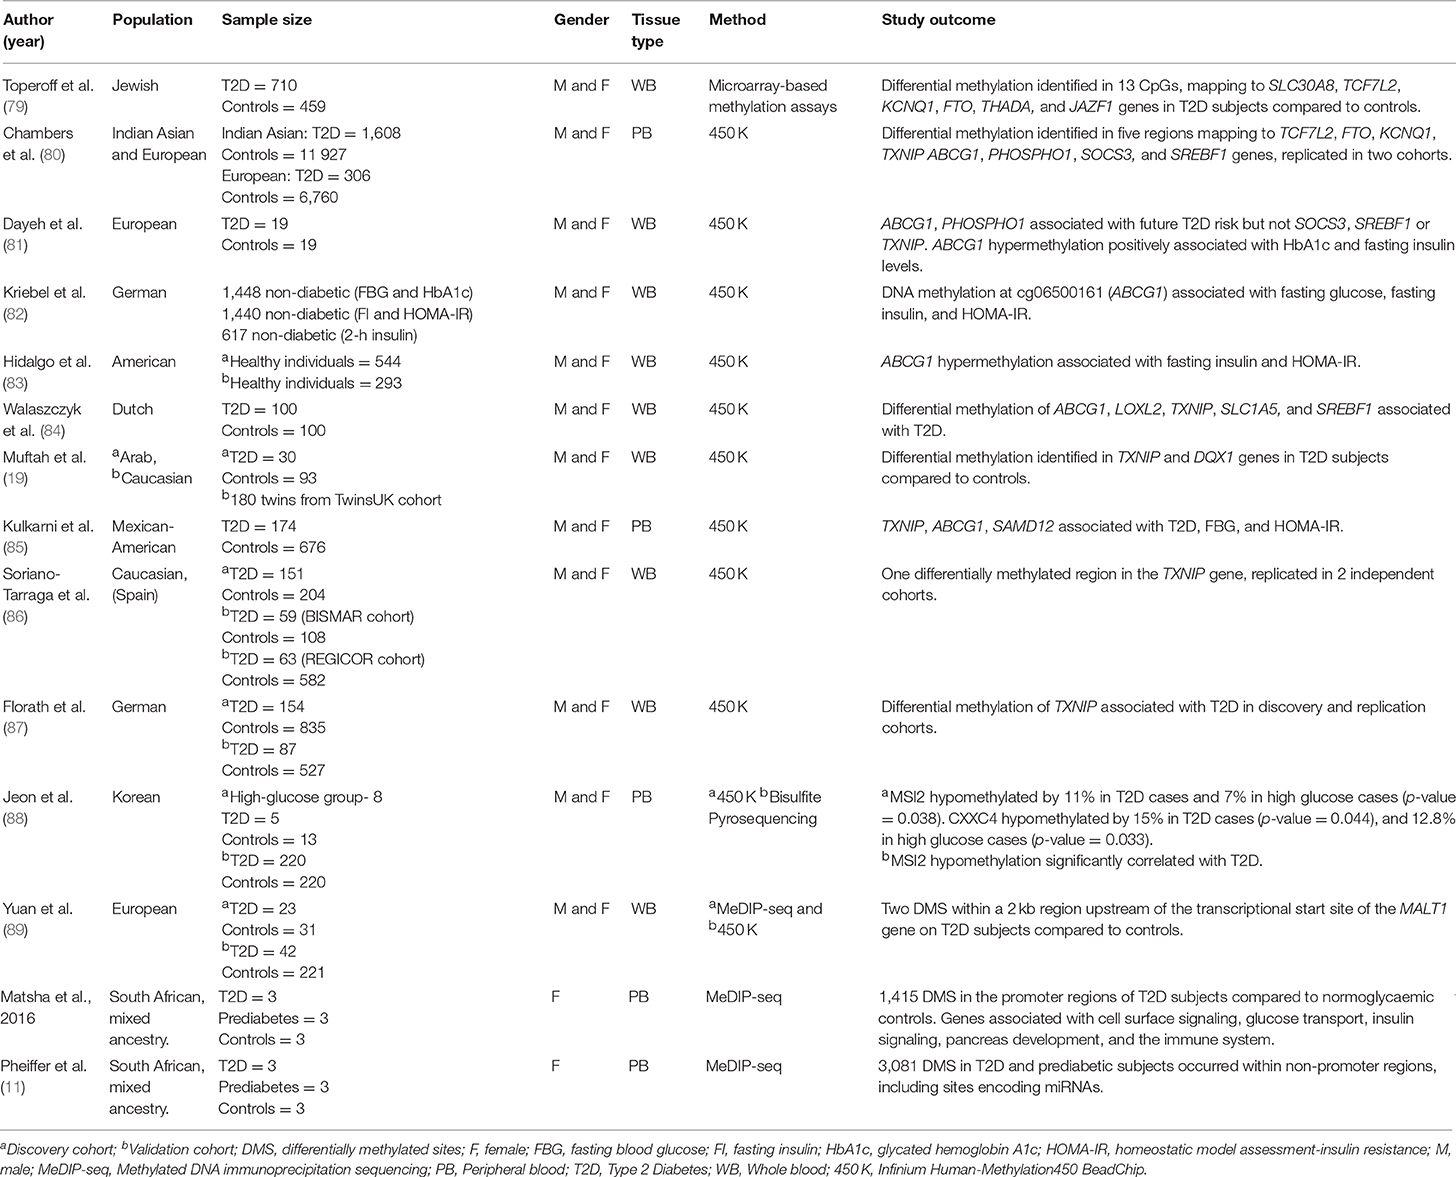
Table 3. Main findings from T2D studies investigating genome-wide DNA methylation in human population-based studies.
Microarray-based methylation assays use the ratio between hybridization intensities of DNA samples before and after digestion with a cocktail of methyl-sensitive restriction enzymes to generate quantitative methylation scores (91). This technique was used in one of the first GWAS to compare T2D-associated genome-wide methylation alterations in human blood. Toperoff et al. assessed pooled, peripheral blood DNA methylation in a Jewish cohort of 710 T2D and 459 control subjects (79). Their analysis covered 1 461 753 DNA genomic fragments containing 3,359,645 CpG methylation sites and results showed that differentially methylated sites were enriched in genomic regions that had previously been associated with T2D. The most significant methylation differences between T2D and control subjects mapped to the SLC30A8, TCF7L2, FTO, potassium voltage-gated channel subfamily KQT member 1 (KCNQ1), thyroid adenoma associated protein (THADA), and juxtaposed with another zinc finger protein 1 (JAZF1) genes (79). The authors validated these methylation changes using bisulfite sequencing, which also revealed that hypomethylation of a CpG site in the first intron of the FTO gene, was significantly associated with T2D risk. Furthermore, these findings were reproduced by the same group in an independent population cohort (Jerusalem LRC longitudinal Study) of young individuals who later developed T2D, indicating that hypomethylation of specific genomic sites may be an early risk factor that predisposes individuals to T2D later in life.
Bead array-based DNA methylation analysis is designed to provide single-base resolution and quantitative evaluation of specific cytosines in multiple samples (92). The Infinium HumanMethylation BeadChip was developed by Illumina and interrogates over 485,000 methylation sites and covers 96% of CpG islands, as well as additional island shores (i e., regions flanking 2 kb of CpG islands) (93). Using the HumanMethylation450 BeadChip, Chambers et al. investigated T2D-associated DNA methylation alterations in peripheral blood from 2,664 Indian Asians and replicated the study findings in 1,141 Europeans (80). Differentially methylated CpG sites were identified within 853 genes in individuals with T2D, including known T2D-associated loci, TCF7L2, FTO, and KCNQ1. The authors also found that CpG sites in thioredoxin-interacting protein (TXNIP), ATP-binding cassette sub-family G member 1 (ABCG1), phosphoethanolamine/phosphocholine phosphatase 1 (PHOSPHO1), suppressor of cytokine signaling 3 (SOCS3), and sterol regulatory element-binding transcription factor 1 (SREBF1) were significantly associated with the future development of T2D (80). In addition, the combined methylation scores for these five loci were associated with future T2D incidence independently of the established T2D risk factors—family history of T2D, physical activity, BMI, waist:hip ratio, HbA1c, and glucose and insulin concentrations.
The loci identified by the Chambers study were later evaluated in an independent cohort (the Botnia prospective study) by Dayeh et al. (81), who confirmed an association between ABCG1 and PHOSPHO1 methylation in whole blood and future T2D risk but not SOCS3, SREBF1, or TXNIP. They found that ABCG1 hypermethylation positively associated with HbA1c and fasting insulin levels. Furthermore, the methylation status of ABCG1 could be replicated in the blood of diabetic twins compared to their non-diabetic counterparts (81). The association between ABCG1 hypermethylation and fasting blood glucose and insulin levels has also been reported in three other GWAS studies (82–85). The ABCG1 gene encodes a protein involved in cholesterol transport (94). Since cholesterol abnormalities is a hallmark of T2D, it is tempting to speculate that hypermethylation of this gene may modulate circulating cholesterol levels, and thus have an impact on initiation and progression of T2D, as well as T2D-associated cardiovascular complications (94).
Dayeh et al. also found that DNA hypermethylation at the PHOSPHO1 locus positively correlated with HDL and associated with decreased T2D risk (81). The PHOSPHO1 gene encodes a hydrolase enzyme and is involved in skeletal and vascular mineralization (95, 96). Cardiovascular calcification is a common consequence of aging, diabetes and hypercholesterolemia, and PHOSPHO1 has thus been marked as an attractive target for cardiovascular therapy (96). The observation that PHOSPHO1 hypermethylation correlated with HDL and reduced T2D risk provides additional evidence for its candidacy as a diagnostic marker for T2D–associated CVD complications.
Muftah et al. investigated DNA methylation patterns in the whole blood of 123 subjects from an Arab cohort and replicated eight known CpG associations with T2D/BMI identified in Caucasians, including an association of TXNIP hypomethylation with T2D (reported by the Chambers study) (19, 80). Hypomethylation of TXNIP in T2D subjects has since been reported in four additional studies using HumanMethylation450 BeadChip arrays (84–87). Interestingly, TXNIP expression is induced by glucose, as a result of a carbohydrate response element in its promoter and TXNIP overexpression has been reported in both diabetic animals and humans (97). Furthermore, TXNIP has been linked to vascular complications through its ability to modulate angiogenesis by repressing vascular endothelial growth factor (VEGF) (97). Muftah et al. also identified a significant association between methylation at a novel CpG site within the DEAQ-box RNA dependent ATPase 1 (DQX1) gene and T2D in both the Arab and Caucasian cohorts (19). DQX1 encodes an RNA-dependent ATPase, which is highly expressed in the liver and muscle, however its role in T2D remains to be elucidated (98).
A family-based study by Kulkarni et al. analyzed the association of DNA methylation at 446,356 sites in peripheral blood from 850 pedigreed Mexican-American individuals (85). They found differential methylation of 51 CpG sites that significantly associated with T2D, 19 with increased fasting blood glucose concentrations and 24 with HOMA-IR (85). Interestingly, the five CpG sites that were most significantly associated with T2D-related traits mapped to three genes, including the previously identified TXNIP and ABCG1 genes, and Sterile Alpha Motif Domain Containing 12 (SAMD12). SAMD12 has been identified as a target of gene fusion in breast cancer (99), however its role in T2D still needs to be explored.
More recently, Jeon et al. (88) investigated genome-wide DNA methylation changes in peripheral blood related to hypoglycaemia in a longitudinal Korean population-based cohort (88). They identified hypomethylation of two genes, Musashi RNA-Binding Protein 2 (MSI2) and CXXC-Type Zinc Finger Protein 4 (CXXC4), in individuals with T2D and impaired glucose tolerance, compared to healthy controls. They further assessed these findings in an additional cross-sectional replication cohort of subjects with T2D and healthy controls, using targeted pyrosequencing. Here, only MSI2 hypomethylation could be validated, which significantly associated with T2D. Interestingly, the same association was observed in pancreatic islet DNA from subjects with T2D, indicating that MSI2 methylation may be biologically relevant. This is in line with expression studies performed by Szabat et al. (100), who demonstrated that MSI2 could be upregulated in response to lipotoxicity and endoplasmic reticulum (ER) stress, and that knockdown/overexpression of MSI2 in mouse pancreatic beta cells resulted in significantly altered insulin expression, suggesting a potential modulatory role for MSI2 in T2D.
Methylated DNA immunoprecipitation sequencing (MeDIP-seq) is a versatile, unbiased approach for detecting methylated DNA and involves the use of a monoclonal antibody that specifically recognizes 5 mC to enrich for methylated DNA, after which the immunoprecipitated fraction can be analyzed by large-scale sequencing (101). This approach is particularly useful because it bypasses the need for bisulfite conversion and is able to distinguish between 5 mC and 5-hydroxymethylcytosine, an oxidation product of 5 mC (101).
Yuan et al. (89) investigated epigenome-wide methylation patterns in whole blood from monozygotic twins discordant for T2D using MeDIP-sequencing, after which the top scoring results were replicated in a separate cohort of twins using the Illumina Human Methylation 450 K array. In the first cohort of twins, they identified T2D-associated differentially methylated regions located within 3,597 genes, which were hypermethylated in two-thirds of cases (89). Furthermore, 30% of the differentially methylated regions could be replicated in the additional twin cohort. Importantly, the top two differentially hypermethylated regions identified in the study were found to reside within a 2 kb region upstream of the transcriptional start site of the mucosa-associated lymphoid tissue lymphoma translocation protein 1 (MALT1) gene. Studies in MALT1 knockout mice have demonstrated its critical roles in antigen- receptor-induced activation of NF-κB (89). NF-κB has well established roles in T2D–associated chronic inflammation, however, the effects of MALT1 hypermethylation or transcript depletion on NF-κB signaling and associated inflammation in humans has not yet been explored (102). In the same study, Yuan et al. also identified hypermethylation in the promoter region of the G-protein receptor 6 (GPR6) gene, encoding a member of the G protein-coupled receptor family of transmembrane receptors. Interestingly, GPR6 knockout mice exhibit hyperphagia-induced obesity and higher liver triglyceride content, plasma insulin, and leptin levels compared to wild-type mice (103). These findings suggest that GPR6 plays a role in the regulation of food intake and body weight, and may thus be an important molecular target for obesity or hyperphagia.
Matsha et al. (90) performed GWAS analysis on DNA methylation patterns in peripheral blood from a small cohort of South African women of mixed ethnic ancestry, consisting of 3 subjects with T2D, 3 with pre-diabetes, and 3 with normoglycaemia. They identified 1,415 differentially methylated sites in the promoter regions of T2D subjects compared to normoglycaemic controls, of which over 80% were hypermethylated, including the following genes: B-Cell CLL/Lymphoma 3 (BCL3), Interleukin 23 Subunit Alpha (IL23A), F2R Like Trypsin Receptor 1 (F2RL1), S100 Calcium Binding Protein A12 (S100A12), TNF Receptor Superfamily Member 10b (TNFRSF10B), NIMA Related Kinase 6 (NEK6), Ring Finger Protein 31 (RNF31), Solute Carrier Family 35 Member B2 (SLC35B2), and Interleukin 1 Receptor Associated Kinase 1 Binding Protein 1 (IRAK1BP1). Interestingly, when grouped according to chromosomal location it was found that, compared to controls and pre-diabetic subjects, individuals with T2D had hypermethylated regions that were more common in chromosomes 3, 6, 11, 13, and 17, while more hypomethylated methylated regions were found in chromosome 1. Furthermore, these identified hypermethylated regions mapped to pathways related to T2D, including cell surface signaling, glucose transport, insulin signaling, pancreas development, and the immune system, whereas hypomethylated regions related to the pro-inflammatory NF-κB cascade, as well as metabolism pathways for polyunsaturated omega-6 fatty acids, linoleic acid, and arachidonic acid (90). Interestingly, excess consumption of polyunsaturated fatty acids, particularly found at high concentrations in the western diet, can result in increased inflammation and contribute to the onset of chronic diseases including obesity and T2D (104). Importantly, Matsha et al. (90) demonstrated that linoleic acid and arachidonic acid metabolism pathways were also associated with hypomethylated differentially methylated regions in subjects with prediabetes compared to controls, suggesting that alterations in the methylation state of these genes may occur before the onset of overt T2D.
An additional investigation by the same group focused on identifying T2D-associated DNA methylation changes in intergenic regions compared to promoter and gene body regions, as it now appreciated that methylation within intergenic regions regulate RNA processing, as well as high-copy interspersed or tandem DNA repeats (10). Using peripheral blood DNA from the same South African patient cohort as described above (90), they showed increased DNA methylation in intergenic regions compared to gene body and promoter regions (11). Furthermore, 3,081 of the differentially methylated regions were associated with microRNAs. Importantly, a subset of miRNAs identified in the study, including miR-9, miR-34, miR-124, and miR-1297, have already been linked to T2D and associated traits in human and animal diabetic models. Since dysregulated miRNAs have an established role in T2D (105), those identified by Pheiffer et al. merit further evaluation as novel disease risk biomarkers.
There is evidence to suggest that single nucleotide polymorphisms (SNPs) may be associated with altered epigenetic signatures (106). Indeed, it has been suggested that up to 25% of all SNPs in the genome either introduce or remove CpG sites (106, 107). In this regard, CpG-SNPs have been suggested to be a potential mechanism through which SNPs affect gene function via epigenetics, highlighting the complex interaction between genetics and epigenetics (107). While CpG-SNPs have been reported in numerous obesity-associated genes, few studies have examined the association between SNPs and T2D risk through effects on DNA methylation (108).
An investigation of T2D-associated DNA methylation candidates reported in this review revealed that 20 genes were indeed associated with SNPs. FTO, and TCF7L2 have been deemed two of the most important T2D susceptibility genes to date (54–57, 109, 110), while additional SNPs in MCP-1, SLC30A8, GCK, PRKCZ, GIPR, IGFBP-7, PTPN1, PPARγ, KCNQ1, BCL11A, CALM2, CRY2, CAMK1D, THADA, ABCG1, SOCS3, SREBF1, TXNIP have either been associated with glycaemic traits, T2D or risk of T2D-linked complications (63, 64, 110–119). It is still unknown whether the above associated SNPs may directly cause differential DNA methylation of genes that contribute to the pathogenesis of T2D, or if SNPs within regulatory regions change the affinity and/or binding of transcription factors, which in turn influence the recruitment of epigenetic machinery. Future work should be directed at combining genetic information and methylation marks when comparing individuals with T2D to those without disease.
Interestingly, SNPs may also be associated with altered global DNA methylation. Matsha et al. performed genetic screening of polymorphisms in the nitric oxide synthase 3 (NOS3) gene using peripheral blood from South African subjects with T2D, pre-diabetes or normoglycaemia, and reported that the NOS3 G894T polymorphism was independently associated with global DNA methylation. NOS3 has previously been reported to be affected by supplementation with folate, a dietary methyl donor (120). Although the potential role played by NOS3 in global DNA methylation is unclear, it encodes an enzyme involved in endothelial function and may thus potentially contribute to T2D-associated vascular complications (121).
The current review highlighted variation in the outcome of DNA methylation studies, however, it is important to note that the range of methods employed to measure DNA methylation is vast, as are the sources of DNA (cell type), DNA isolation method and methods of data analysis (122). This large heterogeneity complicates the direct comparison of findings between studies, particularly for those published more than a decade ago, as the epigenetics field is expanding at such a rapid rate. The standardization of experimental and analysis approaches, as well as internal and external validation of study findings will be an important step in improving the reproducibility and biological relevance of these findings.
The inability of some of the reported studies to replicate methylation associations could be explained by differences in the groups of participants analyzed, as the majority of findings emanated from small cross-sectional or case-control studies in varying populations. To advance reproducibility in different populations, more robust longitudinal studies are required, which would involve prospective recruitment of a large cohort of healthy individuals at baseline, and the follow-up of these individuals over several decades to track T2D incidence. However, due to higher costs and study duration, longitudinal studies for complex diseases such as T2D still remain scarce. The only longitudinal studies reported in this review were that of Chambers et al. (80) and Jeon et al. (88). Interestingly, differentially methylated genes identified in the Chambers study were replicated in cross-sectional studies (TXNIP, ABCG1, PHOSPHO1, and SREBF1) (19, 81–87). The ability of these changes to be captured across studies of different time lengths may be attributed to the stable nature of DNA methylation marks after disease onset.
An additional limitation in some of the reported studies was failure to include in-depth demographic, lifestyle, and health data and consequently, lack of consideration or adjustment for potential confounding factors. This is crucial for data interpretation as it is now widely appreciated that DNA methylation signatures vary with gender, age, and ethnicity and are sensitive to many environmental influences (32). Indeed, in cases where gender was considered, differences in DNA methylation patterns were reported for BCL11A, GCK, IGFBP-7, and PTPN1 (44, 46, 49). These observations are consistent with findings on gender-specific DNA methylation marks in other diseases, such as PLA2G7 in cardiovascular disease and MTHFR in schizophrenia (123, 124). Furthermore, gender-specific differences in glucose homeostasis and T2D risk have been reported, which may be related to the levels of sex-hormones such as estrogen and testosterone (125). The confounding effect of chronic medication was also highlighted by Matsha et al. (30), who reported an association between global DNA hypomethylation in T2D individuals and the use of glucose-controlling agents. Indeed, the widely used anti-diabetic drug, metformin, was recently shown to promote global DNA methylation in cancer cell lines by modulating the intracellular ratio of S-adenosylhomocysteine (SAH) and S-adenosylmethionine (SAM) (126). Thus, the observed methylation differences and associations between methylation changes and T2D risk might be confounded by medications, such as metformin, which should be taken into consideration in future studies. Furthermore, these findings may offer opportunities for the use of DNA methylation for monitoring of management and response to T2D medications.
DNA methylation varies with cell type and thus cellular homogeneity within a tissue is an important characteristic for a DNA methylation biomarker. While the finding in this review strengthen the candidacy of blood-based markers, it is important to note that blood exhibits cellular heterogeneity, as it consists of a wide variety of cell types including erythrocytes, basophils, neutrophils, eosinophils, monocytes, lymphocytes, natural killer cells, and platelets (127). Each of these cells possess a unique epigenetic signature and this can lead to variation between studies. Only one study reported in this review controlled for the estimated proportion of different blood cell types, and indeed proved that epigenetic heterogeneity in whole blood cell constituents impacts on data interpretation (31). Thus, it is plausible that differences in cell composition between groups may drive false associations or mask potential differences between groups. In this regard, there are several additional methods that can be used to avoid potential confounding effects of the blood cell composition, such as the measurement of DNA methylation in individual cell types following sorting of the cells, adjustment for direct measured cell count or the use of post-hoc regression models, as described by Houseman et al. (128).
It is important to note that while DNA methylation in gene promoters has consistently been linked with gene silencing, some studies could not correlate promoter methylation with gene or protein expression (49). This could either be a result of DNA methylation at the reported CpGs being ineffective to reduce transcript levels, or due to alternative transcriptional or post-transcriptional influences. Indeed, a growing body of evidence suggests that miRNAs and histone modifications are also highly involved in T2D pathogenesis, for which comprehensive reviews have been published (105, 129, 130).
The current review identified 37 articles investigating DNA methylation markers for T2D detection or risk evaluation, using DNA isolated from blood. Based on reproducible findings from the reviewed studies in different population groups, differentially methylated sites in TCF7L2, KCNQ1, ABCG1, TXNIP, PHOSPHO1, SREBF1, SLC30A8, and FTO are potentially associated with T2D and their predictive powers may hold irrespective of different genetic backgrounds and different lifestyle or environmental pressures. A model for the role of these DNA methylation alterations in the pathogenesis of T2D is depicted in Figure 1. Although these alterations were detected in blood, which is not an insulin-responsive tissue, the implicated genes have been shown to play a role in critical biological processes that are deregulated during T2D development, including energy intake and expenditure (FTO), lipogenesis and glycolysis (SREBF1), glucose homeostasis and carbohydrate metabolism (TXNIP, TCF7L2), lipid transport (ABCG1) pancreatic insulin secretion (SLC30A8, KCNQ1), and cardiovascular function (PHOSPHO1). It is thus plausible that these blood-based epigenetic markers mirror tissues with deteriorated metabolic function, and are prime non-invasive candidates for T2D biomarkers.
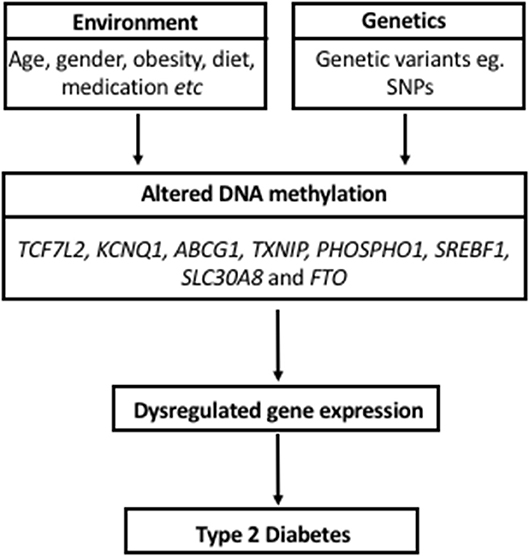
Figure 1. Model proposing a role for DNA methylation in the pathogenesis of Type 2 Diabetes and its interaction with environmental factors and genetics.
Some limitations of the current review are the exclusion of studies that were not published in English and the use of only four databases of published literature. Positive publication bias also should be considered, as studies with negative findings may not have been published. Finally, the current review only focused on DNA methylation, given the large scope of studies already published in this field. Although it was beyond the scope of this review, we cannot rule out other possible epigenetic biomarker candidates of T2D, such as non-coding RNAs and histone modifications, for which evidence is rapidly accumulating (105, 129, 130).
The major strength of this review is the central focus on blood-based DNA methylation signatures in T2D, which will have important implications for the development of non-invasive T2D screening tests, given the difficulty in accessing T2D-associated tissues, particularly for longitudinal studies. To the best of our knowledge, this is the only review solely examining associations of T2D with DNA methylation profiles in peripheral blood. We also highlighted specific methylation patterns that associated with T2D risk factors such as BMI, HbA1c levels, and HDL/LDL, which further supports the hypothesis that profiling DNA methylation in blood could be used to monitor high risk individuals and delay or prevent T2D by facilitating early intervention strategies. In this regard, the candidate markers in this review need to be further validated in additional prospective study cohorts and tested in large screening populations by high quality studies. At present, no epigenetic biomarkers for T2D have yet entered clinical trials, however, there is hope that initiatives such as next generation sequencing and the use of longitudinal study designs, will uncover important predictive T2D biomarkers.
TW designed the study and extracted the data. TW wrote the manuscript. CP and RJ corrected the manuscript. All authors read and approved the final manuscript.
This work was supported by the National Research Foundation of South Africa for the professional development program (PDP) grant, Unique Grant No. 104987 (CP and TW) and the South African Medical Research Council baseline funding (CP).
The authors declare that the research was conducted in the absence of any commercial or financial relationships that could be construed as a potential conflict of interest.
T2D, Type 2 diabetes; FFAs, free fatty acids; 5mC, 5-methylcytosine; CpG, Cytosine-guanine dinucleotides; GWAS, genome-wide association studies; ELISA, enzyme-linked immunosorbent assay; HDL, high-density lipoprotein; NOS3, nitric oxide synthase 3; LINE-1, long interspersed nuclear element-1; LDL, low-density lipoprotein; Alu, Arthrobacter luteus; MeDIP, methylated DNA immunoprecipitation; FTO, obesity-associated protein; PPARγ, peroxisome proliferator–activated receptor gamma; PDK4, pyruvate dehydrogenase lipoamide kinase isozyme 4; GCK, glucokinase; PRCKZ, protein kinase C zeta; GIPR, gastric inhibitory polypeptide receptor; IGFNP-7, insulin-like growth factor-binding protein 7; PTPN1, protein tyrosine phosphatase, non-receptor type 1; MCP-1, monocyte chemoattractant protein-1; SLC30A8, solute carrier family 30 member 8; BCL11A, B-cell lymphoma/leukemia 11A; TCF7L2, transcription factor 7-like 2; CALM2, calmodulin 2; CRY2, CRY2 cryptochrome circadian regulator 2; CMAK1D, Ca2+/calmodulin-dependent protein kinase 1 subfamily of serine/threonine kinases; TLR2, toll-like receptor 2; TLR3, toll-like receptor 3; FFAR3, free fatty acid receptor 3; PI3K, phosphatidylinositol 3-kinase; GLUT4, glucose transporter type 4; SNP, single nucleotide polymorphisms; HOMA-IR, homeostatic model assessment for insulin resistance; ROS, reactive oxygen species; GI, gastrointestinal; BMI, body mass index; SCFA, short chain fatty acids; FFARs, free fatty acid receptors; OGTTs, oral glucose tolerance tests; KCNQ1, potassium voltage-gated channel subfamily KQT member 1; THADA, thyroid adenoma associated protein; JAZF1, juxtaposed with another zinc finger protein 1; TXNIP, thioredoxin-interacting protein; ABCG1, ATP-binding cassette sub-family G member 1; PHOSPHO1, phosphoethanolamine/phosphocholine phosphatase 1; SOCS3, suppressor of cytokine signaling 3; SREBF1, sterol regulatory element-binding transcription factor 1; HbA1c, hemoglobin A1c; VEGF, vascular endothelial growth factor; DQX1, DEAQ-box RNA dependent ATPase 1; SAMD12, Sterile Alpha Motif Domain Containing 12; MALT1, mucosa-associated lymphoid tissue lymphoma translocation protein 1; GPR6, G-protein receptor 6; TG, triglyceride; BCL3, B-Cell CLL/Lymphoma 3; IL23A, Interleukin 23 Subunit Alpha; F2RL1, F2R Like Trypsin Receptor 1; S100A12, S100 Calcium Binding Protein A12; TNFRSF10B, TNF Receptor Superfamily Member 10b; NEK6, NIMA Related Kinase 6; RNF31, Ring Finger Protein 31; SLC35B2, Solute Carrier Family 35 Member B2; IRAK1BP1, Interleukin 1 Receptor Associated Kinase 1 Binding Protein 1.
1. Guariguata L, Whiting DR, Hambleton I, Beagley J, Linnenkamp U, Shaw JE. Global estimates of diabetes prevalence for 2013 and projections for 2035. Diabetes Res Clin Pract. (2014) 103:137–49. doi: 10.1016/j.diabres.2013.11.002
2. International Diabetes Federation. IDF Diabetes Atlas, International Diabetes Federation. 8th ed. Brussels (2017). Available online at: http://www.diabetesatlas.org
4. Cerf ME. Beta cell dysfunction and insulin resistance. Front Endocrinol. (2013) 4:37. doi: 10.3389/fendo.2013.00037
5. Prentki M, Nolan CJ. Islet beta cell failure in type 2 diabetes. J Clin Invest. (2006) 116:1802–12. doi: 10.1172/JCI29103
6. Kwak SH, Park KS. Recent progress in genetic and epigenetic research on type 2 diabetes. Exp Mol Med. (2016) 48:e220. doi: 10.1038/emm.2016.7
7. Heyn H, Esteller M. DNA methylation profiling in the clinic: applications and challenges. Nat Rev Genet. (2012) 13:679–92. doi: 10.1038/nrg3270
8. Geach T. Blood-based markers for T2DM. Nat Rev Endocrinol. (2016) 12:311. doi: 10.1038/nrendo.2016.63
9. Eccleston A, DeWitt N, Gunter C, Marte B, Nath D. Introduction epigenetics. Nature (2007) 447:395. doi: 10.1038/447395a
10. Jones PA. Functions of DNA methylation: islands, start sites, gene bodies and beyond. Nat Rev Genet. (2012) 13:484–92. doi: 10.1038/nrg3230
11. Pheiffer C, Erasmus RT, Kengne AP, Matsha TE. Differential DNA methylation of microRNAs within promoters, intergenic and intragenic regions of type 2 diabetic, pre-diabetic and non-diabetic individuals. Clin Biochem. (2016) 49:433–8. doi: 10.1016/j.clinbiochem.2015.11.021
12. Jang HS, Shin WJ, Lee JE, Do JT. CpG and Non-CpG Methylation in epigenetic gene regulation and brain function. Genes (2017) 8:148. doi: 10.3390/genes8060148
13. Horvath S. DNA methylation age of human tissues and cell types. Genome Biol. (2013) 14:R115. doi: 10.1186/gb-2013-14-10-r115
14. Rakyan VK, Down TA., Maslau S, Andrew T, Yang TP, Beyan H, et al. Human aging-associated DNA hypermethylation occurs preferentially at bivalent chromatin domains. Genome Res. (2010) 20:434–9. doi: 10.1101/gr.103101.109
15. Liu C, Marioni RE, Hedman AK, Pfeiffer L, Tsai PC, Reynolds LM, et al. A DNA methylation biomarker of alcohol consumption. Mol Psychiatry (2018) 23:422–33. doi: 10.1038/mp.2016.192
16. Breitling LP, Yang R, Korn B, Burwinkel B, Brenner H. Tobacco smoking and methylation of genes related to lung cancer development. Am J Hum Genet. (2011) 88:450–7. doi: 10.1016/j.ajhg.2011.03.003
17. Li S, Hursting SD, Davis BJ, McLachlan JA, Barrett JC. Environmental exposure, DNA methylation, and gene regulation: lessons from diethylstilbesterol-induced cancers. Ann N Y Acad Sci. (2003) 983:161–9. doi: 10.1111/j.1749-6632.2003.tb05971.x
18. Kim M, Long TI, Arakawa K, Wang R, Yu MC, Laird PW. DNA methylation as a biomarker for cardiovascular disease risk. PLoS ONE (2010) 5:e9692. doi: 10.1371/journal.pone.0009692
19. Al Muftah WA, Al-Shafai M, Zaghlool SB, Visconti A, Tsai PC, Kumar P, et al. Epigenetic associations of type 2 diabetes and BMI in an Arab population. Clin Epigenetics (2016) 8:13. doi: 10.1186/s13148-016-0177-6
20. Kasinska MA, Drzewoski J, Sliwinska A. Epigenetic modifications in adipose tissue - relation to obesity and diabetes. Arch Med Sci. (2016) 12:1293–301. doi: 10.5114/aoms.2015.53616
21. Duthie SJ. Epigenetic modifications and human pathologies: cancer and CVD. Proc Nutr Soc. (2011) 70:47–56. doi: 10.1017/S0029665110003952
22. Turunen MP, Aavik E, Yla-Herttuala S. Epigenetics and atherosclerosis. Biochim Biophys Acta (2009) 1790:886–91. doi: 10.1016/j.bbagen.2009.02.008
23. Cao Y, Liu M, Li XC, Sun RR, Zheng Y, Zhang PY. Impact of epigenetics in the management of cardiovascular disease- a review. Eur Rev Med Pharmacol Sci. (2014) 18:3097–104.
24. Shenker NS, van Veldhoven K, Sacerdote C, Ricceri F, Birrell MA, Belvisi MG, et al. Epigenome-wide association study in the European prospective investigation into cancer and nutrition (EPIC-Turin) identifies novel genetic loci associated with smoking. Hum Mol Genet. (2013) 22:843–51. doi: 10.1093/hmg/dds488
25. Mikeska T, Craig JM. DNA methylation biomarkers: cancer and beyond. Genes (2014) 5:821–64. doi: 10.3390/genes5030821
26. Dziewulska A, Dobosz AM, Dobrzyn A. High-throughput approaches onto uncover (Epi) genomic architecture of type 2 diabetes. Genes (2018) 9:374. doi: 10.3390/genes9080374
27. Payne SR. From discovery to the clinic: the novel DNA methylation biomarker (m)sept9 for the detection of colorectal cancer in blood. Epigenomics (2010) 2:575–85. doi: 10.2217/epi.10.35
28. Luttmer R, Spijkerman AM, Kok RM, Jakobs C, Blom HJ, Serne EH, et al. Metabolic syndrome components are associated with DNA hypomethylation. Obes Res Clin Pract. (2013) 7:e106–e15. doi: 10.1016/j.orcp.2012.06.001
29. Pinzon-Cortes JA, Perna-Chaux A, Rojas-Villamizar NS, Diaz-Basabe A, Polania-Villanueva DC, Jacome MF, et al. Effect of diabetes status and hyperglycemia on global DNA methylation and hydroxymethylation. Endocr Connect. (2017) 6:708–25. doi: 10.1530/EC-17-0199
30. Matsha TE, Pheiffer C, Mutize T, Erasmus RT, Kengne AP. Glucose tolerance, MTHFR C677T and NOS3 G894T polymorphisms, and global DNA methylation in mixed ancestry african individuals. J Diabetes Res. (2016) 2016:8738072. doi: 10.1155/2016/8738072
31. Simar D, Versteyhe S, Donkin I, Liu J, Hesson L, Nylander V, et al. DNA methylation is altered in B and NK lymphocytes in obese and type 2 diabetic human. Metabolism (2014) 63:1188–97. doi: 10.1016/j.metabol.2014.05.014
32. Zhang FF, Cardarelli R, Carroll J, Fulda KG, Kaur M, Gonzalez K, et al. Significant differences in global genomic DNA methylation by gender and race/ethnicity in peripheral blood. Epigenetics (2014) 6:623–9. doi: 10.4161/epi.6.5.15335
33. Martin-Nunez GM, Rubio-Martin E, Cabrera-Mulero R, Rojo-Martinez G, Olveira G, Valdes S, et al. Type 2 diabetes mellitus in relation to global LINE-1 DNA methylation in peripheral blood: a cohort study. Epigenetics (2014) 9:1322–8. doi: 10.4161/15592294.2014.969617
34. Pearce MS, McConnell JC, Potter C, Barrett LM, Parker L, Mathers JC, et al. Global LINE-1 DNA methylation is associated with blood glycaemic and lipid profiles. Int J Epidemiol. (2012) 41:210–7. doi: 10.1093/ije/dys020
35. Wu Y, Cui W, Zhang D, Wu W, Yang Z. The shortening of leukocyte telomere length relates to DNA hypermethylation of LINE-1 in type 2 diabetes mellitus. Oncotarget (2017) 8:73964–73. doi: 10.18632/oncotarget.18167
36. Zhao J, Goldberg J, Bremner JD, Vaccarino V. Global DNA methylation is associated with insulin resistance: a monozygotic twin study. Diabetes (2012) 61:542–6. doi: 10.2337/db11-1048
37. Thongsroy J, Patchsung M, Mutirangura A. The association between Alu hypomethylation and severity of type 2 diabetes mellitus. Clin Epigenetics (2017) 9:93. doi: 10.1186/s13148-017-0395-6
38. Yang AS, Estecio MR, Doshi K, Kondo Y, Tajara EH, Issa JP. A simple method for estimating global DNA methylation using bisulfite PCR of repetitive DNA elements. Nucleic Acids Res. (2004) 32:e38. doi: 10.1093/nar/gnh032
39. TB consortium. Quantitative comparison of DNA methylation assays for biomarker development and clinical applications. Nat Biotechnol. (2016) 34:726–37. doi: 10.1038/nbt.3605
40. van Otterdijk SD, Binder AM, Szarc Vel Szic K, Schwald J, Michels KB. DNA methylation of candidate genes in peripheral blood from patients with type 2 diabetes or the metabolic syndrome. PLoS ONE (2017) 12:e0180955. doi: 10.1371/journal.pone.0180955
41. Kurdyukov S, Bullock M. DNA methylation analysis: choosing the right method. Biology (2016) 5:E3. doi: 10.3390/biology5010003
42. Canivell S, Ruano EG, Siso-Almirall A, Kostov B, Gonzalez-de Paz L, Fernandez-Rebollo E, et al. Differential methylation of TCF7L2 promoter in peripheral blood DNA in newly diagnosed, drug-naive patients with type 2 diabetes. PLoS ONE (2014) 9:e99310. doi: 10.1371/journal.pone.0099310
43. Liu ZH, Chen L, Deng XL, Song HJ, Liao YF, Zeng TS, et al. Methylation status of CpG sites in the MCP-1 promoter is correlated to serum MCP-1 in type 2 diabetes. J Endocrinol Invest. (2012) 35:585–9. doi: 10.3275/7981
44. Tang L, Ye H, Hong Q, Wang L, Wang Q, Wang H, et al. Elevated CpG island methylation of GCK gene predicts the risk of type 2 diabetes in Chinese males. Gene (2014) 547:329–33. doi: 10.1016/j.gene.2014.06.062
45. Zou L, Yan S, Guan X, Pan Y, Qu X. Hypermethylation of the PRKCZ gene in type 2 diabetes mellitus. J Diabetes Res. (2013) 2013:721493. doi: 10.1155/2013/721493
46. Tang L, Wang L, Ye H, Xu X, Hong Q, Wang H, et al. BCL11A gene DNA methylation contributes to the risk of type 2 diabetes in males. Exp Ther Med. (2014) 8:459–63. doi: 10.3892/etm.2014.1783
47. Canivell S, Ruano EG, Siso-Almirall A, Kostov B, Gonzalez-de Paz L, Fernandez-Rebollo E, et al. Gastric inhibitory polypeptide receptor methylation in newly diagnosed, drug-naive patients with type 2 diabetes: a case-control study. PLoS ONE (2013) 8:e75474. doi: 10.1371/journal.pone.0075474
48. Seman NA, Mohamud WN, Ostenson CG, Brismar K, Gu HF. Increased DNA methylation of the SLC30A8 gene promoter is associated with type 2 diabetes in a Malay population. Clin Epigenetics (2015) 7:30. doi: 10.1186/s13148-015-0049-5
49. Gu HF, Gu T, Hilding A, Zhu Y, Karvestedt L, Ostenson CG, et al. Evaluation of IGFBP-7 DNA methylation changes and serum protein variation in Swedish subjects with and without type 2 diabetes. Clin Epigenetics (2013) 5:20. doi: 10.1186/1868-7083-5-20
50. Huang Q, Han L, Liu Y, Wang C, Duan D, Lu N, et al. Elevation of PTPN1 promoter methylation is a significant risk factor of type 2 diabetes in the Chinese population. Exp Ther Med. (2017) 14:2976–82. doi: 10.3892/etm.2017.4924
51. Cheng J, Tang L, Hong Q, Ye H, Xu X, Xu L, et al. Investigation into the promoter DNA methylation of three genes (CAMK1D, CRY2 and CALM2) in the peripheral blood of patients with type 2 diabetes. Exp Ther Med. (2014) 8:579–84. doi: 10.3892/etm.2014.1766
52. Remely M, Aumueller E, Jahn D, Hippe B, Brath H, Haslberger AG. Microbiota and epigenetic regulation of inflammatory mediators in type 2 diabetes and obesity. Benef Microbes. (2014) 5:33–43. doi: 10.3920/BM2013.006
53. He M, Cornelis MC, Franks PW, Zhang C, Hu FB, Qi L. Obesity genotype score and cardiovascular risk in women with type 2 diabetes mellitus. Arterioscler Thromb Vasc Biol. (2010) 30:327–32. doi: 10.1161/ATVBAHA.109.196196
54. Hubacek JA, Stanek V, Gebauerova M, Pilipcincova A, Dlouha D, Poledne R, et al. A FTO variant and risk of acute coronary syndrome. Clin Chim Acta (2010) 411:1069–72. doi: 10.1016/j.cca.2010.03.037
55. Lappalainen T, Kolehmainen M, Schwab US, Tolppanen AM, Stancakova A, Lindstrom J, et al. Association of the FTO gene variant (rs9939609) with cardiovascular disease in men with abnormal glucose metabolism–the finnish diabetes prevention study. Nutr Metab Cardiovasc Dis. (2011) 21:691–8. doi: 10.1016/j.numecd.2010.01.006
56. Almen MS, Jacobsson JA, Moschonis G, Benedict C, Chrousos GP, Fredriksson R, et al. Genome wide analysis reveals association of a FTO gene variant with epigenetic changes. Genomics (2012) 99:132–7. doi: 10.1016/j.ygeno.2011.12.007
57. Frayling TM, Timpson NJ, Weedon MN, Zeggini E, Freathy RM, Lindgren CM, et al. A common variant in the FTO gene is associated with body mass index and predisposes to childhood and adult obesity. Science (2007) 316:889–94. doi: 10.1126/science.1141634
58. Rosen ED, Spiegelman BM. PPARgamma: a nuclear regulator of metabolism, differentiation, and cell growth. J Biol Chem. (2001) 276:37731–4. doi: 10.1074/jbc.R100034200
59. Kulkarni SS, Salehzadeh F, Fritz T, Zierath JR, Krook A, Osler ME. Mitochondrial regulators of fatty acid metabolism reflect metabolic dysfunction in type 2 diabetes mellitus. Metabolism (2012) 61:175–85. doi: 10.1016/j.metabol.2011.06.014
60. Kanda H, Tateya S, Tamori Y, Kotani K, Hiasa K, Kitazawa R, et al. MCP-1 contributes to macrophage infiltration into adipose tissue, insulin resistance, and hepatic steatosis in obesity. J Clin Invest. (2006) 116:1494–505. doi: 10.1172/JCI26498
61. Hattersley AT, Turner RC, Patel P, O'Rahilly S, Hattersley AT, Patel O, et al. Linkage of type 2 diabetes to the glucokinase gene. Lancet (1992) 339:1307–10. doi: 10.1016/0140-6736(92)91958-B
62. Standaert ML, Galloway L, Karnam P, Bandyopadhyay G, Moscat J, Farese RV. Protein kinase C-ζ as a downstream effector of phosphatidylinositol 3-kinase during insulin stimulation in rat adipocytes potential role in glucose transport. J Biol Chem. (1997) 272:30075–82. doi: 10.1074/jbc.272.48.30075
63. Simonis-Bik AM, Nijpels G, van Haeften TW, Houwing-Duistermaat JJ, Boomsma DI, Reiling E, et al. Gene variants in the novel type 2 diabetes loci CDC123/CAMK1D, THADA, ADAMTS9, BCL11A, and MTNR1B affect different aspects of pancreatic beta-cell function. Diabetes (2010) 59:293–301. doi: 10.2337/db09-1048
64. Jonsson A, Ladenvall C, Ahluwalia TS, Kravic J, Krus U, Taneera J, et al. Effects of common genetic variants associated with type 2 diabetes and glycemic traits on α- and β-cell function and insulin action in humans. Diabetes (2013) 62:2978–83. doi: 10.2337/db12-1627
65. Rutter GA, Chimienti F. SLC30A8 mutations in type 2 diabetes. Diabetologia (2015) 58:31–6. doi: 10.1007/s00125-014-3405-7
66. López-Bermejo A, Khosravi J, Fernández-Real JM, Hwa V, Pratt KL, Casamitjana R, et al. Insulin resistance is associated with increased serum concentration of IGF-binding proteinrelated protein 1 (IGFBP-rP1/MAC25). Diabetes (2006) 55:2333–9. doi: 10.2337/db05-1627
67. Kutsukake M, Ishihara R, Momose K, Isaka K, Itokazu O, Higuma C, et al. Circulating IGF-binding protein 7 (IGFBP7) levels are elevated in patients with endometriosis or undergoing diabetic hemodialysis. Reprod Biol Endocrinol. (2008) 6:54. doi: 10.1186/1477-7827-6-54
68. Zinker BA, Rondinone CM, Trevillyan JM, Gum RJ, Clampit JE, Waring JF, et al. PTP1B antisense oligonucleotide lowers PTP1B protein, normalizes blood glucose, and improves insulin sensitivity in diabetic mice. Proc Natl Acad Sci USA. (2002) 99:11357-62. doi: 10.1073/pnas.142298199
69. Kelly MA, Rees SD, Hydrie MZ, Shera AS, Bellary S, O'Hare JP, et al. Circadian gene variants and susceptibility to type 2 diabetes: a pilot study. PLoS ONE (2012) 7:e32670. doi: 10.1371/journal.pone.0032670
70. Murea M, Lu L, Ma L, Hicks PJ, Divers J, McDonough CW, et al. Genome-wide association scan for survival on dialysis in African-Americans with type 2 diabetes. Am J Nephrol. (2011) 33:502–9. doi: 10.1159/000327985
71. Verploegen S, Ulfman L, van Deutekom H, van Aalst C, Honing H, Lammers J, et al. Characterization of the role of CaMKI-like kinase (CKLiK) in human granulocyte function. Blood (2005) 106:1076–83. doi: 10.1182/blood-2004-09-3755
72. Mohammad MK, Morran M, Slotterbeck B, Leaman DW, Sun Y, Grafenstein H, et al. Dysregulated Toll-like receptor expression and signaling in bone marrow-derived macrophages at the onset of diabetes in the non-obese diabetic mouse. Int Immunol. (2006) 18:1101–13. doi: 10.1093/intimm/dxl045
73. Kim HS, Han MS, Chung KW, Kim S, Kim E, Kim MJ, et al. Toll-like receptor 2 senses beta-cell death and contributes to the initiation of autoimmune diabetes. Immunity (2007) 27:321–33. doi: 10.1016/j.immuni.2007.06.010
74. Sepehri Z, Kiani Z, Nasiri AA, Kohan F. Toll-like receptor 2 and type 2 diabetes. Cell Mol Biol Lett. (2016) 21:2. doi: 10.1186/s11658-016-0002-4
75. Cani PD, Osto M, Geurts L, Everard A. Involvement of gut microbiota in the development of low-grade inflammation and type 2 diabetes associated with obesity. Gut Microbes. (2012) 3:279–88. doi: 10.4161/gmic.19625
76. Baothman OA, Zamzami MA, Taher I, Abubaker J, Abu-Farha M. The role of gut microbiota in the development of obesity and Diabetes. Lipids Health Dis. (2016) 15:108. doi: 10.1186/s12944-016-0278-4
77. Remely M, Aumueller E, Merold C, Dworzak S, Hippe B, Zanner J, et al. Effects of short chain fatty acid producing bacteria on epigenetic regulation of FFAR3 in type 2 diabetes and obesity. Gene (2014) 537:85–92. doi: 10.1016/j.gene.2013.11.081
78. Taylor EM, Jones AD, Henagan TM. A review of mitochondrial-derived fatty acids in epigenetic regulation of obesity and type 2 diabetes. J Nutrit Health Food Sci. (2014) 2:1–4.doi: 10.15226/jnhfs.2014.00127
79. Toperoff G, Aran D, Kark JD, Rosenberg M, Dubnikov T, Nissan B, et al. Genome-wide survey reveals predisposing diabetes type 2-related DNA methylation variations in human peripheral blood. Hum Mol Genet. (2012) 21:371–83. doi: 10.1093/hmg/ddr472
80. Chambers JC, Loh M, Lehne B, Drong A, Kriebel J, Motta V, et al. Epigenome-wide association of DNA methylation markers in peripheral blood from Indian Asians and Europeans with incident type 2 diabetes: a nested case-control study. Lancet Diabetes Endocrinol. (2015) 3:526–34. doi: 10.1016/S2213-8587(15)00127-8
81. Dayeh T, Tuomi T, Almgren P, Perfilyev A, Jansson PA, de Mello VD, et al. DNA methylation of loci within ABCG1 and PHOSPHO1 in blood DNA is associated with future type 2 diabetes risk. Epigenetics (2016) 11:482–8. doi: 10.1080/15592294.2016.1178418
82. Kriebel J, Herder C, Rathmann W, Wahl S, Kunze S, Molnos S, et al. Association between DNA methylation in whole blood and measures of glucose metabolism: KORA F4 Study. PLoS ONE (2016) 11:e0152314. doi: 10.1371/journal.pone.0152314
83. Hidalgo B, Irvin MR, Sha J, Zhi D, Aslibekyan S, Absher D, et al. Epigenome-wide association study of fasting measures of glucose, insulin, and HOMA-IR in the genetics of lipid lowering drugs and diet network study. Diabetes (2014) 63:801–7. doi: 10.2337/db13-1100
84. Walaszczyk E, Luijten M, Spijkerman AMW, Bonder MJ, Lutgers HL, Snieder H, et al. DNA methylation markers associated with type 2 diabetes, fasting glucose and HbA1c levels: a systematic review and replication in a case-control sample of the Lifelines study. Diabetologia (2018) 61:354–68. doi: 10.1007/s00125-017-4497-7
85. Kulkarni H, Kos MZ, Neary J, Dyer TD, Kent JW Jr, Goring HH, et al. Novel epigenetic determinants of type 2 diabetes in Mexican-American families. Hum Mol Genet. (2015) 24:5330–44. doi: 10.1093/hmg/ddv232
86. Soriano-Tarraga C, Jimenez-Conde J, Giralt-Steinhauer E, Mola-Caminal M, Vivanco-Hidalgo RM, Ois A, et al. Epigenome-wide association study identifies TXNIP gene associated with type 2 diabetes mellitus and sustained hyperglycemia. Hum Mol Genet. (2016) 25:609–19. doi: 10.1093/hmg/ddv493
87. Florath I, Butterbach K, Heiss J, Bewerunge-Hudler M, Zhang Y, Schöttker B, et al. Type 2 diabetes and leucocyte DNA methylation: an epigenome-wide association study in over 1,500 older adults. Diabetologia (2016) 59:130–8. doi: 10.1007/s00125-015-3773-7
88. Jeon JP, Koh IU, Choi NH, Kim BJ, Han BG, Lee S. Differential DNA methylation of MSI2 and its correlation with diabetic traits. PLoS ONE (2017) 12:e0177406. doi: 10.1371/journal.pone.0177406
89. Yuan W, Xia Y, Bell CG, Yet I, Ferreira T, Ward KJ, et al. An integrated epigenomic analysis for type 2 diabetes susceptibility loci in monozygotic twins. Nat Commun. (2014) 5:5719. doi: 10.1038/ncomms6719
90. Matsha TE, Pheiffer C, Humphries SE, Gamieldien J, Erasmus RT, Kengne AP. Genome-wide DNA methylation in mixed ancestry individuals with diabetes and prediabetes from south africa. Int J Endocrinol. (2016) 2016:3172093. doi: 10.1155/2016/3172093
91. Aran D, Toperoff G, Rosenberg M, Hellman A. Replication timing-related and gene body-specific methylation of active human genes. Hum Mol Genet. (2011) 20:670–80. doi: 10.1093/hmg/ddq513
92. Bibikova M, Lin Z, Zhou L, Chudin E, Garcia EW, Wu B, et al. High-throughput DNA methylation profiling using universal bead arrays. Genome Res. (2006) 16:383–93. doi: 10.1101/gr.4410706
93. Bibikova M, Le J, Barnes B, Saedinia-Melnyk S, Zhou L, Shen R, et al. Illumina's infinium humanmethylation450 beadchip interrogates more than 485 000 methylation sites and covers 96% of CpG islands and additional island shores and their flanking regions. Epigenomics (2009) 1:177–200.
94. Yvan-Charvet L, Wang N, Tall AR. Role of HDL, ABCA1, and ABCG1 transporters in cholesterol efflux and immune responses. Arterioscler Thromb Vasc Biol. (2010) 30:139–43. doi: 10.1161/ATVBAHA.108.179283
95. Kiffer-Moreira T, Yadav MC, Zhu D, Narisawa S, Sheen C, Stec B, et al. Pharmacological inhibition of PHOSPHO1 suppresses vascular smooth muscle cell calcification. J Bone Miner Res. (2013) 28:81–91. doi: 10.1002/jbmr.1733
96. Bobryshev Y, Orekhov A, Sobenin A, Chistiakov D. Role of bone-type tissue-nonspecific alkaline phosphatase and PHOSPO1 in vascular calcification. Curr Pharm Des. (2014) 20:5821–8. doi: 10.2174/1381612820666140212193011
97. Dunn L, Simpson P, Prosser H, Lecce L, Yuen G, Buckle A, et al. A critical role for thioredoxin- interacting protein in diabetes- related impairment of angiogenesis. Diabetes (2014) 63:675–87. doi: 10.2337/db13-0417
98. Ji W, Chen F, Do T, Do A, Roe BA, Meisler MH. DQX1, an RNA-dependent ATPase homolog with a novel DEAQ box: expression pattern and genomic sequence comparison of the human and mouse genes. Mamm Genome (2001) 12:456–61. doi: 10.1007/s003350020032
99. Edwards PA. Fusion genes and chromosome translocations in the common epithelial cancers. J Pathol. (2010) 220:244–54. doi: 10.1002/path.2632
100. Szabat M, Kalynyak TB, Lim GE, Chu KY, Yang YH, Asadi A, et al. Musashi expression in beta-cells coordinates insulin expression, apoptosis and proliferation in response to endoplasmic reticulum stress in diabetes. Cell Death Dis. (2011) 2:e232. doi: 10.1038/cddis.2011.119
101. Mohn FW, Schübeler D, Roloff T. Methylated DNA immunoprecipitation (MeDIP). Methods Mol Biol. (2009) 507:55–64. doi: 10.1007/978-1-59745-522-0_5
102. Baker RG, Hayden MS, Ghosh S. NF-kappaB, inflammation, and metabolic disease. Cell Metab. (2011) 13:11–22. doi: 10.1016/j.cmet.2010.12.008
103. Nambu H, Fukushima M, Hikichi H, Inoue T, Nagano N, Tahara Y, et al. Characterization of metabolic phenotypes of mice lacking GPR61, an orphan G-protein coupled receptor. Life Sci. (2011) 89:765–72. doi: 10.1016/j.lfs.2011.09.002
104. Garaulet M, Pèrez-Llamas F, Pèrez-Ayala M, Martínez P, de Medina F, Tebar F, et al. Site-specific differences in the fatty acid composition of abdominal adipose tissue in an obese population from a Mediterranean area- relation with dietary fatty acids, plasma lipid profile, serum insulin, and central obesity. Am J Clin Nutr. (2001) 74:585–91. doi: 10.1093/ajcn/74.5.585
105. Hashimoto N, Tanaka T. Role of miRNAs in the pathogenesis and susceptibility of diabetes mellitus. J Hum Genet. (2017) 62:141–50. doi: 10.1038/jhg.2016.150
106. Olsson AH, Volkov P, Bacos K, Dayeh T, Hall E, Nilsson EA, et al. Genome-wide associations between genetic and epigenetic variation influence mRNA expression and insulin secretion in human pancreatic islets. PLoS Genet. (2014) 10:e1004735. doi: 10.1371/journal.pgen.1004735
107. Dayeh TA, Olsson AH, Volkov P, Almgren P, Rönn T, Ling C. Identification of CpG-SNPs associated with type 2 diabetes and differential DNA methylation in human pancreatic islets. Diabetologia (2013) 56:1036–46. doi: 10.1007/s00125-012-2815-7
108. Voisin S, Almen MS, Zheleznyakova GY, Lundberg L, Zarei S, Castillo S, et al. Many obesity-associated SNPs strongly associate with DNA methylation changes at proximal promoters and enhancers. Genome Med. (2015) 7:103. doi: 10.1186/s13073-015-0225-4
109. Hattersley AT. Prime suspect: the TCF7L2 gene and type 2 diabetes risk. J Clin Invest. (2007) 117:2077–9. doi: 10.1172/JCI33077
110. Saxena R, Hivert MF, Langenberg C, Tanaka T, Pankow JS, Vollenweider P, et al. Genetic variation in GIPR influences the glucose and insulin responses to an oral glucose challenge. Nat Genet. (2010) 42:142–8. doi: 10.1038/ng.521
111. Unoki H, Takahashi A, Kawaguchi T, Hara K, Horikoshi M, Andersen G, et al. SNPs in KCNQ1 are associated with susceptibility to type 2 diabetes in East Asian and European populations. Nat Genet. (2008) 40:1098–102. doi: 10.1038/ng.208
112. Kilpelainen TO, Lakka TA, Laaksonen DE, Lindstrom J, Eriksson JG, Valle TT, et al. SNPs in PPARG associate with type 2 diabetes and interact with physical activity. Med Sci Sports Exerc. (2008) 40:25–33. doi: 10.1249/mss.0b013e318159d1cd
113. Muller YL, Piaggi P, Hoffman D, Huang K, Gene B, Kobes S, et al. Common genetic variation in the glucokinase gene (GCK) is associated with type 2 diabetes and rates of carbohydrate oxidation and energy expenditure. Diabetologia (2014) 57:1382–90. doi: 10.1007/s00125-014-3234-8
114. Qin L, Zhou L, Wu X, Cheng J, Wang J, Du Y, et al. Genetic variants in protein kinase C zeta gene and type 2 diabetes risk: a case-control study of a Chinese Han population. Diabetes Metab Res Rev. (2008) 24:480–5. doi: 10.1002/dmrr.882
115. Bento J, Palmer N, Mychaleckyj J, Lange L, Langefeld C, Rich S, et al. Association of protein tyrosine phosphatase 1B gene polymorphisms with type 2 diabetes. Diabetes. (2004) 53:3007–12. doi: 10.2337/diabetes.53.11.3007
116. Xu Y, Wang W, Zhang L, Qi LP, Li LY, Chen LF, et al. A polymorphism in the ABCG1 promoter is functionally associated with coronary artery disease in a Chinese Han population. Atherosclerosis (2011) 219:648–54. doi: 10.1016/j.atherosclerosis.2011.05.043
117. Talbert ME, Langefeld CD, Ziegler J, Mychaleckyj JC, Haffner SM, Norris JM, et al. Polymorphisms near SOCS3 are associated with obesity and glucose homeostasis traits in hispanic Americans from the insulin resistance atherosclerosis family study. Hum Genet. (2009) 125:153–62. doi: 10.1007/s00439-008-0608-3
118. Eberle D, Clement K, Meyre D, Sahbatou M, Vaxillaire M, Le Gall A, et al. SREBF-1 Gene polymorphisms are associated with obesity and type 2 diabetes in french obese and diabetic cohorts. Diabetes (2004) 53:2153–7. doi: 10.2337/diabetes.53.8.2153
119. Van Greevenbroek M, Vermeulen V, Feskens E, Evelo C, Kruijshoop M, Hoebee B, et al. Genetic variation in thioredoxin interacting protein (TXNIP) is associated with hypertriglyceridaemia and blood pressure in diabetes mellitus. Diabetic Med. (2007) 24:498–504. doi: 10.1111/j.1464-5491.2007.02109.x
120. Wiltshire EJ, Pena AS, MacKenzie K, Bose-Sundernathan T, Gent R, Couper JJ. A NOS3 polymorphism determines endothelial response to folate in children with type 1 diabetes or obesity. J Pediatr. (2015) 166:319–25 e1. doi: 10.1016/j.jpeds.2014.10.050
121. Nathan C, Xie Q. Nitric oxide synthases: roles, tolls, and controls. Cell (1994) 78:915–8. doi: 10.1016/0092-8674(94)90266-6
122. Lisanti S, Omar WA, Tomaszewski B, De Prins S, Jacobs G, Koppen G, et al. Comparison of methods for quantification of global DNA methylation in human cells and tissues. PLoS ONE (2013) 8:e79044. doi: 10.1371/journal.pone.0079044
123. Jiang D, Zheng D, Wang L, Huang Y, Liu H, Xu L, et al. Elevated PLA2G7 gene promoter methylation as a gender-specific marker of aging increases the risk of coronary heart disease in females. PLoS ONE (2013) 8:e59752. doi: 10.1371/journal.pone.0059752
124. Burghardt KJ, Pilsner JR, Bly MJ, Ellingrod VL. DNA methylation in schizophrenia subjects: gender and MTHFR 677C/T genotype differences. Epigenomics (2012) 4:261–8. doi: 10.2217/epi.12.25
125. Szalat A, Raz I. Gender-specific care of diabetes mellitus: particular considerations in the management of diabetic women. Diabetes Obes Metab. (2008) 10:1135–56. doi: 10.1111/j.1463-1326.2008.00896.x
126. Cuyàs E, Fernández-Arroyo S, Verdura S, García RÁ, Stursa J, Werner L, et al. Metformin regulates global DNA methylation via mitochondrial one-carbon metabolism. Oncogene (2017) 37:963–70. doi: 10.1038/onc.2017.367
127. Jaffe AE, Irizarry RA. Accounting for cellular heterogeneity is critical in epigenome-wide association studies. Genome Biol. (2014) 15:R31. doi: 10.1186/gb-2014-15-2-r31
128. Houseman EA, Accomando WP, Koestler DC, Christensen BC, Marsit CJ, Nelson HH, et al. DNA methylation arrays as surrogate measures of cell mixture distribution. BMC Bioinf. (2012) 13:86. doi: 10.1186/1471-2105-13-86
129. Nishiguchi T, Imanishi T, Akasaka T. MicroRNAs and cardiovascular diseases. Biomed Res Int. (2015) 2015:682857. doi: 10.1155/2015/682857
Keywords: global DNA methylation, gene-specific DNA methylation, genome-wide DNA methylation, blood, type 2 diabetes, biomarkers
Citation: Willmer T, Johnson R, Louw J and Pheiffer C (2018) Blood-Based DNA Methylation Biomarkers for Type 2 Diabetes: Potential for Clinical Applications. Front. Endocrinol. 9:744. doi: 10.3389/fendo.2018.00744
Received: 01 October 2018; Accepted: 23 November 2018;
Published: 04 December 2018.
Edited by:
Anna Alisi, Bambino Gesù Ospedale Pediatrico (IRCCS), ItalyReviewed by:
Angela Lombardi, Albert Einstein College of Medicine, United StatesCopyright © 2018 Willmer, Johnson, Louw and Pheiffer. This is an open-access article distributed under the terms of the Creative Commons Attribution License (CC BY). The use, distribution or reproduction in other forums is permitted, provided the original author(s) and the copyright owner(s) are credited and that the original publication in this journal is cited, in accordance with accepted academic practice. No use, distribution or reproduction is permitted which does not comply with these terms.
*Correspondence: Tarryn Willmer, dGFycnluLndpbGxtZXJAbXJjLmFjLnph
Disclaimer: All claims expressed in this article are solely those of the authors and do not necessarily represent those of their affiliated organizations, or those of the publisher, the editors and the reviewers. Any product that may be evaluated in this article or claim that may be made by its manufacturer is not guaranteed or endorsed by the publisher.
Research integrity at Frontiers
Learn more about the work of our research integrity team to safeguard the quality of each article we publish.