 Hui Liu
 Weijing Wang
 Caixia Zhang
 Chunsheng Xu
 Haiping Duan
 Xiaocao Tian
 Dongfeng Zhang
- 1Department of Epidemiology and Health Statistics, Public Health College, Qingdao University, Qingdao, China
- 2Qingdao Municipal Centre for Disease Control and Prevention, Qingdao, China
Dyslipidemia represents a strong and independent risk factor for cardiovascular disease. Plasma cholesterol, such as total cholesterol (TC), low density lipoprotein cholesterol (LDL-C), and high density lipoprotein cholesterol (HDL-C), is the common indicator of diagnosing dyslipidemia. Here based on 382 Chinese twin pairs, we explored the magnitude of genetic impact on TC, HDL-C, LDL-C variation and further searched for genetic susceptibility loci for them using genome-wide association study (GWAS). The ACE model was the best fit model with additive genetic parameter (A) accounting for 26.6%, common or shared environmental parameter (C) accounting for 47.8%, unique/non-shared environmental parameter (E) accounting for 25.6% for the variance in HDL-C. The AE model was the best fit model for TC (A: 61.4%; E: 38.6%) and LDL-C (A: 65.5%; E: 34.5%). While no SNPs reached the genome-wide significance level (P < 5 × 10⁻⁸), 8, 14, 9 SNPs exceeded the suggestive significance level (P < 1 × 10⁻⁵) for TC, HDL-C, LDL-C, respectively. The promising genetic regions for TC, HDL-C, LDL-C were on chromosome 11 around rs7107698, chromosome 5 around rs12518218, chromosome 2 around rs10490120, respectively. Gene-based analysis found 1038, 1033 and 1090 genes nominally associated with TC, HDL-C, LDL-C (P < 0.05), especially FAF1, KLKB1 for TC, KLKB1 for HDL-C, and NTRK1, FAF1, SNTB2 for LDL-C, respectively. The number of common related genes among TC, HDL-C and LDL-C was 71, including FAF1, KLKB1, etc. Pathway enrichment analysis discovered known related pathways-zinc transporters, metal ion SLC transporters for TC, cell adhesion molecules CAMs, IL-6 signaling for HDL, FC epsilon RI signaling pathway, NFAT pathway for LDL, respectively. In conclusion, the TC and LDL-C level is moderately heritable and the HDL-C level is lowly heritable in Chinese population. The genomic loci, functional genes and pathways are identified to account for the heritability of plasma cholesterol level. Our findings provide important insights into plasma cholesterol molecular physiology and expect future research to replicate and validate our results.
Introduction
Dyslipidemia represents a strong and independent risk factor for cardiovascular disease (1), a leading cause of death worldwide (2, 3). Besides, many studies indicate that dyslipidemia can increase the risk of preeclampsia, colorectal cancer, diabetic macular edema and polycystic ovary syndrome (4–7). The prevalence of dyslipidemia is high and is increasingly prevalent in China (8, 9). Plasma cholesterol, such as total cholesterol (TC), low density lipoprotein cholesterol (LDL-C), high density lipoprotein cholesterol (HDL-C), is a common indicator of diagnosing dyslipidemia. Therefore, exploring factors affecting plasma cholesterol homeostasis is a crucial step toward providing early prevention and therapeutic targets for dyslipidemia.
The plasma cholesterol level is mediated by a combination of genetic and environmental factors. At present, the heritability for plasma cholesterol level has been estimated in several studies, with the heritability of TC, HDL-C, LDL-C level ranging from 0 to 89% (10–13), 22 to 93% (13–16), and 22 to 91% (10, 13, 16, 17), respectively. Additionally, several genome-wide association studies (GWAS) have attempted to find susceptible genetic loci located in the corresponding gene affecting plasma cholesterol level. A GWAS conducted by Middelberg RP et al. (18) for plasma cholesterol found genes LPL, LIPC, CETP associated with HDL-C level and CELSR2, APOB, TOMM40 with LDL-C level. Another two GWAS studies identified SRGAP2, HOXC13 and CD47, DUSP4 that were associated with HDL-C and TC level, respectively (19, 20).
However, the known genetic variations only explain a small proportion of the genetic contribution and many potential genetic genes and loci remain to be discovered. Besides, allele frequencies, life style and environmental contributions differ between Chinese and other ethnic populations. Twin samples will have a higher power in genetic study, especially in human complex diseases (21). Here based on 382 Chinese twin pairs, we explored the genetic effect on TC, HDL-C, LDL-C variation and further searched for genetic susceptibility loci for these traits using GWAS (22).
Materials and Methods
Twin Samples Collection and Phenotypic Measurement
The twin samples were collected from Qingdao Twin Registry and the details can be found in the literatures (23, 24). Twins who were pregnancy and lactation, as well as incomplete co-twin pairs were excluded. Twin pairs that taking cholesterol-lowering drugs also were excluded. The study included 382 twin pairs for heritability analysis and 139 dizygotic (DZ) twin pairs for GWAS with a mean age of 51.6 ± 7.7. All twin samples undertook the blood sampling and a physical examination after a 10–12 h overnight fast and completed a questionnaire. The zygosity of same sex and blood type was identified by using 16 multiple short tandem sequence repeat DNA markers (25, 26). According to the standard procedure using an automatic biochemical analyzer (Hitachi 7600; Hitachi, Tokyo, Japan), we tested participants' fasting blood cholesterol sample in the Qingdao Diabetes Hospital. Friedewald equation was used to calculate the LDL-C level: LDL-C (mmol/L) = TC–HDL-C–(TG/2.2) (mmol/L) (27).
The Regional Ethics Committee of the Qingdao CDC Institutional Review Boards approved this study and the ethical principles followed the Helsinki Declaration. All subjects signed the written informed consent.
Genotyping, Imputation, and Quality Control
Genome-wide SNPs were genotyped using the Illumina's InfiniumOmni2.5Exome-8v1.2 Bead-Chip platform. We performed stringent genotype quality control procedures: locus missing (<0.05), minor allele frequency (MAF > 0.05), call rate (>0.98), and Hardy-Weinberg Equilibrium (HWE > 1 × 10⁻⁴). The final number of SNPs included in the subsequent GWAS analysis was 1,365,181.
We used the IMPUTE2 (28) software to impute un-typed SNPs using the LD information from 1,000 Genomes Project Phase 3 reference panel (29) (CHS N = 171 and CHB N = 142). We used R2 > 0.6, MAF > 0.05 and HWE > 1 × 10⁻⁴ to filter the imputed data, and the 7,405,822 SNPs were used to explore the association with plasma cholesterol level.
Statistical Analysis
Heritability
Data preparation and statistical description were performed with SPSS version 22.0. We used the structural equation models (SEM) to evaluate the genetic variance components with Mx software1. The Blom's formula was used to guarantee the normal distribution or approximate normal distribution because of the deviation of the distribution of all indicators. Pearson's product-moment correlation coefficient was used to calculate intra-class phenotypic correlations. The correlation in MZ twins was significantly higher than DZ twins, reflecting the importance of genetic effects in plasma cholesterol levels.
The total phenotypic variance could be decomposed to additive genetic variance (A), common or shared environmental variance (C), and unique/non-shared environmental variance (E). The full ACE model was firstly fitted, the likelihood-ratio χ2-test was applied to test whether the contributions of A or C to the model had statistical significance by comparing the full model (ACE) and their nested models (CE and AE). The Akaike information criterion (AIC), which is equal to the goodness-of-fit χ2-value minus twice the degrees of freedom, was used to indicate the parsimony of each model and a lower AIC indicated a better fit. Heritability (h2) was calculated in the best-fitting model based on the ratio of additive genetic variation to total phenotypic variation, with adjusting for the effect of age, sex and education level. We calculated the power of twin pairs for additive genetic influences by Mx software, and the calculation results showed that the power of our heritability analysis was above 90%.
GWAS
SNPs-based analysis
We used the genome-wide efficient mixed-model association (GEMMA) to test the association between plasma cholesterol level and SNP genotypes after adjusting for the following covariates: sex, age, and education level (30). We used Quantile-quantile (Q-Q) and Manhattan plots to illustrate overall significance level (P < 5 × 10⁻⁸) and suggestive level (P < 1 × 10⁻⁵) autosomal and chromosomal X SNPs (31). In addition, we analyzed the enrichment of cell-type enhancers for the typed GWAS results of the regulatory domains outside the coding regions by using online HaploReg v4.1 software2 (32, 33). SNPs with P < 1 × 10⁻⁵ were selected as query SNPs, and an uncorrected P < 0.05 for enrichments of cell-type enhancers were reported.
Gene-based analysis
The gene-based analysis integrated all SNPs within a gene to increase the signal or strength of association, which correcting for linkage disequilibrium (LD) and gene size. The gene-based test was implemented in Versatile Gene-based Association Study-2 (VEGAS2)3 which uses 1000 Genomes data to simulate the correlations of SNPs across the autosomes and chromosome X. (34, 35). We used SNPs from “1000G East ASIAN Population”. The genome-wide significant gene for the association was defined as P < 2.63 × 10⁻⁶ (0.05/19,001) as 19,001 genes being evaluated.
Pathway enrichment analysis
We used PASCAL to compute pathway-scored (36–38). In this approach, genetic markers SNPs were first mapped to genes, and the association scores of all genes in the pathway were computed. We then combined the genes scores of the same pathways to calculate the pathway scores. We used chi-squared or empirical score to evaluate pathway enrichment of high-scoring (possibly fused) genes, avoiding any standard binary enrichment tests with inherent P-value thresholds. Pathways and their corresponding gene annotation were obtained from KEGG, Reactome, and Biocarta (as defined in MSigDB)4.
Results
Heritability
The final sample consisted of 382 twin pairs for heritability analysis and 139 DZ twin pairs for GWAS analysis with a mean age of 51.6 ± 7.7. The mean value ± SD of TC, HDL-C, LDL-C level for all subjects was 4.9 ± 1.2 umol/L, 1.5 ± 0.5 umol/L, 2.8 ± 0.9 umol/L, respectively (Supplemental Table 1). MZ twin correlations for TC (rMZ = 0.61, 95%CI: 0.52–0.68), HDL-C (rMZ = 0.74, 95%CI: 0.68–0.79), LDL-C (rMZ = 0.65, 95%CI: 0.57–0.72) level were all larger than DZ twin correlations (rDZ = 0.35, 95%CI: 0.21–0.47; rDZ = 0.61, 95%CI: 0.50–0.70; rDZ = 0.35, 95%CI: 0.21–0.46), respectively, indicating the existence of genetic effects (Supplemental Table 2). The full ACE model was first determined and then the likelihood ratio test and AIC was applied to choose the nested models. Finally, the ACE model was the best fit model with A accounting for 26.6% (95% CI: 7.9–48.9), C accounting for 47.8% (95% CI: 26.3–64.6), E accounting for 25.6% (95% CI: 20.8–31.6) for the variance in HDL-C level. The best fit model for TC level was AE model with A accounting for 61.4% (95% CI: 53.2–68.3), E accounting for 38.6% (95% CI: 31.7–46.8) and for LDL-C level was also AE model with A accounting for 65.5% (95% CI: 57.9–71.8), E accounting for 34.5% (95% CI: 28.2–42.2) (Table 1).
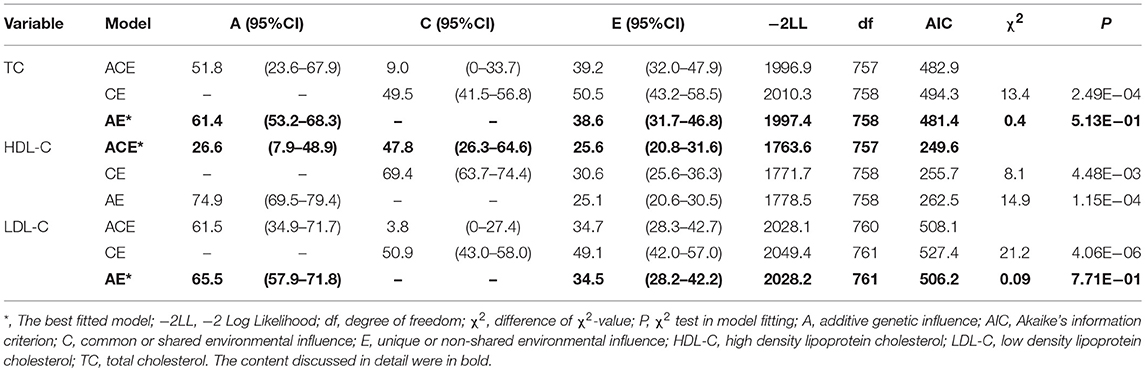
Table 1. Model fit and proportion of variance for TC, HDL-C, LDL-C level accounted by genetic and environmental parameters.
GWAS
SNPs-Based Analysis
TC level
A sample of 139 DZ twin pairs including 1,365,181 qualified SNPs was included for the present GWAS. The Q-Q plot about TC level illustrated the relationship between the observed and expected GWAS P-values (Supplemental Figure 1). The genomic inflation factor (λ-statistic = 1) revealed no evidence of inflation of the test statistics due to population stratification. And weak association was shown due to the slight deviation in the upper right tail from the null distribution. No SNPs reached the genome-wide significance level (P < 5 × 10⁻⁸) as illustrated in Manhattan plot (Supplemental Figure 2). However, there were 8 SNPs exceeding the threshold for suggestive significance level (P < 1 × 10⁻⁵) (Supplemental Table 3). The strongest association SNP was rs7107698 (P = 2.29 × 10⁻⁶). As the locus zoom plots illustrated, one chromosomal loci 11p15.4 showed nominal association with TC level (Supplemental Figure 3). Four SNPs (P = 2.29 × 10⁻⁶ to 2.45 × 10⁻⁶) were located at AMPD3 gene on chromosome 11p15.4. By HaploReg v4.1, three cell-type specific enhancers (uncorrected P < 0.05) of primary neutrophils from peripheral blood (P = 0.04), ovary (P = 0.04) and NHDF-Ad adult dermal fibroblast primary cells (P = 0.01) were identified for TC level (Supplemental Table 4).
HDL-C level
The Q-Q plot about HDL-C level was shown in Figure 1. None of the SNPs reached the genome-wide significance level (P < 5 × 10⁻⁸) as illustrated in Manhattan plot (Figure 2). However, there are 14 SNPs exceeding the threshold for suggestive significance level (P < 1 × 10⁻⁵) (Table 2). The strongest association SNP was kgp6737496 (rs199929635) (P = 7.10 × 10⁻⁷). Chromosomal loci 5q14.1 showed suggestive association with HDL-C level, which including kgp6737496 (rs199929635), rs12518218, rs7729225 near LOC101929154 genes (Figure 3).
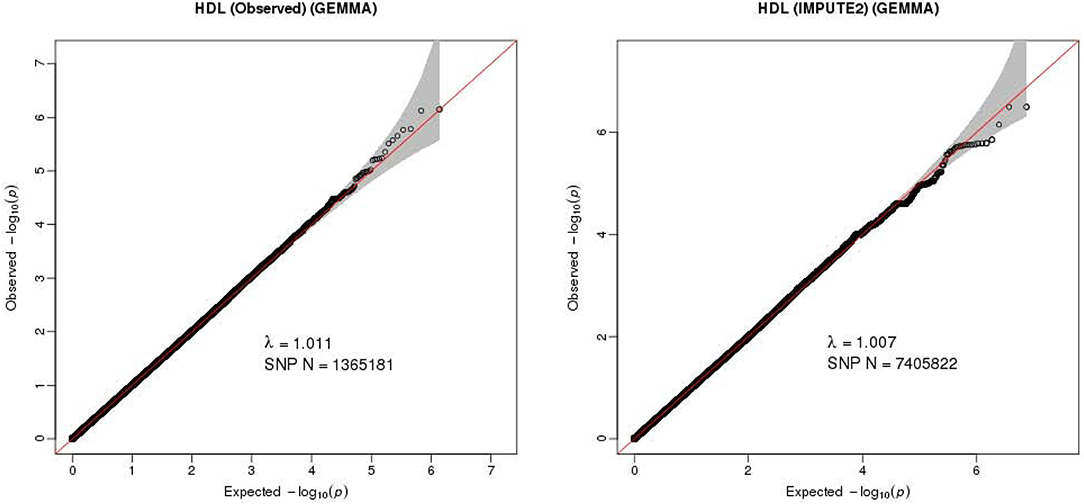
Figure 1. Quantile-quantile plot for quality control check and visualizing crude association for genome-wide association study of HDL-C level. The x-axis shows the –log10 of expected P-values of association from chi-square distribution and the y-axis shows the –log10 of P-values from the observed chi-square distribution. The black dots represent the observed data, and the red line is the expectation under the null hypothesis of no association.
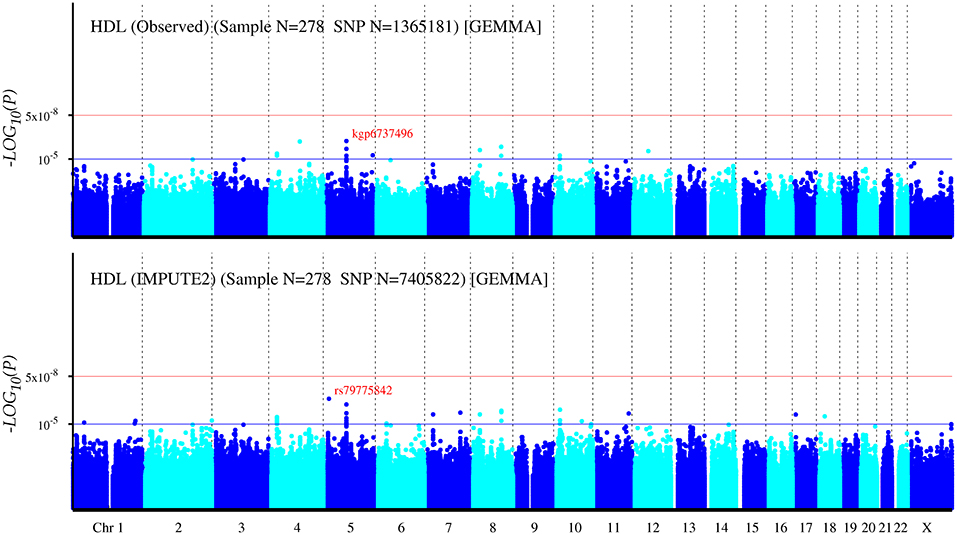
Figure 2. Manhattan plot for genome-wide association study of HDL-C level. The x-axis shows the numbers of autosomes and the X chromosome, and the y-axis shows the –log10 of P-values for statistical significance. The dots represent the SNPs. None of the SNPs reached the genome-wide significance level (P < 5 × 10⁻⁸).
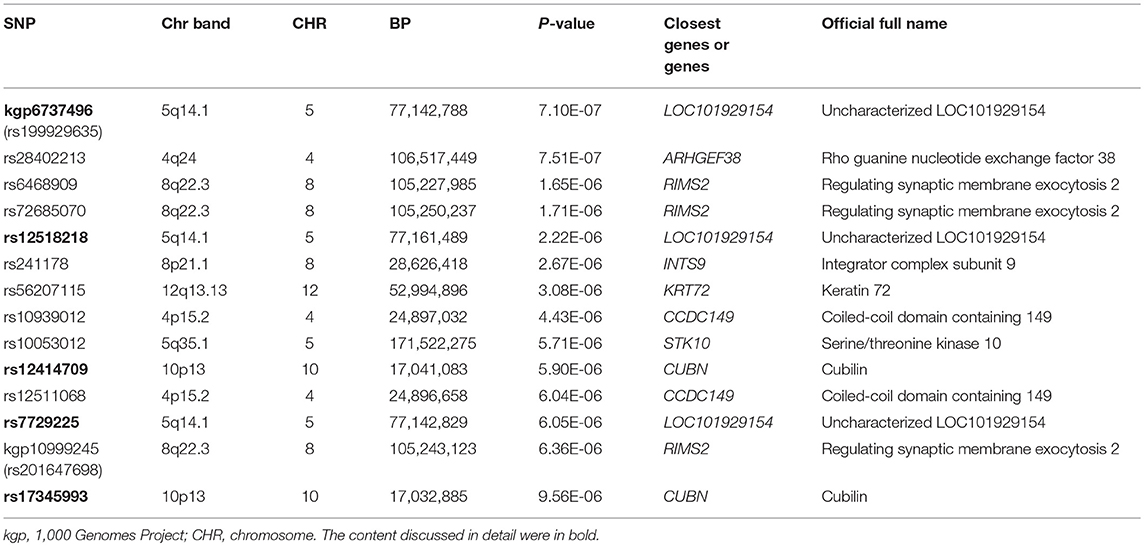
Table 2. The summary of SNPs with P < 1 × 10⁻⁵ for association with HDL-C in typed GWAS data.
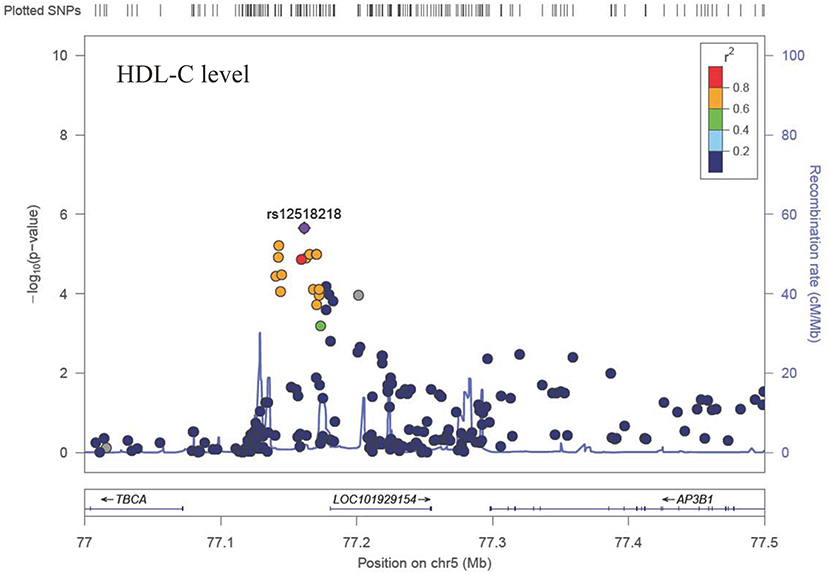
Figure 3. Regional association plot showing signal around chromosomal loci of 5q14.1 for genome-wide association study of HDL-C level.
LDL-C level
The Q-Q plot about LDL-C level was shown in Supplemental Figure 4. None of the SNPs reached the genome-wide significance level (P < 5 × 10⁻⁸) as illustrated in Manhattan plot (Supplemental Figure 5). However, there are 9 SNPs exceeding the threshold for suggestive significance level (P < 1 × 10⁻⁵) (Supplemental Table 5). The strongest association SNP was rs10490120 (P = 1.11 × 10⁻⁶). At chromosomal loci 2p16.3, four SNPs rs10490120, rs4953640, rs74263479, rs17037869 were positioned closest to FSHR gene that was involved in follicle stimulating hormone receptor (Supplemental Figure 6). HUES6 cells (P = 0.01), HUES64 cells (P = 0.01) and iPS-18 cells (P = 0.01) were confirm as cell-type specific enhancers for LDL-C level (Supplemental Table 6).
Imputation
To maximize the identification of new risk variants, we imputed typed SNPs using 1,000 Genomes Project Phase 3 as the reference panel. Manhattan plots for all post-imputation variants showed none evidence of genome-wide significance level (P < 5 × 10⁻⁸) (Figure 2; Supplementary Figures 2, 5). However, there were 39, 55, and 59 SNPs exceeding the threshold for suggestive significance level (P < 1 × 10⁻⁵) for TC, HDL-C, and LDL-C, respectively. The strongest associations were rs77348447, rs79775842, rs56047090 for TC, HDL-C, LDL-C, respectively (Supplemental Tables 7–9).
We also compared our post-imputation results with 34,421 East Asians lipids GWAS meta-analysis results5 And 32 SNPs located in genes RGS5, OSBPL10, ADGRB3, PSMB7, SRSF8 for TC level, 50 SNPs located in genes KAZN, LOC105378657, LOC105373529, LOC105373941, BIN3, LINC02153, LDHAL6CP for HDL-C level, 39 SNPs located in genes VPS13D, IGF2BP2, PSMB7, CA10, NECTIN2, APOE, APOC1, TOMM40 for LDL-C level could be replicated (Supplemental Table 10).
Gene-Based Analysis
In the gene-based analysis, none genes were found to achieve genome-wide significance level and the number of genes that were nominally associated with TC, HDL-C, LDL-C level was 1,038, 1,033, and 1,090, respectively (P < 0.05). The top 20 genes were ranked by their P values (TC: Supplemental Table 11, HDL-C: Table 3, LDL-C: Supplemental Table 12). LOC101929154, RIMS2, INTS9, KRT72, CCDC149, CUBN genes for HDL-C level and AMPD3, ABR genes for TC level had already been shown in the suggestive level SNPs-based analysis, whereas the other genes were novel.
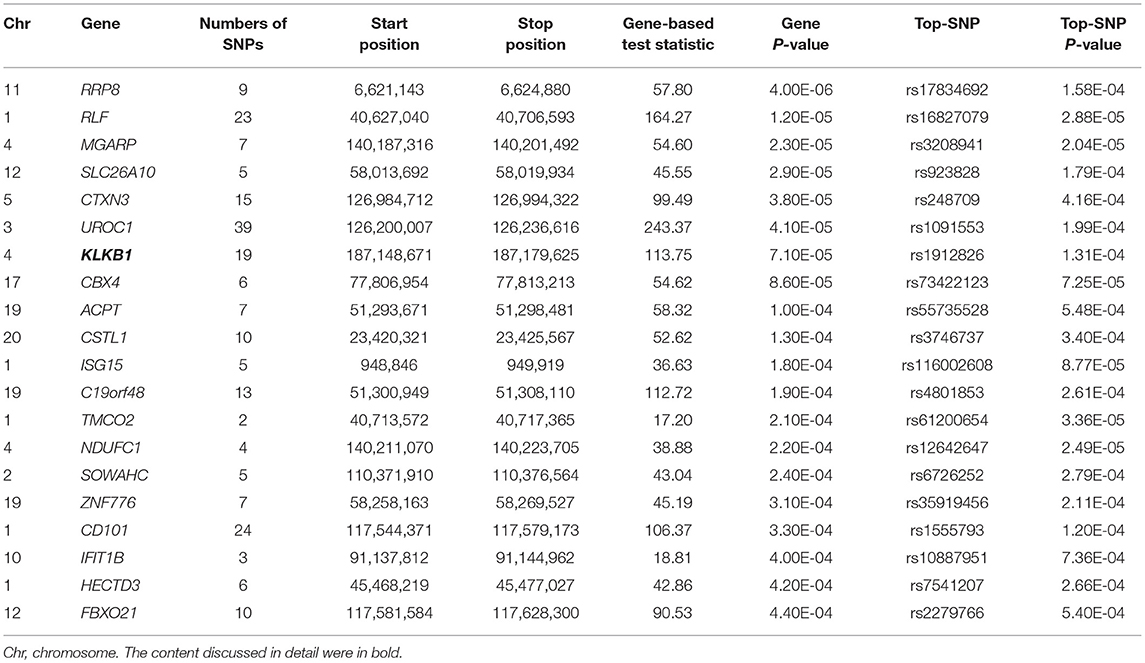
Table 3. The top 20 genes from VEGAS2 gene-based analysis showing the strongest association with HDL-C level (P < 0.05) in typed GWAS data.
The number of common nominally associated genes (P < 0.05) between TC VS HDL-C level, TC VS LDL-C level, HDL-C VS LDL-C level was 195, 504, 91, respectively. And 71 common genes were found among the three traits (Supplemental Table 13).
Pathway Enrichment Analysis
PASCAL program was used in the pathway enrichment analysis. The number of pathways that were nominally associated with TC, HDL-C, and LDL-C level was 816, 529, and 813, respectively (P < 0.05). The top 20 pathways were ranked by their emp-P-values (TC: Supplemental Table 14; HDL-C: Table 4; LDL-C: Supplemental Table 15). The Q-Q plots were shown in Supplemental Figures 7–9. Pathway analysis revealed several biological processes significantly associated with TC level: zinc transporters, metal ion SLC transporters, ERKS ARE inactivated, MAPK targets nuclear events mediated by map kinases, ERK MAPK targets, transport of glucose and other sugars bile salts and organic acids metal ions and amine compounds, amino acid transport across the plasma membrane, etc.
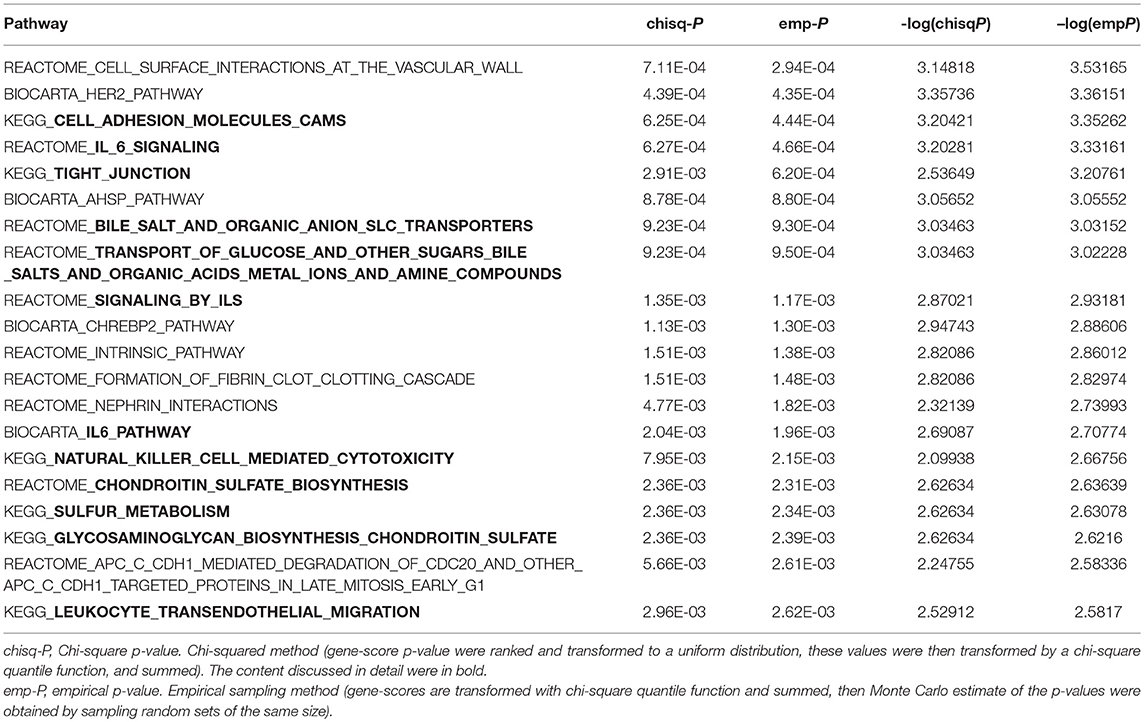
Table 4. The top 20 pathway results-KEGG, Reactome, and Biocarta (emp-P < 0.05) using PASCAL program for HDL-C level in typed GWAS data.
Several biological pathways significantly related to HDL-C levels emerged: cell adhesion molecules CAMs, IL-6 signaling, tight junction, bile salt and organic anion SLC transporters, transport of glucose and other sugars bile salts and organic acids metal ions and amine compounds, signaling by ILS, IL6 pathway, natural killer cell mediated cytotoxicity, sulfur metabolism, chondroitin sulfate biosynthesis, glycosaminoglycan biosynthesis chondroitin sulfate, leukocyte transendothelial migration, etc.
The pathways associated with LDL-C involved: FC epsilon RI signaling pathway, NFAT pathway, metabolism of amino acids and derivatives, ERBB signaling pathway, IL1R pathway, HIV infection, etc.
Discussion
Heritability
Our investigation was based on 382 twin pairs to explore the heritability of TC, HDL-C, LDL-C level, and confirmed the genetic variants underlying these trait by GWAS. The correlation in MZ twins was significantly higher than DZ twins, which reflected the existence of genetic variance in TC, HDL-C, LDL-C levels (Supplemental Table 2). The ACE model was the best fit model with A accounting for 26.6%, C accounting for 47.8%, E accounting for 25.6% for the variance in HDL-C level. The best fit model for TC level was AE model with A accounting for 61.4%, E accounting for 38.6% and for LDL-C level was also AE model with A accounting for 65.5%, E accounting for 34.5% (Table 1). The magnitude of the additive genetic components (A) for TC level obtained here was in line with several previous twin studies (15, 16, 27, 39–47). HDL-C level is close to some other twin studies (11, 14, 27, 48, 49). LDL-C level is similar to the others (27, 42, 43, 45, 47, 50).
GWAS
SNP-Based Analysis
TC level.
While no genome-wide significant SNPs were found in GWAS for TC level, one SNP rs7107698 on chromosome 11 was found as promising genetic regions. The AMPD3 gene around the rs7107698 has been linked to the TC level. Adenosine monophosphate deaminase 3 (AMPD3) is an enzyme that catalyzes the hydrolytic deamination of adenosine monophosphate to inosine monophosphate and participates in the pathway of adenylate catabolic (51). The activation of AMP deaminase leads to the increase of uric acid and the production of mitochondrial oxidative stress, which further stimulates the formation of de novo lipogenesis and the activation of ATP-citrate lyase and the synthesis of long-chain saturated fatty acids and eventually affects TC level (52, 53). Additionally, three highly correlated SNPs (rs4909928, rs12184411, kgp6520322) were detected within AMPD3 gene, showing suggestive evidence of association with TC level.
HDL-C level.
This cluster of suggestive SNPs (kgp6737496, rs12518218, rs7729225) is linked to LOC101929154, a non-coding RNA. Although we have not fully elucidated the biological function of this ncRNA, mutations in base pairs may affect their regulatory domain to regulate HDL-C levels. Another gene CUBN including suggestive SNPs rs12414709 and rs17345993 has been linked to HDL-C metabolism (54). Cubilin (CUBN) encodes high affinity HDL-C and lipid-poor apoA-I endocytosis receptor, which participate in the renal clearance of filterable apolipoprotein AI/HDL-C (55, 56).
LDL-C level
SNPs rs10490120, rs4953640, rs74263479, rs17037869 were included in the FSHR gene. Follicle stimulating hormone receptor (FSHR) may interact with FSH in human hepatic tissue, which can elevate LDL-C level by blocking the expression of LDLR (57, 58). Another KCNK9 around the suggestive SNP rs13251143 also has evidence for dyslipidemia. A great deal of studies has shown that KCNK9 gene is associated with obesity, HDL-C, adiponectin levels and aldosterone production (59–61). All the above factors are related to dyslipidemia (62–64).
As for cell-type enhancers, the relationship between TC level and ovary has been studied. Women with polycystic ovary syndrome had higher TC and LDL-C level, lower HDL-C level (65, 66). Many studies have showed that Estrogen Receptor 1 (ESR1) is associated with TC, HDL-C, LDL-C level (67).
Imputation
Genotype imputation substantially increases available SNPs for analysis in GWAS. Substantive SNPs introduced by imputation reached the suggestive level associated with cholesterol. SNPs rs17578959 and rs28845526 were located in the PID1 gene, which served as the regulator of the LDLR-related protein 1 (LRP1) function and controlled the processing of postprandial lipoproteins (68). Solute Carrier Family 13 Member 1 (SLC13A1) gene can regulate the cholesterol level by participating in transport of glucose and other sugars, bile salts and organic acids, metal ions and amine compounds pathways.
As additional replication, we cross-referenced our post-imputation results with 34,421 East Asians lipids GWAS meta-analysis results (Supplemental Table 10). A list of SNPs could be replicated, especially the SNPs located in the relevant genes, eg. RGS5, OSBPL10, SRSF8 for TC level, KAZN, LOC105378657, LOC105373529, LOC105373941, BIN3, LINC02153, LDHAL6CP for HDL-C level, VPS13D, IGF2BP2, PSMB7, CA10, NECTIN2, APOE, APOC1, TOMM40 for LDL-C level.
Gene-Based Analysis
TC level
Fas Associated Factor 1 (FAF1) can inhibit the activation of NF-kB by interfering with the assembly of IêB kinase (IKK) complex and impeding the nuclear translocation of NF-kB RelA in stimulation-dependent manner. NF-kB signaling pathway is closely related to inflammation (69–71). Epidemiology investigations have revealed that inflammation is associated with a risk of dyslipidemia (72, 73). Lamina C et al. found that Kallikrein B1 (KLKB1) was associated with apolipoprotein A-IV concentrations in a genome-wide association meta-analysis. Apolipoprotein A-IV acting as a major component of HDL-C and chylomicron particles participates in reverse cholesterol transport (74).
HDL-C level
Kallikrein B1 (KLKB1) has been studied in a genome-wide association meta-analysis on apolipoprotein A-IV concentrations. Apolipoprotein A-IV acting as a major component of HDL-C and chylomicron particles participates in reverse cholesterol transport (74).
LDL-C level
Neurotrophic Receptor Tyrosine Kinase 1 (NTRK1) encodes the neurotrophic tyrosine kinase receptor (NTKR) family members, which are related to classical mitogen-activated protein kinases (MAPK) signaling pathways (75). Further, MAP signaling pathways participated in lipid metabolism (76). Syntrophin Beta 2 (SNTB2) suggestes a role in ERK and SR-BI level, and sphingomyelin metabolism in obesity and have been proved to affect the activity of ABCA1 by stabilizing ABCA1 protein, which affect the catabolism of LDL-C level (77–79). Fas Associated Factor 1 (FAF1) also plays a key role in regulating the LDL-C level (69–71).
Pathway Enrichment Analysis
TC level
Pathway analysis revealed several biological processes significantly associated with TC level: zinc transporters, metal ion SLC transporters, immune system, regulation of transport. Other novel pathways especially top 20 may also be interesting potential candidates for future research and validation.
(1) Zinc serves as a catalytic or structural cofactor for many different proteins and participates in the formation and function of enzyme. One study in young Finns (6–18 years) reported that serum Zinc was positively correlated with TC level (80). (2) Six SLC gene families encode proteins which mediate transport of metals. Transition metal ion such as vanadium, iron, can influence the serum lipid and lipoprotein profiles (81, 82). (3) ERKS ARE inactivated, MAPK targets nuclear events mediated by map kinases and ERK MAPK targets participate in the immune system pathway. Immune system is also associated with cholesterol level. Acute phase conditions and immune disorders promote the decrease of HDL-C and change the composition and size of HDL-C (83). (4) Transport of glucose and other sugars bile salts and organic acids metal ions and amine compounds and amino acid transport across the plasma membrane participate in regulation of transport. Several genes (GAS6, GPLD1, PRKCE, WNK1, ESR1, RAC2, FAF1, FFAR1, RNASEL, GCK, SLC30A8, RARRES2, TLR5, TLR1, ACSL3, ABCA7, Th17) enriching in pathway of regulation of transport have been clarified the association with cholesterol level.
HDL level
Several biological pathways significantly related to HDL-C levels include: cell adhesion molecules CAMs, tight junction, chondroitin sulfate biosynthesis, sulfur metabolism, immune system, regulation of transport.
(1) An increased CAMs expression may be a mechanism that decreases plasma HDL-C level (84). (2) Zonulin, a physiological mediator of tight intercellular junctions reversibly regulates intestinal permeability to reduce the level of HDL-C (85). (3) Animal experiments have shown that chondroitin-6-sulfate can reduce plasma LDL-C (86). (4) Sulfur-containing compounds are generally associated with an unfavorable lipid profile (87). (5) IL-6 signaling, signaling by ILS, IL6 pathway, natural killer cell mediated cytotoxicity, leukocyte transendothelial migration constitute the immune system to regulate cholesterol levels. (6) Bile salt and organic anion SLC transporters, transport of glucose and other sugars bile salts and organic acids metal ions and amine compounds participate in regulation of transport.
LDL level
The pathways associated with LDL-C were: immune system, metabolism of amino acids and derivatives, ERBB signaling pathway, HIV infection.
(1) FC epsilon RI signaling pathway, NFAT pathway, IL1R pathway constitute the immune system to regulate cholesterol levels. (2) Metabolism of amino acids and derivatives participates in the formation and function of enzyme to regulate cholesterol level. (3) ERBB4 activates sterol regulatory element binding protein-2 (SREBP-2) to enhance LDL-C uptake and cholesterol biosynthesis (88). (4) A cross-sectional epidemiological study in China showed that mean LDL-C was lower in HIV-positive than HIV-negative subjects (89).
Strengths and Limitations
There are two advantages in this study. First, our results were based on the twin data of TC, HDL-C, LDL-C level. Associated individuals, such as twin pairs, will confer increased power in genetic association analysis due to their genetic association (21). And the power of our heritability analysis was above 90%, which suggested that the heritability findings were credible. Second, compared with most GWAS results from European populations, we sampled GWAS from the Qingdao twin population. Our GWAS results of TC, HDL-C, LDL-C level in East Asian population provided a basis for future molecular biology investigations.
This study has two limitations that are noteworthy. First, our study had a relatively small sample size due to the challenges of recruiting and identifying qualified twin pairs. So it should be noted that the power of our analysis might not be sufficient to detect association between SNPs, pathways and cholesterol levels, and our results needed to be furtherly confirmed. Second, our study provided a lot of suggestive results, but no statistically significant results. However, many variants and genes had been confirmed, other novel variants and genes may also be interesting potential candidates for future research and validation.
Conclusions
In brief, we have verified genetic impact on TC, HDL-C, LDL-C variation through twin modeling. The promising genetic regions for TC, HDL-C, LDL-C level were on chromosome 11 around rs7107698, chromosome 5 around rs12518218, chromosome 2 around rs10490120, respectively. There are 8, 14, 9 SNPs exceeding the threshold for suggestive significance level for TC, HDL-C, LDL-C level, respectively. In the gene-based analysis, the number of genes that was nominally associated with TC, HDL-C, LDL-C level was 1,038, 1,033, and 1,090, respectively. Although our findings need to be replicated and validated, the data reported here could represent a useful reference for GWAS results of TC, HDL-C, LDL-C level in East Asian population and provide a basis for future molecular biology investigations.
Data Availability
The SNPs datasets of this study have been deposited in the European Variation Archive (EVA) (Accession No. PRJEB23749).
Author Contributions
HL and DZ designed the study. HD and CX collected samples and phenotypes. HL and CZ assisted in sample data and sequencing data management. HL and WW analyzed the sequencing data and interpreted the analysis results. HL and DZ drafted the manuscript, XT and HD participated in the discussion, and WW, CX, and CZ revised it. All the authors read the manuscript and agreed to publish. All the authors agreed to be responsible for all aspects of the work.
Funding
This study was supported by the grants from the National Natural Science Foundation of China (31371024), the EFSD/CDS/Lilly Programme award (2013).
Conflict of Interest Statement
The authors declare that the research was conducted in the absence of any commercial or financial relationships that could be construed as a potential conflict of interest.
Supplementary Material
The Supplementary Material for this article can be found online at: https://www.frontiersin.org/articles/10.3389/fendo.2018.00677/full#supplementary-material
Supplemental Figure 1. Quantile-quantile plot for quality control check and visualizing crude association for genome-wide association study of TC level. The x-axis shows the –log10 of expected P-values of association from chi-square distribution and the y-axis shows the –log10 of P-values from the observed chi-square distribution. The black dots represent the observed data, and the red line is the expectation under the null hypothesis of no association.
Supplemental Figure 2. Manhattan plot for genome-wide association study of TC level. The x-axis shows the numbers of autosomes and the X chromosome, and the y-axis shows the –log10 of P-values for statistical significance. The dots represent the SNPs. None of the SNPs reached the genome-wide significance level (P < 5 × 10⁻⁸).
Supplemental Figure 3. Regional association plot showing signal around chromosomal loci of 11p15.4 for genome-wide association study of TC level.
Supplemental Figure 4. Quantile-quantile plot for quality control check and visualizing crude association for genome-wide association study of LDL-C level. The x-axis shows the –log10 of expected P-values of association from chi-square distribution and the y-axis shows the –log10 of P-values from the observed chi-square distribution. The black dots represent the observed data, and the red line is the expectation under the null hypothesis of no association.
Supplemental Figure 5. Manhattan plot for genome-wide association study of LDL-C level. The x-axis shows the numbers of autosomes and the X chromosome, and the y-axis shows the –log10 of P-values for statistical significance. The dots represent the SNPs. None of the SNPs reached the genome-wide significance level (P < 5 × 10⁻⁸).
Supplemental Figure 6. Regional association plot showing signal around chromosomal loci of 2p16.3 for genome-wide association study of LDL-C level.
Supplemental Figure 7. Quantile-quantile plot for PASCAL pathways results of TC level. The x-axis shows the -log10 of expected P-values of association from chi-square distribution and the y-axis shows the –log10 of P-values from the observed chi-square distribution. The black dots represent the observed data, and the red line is the expectation under the null hypothesis of no association.
Supplemental Figure 8. Quantile-quantile plot for PASCAL pathway results of HDL-C level. The x-axis shows the –log10 of expected P-values of association from chi-square distribution and the y-axis shows the –log10 of P-values from the observed chi-square distribution. The black dots represent the observed data, and the red line is the expectation under the null hypothesis of no association.
Supplemental Figure 9. Quantile-quantile plot for PASCAL pathway results of LDL-C level. The x-axis shows the –log10 of expected P-values of association from chi-square distribution and the y-axis shows the –log10 of P-values from the observed chi-square distribution. The black dots represent the observed data, and the red line is the expectation under the null hypothesis of no association.
Supplemental Table 1. Descriptive statistics for subjects in all sample and GWAS sample.
Supplemental Table 2. Descriptive statistics for subjects in all sample and GWAS sample phenotypic correlation coefficients (95% CI) with covariates' effects in MZ and DZ twin pairs.
Supplemental Table 3. The summary of SNPs with P < 1 × 10⁻⁵ for association with TC in typed GWAS data.
Supplemental Table 4. Query SNP enhancer summary for TC level in typed GWAS data.
Supplemental Table 5. The summary of SNPs with P < 1 × 10⁻⁵ for association with LDL-C in typed GWAS data.
Supplemental Table 6. Query SNP enhancer summary for LDL-C level in typed GWAS data.
Supplemental Table 7. The summary of SNPs with P < 1 × 10⁻⁵ for association with TC in GWAS imputation.
Supplemental Table 8. The summary of SNPs with P < 1 × 10⁻⁵ for association with HDL-C in GWAS imputation.
Supplemental Table 9. The summary of SNPs with P < 1 × 10⁻⁵ for association with LDL-C in GWAS imputation.
Supplemental Table 10. The comparison between our imputation results of genome-wide association study and other East Asian studies.
Supplemental Table 11. The top 20 genes from VEGAS2 gene-based analysis showing the strongest association with TC level in typed GWAS data.
Supplemental Table 12. The top 20 genes from VEGAS2 gene-based analysis showing the strongest association with LDL-C level in typed GWAS data.
Supplemental Table 13. Common genes among TC, HDL-C and LDL-C level (P < 0.05).
Supplemental Table 14. The top 20 pathway results-KEGG, Reactome, and Biocarta (emp-P < 0.05) using PASCAL program for TC level in typed GWAS data.
Supplemental Table 15. The top 20 pathway results-KEGG, Reactome, and Biocarta (emp-P < 0.05) using PASCAL program for LDL-C level in typed GWAS data.
Abbreviations
DZ, dizygotic; GWAS, genome-wide association study; MZ, monozygotic; TC, total cholesterol; VEGAS2, Versatile Gene-based Association Study-2.
Footnotes
2. ^http://archive.broadinstitute.org/mammals/haploreg/haploreg.php
3. ^https://vegas2.qimrberghofer.edu.au/
References
1. Anderson TJ, Gregoire J, Hegele RA, Couture P, Mancini GB, McPherson R, et al. 2012 update of the Canadian Cardiovascular Society guidelines for the diagnosis and treatment of dyslipidemia for the prevention of cardiovascular disease in the adult. Can J Cardiol. (2013) 29:151–67. doi: 10.1016/j.cjca.2012.11.032
2. Murray CJ, Lopez AD. Mortality by cause for eight regions of the world: global burden of disease study. Lancet (1997) 349:1269–76. doi: 10.1016/s0140-6736(96)07493-4
3. Thom T, Haase N, Rosamond W, Howard VJ, Rumsfeld J, Manolio T, et al. Heart disease and stroke statistics−2006 update: a report from the American Heart Association Statistics Committee and Stroke Statistics Subcommittee. Circulation (2006) 113:e85–151. doi: 10.1161/circulationaha.105.171600
4. Das R, Kerr R, Chakravarthy U, Hogg RE. Dyslipidemia and diabetic macular edema: a systematic review and meta-analysis. Ophthalmology (2015) 122:1820–7. doi: 10.1016/j.ophtha.2015.05.011
5. Spracklen CN, Smith CJ, Saftlas AF, Robinson JG, Ryckman KK. Maternal hyperlipidemia and the risk of preeclampsia: a meta-analysis. Am J Epidemiol. (2014) 180:346–58. doi: 10.1093/aje/kwu145
6. Wild RA, Rizzo M, Clifton S, Carmina E. Lipid levels in polycystic ovary syndrome: systematic review and meta-analysis. Fertil Steril. (2011) 95:1073–9.e1–11. doi: 10.1016/j.fertnstert.2010.12.027
7. Yao X, 'Tian Z. Dyslipidemia and colorectal cancer risk: a meta-analysis of prospective studies. Cancer Causes Control (2015) 26:257–68. doi: 10.1007/s10552-014-0507-y
8. Wang S, Xu L, Jonas JB, You QS, Wang YX, Yang H. Prevalence and associated factors of dyslipidemia in the adult Chinese population. PLoS ONE (2011) 6:e17326. doi: 10.1371/journal.pone.0017326
9. Luo JY, Ma YT, Yu ZX, Yang YN, Xie X, Ma X, et al. Prevalence, awareness, treatment and control of dyslipidemia among adults in northwestern China: the cardiovascular risk survey. Lipids Health Dis. (2014) 13:4. doi: 10.1186/1476-511x-13-4
10. Iliadou A, Snieder H, Wang X, Treiber FA, Davis CL. Heritabilities of lipids in young European American and African American twins. Twin Res Hum Genet. (2005) 8:492–8. doi: 10.1375/183242705774310187
11. Jermendy G, Horvath T, Littvay L, Steinbach R, Jermendy AL, Tarnoki AD, et al. Effect of genetic and environmental influences on cardiometabolic risk factors: a twin study. Cardiovasc Diabetol. (2011) 10:96. doi: 10.1186/1475-2840-10-96
12. Heller DA, de Faire U, Pedersen NL, Dahlen G, McClearn GE. Genetic and environmental influences on serum lipid levels in twins. N Engl J Med. (1993) 328:1150–6. doi: 10.1056/nejm199304223281603
13. Souren NY, Paulussen AD, Loos RJ, Gielen M, Beunen G, Fagard R, et al. Anthropometry, carbohydrate and lipid metabolism in the East Flanders Prospective Twin Survey: heritabilities. Diabetologia (2007) 50:2107–16. doi: 10.1007/s00125-007-0784-z
14. Zhang S, Liu X, Yu Y, Hong X, Christoffel KK, Wang B, et al. Genetic and environmental contributions to phenotypic components of metabolic syndrome: a population-based twin study. Obesity (2009) 17:1581–7. doi: 10.1038/oby.2009.125
15. Friedlander Y, Austin MA, Newman B, Edwards K, Mayer-Davis EI, King MC. Heritability of longitudinal changes in coronary-heart-disease risk factors in women twins. Am J Hum Genet. (1997) 60:1502–12. doi: 10.1086/515462
16. Middelberg RP, Spector TD, Swaminathan R, Snieder H. Genetic and environmental influences on lipids, lipoproteins, and apolipoproteins: effects of menopause. Arterioscler Thromb Vasc Biol. (2002) 22:1142–7. doi: 10.1161/01.ATV.0000022889.85440.79
17. Kervinen K, Kaprio J, Koskenvuo M, Juntunen J, Kesaniemi YA. Serum lipids and apolipoprotein E phenotypes in identical twins reared apart. Clin Genet. (1998) 53:191–9. doi: 10.1111/j.1399-0004.1998.tb02675.x
18. Middelberg RP, Ferreira MA, Henders AK, Heath AC, Madden PA, Montgomery GW, et al. Genetic variants in LPL, OASL and TOMM40/APOE-C1-C2-C4 genes are associated with multiple cardiovascular-related traits. BMC Med Genet. (2011) 12:123. doi: 10.1186/1471-2350-12-123
19. Surakka I, Whitfield JB, Perola M, Visscher PM, Montgomery GW, Falchi M, et al. A genome-wide association study of monozygotic twin-pairs suggests a locus related to variability of serum high-density lipoprotein cholesterol. Twin Res Hum Genet. (2012) 15:691–9. doi: 10.1017/thg.2012.63
20. Middelberg RP, Gordon SD, Zhu G, McRae A, Montgomery GW, Martin NG, et al. Linkage and association analyses of longitudinally measured lipid phenotypes in adolescence. Twin Res Hum Genet. (2008) 11:603–20. doi: 10.1375/twin.11.6.603
21. Tan Q, Li W, Vandin F. Disease-concordant twins empower genetic association studies. Ann Hum Genet. (2017) 81:20–6. doi: 10.1111/ahg.12181
22. Wang W, Zhang D, Xu C, Wu Y, Duan H, Li S, et al. Heritability and genome-wide association analyses of serum uric acid in middle and old-aged chinese twins. Front Endocrinol. (2018) 9:75. doi: 10.3389/fendo.2018.00075
23. Xu C, Zhang D, Tian X, Wu Y, Pang Z, Li S, et al. Genetic and environmental basis in phenotype correlation between physical function and cognition in aging chinese twins. Twin Res Hum Genet. (2017) 20:60–5. doi: 10.1017/thg.2016.98
24. Xu C, Zhang D, Tian X, Duan H, Wu Y, Pang Z, et al. Genetic and environmental influences on correlations between hearing and cognitive functions in middle and older Chinese twins. Twin Res Hum Genet. (2017) 20:374–9. doi: 10.1017/thg.2017.42
25. Becker A, Busjahn A, Faulhaber HD, Bahring S, Robertson J, Schuster H, et al. Twin zygosity. Automated determination with microsatellites. J Reprod Med. (1997) 42:260–6.
26. Tomsey CS, Kurtz M, Kist F, Hockensmith M, Call P. Comparison of PowerPlex 16, PowerPlex1.1/2.1, and ABI AmpfISTR Profiler Plus/COfiler for forensic use. Croat Med J. (2001) 42:239–43.
27. Xu C, Tian X, Sun J, Wu Y, Zhang D, Pang Z, et al. Genetic and environmental influences on cardiovascular risk factors and cognitive function: a Chinese twin aging study. Geriatr Gerontol Int. (2018) 18:352–9. doi: 10.1111/ggi.13161
28. Marchini J, Howie B, Myers S, McVean G, Donnelly P. A new multipoint method for genome-wide association studies by imputation of genotypes. Nat Genet. (2007) 39:906–13. doi: 10.1038/ng2088
29. Auton A, Brooks LD, Durbin RM, Garrison EP, Kang HM, Korbel JO, et al. A global reference for human genetic variation. Nature (2015) 526:68–74. doi: 10.1038/nature15393
30. Zhou X, Stephens M. Genome-wide efficient mixed-model analysis for association studies. Nat Genet. (2012) 44:821–4. doi: 10.1038/ng.2310
31. Dudbridge F, Gusnanto A. Estimation of significance thresholds for genomewide association scans. Genet Epidemiol. (2008) 32:227–34. doi: 10.1002/gepi.20297
32. Ward LD, Kellis M. HaploReg v4: systematic mining of putative causal variants, cell types, regulators and target genes for human complex traits and disease. Nucleic Acids Res. (2016) 44:D877–81. doi: 10.1093/nar/gkv1340
33. Ward LD, Kellis M. HaploReg: a resource for exploring chromatin states, conservation, and regulatory motif alterations within sets of genetically linked variants. Nucleic Acids Res. (2012) 40:D930–4. doi: 10.1093/nar/gkr917
34. Liu JZ, McRae AF, Nyholt DR, Medland SE, Wray NR, Brown KM, et al. A versatile gene-based test for genome-wide association studies. Am J Hum Genet. (2010) 87:139–45. doi: 10.1016/j.ajhg.2010.06.009
35. Mishra A, Macgregor S. VEGAS2: software for more flexible gene-based testing. Twin Res Hum Genet. (2015) 18:86–91. doi: 10.1017/thg.2014.79
36. Lamparter D, Marbach D, Rueedi R, Kutalik Z, Bergmann S. Fast and rigorous computation of gene and pathway scores from snp-based summary statistics. PLoS Comput Biol. (2016) 12:e1004714. doi: 10.1371/journal.pcbi.1004714
37. Julia A, Lopez-Longo FJ, Perez Venegas JJ, Bonas-Guarch S, Olive A, Andreu JL, et al. Genome-wide association study meta-analysis identifies five new loci for systemic lupus erythematosus. Arthritis Res Ther. (2018) 20:100. doi: 10.1186/s13075-018-1604-1
38. Ostrom QT, Coleman W, Huang W, Rubin JB, Lathia JD, Berens ME, et al. Sex-specific gene and pathway modeling of inherited glioma risk. Neuro Oncol. (2018). doi: 10.1093/neuonc/noy135. [Epub ahead of print].
39. Fenger M, Benyamin B, Schousboe K, Sorensen TI, Kyvik KO. Variance decomposition of apolipoproteins and lipids in Danish twins. Atherosclerosis (2007) 191:40–7. doi: 10.1016/j.atherosclerosis.2006.04.024
40. Chen CJ, Yu MW, Wang CJ, Tong SL, Tien M, Lee TY, et al. Genetic variance and heritability of serum cholesterol and triglycerides among Chinese twin neonates. Acta Genet Med Gemellol. (1990) 39:123–31. doi: 10.1017/S000156600000564X
41. Knoblauch H, Busjahn A, Munter S, Nagy Z, Faulhaber HD, Schuster H, et al. Heritability analysis of lipids and three gene loci in twins link the macrophage scavenger receptor to HDL cholesterol concentrations. Arterioscler Thromb Vasc Biol. (1997) 17:2054–60. doi: 10.1161/01.ATV.17.10.2054
42. Williams PD, Puddey IB, Martin NG, Beilin LJ. Genetic and environmental covariance of serum cholesterol and blood pressure in female twins. Atherosclerosis (1993) 100:19–31. doi: 10.1016/0021-9150(93)90064-2
43. Snieder H, van Doornen LJ, Boomsma DI. The age dependency of gene expression for plasma lipids, lipoproteins, and apolipoproteins. Am J Hum Genet. (1997) 60:638–50.
44. Goode EL, Cherny SS, Christian JC, Jarvik GP, de Andrade M. Heritability of longitudinal measures of body mass index and lipid and lipoprotein levels in aging twins. Twin Res Hum Genet. (2007) 10:703–11. doi: 10.1375/twin.10.5.703
45. Duan H, Pang Z, Zhang D, Li S, Kruse TA, Kyvik KO, et al. Genetic and environmental dissections of sub-phenotypes of metabolic syndrome in the Chinese population: a twin-based heritability study. Obes Facts (2011) 4:99–104. doi: 10.1159/000327735
46. Iliadou A, Lichtenstein P, de Faire U, Pedersen NL. Variation in genetic and environmental influences in serum lipid and apolipoprotein levels across the lifespan in Swedish male and female twins. Am J Med Genet. (2001) 102:48–58. 3.0. doi: 10.1002/1096-8628(20010722)102:1<48::aid-ajmg1388>3.0.co;2-4
47. Beekman M, Heijmans BT, Martin NG, Pedersen NL, Whitfield JB, DeFaire U, et al. Heritabilities of apolipoprotein and lipid levels in three countries. Twin Res. (2002) 5:87–97. doi: 10.1375/1369052022956
48. Whitfield JB, Martin NG. Plasma lipids in twins. Environmental and genetic influences. Atherosclerosis (1983) 48:265–77. doi: 10.1016/0021-9150(83)90044-8
49. Kuusi T, Kesaniemi YA, Vuoristo M, Miettinen TA, Koskenvuo M. Inheritance of high density lipoprotein and lipoprotein lipase and hepatic lipase activity. Arteriosclerosis (1987) 7:421–5. doi: 10.1161/01.ATV.7.4.421
50. Chen TJ, Ji CY, Hu YH. Genetic and environmental influences on serum lipids and the effects of puberty: a Chinese twin study. Acta Paediatr. (2009) 98:1029–36. doi: 10.1111/j.1651-2227.2009.01257.x
51. Sims B, Mahnke-Zizelman DK, Profit AA, Prestwich GD, Sabina RL, Theibert AB. Regulation of AMP deaminase by phosphoinositides. J Biol Chem. (1999) 274:25701–7. doi: 10.1074/jbc.274.36.25701
52. Lanaspa MA, Sanchez-Lozada LG, Choi YJ, Cicerchi C, Kanbay M, Roncal-Jimenez CA, et al. Uric acid induces hepatic steatosis by generation of mitochondrial oxidative stress: potential role in fructose-dependent and -independent fatty liver. J Biol Chem. (2012) 287:40732–44. doi: 10.1074/jbc.M112.399899
53. Nicklas TA, Dwyer J, Feldman HA, Luepker RV, Kelder SH, Nader PR. Serum cholesterol levels in children are associated with dietary fat and fatty acid intake. J Am Diet Assoc. (2002) 102:511–7. doi: 10.1016/S0002-8223(02)90117-3
54. Peloso GM, Demissie S, Collins D, Mirel DB, Gabriel SB, Cupples LA, et al. Common genetic variation in multiple metabolic pathways influences susceptibility to low HDL-cholesterol and coronary heart disease. J Lipid Res. (2010) 51:3524–32. doi: 10.1194/jlr.P008268
55. Aseem O, Smith BT, Cooley MA, Wilkerson BA, Argraves KM, Remaley AT, et al. Cubilin maintains blood levels of HDL and albumin. J Am Soc Nephrol. (2014) 25:1028–36. doi: 10.1681/asn.2013060671
56. Moestrup SK, Kozyraki R. Cubilin, a high-density lipoprotein receptor. Curr Opin Lipidol. (2000) 11:133–40. doi: 10.1097/00041433-200004000-00005
57. Song Y, Wang ES, Xing LL, Shi S, Qu F, Zhang D, et al. Follicle-stimulating hormone induces postmenopausal dyslipidemia through inhibiting hepatic cholesterol metabolism. J Clin Endocrinol Metab. (2016) 101:254–63. doi: 10.1210/jc.2015-2724
58. Li X, Jing L, Lin F, Huang H, Chen Z, Chen Y, et al. Diurnal rhythm of follicle-stimulating hormone is associated with nonalcoholic fatty liver disease in a Chinese elderly population. Eur J Obstet Gynecol Reprod Biol. (2018) 222:166–70. doi: 10.1016/j.ejogrb.2018.01.034
59. Schooling CM. Plasma levels of vitamin K and the risk of ischemic heart disease: a Mendelian randomization study. J Thromb Haemost. (2016) 14:1211–5. doi: 10.1111/jth.13332
60. Hoggart CJ, Venturini G, Mangino M, Gomez F, Ascari G, Zhao JH, et al. Novel approach identifies SNPs in SLC2A10 and KCNK9 with evidence for parent-of-origin effect on body mass index. PLoS Genet. (2014) 10:e1004508. doi: 10.1371/journal.pgen.1004508
61. Qi L, Menzaghi C, Salvemini L, De Bonis C, Trischitta V, Hu FB. Novel locus FER is associated with serum HMW adiponectin levels. Diabetes (2011) 60:2197–201. doi: 10.2337/db10-1645
62. Kishida K, Funahashi T, Shimomura I. Adiponectin as a routine clinical biomarker. Best Pract Res Clin Endocrinol Metab. (2014) 28:119–30. doi: 10.1016/j.beem.2013.08.006
64. Vecchiola A, Lagos CF, Carvajal CA, Baudrand R, Fardella CE. Aldosterone production and signaling dysregulation in obesity. Curr Hypertens Rep. (2016) 18:20. doi: 10.1007/s11906-016-0626-9
65. von Eckardstein S, von Eckardstein A, Bender HG, Schulte H, Assmann G. Elevated low-density lipoprotein-cholesterol in women with polycystic ovary syndrome. Gynecol Endocrinol. (1996) 10:311–8. doi: 10.3109/09513599609012817
66. Vrbikova J, Zamrazilova H, Sedlackova B, Snajderova M. Metabolic syndrome in adolescents with polycystic ovary syndrome. Gynecol Endocrinol. (2011) 27:820–2. doi: 10.3109/09513590.2010.508851
67. Sowers MR, Symons JP, Jannausch ML, Chu J, Kardia SR. Sex steroid hormone polymorphisms, high-density lipoprotein cholesterol, and apolipoprotein A-1 from the Study of Women's Health Across the Nation (SWAN). Am J Med. (2006) 119 (9 Suppl. 1):S61–8. doi: 10.1016/j.amjmed.2006.07.008
68. Fischer AW, Albers K, Krott LM, Hoffzimmer B, Heine M, Schmale H, et al. The adaptor protein PID1 regulates receptor-dependent endocytosis of postprandial triglyceride-rich lipoproteins. Mol Metab. (2018) 16:88–99. doi: 10.1016/j.molmet.2018.07.010
69. Rao P, Zhou Y, Ge SQ, Wang AX, Yu XW, Alzain MA, et al. Validation of type 2 diabetes risk variants identified by genome-wide association studies in Northern Han Chinese. Int J Environ Res Public Health (2016) 13:863. doi: 10.3390/ijerph13090863
70. Park MY, Moon JH, Lee KS, Choi HI, Chung J, Hong HJ, et al. FAF1 suppresses IkappaB kinase (IKK) activation by disrupting the IKK complex assembly. J Biol Chem. (2007) 282:27572–7. doi: 10.1074/jbc.C700106200
71. Harte AL, Tripathi G, Piya MK, Barber TM, Clapham JC, Al-Daghri N, et al. NFkappaB as a potent regulator of inflammation in human adipose tissue, influenced by depot, adiposity, T2DM status, and TNFalpha. Obesity (2013) 21:2322–30. doi: 10.1002/oby.20336
72. Papoutsidakis N, Deftereos S, Giannopoulos G, Panagopoulou V, Manolis AS, Bouras G. Treating dyslipidemias: is inflammation the missing link? Med Chem. (2014) 10:643–52. doi: 10.2174/1573406410666140318101936
73. O'Neill F, Riwanto M, Charakida M, Colin S, Manz J, McLoughlin E, et al. Structural and functional changes in HDL with low grade and chronic inflammation. Int J Cardiol. (2015) 188:111–6. doi: 10.1016/j.ijcard.2015.03.058
74. Lamina C, Friedel S, Coassin S, Rueedi R, Yousri NA, Seppala I, et al. A genome-wide association meta-analysis on apolipoprotein A-IV concentrations. Hum Mol Genet. (2016) 25:3635–46. doi: 10.1093/hmg/ddw211
75. Dong L, Li Y, Zhang D, Zhang H, Han J, Wang Z, et al. Dietary Apostichopus japonicus alleviates diabetes symptoms and modulates genes expression in kidney tissues of db/db mice. J Agric Food Chem. (2018) 66:154–62. doi: 10.1021/acs.jafc.7b04743
76. Hu Y, Sun B, Liu K, Yan M, Zhang Y, Miao C, et al. Icariin attenuates high-cholesterol diet induced atherosclerosis in rats by inhibition of inflammatory response and p38 MAPK signaling pathway. Inflammation (2016) 39:228–36. doi: 10.1007/s10753-015-0242-x
77. Hebel T, Eisinger K, Neumeier M, Rein-Fischboeck L, Pohl R, Meier EM, et al. Lipid abnormalities in alpha/beta2-syntrophin null mice are independent from ABCA1. Biochim Biophys Acta (2015) 1851:527–36. doi: 10.1016/j.bbalip.2015.01.012
78. Buechler C, Bauer S. ATP binding cassette transporter A1 (ABCA1) associated proteins: potential drug targets in the metabolic syndrome and atherosclerotic disease? Curr Pharm Biotechnol. (2012) 13:319–30. doi: 10.2174/138920112799095365
79. Chung S, Timmins JM, Duong M, Degirolamo C, Rong S, Sawyer JK, et al. Targeted deletion of hepatocyte ABCA1 leads to very low density lipoprotein triglyceride overproduction and low density lipoprotein hypercatabolism. J Biol Chem. (2010) 285:12197–209. doi: 10.1074/jbc.M109.096933
80. Laitinen R, Vuori E, Viikari J. Serum zinc and copper: associations with cholesterol and triglyceride levels in children and adolescents. Cardiovascular risk in young Finns. J Am Coll Nutr. (1989) 8:400–6. doi: 10.1080/07315724.1989.10720314
81. Garcia OP, Ronquillo D, del Carmen Caamano M, Martinez G, Camacho M, Lopez V, et al. Zinc, iron and vitamins A, C and e are associated with obesity, inflammation, lipid profile and insulin resistance in Mexican school-aged children. Nutrients (2013) 5:5012–30. doi: 10.3390/nu5125012
82. Zhang Y, Zhang Q, Feng C, Ren X, Li H, He K, et al. Influence of vanadium on serum lipid and lipoprotein profiles: a population-based study among vanadium exposed workers. Lipids Health Dis. (2014) 13:39. doi: 10.1186/1476-511x-13-39
83. Catapano AL, Pirillo A, Bonacina F, Norata GD. HDL in innate and adaptive immunity. Cardiovasc Res. (2014) 103:372–83. doi: 10.1093/cvr/cvu150
84. Calabresi L, Gomaraschi M, Villa B, Omoboni L, Dmitrieff C, Franceschini G. Elevated soluble cellular adhesion molecules in subjects with low HDL-cholesterol. Arterioscler Thromb Vasc Biol. (2002) 22:656–61. doi: 10.1161/hq0402.105901
85. Moreno-Navarrete JM, Sabater M, Ortega F, Ricart W, Fernandez-Real JM. Circulating zonulin, a marker of intestinal permeability, is increased in association with obesity-associated insulin resistance. PLoS ONE (2012) 7:e37160. doi: 10.1371/journal.pone.0037160
86. Matsushima T, Nakashima Y, Sugano M, Tasaki H, Kuroiwa A, Koide O. Suppression of atherogenesis in hypercholesterolemic rabbits by chondroitin-6-sulfate. Artery (1987) 14:316–37.
87. Elshorbagy AK, Valdivia-Garcia M, Graham IM, Palma Reis R, Sales Luis A, Smith AD, et al. The association of fasting plasma sulfur-containing compounds with BMI, serum lipids and apolipoproteins. Nutr Metab Cardiovasc Dis. (2012) 22:1031–8. doi: 10.1016/j.numecd.2011.01.008
88. Haskins JW, Zhang S, Means RE, Kelleher JK, Cline GW, Canfran-Duque A, et al. Neuregulin-activated ERBB4 induces the SREBP-2 cholesterol biosynthetic pathway and increases low-density lipoprotein uptake. Sci Signal. (2015) 8:ra111. doi: 10.1126/scisignal.aac5124
Keywords: cholesterol, dyslipidemias, genetics, GWAS, heritability, HDL, LDL, twins
Citation: Liu H, Wang W, Zhang C, Xu C, Duan H, Tian X and Zhang D (2018) Heritability and Genome-Wide Association Study of Plasma Cholesterol in Chinese Adult Twins. Front. Endocrinol. 9:677. doi: 10.3389/fendo.2018.00677
Received: 15 June 2018; Accepted: 29 October 2018;
Published: 15 November 2018.
Edited by:
David Meyre, McMaster University, CanadaReviewed by:
Michael Chong, Population Health Research Institute (PHRI), CanadaKenneth M. Weiss, Pennsylvania State University, United States
Copyright © 2018 Liu, Wang, Zhang, Xu, Duan, Tian and Zhang. This is an open-access article distributed under the terms of the Creative Commons Attribution License (CC BY). The use, distribution or reproduction in other forums is permitted, provided the original author(s) and the copyright owner(s) are credited and that the original publication in this journal is cited, in accordance with accepted academic practice. No use, distribution or reproduction is permitted which does not comply with these terms.
*Correspondence: Dongfeng Zhang, emhhbmdkZjE5NjFAMTI2LmNvbQ==