
94% of researchers rate our articles as excellent or good
Learn more about the work of our research integrity team to safeguard the quality of each article we publish.
Find out more
ORIGINAL RESEARCH article
Front. Endocrinol. , 11 September 2018
Sec. Translational and Clinical Endocrinology
Volume 9 - 2018 | https://doi.org/10.3389/fendo.2018.00535
This article is part of the Research Topic Extracellular Vesicles and the New Endocrine Frontier View all 7 articles
 Uyen T.T. Than1,2,3,4*
 Dominic Guanzon1,2,3,5James A. Broadbent2
 David I. Leavesley2,5
 Carlos Salomon6,7Tony J. Parker1,2*
Extracellular vesicles (EVs) are mammalian cell-derived nano-scale structures enclosed by a lipid bilayer that were previously considered to be cell debris with little biological value. However, EVs are now recognized to possess biological function, acting as a packaging, transport and delivery mechanisms by which functional molecules (i.e., miRNAs) can be transferred to target cells over some distance. To examine the miRNA from keratinocyte-derived EVs, we isolated three distinct populations of EVs from both HaCaT and primary human keratinocytes (PKCs) and characterized their biophysical, biochemical and functional features by using microscopy, immunoblotting, nanoparticle tracking, and next generation sequencing. We identified 1,048; 906; and 704 miRNAs, respectively, in apoptotic bodies (APs), microvesicles (MVs) and exosomes (EXs) released from HaCaT, and 608; 506; and 622 miRNAs in APs, MVs and EXs released from PKCs. In which, there were 623 and 437 identified miRNAs common to three HaCaT-derived EVs and PKC-derived EVs, respectively. In addition, we found hundreds of exosomal miRNAs that were previously un-reported. Differences in the abundance levels of the identified EV miRNAs could discriminate between the three EV populations. These data contribute substantially to knowledge within the EV-identified miRNA database, especially with regard to keratinocyte-derived EV miRNA content.
Extracellular membrane vesicles (EVs) are secreted by various cell types and can be isolated from body fluids such as breast milk, urine, amniotic fluids, plasma and saliva, as well as from cell-conditioned culture media (1–7). Classically, EVs have been categorized based upon physical parameters in (i) apoptotic bodies (Aps; ~1–5 μm); (ii) microvesicles (MVs; ~100–1,000 nm); and (iii) exosomes (EXs; ~40–100 nm) (8). While APs are products of apoptosis, MVs and EXs are shed and released from cells during normal physiological processes, and in states of disease. During the formation and release process, EVs are assembled as a lipid bilayer membrane encapsulating cell-derived components such as proteins, lipids, organelles and genetic materials including nucleic acids (9–11). In this regard, statistical data in Vesiclepedia report that the EVs database contains 92,897 protein, 32,576 RNA and 584 lipid molecules from 538 studies in 33 species (Vesiclepedia version 3.1 released 9/1/2015, http://www.microvesicles.org/). Moreover, a total of 4,934 microRNA molecules out of 32,576 known RNAs have been found within vesicle cargo, as reported in the literature. Of note, some individual biomolecules are common to most EVs, but different EV populations exhibit variation in their biomolecular composition (10). Molecules are unique for a particular population of vesicle and could be considered as markers of that EV population. For example, annexin V is a marker of APs and MVs (12, 13). Similarly, transmembrane proteins of the tetraspanin family, such as CD9, CD63, and CD81, are known to be markers for exosomes (14). Additionally, EXs from body fluids such as human saliva, plasma and breast milk contain RNAs, but little or no ribosomal RNAs (18S and 28S) (5). Ribosomal RNA subunits 18S and 28S have also been detected in APs, but these ribosomal RNAs were either very rarely detected in MVs or not detected at all (10). These indicate that distinct molecule signatures in three different EV populations can be used to distinguish them.
MicroRNAs (miRNAs) are small non-coding RNAs, generally 19–24 nucleotides long and have been shown to target mRNAs for cleavage or translational repression (15). miRNAs are encoded within and transcribed from the intergenic regions of the genome prior to processing and transport to the cytoplasm. They are then cleaved by the Dicer enzyme and further processed to become a mature miRNA that is incorporated into an RNA-induced silencing complex that is involved in targeted gene suppression (15). Importantly, it is now estimated that miRNAs regulate more than 60% of protein translation via multiple pathways (16, 17). As such, studies of miRNAs are pivotal especially in the context of the emerging EV field. Of relevance, several investigations have revealed the presence of miRNAs in EVs (11, 18, 19). The first paper to report this occurrence described the presence of miRNAs in mast cell-derived exosomes and showed that these miRNAs were transferred horizontally between mast cells (11). Recent studies have also demonstrated that miRNAs can be detected in blood plasma within EXs, MVs and APs derived from cancer cells (19–23). As miRNAs are known to regulate gene expression, it is possible that EV miRNAs may regulate gene expression in recipient cells. However, there have been no studies characterizing the miRNA cargo derived from the three EV populations released from human keratinocytes.
Keratinocytes are the most abundant cell type in the skin and spatially occupy the most basal and superficial layers of the stratified epithelia and as such, serve as the primary barrier between the body's interior and the external environment. The major functions of the skin are: (i) prevent the loss of moisture and heat; (ii) sense and communicate physio-chemical properties of the proximal external environment; (iii) provide a physical barrier to abrasive injury; and (iv) defend against pathogen invasion; and initiate responses to trauma (24, 25). Specifically, foreskin-isolated keratinocytes secrete an extensive catalog of cytoplasmic proteins into exosomes and these proteins, especially stratifin have an MMP-1 stimulatory effect on dermal fibroblasts (26, 27). However, the keratinocyte-derived EVs and their components and functions remain poorly understood. Therefore, this study is the first to isolate APs, MVs and EXs released from keratinocytes in order to analyse their miRNA content and identify the discriminant molecular features of EXs, Aps, and MVs.
Extended methods can be found in Supplementary Information.
Ethical approval for research detailed herein was obtained from: Queensland University of Technology (QUT); Pacific Day Surgery/Brisbane Private Hospital (approval # 1300000063/QUT); Princess Alexandra Hospital (approval # HREC/06/QPAH/91); Uniting Health Care's St. Andrews Hospital and Wesley Hospital (approval # 2003/46).
Epidermal primary keratinocytes (PKCs) were freshly isolated from donor skin and propagated on i3T3 feeder cells using the method of Rheinwald and Green (28). HaCaT cells were purchased from CLS Cell Lines Service GmbH (Eppenheim, Germany) (29). All keratinocyte cultures were maintained at 37°C in a 5% CO2/95% air atmosphere, with media changes every 2 days, and subcultured when the cultures became 80% confluent.
PKCs and HaCaT cells were cultured to 80% confluence; the expired media and i3T3 cells were removed and cells were washed with fresh DMEM prior to being incubated for 48 h with serum-free media for EV production. The EV-enriched media (conditioned) media (CM) were collected and centrifuged at 300 × g for 10 min to remove cell debris (30).
EV's were isolated using a modification of Crescitelli et al. and Valadi et al. (10, 11). Briefly, CM were gravity filtered through membrane filters with various pore sizes then centrifuged at 3,000 × g for 40 min, named AP; at 16,500 × g for 1 h at 4°C, name MV; and at 100,000 × g for 1.5 h at 4°C, labeled “EX-harvest” pellets. The AP, MV and EX pellets were resuspended and washed in PBS and concentrated again at 3,500 × g for 1 h, term “clean APs”; 16,500 × g for 1 h, term “clean MVs”; and 100,000 × g for 1.5 h at 4°C, term “clean EXs,” respectively. “Clean” AP, MV and EX harvest materials were resuspended in PBS (approximately 30 μL) for further experiments. This protocol is summarized in Supplementary Figure 4.
A volume of AP, MV, EX, or cell suspension was admixed with an equal volume of extraction buffer in Protein Lo-Bind tubes (Eppendorf) and incubated for 3 min at 95°C. Samples were subsequently sonicated for 5 min at room temperature. The resulting mixtures were centrifuged at 14,000 × g for 15 min at 4°C, and the protein supernatant decanted and stored at −20°C until required.
Cell lysate and EV preparation were separated electrophoretically with 4–12% SDS-PAGE. Separated proteins were then electrophoretically transferred onto a pure nitrocellulose membrane (Life Technology). Following transfer, the membrane was blocked with 5% skim milk in Tris Buffered Saline/0.01% Tween (TBST). The membrane was then probed overnight at 4°C with diluted primary antibodies against CD9, CD63, CD81, HSP70, and TSG101, or AGO2 (Abcam®) prior to wash and incubation with HRP-conjugated secondary antibody (HAF008, R&D Systems). Antibody binding was detected using the ECL detection solution (Pierce™ ECL Western Blotting Substrate, Thermo Scientific) per manufacturer's instructions and imaged on Curix Ultra UV-G Medical X-ray film (AFGA; Mortsel, Belgium).
A volume of 50 μL of EX preparation was diluted using ultra-pure water (Milli-Q® Integral Water Purification System) to a total volume of 500 μL in 1 mL LoBind tubes (Eppendorf). Concentration, size, aggregation and zeta potential of individual EX samples were acquired and analyzed using the NanoSight NS500 with Nanoparticle Tracking Analysis (NTA) 3.0 software (Malvern, Worcestershire, UK).
EV samples were fixed with saline buffered 4% paraformaldehyde, and deposited onto Formvar-carbon coated grids (Ted Pella, Inc., Redding CA). EV samples were washed eight times with PBS, stained with uranyl-oxalate and over-layered with methylcellulose. Imaging was performed using a JEOL 1400 Transmission Electron Microscope (TEM; JEOL Ltd., Tokyo, Japan) at 80 kV.
Clean AP pellets were resuspended in 100 μL of 1 × binding buffer (Annexin V-FITC Apoptosis Detection Kit, Abcam, Cambridge, UK) and probed for phosphatidyl serine (Annexin V-FITC) and nucleic acids (propidium iodide) per the manufacturer's instructions. Approximately 5 μL of the AP suspension was applied to a glass slide, observed and photographed (60× objective) under epifluorescence using a FITC and rhodamine dual filter using a Leica TSC SP5 (Leica Microsystems, Germany).
Total RNA was extracted using the Trizol™ method following the manufacturer's protocol (31, 32). Briefly, Trizol™ reagent (Thermo Fisher Scientific) was admixed to either whole cell suspension, APs, MVs or EXs (9 part Trizol: 1 part cells/vesicles). The Trizol-vesicle solution was triturated or vortexed to ensure vesicle lysis prior to addition of MgCl2 solution (Sigma) and chloroform. Each mixture was vortexed vigorously, incubated at room temperature (RT) for and centrifuged prior to transfer of the aqueous phase to fresh 2 mL micro tubes. Then, isopropanol was added and the samples were repeatedly inverted and incubated at RT. The tubes were then incubated at −20°C for 1 h (or overnight). Following incubation, the samples were centrifuged at 12,000 × g for 10 min at 4°C to collect RNA pellet. The RNA pellets were washed in RNAse-free 75% ethanol twice prior to removal of the supernatants and allowing the RNA pellets to air dry. Finally, the RNA was resuspended in 10–20 μL RNase-free water (Invitrogen; depending on the size of the RNA pellets).
Vesicle-derived RNA was quantified and evaluated for quality (as described in the Supplementary Material). RNA samples of sufficient quality were initially subjected to qRT-PCR to confirm the presence of miRNAs prior to subjecting RNA to deep sequencing using the Illumina® NextSeq500 system (below).
A representative RNA library from each EV preparation was constructed using the Illumina® TruSeq® Small RNA Library Prep Kit as per the manufacturer's instructions. Initially, the total RNA was ligated to RNA adapters prior to a conduction of reverse transcription. The resulting cDNA was amplified by PCR using primers designed to anneal to the ends of the adapters. The amplified PCR products from this stage were referred to as the small RNA library which was subsequently purified by gel electrophoresis. The small RNA library was eluted in 200 μL pure water by incubation overnight with shaking and then validated using a Bioanalyzer. The resulting cDNA library was diluted to 2 nM using a solution of 10 nM Tris–HCl, pH 8.5 and 0.1% Tween 20 prior to loading onto an Illumina chip and sequenced using an Illumina® NextSeq500. RNASeq data is available at GEO under accession number GSE106453.
Sequencing using the Illumina® Next Seq500 resulted in a FASTQ file.Each raw FASTQ file was curated as follows. Index and adaptor sequences were removed and trimmed to 28 nucleotides using the TagCleaner program (http://tagcleaner.sourceforge.net/index.html, version 0.16) and FASTX-Toolkit program (http://hannonlab.cshl.edu/fastx_toolkit/index.html, version 0.0.13) respectively. “Cleaned” nucleotide data were interrogated using miRDeep2 software and candidate sequences aligned to the human genome (hg19), miRNAs of identified and relative quantity calculated.
The identified miRNAs and their raw counts were further analyzed using the DESeq2 package (version 1.10.1). Each candidate miRNA sequence was filtered, normalized and tested for differential expression using a negative binomial generalized linear model (33). A Wald test was applied to calculate statistical significance and adjusted for multiple testing using the Benjamini and Hochberg procedure (33). Results were considered different where an adjusted p-value < 0.01 was determined between groups. Graphical illustrations and heatmaps were produced using the R statistical environment (R version 3.2.2, last update 14/8/2015) with gplots package (version 2.17.0) (34).
Candidate miRNAs found to be associated with individual EV samples were interrogated against the curated ExoCatra database (exocarta.org, version 5, released on 29 July 2015) containing a total of 2,766 miRNAs (Homo sapiens).
In order to analyse the miRNA-target gene interactions, EV miRNA target genes were identified by submission of the miRbase IDs for the EV miRNAs to Cytoscape (version 3.2.1) and searching against the miRTarBase database (accessed 5/1/2016) using the CyTargetLinker tool in Cytoscape. An interaction network of the miRNAs and their target genes was created and exported for further interpretation. The target genes then were analyzed for biochemical pathways using Panther (version 12) (35).
GraphPad Prism 6 for MacBook (GraphPad Software, La Jolla California USA, www.graphpad.com) and the R Environment for Statistical Computing version 3.2.2. were used to produce graphs and to perform statistical analysis. Data are presented as the Mean ± SD and statistical significance was determined by Wald test, using the R program or Student's t-test, as indicated and statistical significance was accepted at a p-value of <0.05.
Three distinct populations of EVs were isolated from media conditioned for 48 h by human primary epidermal keratinocytes (PKCs) and HaCaT cells using a modified differential centrifugation protocol (10, 36). We analyzed the morphological characteristics of individual vesicles from each donor and EV population using TEM (Figure 1, Supplementary Figure 1). As previously described (10, 37), we found that vesicles from the AP fraction were typically larger than 1 μm; the MV fraction were irregular and 300 nm to 700 nm in size; and the EX fraction were relatively homogenous at 50 nm to 120 nm with a cup-shaped morphology (Figure 1A). However, we also observed a population of vesicles smaller than 1 μm in the AP fractions and also a few larger (~200 nm diameter), cup-shaped vesicles in the EX fractions (Figures 1A5,A6). Low level EV contamination of AP preparations may have resulted from a sub-population of EVs with low buoyant density that pelleted at low g forces.
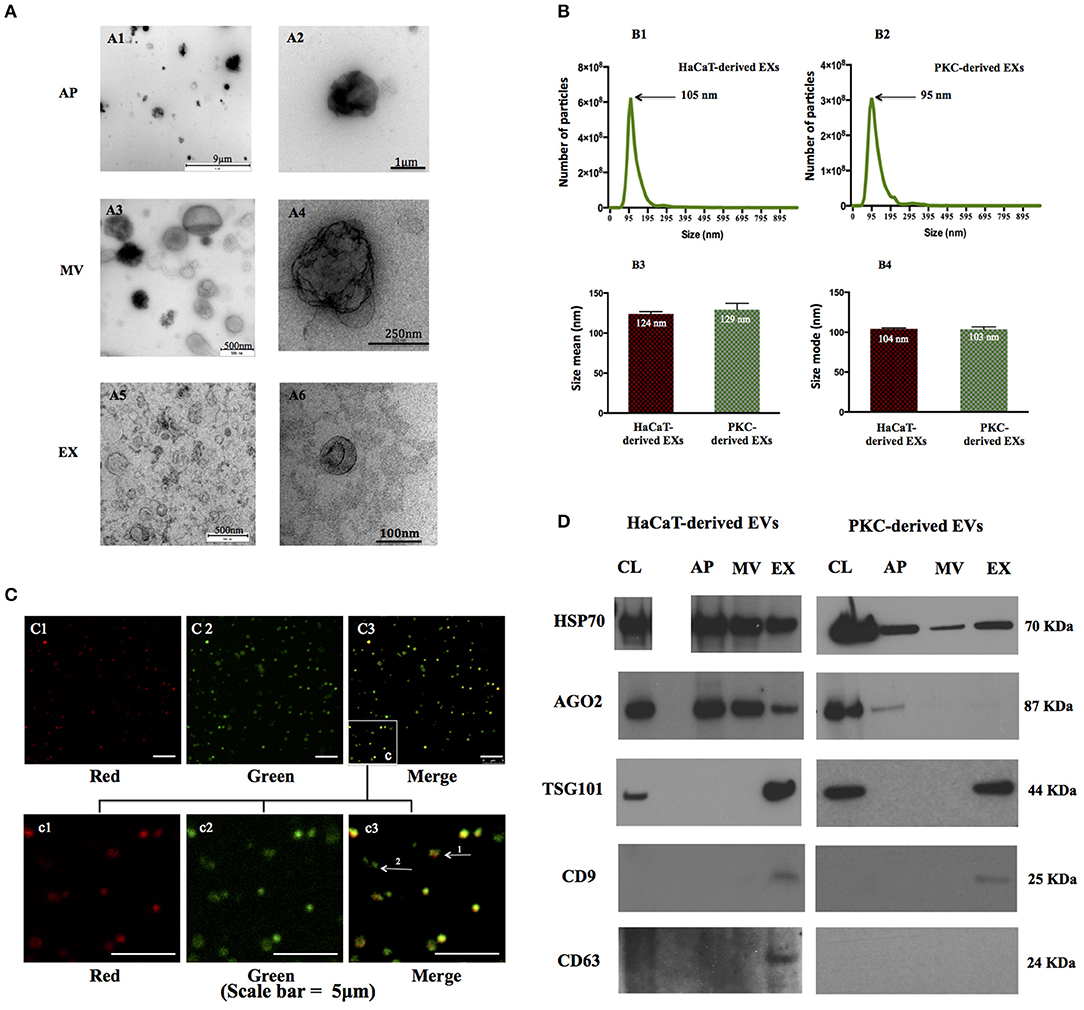
Figure 1. EV populations secreted by human keratinocytes exhibit distinct physio-chemical properties. EV were isolated and characterized from keratinocyte cultures. (A) Morphology of three EV populations was revealed by TEM with a magnification range of 50–2,000,000×. Four independent biological samples were analyzed (HaCaT cells at passage 49, 50, primary keratinocytes isolated from patient # 288, 300). Representative images are of EVs released from HaCaT passage 50). (B) The size distribution of exosome populations were analyzed the NanoSight NS 500 system. Three biological replicates were analyzed for each experiment (HaCaT cell line at passage 49, 50, and 51; PKC patients: #296 at passage 1, #325 at passage 1, and #366 at passage 2). Error bars indicate SD; statistical significance was determined using Student's t-test. (C) AP fractions were examined and photographed by confocal microscopy using a 60× objective. Vesicles were probed with propidium iodide (PI) for DNA (red) and Annexin V-FITC for phosphytidyl serine (PS; green). Notably a sub-population of APs reacted positively with probes for both nucleic acid fragments and PS (arrow 1), whereas other APs reacted positively for PS only (arrow 2). Replicates from HaCaT passage 50, HaCaT passage 53 and PKC isolated from donor # 288 are illustrated; Images are representative for APs released from HaCaT cells passage 53. (D) Proteins enriched in EVs were detected in EVs derived from both HaCaT and PKCs. Representative images of immunoblots of characteristic proteins (TSG 101, AGO2, CD9, and CD63) and 363 (HSP70) identify EVs released from HaCaT passage 50 and PKC passage 1 from patient 306. CL, cell lysate; AP, apoptotic bodies; MV, microvesicles; EX, exosomes.
The nano-scale dimensions of EVs present a challenge for accurate characterization. Therefore, we adopted Nanoparticle Tracking Analysis (NTA), in which the Stokes-Einstein equation is applied to light scattering and Brownian motion to calculate the hydrodynamic parameters of individual particles, which in this case were human keratinocyte-derived EX populations. EXs prepared from human keratinocytes were found to range in size from ~60 nm to ~220 nm in size (Figures 1B1,B2). More specifically, the mean size of PKC-derived EXs was 129 nm while the mean size of HaCaT-derived EXs was 124 nm (Figure 1B3). The size mode of HaCaT-derived EXs and primary keratinocyte-derived EXs was equivalent at 104 and 103 nm, respectively (Figure 1B4).
In contrast to MVs and EXs, APs contain fragments of nuclear DNA and exhibit phosphatidylserine (PS) on the extracellular surface of the vesicle membrane following translocation from the luminal surface during apoptosis and EV shedding (38, 39). Immunofluorescent analysis, utilizing the affinity of Annexin-V for PS and Propidium Iodide (PI) for the detection of nucleic acids, was performed to identify APs in the keratinocyte conditioned media (Figure 1C). While, many of the large EVs that were stained with PI and Annexin-V appeared to have a spherical morphology approximately 1 μm in diameter, others were stained with Annexin-V only and were typically smaller with an irregular morphology (Figures 1C1–C3). This may suggest a contamination of MVs in the AP fraction, or that some APs, literately, do not contain DNA material.
We also found that the EVs in the MV preparations reacted with Annexin-V only and failed to react with PI suggesting that MVs were either intact, excluding PI, or were free from nucleic acids (Supplementary Figure 2).
In order to more comprehensively characterize each EV population, we performed immunoblots for protein markers previously associated with EVs; namely: tetraspanins (CD9, CD63); TSG101; and the intracellular proteins, AGO2 and HSP70 (9, 40, 41). Although we were careful to ensure that total protein from the cell lysates were utilized as controls for protein enrichment some proteins may or may not be expressed in parental cells while they are expressed in the corresponding EVs, or vice versa (41). The data revealed that three out of the five markers investigated, including HSP70, TSG101, AGO2 (PKCs only), were detected in parental cell controls and each of the corresponding EVs (Supplementary Figure 3). However, CD9 and CD63 were detected in EXs, but not in their respective parental cells. As alluded to above, CD63 was only detected in HaCaT-derived EXs while no immunoreactive band was detected in in PKC-derived EXs (Figure 1D).
Taken together, these data indicate that three EV populations, including APs, MVs and EXs, were released from both HaCaT and PKCs in 2D culture. These vesicles exhibited individual characteristics in term of morphology, size and bio-molecular markers.
In order to characterize the miRNA contained within EVs released from keratinocytes, a small RNA next generation sequencing approach was performed on the three EV populations and their parental cells using the Illumina® NextSeq500 platform. The total raw reads were filtered by discarding reads <16 nucleotides in length, prior to alignment with the human genome (hg19). The cells, APs, MVs and EXs exhibited the number of read count and identified miRNAs between the biological replicates (Tables 1, 2). Additionally, the large number of identified miRNAs indicated the enrichment of miRNAs in the three EV populations isolated from keratinocyte cultures (Tables 1, 2). All identified miRNAs with greater than one count were used for further analysis.
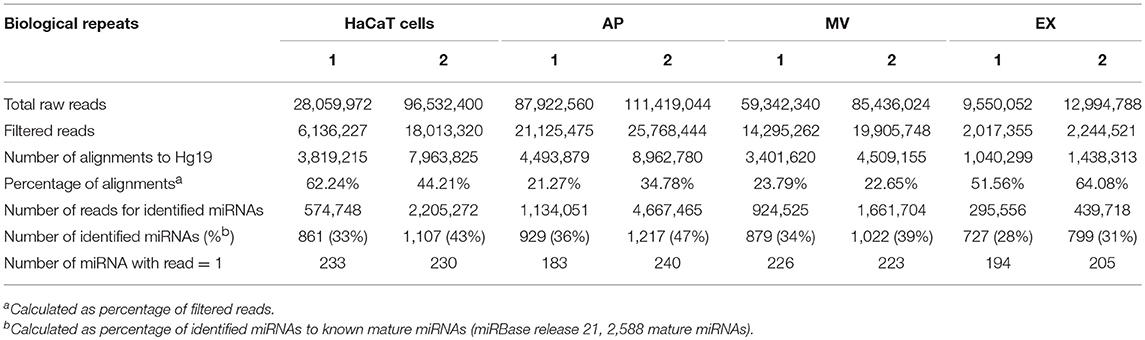
Table 1. Summary of small RNA sequencing from HaCaT samples.
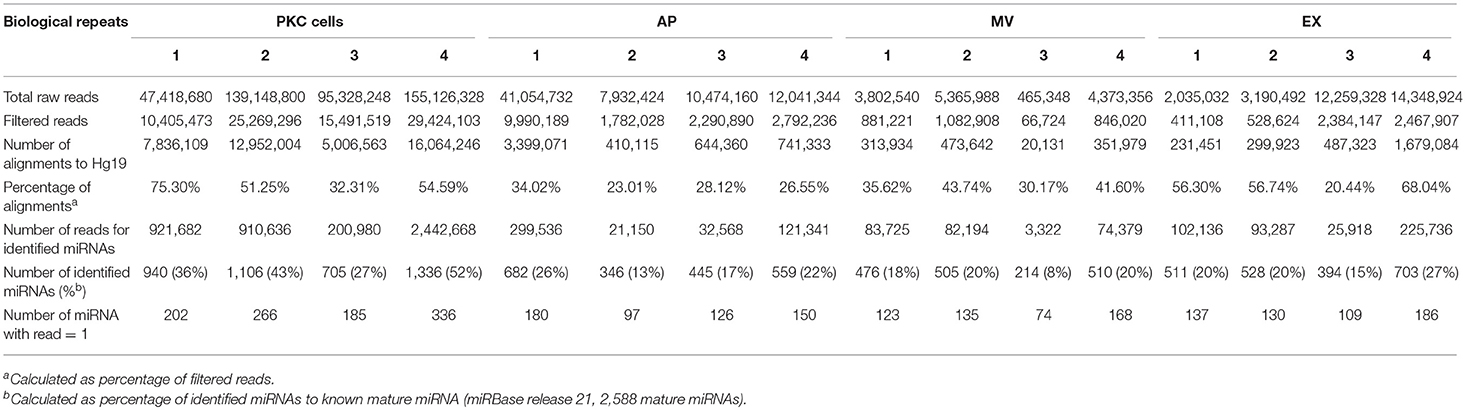
Table 2. Summary of small RNA sequencing from PKC samples.
In order to reveal the degree of overlap in the miRNA population between the different EV subtypes and their parental cells, the individual miRNA species identified with more than one count for each cell type and their respective EVs were subjected to comparative analysis (Figure 2). The results indicated that there were 941, 1,048, 906, and 704 miRNAs identified in parental HaCaT cells, HaCaT-derived APs, MVs and EXs, respectively (Figure 2A). Furthermore, all but 92 of the 941 miRNAs identified in the HaCaT parental cells were also identified in one or more of the HaCaT-derived EV populations, while 623 miRNAs were common to the three populations of HaCaT-derived EVs (Figure 2A). Of the PKC derived miRNAs, 1,226, 608, 506, and 622 miRNAs were identified in parental PKCs, PKC-derived APs, MVs, and EXs, respectively (Figure 2B). A common set of 437 miRNAs were observed between the three EV populations in addition to unique miRNAs for each PKC-derived EV population (Figure 2B).
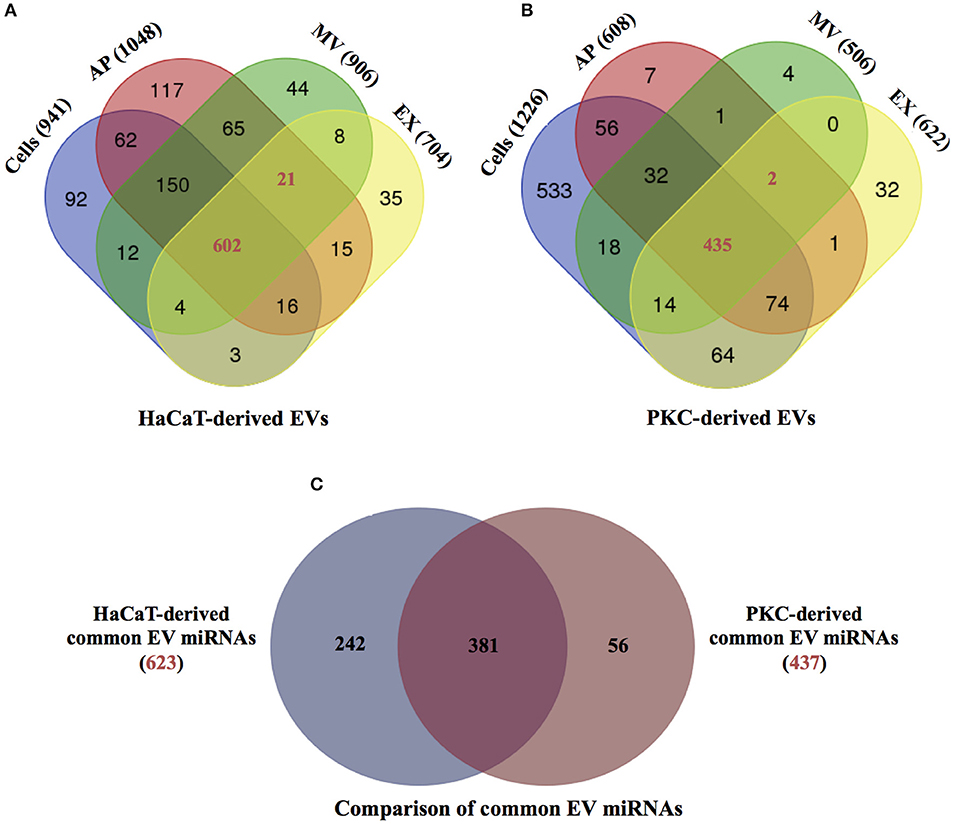
Figure 2. miRNA distribution between parental HaCaT and primary keratinocytes and respective EV populations. The distributions of the identified miRNAs having greater than one count, from (A) HaCaT-derived EVs and HaCaT cells (n = 2 independent biological replicates); and (B) primary keratinocyte-derived EVs and primary keratinocytes (n = 4 independent biological replicates). (C) The distribution of common miRNAs from HaCaT-derived EVs (red number from A, 623 miRNAs) and primary keratinocyte-derived EVs (red number from B, 437 miRNAs; Supplementary Table 2). PKC: primary keratinocytes. Venn diagrams were generated using web-base Venn draw tool (http://bioinformatics.psb.ugent.be/webtools/Venn/).
In order to determine if there were any differences in the miRNA composition associated with EV cellular origin, the 623 common HaCaT-derived EV miRNAs (Figure 2A) and the 437 miRNAs common to PKC-derived EVs (Figure 2B) were compared. The results showed that while there were 381 miRNAs common to EVs derived from both HaCaT and PKCs, 242 and 56 miRNAs were unique to HaCaT- and PKC-derived EVs, respectively (Figure 2C). Among the common HaCaT- and PKC-derived EV miRNAs, miRNA families detected with more than five members were observed, including: hsa-let-7 miRNA; hsa-miR-181; hsa-miR-100; hsa-miR-30; hsa-miR-125; and hsa-miR-27 (Supplementary Table 1).
In order to derive a better understanding of the relationship between vesicles and their parental cells, a correlation coefficient analysis of the sequence data from the identified miRNAs showed a moderate correlation of miRNA contents between vesicles and their respective parental cells (Figure 3). We also found that the Pearson correlation coefficients between the miRNA quantified in HaCaT parental cells and their vesicle populations (Pearson values: 0.946 between cells and APs, 0.95 between cells and MVs, and 0.901 between cells and EXs; Figures 3A,C,E) were greater than those for PKCs and their corresponding vesicle populations (Pearson value: 0.88 between cells and APs, 0.863 between cells and MVs, and 0.863 between cells and EXs; Figures 3B,D,F). These data indicate that the population of miRNA deposited into PKC-derived vesicles are relatively different to those that remain in PKC cells themselves. This was in contrast to the miRNA deposited into HaCaT-derived vesicles which exhibited a comparatively more similar profile to the miRNA within their parental HaCaT cells.
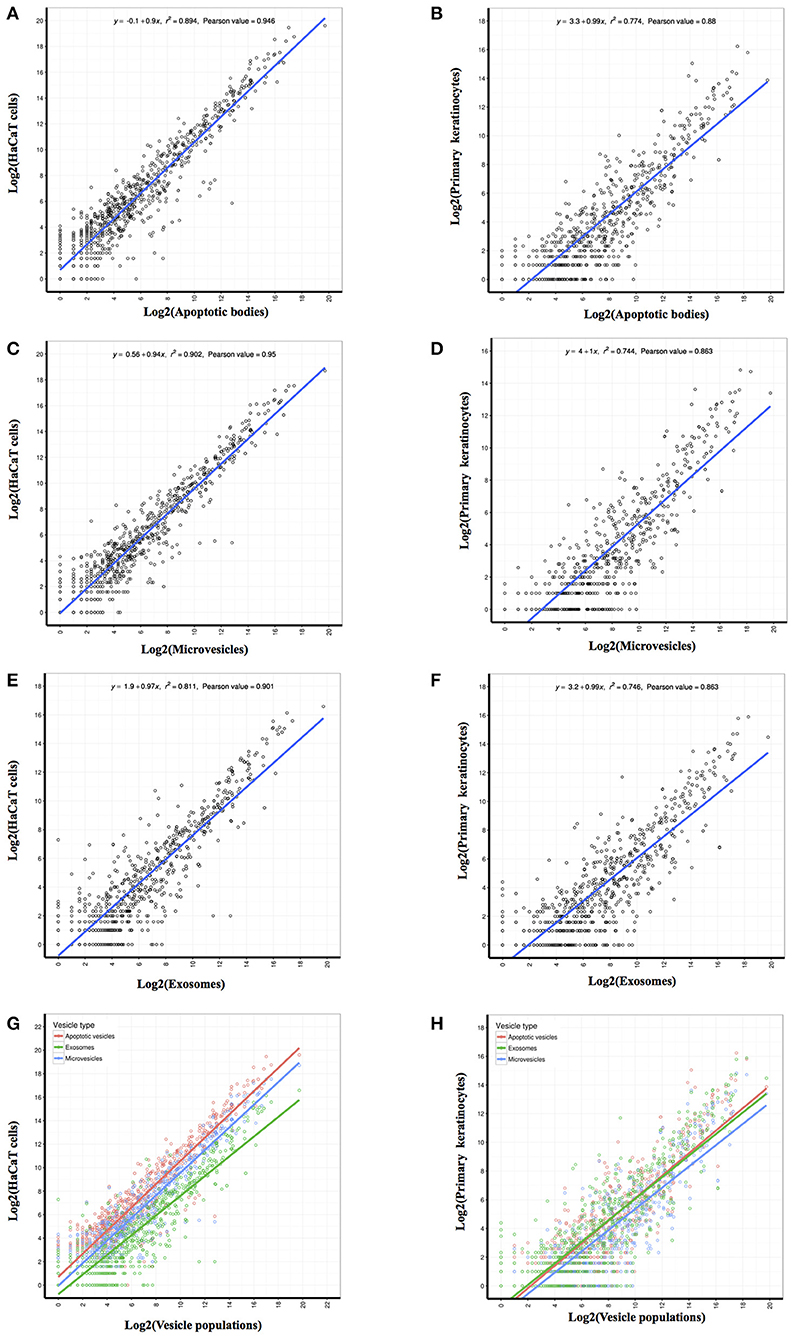
Figure 3. Correlation coefficient analysis of identified miRNAs revealed the linear relationship between each EV population and its parental cell. The abundance value for each identified miRNA was log2 transformed prior to performance of the person correlation analysis. Pearson correlation coefficients were generated between the miRNA identified from HaCaT cells and PKC parental cells and those identified in: (A,B) Apoptotic bodies; (C,D) Microvesicles; and (E,F) Exosomes. Merge of Pearson correlation of miRNA identified in each EV population and miRNA identified in (G) HaCaT cells and (H) PKCs.
To determine if any of the detected exosomal miRNAs from either HaCaT cells or PKCs had not been previously reported, the list of miRNAs detected in the keratinocyte-derived EXs were compared to miRNAs from the ExoCarta database (Version 5, released on 29 July 2015, Supplementary Figure 7). The comparison revealed that 369 miRNAs out of 581 miRNAs from HaCaT derived EXs (64%) had been previously described in the ExoCarta database (Figure 4A). In addition, for PKC-derived EXs, 358 miRNAs out of 838 miRNAs (43%) had been previously reported in the ExoCarta database (Figure 4B). Therefore, 212 and 150 miRNAs from HaCaT and PKC derived EXs, respectively, had not been previously described in the ExoCarta database, and thus had not been previously identified as EX cargo (Supplementary Table 2).
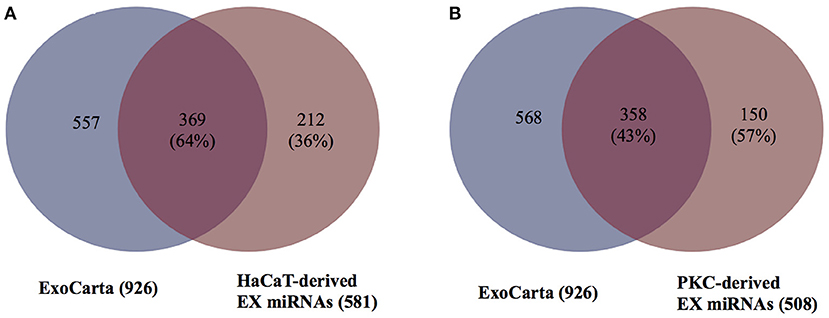
Figure 4. HaCaT and primary keratinocyte derived EXs contain miRNAs previously un-reported as EX cargo. In order to determine the number of previously un-reported miRNAs, the EX miRNAs from the ExoCarta database and the identified EV miRNAs were modified by removal of the lettered suffix indicating 5′ and 3′ of the precursor miRNAs to ensure that the miRNA name was in a compatible format prior to analysis. The 926 miRNAs in the ExoCarta database were compared to: (A) HaCaT-derived EXs; and (B) primary keratinocyte-derived EXs. The analysis and Venn diagram were generated using the R program.
APs, MVs and EXs are formed and released from cells through different pathways and carry distinct molecular cargo (42). The degree of correlation between the miRNA within the three EV populations described herein was examined by Euclidean distance analysis using the total miRNA profile. These data indicated that the miRNA component of APs and MVs were more closely related compared to the miRNAs derived from EXs (Figures 5A,B). A clearer discrimination was observed in the total miRNA counts of EVs from HaCaT cells compared to EVs from PKCs. Specifically, HaCaT p52 and HaCaT p50 derived EXs clustered as a group, which was separate from APs and MVs (Figure 5A). Additionally, PKC derived EXs released from donors # 325 and # 363 were classified together with MVs released from donor # 363, whereas EXs released from donors # 377 and # 366 were classified together (Figure 5B).
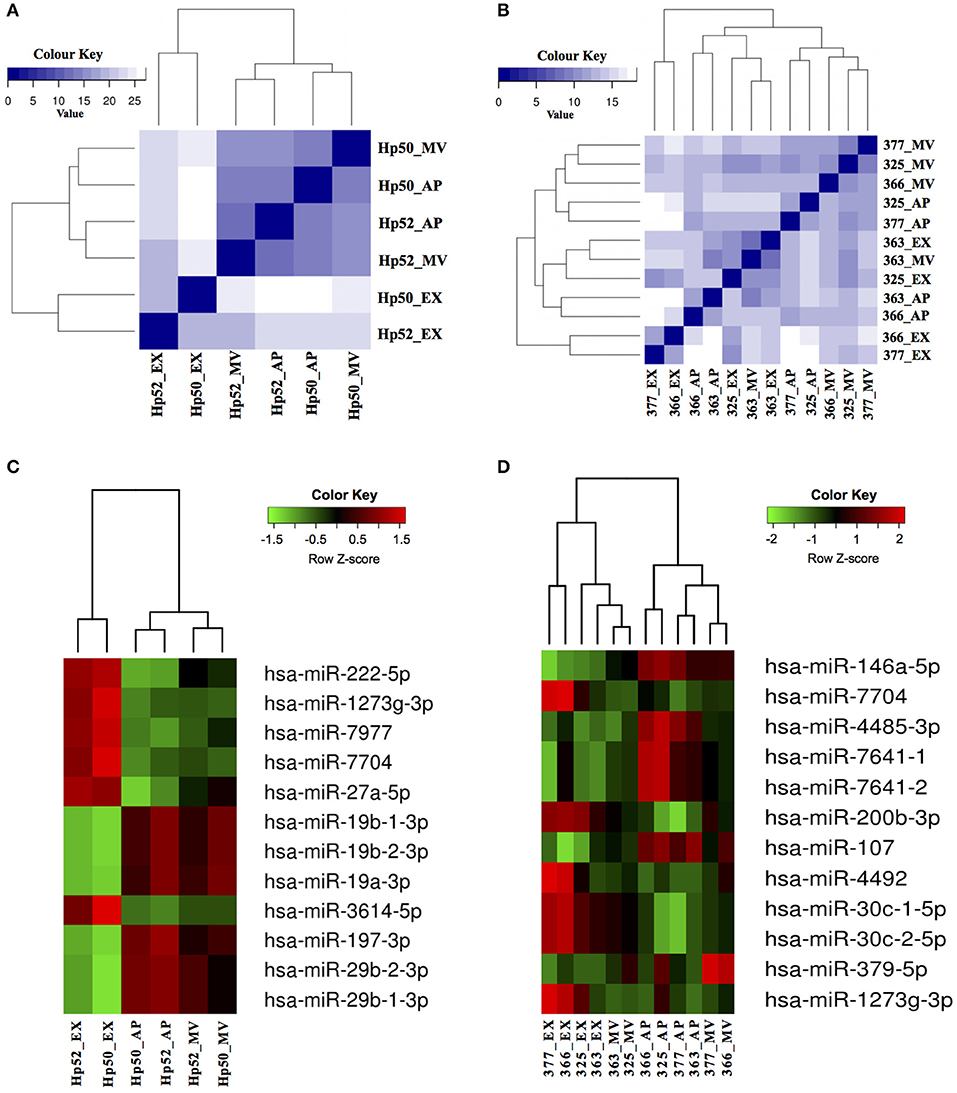
Figure 5. EV derived miRNAs can be used to distinguish between HaCaT and PKC EV sub-populations. The identified EV miRNAs were examined for correlations between the three EV populations derived from (A) HaCaT cells (n = 2 HaCaT p50 and p52); and (B) PKCs (n = 4 independent biological replicates) using Euclidean distance analysis, based on the total miRNA profile. The color scale indicates the degree of correlation between EVs, in which a dark blue color indicates greater correlation and lighter color scale indicates less correlation. Subsequently, hierarchical clustering of the 12 most statistically significant and differentially expressed miRNA from (C) HaCaT and (D) PKCs was performed and presented as a heatmap. The color scale indicates the abundance level of miRNAs, which were ranked based on p-values with the most significant first in the list. Hp50 and Hp52 indicate HaCaT cells were at passage 50 and 52; while 377, 366, 325, and 353 indicate skin donor numbers. AP, apoptotic bodies; MV, microvesicles; EX, exosomes. Heat maps were generated using R program (v 3.2.2).
Analysis of the miRNA expression levels revealed that there were 73 and 16 miRNAs that exhibited significant differences (p < 0.01; Wald test) between the three EV populations released from HaCaT and PKCs, respectively (Supplementary Table 3). Similar to the Euclidean distance analysis, hierarchical clustering of the 12 most significant and differentially expressed miRNAs showed that HaCaT derived EVs clearly clustered into their respective groupings (Figure 5C). However, the 12 most significant and differentially expressed miRNAs from PKC derived EVs exhibited apparent donor based influence on the clustering. Specifically, the EX derived miRNAs from donor #363 clustered more closely with MV derived miRNAs from the same donor (Figure 5B). This potentially reflects a relationship between the EV derived miRNAs and the physiological condition of the parental cells.
Of the most significant HaCaT-derived EV miRNAs, two main groups exhibited inverse expression levels between APs, MVs, and EXs. The six miRNAs: hsa-miR-222-5p; hsa-miR-1273g-3p; hsa-miR-7977; hsa-miR-7704; hsa-miR-27a-5p; and hsa-miR-3614-5p were more abundant in EXs compared to either MVs or APs (Figure 5C). Conversely, hsa-miR-19b-1-3p; hsa-miR-19b-2-3p; hsa-miR-19a-3p; hsa-miR-197-3p; hsa-miR-29b-2-3p; and hsa-miR-29b-1-3p were most abundant in APs and MVs compared to EXs (Figure 5C). Similarly for PKC-derived EVs, the 12 most significant miRNAs were clustered into three distinct groups based on their differential expression. The first group included: hsa-miR-146a-5p; hsa-miR-4485-3p; hsa-miR-7641-1; hsa-miR-7641-2; and hsa-miR-107, which were more abundant in APs, generally lower in abundance in MVs, and had the lowest abundance in EXs (Figure 5D). The second group included: hsa-miR-7704; hsa-miR-200b-3p; hsa-miR-4492; hsa-miR-30c-1-5p; hsa-miR-30c-2-5p; and hsa-miR-1273g-3p, which were most abundant in EXs, lower in MVs and lowest in APs (Figure 5D). The third group only consisted of hsa-miR-379-5p, which was more abundant in MVs, compared to APs and EXs (Figure 5D). Overall, the expression of these miRNAs in PKC derived EVs appeared to be more variable between donors, compared to the miRNA expressed in HaCaT derived EVs (Figures 5C,D).
In order to gain further insight into the potential functions of the various EV populations, the miRNAs that were differentially expressed between APs, MVs, and EXs were analyzed with respect to their target genes. As described above the miRNA content of APs and MVs was distinct from that of EXs. Therefore, the miRNAs with the greatest abundance in APs and MVs were analyzed together as a group, whereas the miRNAs with the greatest abundance in EXs were analyzed separately. The results showed that the miRNAs that were more abundant in HaCaT-derived APs and MVs, including hsa-miR-19b-1-3p, hsa-miR-19b-2-5p, hsa-miR-19a-3p, hsa-miR-197-3p, hsa-miR-29b-2-3p, and hsa-miR-29b-1-3p, are collectively involved in the regulation of 917 genes (Supplementary Figure 5A). The miRNAs that are more abundant in HaCaT-derived EXs, including hsa-miR-222-5p, hsa-miR-1273g-3p, hsa-miR-7977, hsa-miR-7704, hsa-miR-27a-5p, and hsa-miR-3614-5p, were found to be known to regulate 1149 genes (Supplementary Figure 5B). There were 126 genes known to be regulated by both miRNA groups, in addition to 791 genes and 1023 genes thought to be uniquely regulated by HaCaT-derived APs and MVs, and HaCaT-derived EXs, respectively. With regards to PKC-derived EVs, the miRNAs that were more abundant in APs and MVs including hsa-miR-146a-5p, hsa-miR-4485-3p, hsa-miR-7641-1, hsa-miR-7641-2, hsa-miR-107, and hsa-miR-379-5p were found to be known to regulate 625 genes (Supplementary Figure 5C). Furthermore, the miRNAs that were more abundant in EXs including hsa-miR-7704, hsa-miR-200b-3p, hsa-miR-4492, hsa-miR-30c-1-5p, hsa-miR-30c-2-5p and hsa-miR-1273g-3p were found to be known to regulate 595 genes (Supplementary Figure 5D). There were 47 target known to be regulated by miRNAs from both PKC-derived APs and MVs, and PKC derived EXs. Moreover, there were 574 genes and 548 genes that were found to be uniquely regulated by miRNAs from PKC-derived APs and MVs; and PKC-derived EXs, respectively.
Analysis of the biochemical pathways associated with the unique genes regulated by the miRNAs of each EV group using Panther (version 12) showed that the miRNAs derived from APs and MVs that originated from both HaCaT and PKCs regulate genes involved in 14 pathways while the miRNAs derived from EXs that originated from both HaCaT and PKCs regulate genes involved in six pathways (Table 3). The pathways associated with these uniquely regulated genes may indicate some of the particular bioactivities of each EV type.
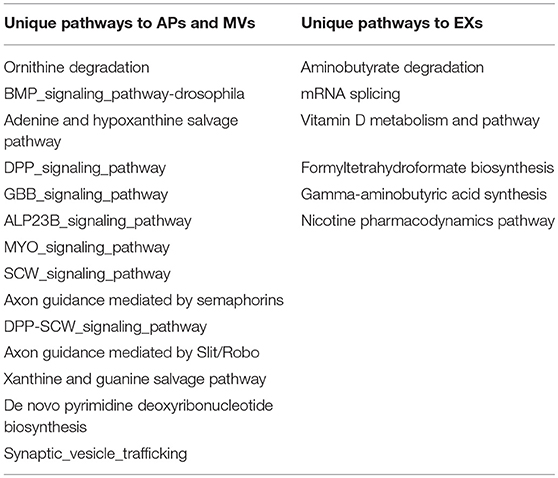
Table 3. Biochemical pathways unique to the group of APs and MVs and the group of EXs from both HaCaT and PKCs.
The number of studies that have investigated EV biology has substantially increased over the past decade as it has become clear that EVs regulate many biological processes (43). However, one of the challenges of EV studies is characterization of EV subpopulations, which is hindered by the lack of consensus standardized methods of isolation and analysis (8, 44). Differences in biogenesis and physical characteristics such as size, weight, content and buoyancy, overlap between different EV populations, which make them difficult to isolate and characterize. Consequently we employed a range of previously reported methods for this study, including NTA, TEM, confocal microscopy, and immunoblotting, in attempt to harmonize characterization of EV populations by differential centrifugation with filtration. As reported herein, the three EV populations having characteristics consistent with APs, MVs, and EXs, appear to be released by both the HaCaT keratinocyte cell line and PKCs into serum-free culture media.
The challenge of obtaining pure EV sub-fractions is well-described in the literature. For these reasons, it is acknowledged that EV populations cannot be defined based simply on size or buoyant density (8, 42, 44). Our current data reveals that each EV fraction exhibited some characteristics that were indicative of the other fractions. For example, the AP fraction included vesicles <1,000 nm and vesicles that had PS positive/DNA negative signatures which is more indicative of MVs than APs (Figures 1A,C). Similarly, vesicles larger than 150 nm which typically indicate MVs, were also evident in the EX fraction (Figure 1B). These data can thus be interpreted to indicate that: (i) AP preparations contain APs that do not contain fragmented DNA (45), and/or (ii) AP and EX preparations are potentially contaminated with MVs. Importantly, the latter is not without precedent, as others have previously reported that vesicles larger than 150 nm are present in EX fractions (7, 46, 47). Moreover, the larger particles present in the EX fraction (Supplementary Figure 4) may have been due to incomplete EV isolation at the g force used in this study (Supplementary Figure 6). Indeed, the size of vesicles can be affected by many factors, including the specific detection technique (46). For example, with regard to TEM, the fixation and staining process can cause some dehydration and shrinkage leading to the collapse of the EXs into the characteristic cup-shape vesicles (36, 46, 48). The shrinkage during staining can also result in the underestimation of the size of vesicles compared to NTA which measure vesicle size by laser light scattering and by tracking Brownian motion of individual vesicles in a liquid (46, 49). Regarding the immunoreactivity data, protein markers may be present in secreted EVs but not in secreting cells. This different distribution of protein markers in secreting cells and secreted EVs potentially indicates selective sorting of proteins into EVs (7, 50, 51). However, it is also possible that protein markers may be present in secreting cells at levels lower than the detection limit of immunoblotting. Furthermore, CD63 was detected in HaCaT-derived EXs only but not in PKC-derived EXs. The diverse enrichment of proteins in EVs has been previously reported as being dependent on the EV type and the cell type from which the EV is released (52, 53). As such, data from this current study are possibly cross-contaminated and this is consistent with previous studies. To eliminate potential cross-contamination, alternative methods have been applied to separate EVs, such as density gradient separation for the isolation of EX, which has limited ability to separate APs from MVs (36, 44). The isolation methods chosen typically depend on the degree of EV purity and EV concentration required by particular studies.
Through utilization of deep sequencing technology, this study has identified large populations of miRNAs in EVs released from cultured HaCaT and freshly isolated human donor PKCs and their respective parental cells. To date, seven published studies have used a deep sequencing approach to profile EV miRNAs (19, 20, 22, 31, 51, 54, 55); however, none has previously utilized this approach to examine the miRNA compliment of keratinocyte-derived EVs. As such, the data presented herein provides valuable information for the future study of EVs in skin. Of particular note, overt differences were evident in EV-derived miRNAs populations between parental cells and their respective EVs (Figures 2A,B, 3). This may indicate the selective sorting of miRNAs into different EV populations during their formation and release process and reflect particular functions of EV populations (11, 56, 57). The selective sorting of miRNAs into EVs might depend on: (i) polyuridylation (a non-template nucleotide) enhanced miRNA incorporation into EVs; (ii) the miRNA maturation pathway that depends on AGO2; (iii) the sequence of mature miRNA; (iv) the abundance levels of complementary 3′ UTR mRNA fragments in EVs; or (v) the binding of miRNAs to heterogeneous nuclear ribonucleoprotein A2B1 (hnRNPA2B1) and subsequent sorting to EVs (58, 59). It is important to note that the mechanism involved in selective miRNA sorting to EVs may be altered given the potential difference in physiological and/or pathological states between donors (59, 60). For example, the level of miR-21 was lower in EX isolated from the healthy donor's serum than those from glioblastoma patients (57). On the other hand, let-7f, miR-20b, and miR-30e-3p were lower in EVs isolated from the plasma of lung carcinoma patients than normal controls (61). In this current study, primary keratinocytes and the HaCaT cell line exhibited potential sorting of unique miRNAs into EVs (Figure 2C). Additionally, the miRNA populations in EVs are also influenced by the source or origin of the secreting cells, number of cell passage, EV isolation methods, and miRNA detection techniques (23, 31, 62–64). miRNAs are highly associated with EV secreting cells, for example members of let-7 family were abundant in EX released from the gastric cancer cell line AZ-P7a but less abundant in EX derived from other cancer cell lines (51). The miR-192 and miR-1207-5p were highly abundant in urine-isolated EX using modified exosome precipitation and much less abundant in those isolated by ultracentrifugation, ultracentrifugation combined to filtration, and ultracentrifugation combined to 30% sucrose cushion (62).
In an attempt to discriminate between the three EV populations, the miRNA content of each was analyzed using Euclidean distance clustering analysis. This analysis indicated that the miRNA profiles of APs and MVs were more similar to each other than to EXs (Figure 5). These results are similar to observations reported in a study of EVs isolated from melanoma cells, where APs and MVs had a greater correlation when compared to EXs (22). It seems that the correlation of miRNA content between EVs depends on both the specific EV population (biogenesis) and also the specific parental cell source (HaCaT cells and individual donors for the PKCs). The latter is supported by evidence from this study which revealed more complex miRNA populations in EVs from freshly isolated PKCs compared to the more homogeneous HaCaT cell line (Figures 5B,D), despite the fact all samples were identically processed. As such, it is quite possible that the variation observed in the miRNA populations from PKC-derived EVs isolated from individual donors may reflect physiological variation between individual donor demographics such as age, diet, sun-exposure or subclinical disease such as diabetes.
Although this current investigation revealed that EVs contain a large number of miRNAs, it is important to determine if those miRNAs have been detected in previous EV studies or are novel. Few studies have investigated EV miRNAs; and to the best of our knowledge no study has investigated keratinocyte-derived EV miRNAs (19, 20, 22, 54). The large number of previously unreported-exosomal miRNAs discovered in this study may be due to the research area being relatively new. Importantly, the ExoCarta database only gathers information for exosomes, leaving a deficit in the curated knowledgebase of AP and MV miRNA cargo. This makes it challenging to interpret the novelty of AP and MV miRNA findings.
Within recent years, consideration of the roles of miRNAs in the regulation of the physiological states of living organisms has increased. Evidence has demonstrated the link between miRNAs and cancer (65, 66), and the connections between miRNAs, including EV miRNAs, with various stages of wound healing biology, such as inflammation, proliferation, angiogenesis and remodeling (reviewed in (67–70)). However, very little practical evidence regarding the association of EV miRNAs and biological events is available. As such, bioinformatic analysis of the genes regulated by EV miRNAs can provide insight as to the relative contribution of EVs and EV miRNAs to various biological activities. For instance, preliminary bioinformatic analysis of genes targeted by miRNAs detected in LIM 1863 colon cancer cell line-derived EVs resulted in various enrichment of biological process, cellular component, and molecular function, such as extracellular matrix, membrane and cancer progression (19). Furthermore, important pathways, such as the p53 signaling pathway; TGF-beta signaling pathway; MAPK signaling pathway; cell cycle; among others, have been associated previously with miRNA regulation (19, 71, 72). In this current study, important and unique pathways were detected for sets of unique target genes regulated by a group of miRNAs associated with both APs and MVs as a group and EXs as a separate group (Table 3). The disparity between the biochemical pathways associated with genes regulated by the miRNAs from each group may arise from the specific differences in the physiological conditions between the different EV types in terms of their biogenesis. Although bioinformatics information may serve to indicate the potential connections between EV miRNAs and functional consequences, it is important that further experiments be performed to more deeply understand the mechanisms of EV miRNA regulation of their target genes and subsequent biological functions.
Taken together, we cannot exclude that minor inconsistencies in sample preparation may be responsible for the observed differences in cellular responses reflecting impurities observed between different donors and EV preparations. However, it is noteworthy that miRNAs in EVs from HaCaTs revealed a clear and consistent separation between EV subpopulations (Figures 5A,C), but greater variations were assayed in miRNA populations in EVs from PKCs (Figures 5B,D). These data suggest that the purity of EV preparations is unlikely to affect cellular responses to EV miRNA populations. The finding that the miRNAs identified within specific EV populations are known to regulate unique sets of target genes associated with particular biochemical pathways support this conclusion. Notwithstanding, a detailed investigation of the mechanistic processes of EV mediated intercellular communication is warranted; however, this was beyond the scope of the study and remains a key area of future investigation.
UT, DG, DL, JB, CS, and TP contributed in design of the work, analysis and interpretation of data. UT drafted the manuscript. DG, DL, JB, CS, and TP revised the manuscript. All authors have approved the manuscript submission.
The Australian Government's Cooperative Research Centre Program award 182 (2010–2018)—Wound Management Innovation CRC, project 1.05.
The authors declare that the research was conducted in the absence of any commercial or financial relationships that could be construed as a potential conflict of interest.
The authors would like to acknowledge the support of the Australian Government's Cooperative Research Centre Programme. We would like to thank Ms Sahana Manoli for miRNA sequencing using Illumina® NextSeq500 (Central Analytical Research Facility, Institute for Future Environments, QUT). We also would like to thank CS-Lions Medical Research Foundation (LMRF) and Fondo Nacional de Desarrollo Científico y Tecnológico (FONDECYT 1170809), Chile.
The Supplementary Material for this article can be found online at: https://www.frontiersin.org/articles/10.3389/fendo.2018.00535/full#supplementary-material
1. Hao S, Bai O, Yuan J, Qureshi M, Xiang J. Dendritic cell-derived exosomes stimulate stronger CD8+ CTL responses and antitumor immunity than tumor cell-derived exosomes. Cell Mol Immunol. (2006) 3:205–11.
2. Michael A, Bajracharya SD, Yuen ST, Zhou H, Star RA, Illei GG, et al. Exosomes from human saliva as a source of microRNA biomarkers. Oral Dis. (2010) 16:34–8. doi: 10.1111/j.1601-0825.2009.01604.x
3. Keller S, Altevogt P, Rupp C, Stoeck A, Runz S, Fogel M, et al. CD24 is a marker of exosomes secreted into urine and amniotic fluid. Kidney Int. (2007) 72:1095–102. doi: 10.1038/sj.ki.5002486
4. Zonneveld MI, Brisson AR, van Herwijnen JC, Tan S, van de Lest CHA, Redegeld FA, et al. Recovery of extracellular vesicles from human breast milk is influenced by sample collection and vesicle isolation procedures. J Extracell Vesicles (2014) 3:1–12. doi: 10.3402/jev.v3.24215
5. Lasser C, Valadi H, Alikhani VS, Ekstrom K, Eldh M, Paredes T, et al. Human saliva, plasma and breast milk exosomes contain RNA:uptake by macrophages. J Transl Med. (2011) 9:9. doi: 10.1186/1479-5876-9-9
6. Thery C, Boussac M, Veron P, Ricciardi-Castagnoli P, Raposo G, Garin J, et al. Proteomic analysis of dendritic cell-derived exosomes: a secreted subcellular compartment distinct from apoptotic vesicles. J Immunol. (2001) 166:7309–18. doi: 10.4049/jimmunol.166.12.7309
7. Keerthikumar S, Gangoda L, Liem M, Fonseka P, Atukorala I, Ozcitti C, et al. Proteogenomic analysis reveals exosomes are more oncogenic than ectosomes. Oncotarget (2015) 6:15375–96. doi: 10.18632/oncotarget.3801
8. György B, Kittel A, Nagy G, Falus A, Buzás EI, Szabó TG, et al. Membrane vesicles, current state-of-the-art: emerging role of extracellular vesicles. Cell Mol Life Sci. (2011) 68:2667–88. doi: 10.1007/s00018-011-0689-3
9. Lee TH, D'Asti E, Magnus N, Al-Nedawi K, Meehan B, Rak J. Microvesicles as mediators of intercellular communication in cancer—the emerging science of cellular “debris.” Immunopathol. (2011) 33:455–67. doi: 10.1007/s00281-011-0250-3
10. Crescitelli R, Lässer C, Szabó TG, Kittel A, Eldh M, Dianzani I, et al. Distinct RNA profiles in subpopulations of extracellular vesicles: apoptotic bodies, microvesicles and exosomes. J Extracell Vesicles (2013) 2:1–10. doi: 10.3402/jev.v2i0.20677
11. Valadi H, Ekström K, Bossios A, Sjöstrand M, Lee JJ. Exosome-mediated transfer of mRNAs and microRNAs is a novel mechanism of genetic exchange between cells. Nat Cell Biol. (2007) 9:654–9. doi: 10.1038/ncb1596
12. Bilyy RO, Shkandina T, Tomin A, Muñoz LE, Franz S, Antonyuk V, et al. Macrophages discriminate glycosylation patterns of apoptotic cell-derived microparticles. J Biol Chem. (2012) 287:496–503. doi: 10.1074/jbc.M111.273144
13. Akers JC, Gonda D, Kim R, Carter BS, Chen CC. Biogenesis of extracellular vesicles (EV): exosomes, microvesicles, retrovirus-like vesicles, and apoptotic bodies. J Neurooncol. (2013) 113:1–11. doi: 10.1007/s11060-013-1084-8
14. Smith JA, Leonardi T, Huang B, Iraci N, Vega B, Pluchino S. Extracellular vesicles and their synthetic analogues in aging and age-associated brain diseases. Biogerontology (2015) 16:147–185. doi: 10.1007/s10522-014-9510-7
15. Bartel DP. MicroRNAs: genomics, biogenesis, mechanism, and function. Cell (2004) 116:281–97. doi: 10.1016/S0092-8674(04)00045-5
16. Esteller M. Non-coding RNAs in human disease. Nat Rev Genet. (2011) 12:861–74. doi: 10.1038/nrg3074
17. Krol J, Loedige I, Filipowicz W. The widespread regulation of microRNA biogenesis, function and decay. Nat Rev Genet. (2010) 11:597–610. doi: 10.1038/nrg2843
18. Hunter MP, Schmittgen TD, Nana-Sinkam SP, Jarjoura D, Marsh CB, Ismail N, et al. Detection of microRNA expression in human peripheral blood microvesicles. PloS ONE (2008) 3:e3694. doi: 10.1371/journal.pone.0003694
19. Ji H, Chen MS, Greening DW, He WF, Rai A, Zhang WW, et al. Deep sequencing of RNA from three different extracellular vesicle (EV) subtypes released from the human LIM1863 colon cancer cell line uncovers distinct miRNA-enrichment signatures. Plos ONE (2014) 9:e110314. doi: 10.1371/journal.pone.0110314
20. Huang X, Yuan T, Tschannen M, Sun Z, Jacob H, Du M, et al. Characterization of human plasma-derived exosomal RNAs by deep sequencing. BMC Genomics (2013) 14:319. doi: 10.1186/1471-2164-14-319
21. Hessvik NP, Phuyal S, Brech A, Sandvig K, Llorente A. Profiling of microRNAs in exosomes released from PC-3 prostate cancer cells. Biochim Biophys Acta (2012) 1819:1154–63. doi: 10.1016/j.bbagrm.2012.08.016
22. Lunavat TR, Cheng L, Kim K, Bhadury J, Jang SC, Lässer C, et al. Small RNA deep sequencing discriminates subsets of extracellular vesicles released by melanoma cells—evidence of unique microRNA cargos. RNA Biol. (2015) 12:810–23. doi: 10.1080/15476286.2015.1056975
23. Cheng L, Sharples RA, Scicluna BJ, Hill AF. Exosomes provide a protective and enriched source of miRNA for biomarker profiling compared to intracellular and cell-free blood. J Extracell Vesicles (2014) 3:23743. doi: 10.3402/jev.v3.23743
24. Di Meglio P, Nickoloff BJ, Nestle FO, Qin J-Z. Skin immune sentinels in health and disease. Nat Rev Immunol. (2009) 9:679–91. doi: 10.1038/nri2622
25. Raghavan S, Fuchs E. Getting under the skin of epidermal morphogenesis. Nat Rev Genet. (2002) 3:199–209. doi: 10.1038/nrg758
26. Chavez-Muñoz C, Kilani RT, Ghahary A. Profile of exosomes related proteins released by differentiated and undifferentiated human keratinocytes. J Cell Physiol. (2009) 221:221–31. doi: 10.1002/jcp.21847
27. Chavez-Muñoz C, Morse J, Kilani R, Ghahary A. Primary human keratinocytes externalize stratifin protein via exosomes. J Cell Biochem. (2008) 104:2165–73. doi: 10.1002/jcb.21774
28. Rheinwald JG, Green H. Serial cultivation of strains of human epidermal keratinocytes: the formation of keratinizing colonies from single cells. Cell (1975) 6:331–43. doi: 10.1016/S0092-8674(75)80001-8
29. Boukamp P, Petrussevska RT, Breitkreutz D, Hornung J, Markham A, Fusenig NE. Normal keratinization in a spontaneously immortalized aneuploid human keratinocyte cell line. J Cell Biol. (1988) 106:761–71. doi: 10.1083/jcb.106.3.761
30. Chiba M, Kimura M, Asari S. Exosomes secreted from human colorectal cancer cell lines contain mRNAs, microRNAs and natural antisense RNAs, that can transfer into the human hepatoma HepG2 and lung cancer A549 cell lines. Oncol Rep. (2012) 28:1551–8. doi: 10.3892/or.2012.1967
31. Zhou Q, Li X, Li M, Wang X, Li Q, Wang T, et al. Immune-related microRNAs are abundant in breast milk exosomes. Int J Biol Sci. (2012) 8:118–23. doi: 10.7150/ijbs.8.118
32. Chomczynski P, Sacchi N. The single-step method of RNA isolation by acid guanidinium thiocyanate-phenol-chloroform extraction: twenty-something years on. Nat Protocols (2006) 1:581–5. doi: 10.1038/nprot.2006.83
33. Love MI, Huber W, Anders S. Moderated estimation of fold change and dispersion for RNA-seq data with DESeq2. Genome Biol. (2014) 15:550. doi: 10.1186/s13059-014-0550-8
34. R Development Core Team. R: A Language and Environment for Statistical Computing. Vienna: The R Foundation for Statistical Computing (2011).
35. Thomas PD, Campbell MJ, Kejariwal A, Mi H, Karlak B, Daverman R, et al. PANTHER: a library of protein families and subfamilies indexed by function. Genome Res. (2003) 13:2129–41. doi: 10.1101/gr.772403
36. Théry C, Amigorena S, Raposo G, Clayton A. Isolation and characterization of exosomes from cell culture supernatants and biological fluids. Curr Protocols Cell Biol. (2006) 3:3.22. doi: 10.1002/0471143030.cb0322s30
37. Cocucci E, Racchetti G, Podini P, Meldolesi J. Enlargeosome traffic: exocytosis triggered by various signals is followed by endocytosis, membrane shedding or both. Traffic (2007) 8:742–57. doi: 10.1111/j.1600-0854.2007.00566.x
38. Heijnen HF, Schiel AE, Fijnheer R, Geuze HJ, Sixma JJ. Activated platelets release two types of membrane vesicles: microvesicles by surface shedding and exosomes derived from exocytosis of multivesicular bodies and alpha-granules. Blood (1999) 94:3791–9.
39. Hristov M, Erl W, Linder S, Weber C. Apoptotic bodies from endothelial cells enhance the number and initiate the differentiation of human endothelial progenitor cells in vitro. Blood (2004) 104:2761–6. doi: 10.1182/blood-2003-10-3614
40. Logozzi M, De Milito A, Lugini L, Borghi M, Calabrò L, Spada M, et al. High levels of exosomes expressing CD63 and Caveolin-1 in plasma of melanoma patients. PLoS ONE (2009) 4:e5219. doi: 10.1371/journal.pone.0005219
41. Lötvall J. Minimal experimental requirements for definition of extracellular vesicles and their functions: a position statement from the international society for extracellular vesicles. J Extracell Vesicles (2014) 3:1–6. doi: 10.3402/jev.v3.26913
42. Raposo G, Stoorvogel W. Extracellular vesicles: exosomes, microvesicles, and friends. J Cell Biol. (2013) 200:373–83. doi: 10.1083/jcb.201211138
43. Yáñez-Mó M, Siljander PRM, Andreu Z, Zavec AB, Borràs FE, Buzas EI, et al. Biological properties of extracellular vesicles and their physiological functions. J Extracell Vesicles (2015) 4:27066. doi: 10.3402/jev.v4.27066
44. Witwer KW, Buzás EI, Bemis LT, Bora A, Lässer C, Lötvall J, et al. Standardization of sample collection, isolation and analysis methods in extracellular vesicle research. J Extracell Vesicles (2013) 2:1–25. doi: 10.3402/jev.v2i0.20360
45. Elmore S. Apoptosis: a review of programmed cell death. Toxicol Pathol. (2007) 35:495–516. doi: 10.1080/01926230701320337
46. Dragovic RA, Gardiner C, Brooks AS, Tannetta DS, Ferguson DJ, Hole P, et al. Sizing and phenotyping of cellular vesicles using nanoparticle tracking analysis. Nanomedicine (2011) 7:780–8. doi: 10.1016/j.nano.2011.04.003
47. Jeppesen DK, Hvam ML, Primdahl-Bengtson B, Boysen AT, Whitehead B, Dyrskjøt L, et al. Comparative analysis of discrete exosome fractions obtained by differential centrifugation. J Extracell Vesicles (2014) 3:1–16. doi: 10.3402/jev.v3.25011
48. Jensen OA, Prause JU, Laursen H. Shrinkage in preparatory steps for SEM. A study on rabbit corneal endothelium. Albrecht Von Graefes Arch Klin Exp Ophthalmol. (1981) 215:233–42.
49. Filipe V, Hawe A, Jiskoot W. Critical evaluation of nanoparticle tracking analysis (NTA) by nanosight for the measurement of nanoparticles and protein aggregates. Pharm Res. (2010) 27:796–810. doi: 10.1007/s11095-010-0073-2
50. Escola JM, Kleijmeer MJ, Stoorvogel W, Griffith JM, Yoshie O, Geuze HJ. Selective enrichment of tetraspan proteins on the internal vesicles of multivesicular endosomes and on exosomes secreted by human B-lymphocytes. J Biol Chem (1998) 273:20121–7.
51. Guduric-Fuchs J, O'Connor A, Camp B, O'Neill, Christina L, Medina RJ, et al. Selective extracellular vesicle-mediated export of an overlapping set of microRNAs from multiple cell types. BMC Genomics (2012) 13:357. doi: 10.1186/1471-2164-13-357
52. Kowal J, Arras G, Colombo M, Jouve M, Morath JP, Primdal-Bengtson B, et al. Proteomic comparison defines novel markers to characterize heterogeneous populations of extracellular vesicle subtypes. Proc Natl Acad Sci USA. (2016) 113:E968–77. doi: 10.1073/pnas.1521230113
53. Yoshioka Y, Konishi Y, Kosaka N, Katsuda T, Kato T, Ochiya T. Comparative marker analysis of extracellular vesicles in different human cancer types. J Extracell Vesicles (2013) 2:1–9. doi: 10.3402/jev.v2i0.20424
54. van Balkom BWM, Eisele AS, Pegtel DM, Bervoets S, Verhaar MC. Quantitative and qualitative analysis of small RNAs in human endothelial cells and exosomes provides insights into localized RNA processing, degradation and sorting. J Extracell Vesicles (2015) 4:26760. doi: 10.3402/jev.v4.26760
55. Bellingham SA, Coleman BM, Hill AF. Small RNA deep sequencing reveals a distinct miRNA signature released in exosomes from prion-infected neuronal cells. Nucleic Acids Res. (2012) 40:10937–49. doi: 10.1093/nar/gks832
56. Nazarenko I, Rana S, Baumann A, McAlear J, Hellwig A, Trendelenburg M, et al. Cell surface tetraspanin Tspan8 contributes to molecular pathways of exosome-induced endothelial cell activation. Cancer Res. (2010) 70:1668–78. doi: 10.1158/0008-5472.CAN-09-2470
57. Skog J, Wurdinger T, van Rijn S, Meijer D, Gainche L, Sena-Esteves M, et al. Glioblastoma microvesicles transport RNA and protein that promote tumor growth and provide diagnostic biomarkers. Nat Cell Biol. (2008) 10:1470–6. doi: 10.1038/ncb1800
58. Anna MLC-S, Mäger I, Wood MJA. Circulating micrornas in disease diagnostics and their potential biological relevance. In: Extracellular microRNAs in Membrane Vesicles and Non-vesicular Carriers. Hungary: Springer (2015). p. 106.
59. Villarroya-Beltri C, Gutierrez-Vazquez C, Sanchez-Cabo F, Perez-Hernandez D, Vazquez J, Martin-Cofreces N, et al. Sumoylated hnRNPA2B1 controls the sorting of miRNAs into exosomes through binding to specific motifs. Nat Commun. (2013) 4:2980. doi: 10.1038/ncomms3980
60. Zernecke A, Bidzhekov K, Noels H, Shagdarsuren E, Gan L, Denecke B, et al. Delivery of microRNA-126 by apoptotic bodies induces CXCL12-dependent vascular protection. Sci Signal. (2009) 2(100):ra81. doi: 10.1126/scisignal.2000610
61. Silva J, Garcia V, Zaballos A, Provencio M, Lombardia L, Almonacid L, et al. Vesicle-related microRNAs in plasma of nonsmall cell lung cancer patients and correlation with survival. Eur Respir J. (2011) 37:617–23. doi: 10.1183/09031936.00029610
62. Alvarez ML, Khosroheidari M, Ravi RK, DiStefano JK. Comparison of protein, microRNA, and mRNA yields using different methods of urinary exosome isolation for the discovery of kidney disease biomarkers. Kidney Int. (2012) 82:1024–32. doi: 10.1038/ki.2012.256
63. Barutta F, Tricarico M, Corbelli A, Annaratone L, Pinach S, Grimaldi S, et al. Urinary exosomal microRNAs in incipient diabetic nephropathy. PLoS ONE (2013) 8:e73798. doi: 10.1371/journal.pone.0073798
64. Momen-Heravi F, Balaj L, Alian S, Mantel P-Y, Halleck AE, Trachtenberg AJ, et al. Current methods for the isolation of extracellular vesicles. Biol Chem. (2013) 394:1253–62. doi: 10.1515/hsz-2013-0141
65. Gorenchtein M, Poh CF, Saini R, Garnis C. MicroRNAs in an oral cancer context-from basic biology to clinical utility. J Dental Res. (2012) 91:440–6. doi: 10.1177/0022034511431261
66. Gumireddy K, Gimotty A, Katsaros D, Coukos G, Zhang L, Puré E, et al. The microRNAs miR-373 and miR-520c promote tumour invasion and metastasis. Nat Cell Biol. (2008) 10:202–10. doi: 10.1038/ncb1681
67. Banerjee J, Chan YC, Sen CK. MicroRNAs in skin and wound healing. Physiol Genomics (2011) 43:543–56. doi: 10.1152/physiolgenomics.00157.2010
68. Roy S, Sen CK. miRNA in wound inflammation and angiogenesis. Microcirculation (2012) 19:224–32. doi: 10.1111/j.1549-8719.2011.00156.x
69. Sen CK, Roy S. microRNA in cutaneous wound healing. In: Current Perspectives in microRNAs. Dordrecht: Springer (2008). p. 349–66.
70. Than UTT, Guanzon D, Leavesley D, Parker T. Association of extracellular membrane vesicles with cutaneous wound healing. Int J Mol Sci. (2017) 18:E956. doi: 10.3390/ijms18050956
71. Harris SL, Levine AJ. The p53 pathway:positive and negative feedback loops. Oncogene (2005) 24:2899–908. doi: 10.1038/sj.onc.1208615
Keywords: extracellular vesicles, apoptotic body, microvesicle, exosome, microRNA, keratinocytes
Citation: Than UTT, Guanzon D, Broadbent JA, Leavesley DI, Salomon C and Parker TJ (2018) Differential Expression of Keratinocyte-Derived Extracellular Vesicle Mirnas Discriminate Exosomes From Apoptotic Bodies and Microvesicles. Front. Endocrinol. 9:535. doi: 10.3389/fendo.2018.00535
Received: 11 October 2017; Accepted: 22 August 2018;
Published: 11 September 2018.
Edited by:
James Olcese, Florida State University, United StatesReviewed by:
Marcio Alberto Torsoni, Universidade Estadual de Campinas, BrazilCopyright © 2018 Than, Guanzon, Broadbent, Leavesley, Salomon and Parker. This is an open-access article distributed under the terms of the Creative Commons Attribution License (CC BY). The use, distribution or reproduction in other forums is permitted, provided the original author(s) and the copyright owner(s) are credited and that the original publication in this journal is cited, in accordance with accepted academic practice. No use, distribution or reproduction is permitted which does not comply with these terms.
*Correspondence: Uyen T.T. Than, di51eWVudHR0QHZpbm1lYy5jb20=
Tony J. Parker, YS5wYXJrZXJAcXV0LmVkdS5hdQ==
Disclaimer: All claims expressed in this article are solely those of the authors and do not necessarily represent those of their affiliated organizations, or those of the publisher, the editors and the reviewers. Any product that may be evaluated in this article or claim that may be made by its manufacturer is not guaranteed or endorsed by the publisher.
Research integrity at Frontiers
Learn more about the work of our research integrity team to safeguard the quality of each article we publish.