 Pablo Pérez1,2
 Juan A. Serrano-Viseas1,2Santiago Fernández-Scagliusi1,2Daniel Martín-Fernández1,2Gloria Huertas2,3
 Alberto Yúfera1,2*
- 1Instituto de Microelectrónica de Sevilla (IMSE-CSIC), Universidad de Sevilla, Sevilla, Spain
- 2Dto. Tecnología Electrónica, Escuela Técnica Superior de Ingeniería Informática, Universidad de Sevilla, Sevilla, Spain
- 3Dto. Electrónica y Electromagnetismo, Facultad de Física, Universidad de Sevilla, Sevilla, Spain
Biological Impedance is a physical property related to the state and inherent evolution of biological samples. Among the existing impedance measurement methods, Oscillation-Based (OB) tests are a simple and smart solution to indirectly measure impedance correlated with the amplitude and frequency of the generated oscillation which are proportional to the sample under test. An OB test requires tuning of the system blocks to specifications derived from every measurement problem. The OB setup must be done to obtain the optimum measurement sensitivity for the specific constraints imposed by the system under test, electronic interfaces, and electrodes employed for test. This work proposes the extension of OB measurement systems to spectroscopy test, enabling a completely new range of applications for this technology without the restrictions imposed by setting a fixed frequency on the electrical oscillator. Some examples will be presented to the measurement of cell cultures samples, considering the corresponding circuit interfaces and electric models for the electrode-cell system. The proposed analysis method allows the selection of the best oscillator elements for optimum sensitivity range in amplitude and frequency oscillation values, when a specific cell culture is monitored for the OB system.
Introduction
Biological Impedance or Bio-Impedance (BI) is a very relevant biomarker among different biological and medical processes in live matter. Impedance is a physical property related to the opposition of an entity (or matter) to allow the electric current to flow between two separated points. This opposition to the free electric charge flow is characterized by two general parameters: the conductivity (σ) and the permittivity (ε). These properties reflect the physical state and underlying biological processes and is largely dependent on frequency (Schwan, 1957). BI is employed as a biomarker in many biological fields, such as in cell culture applications in cell biology (“ECIS Cell, ), genetics (Schmidt et al., 2019), biochemistry (Jun et al., 2018), pharmacology (Alexander et al., 2013), tissue engineering (Nordberg et al., 2017), immunology (Hsu et al., 2018), and food control (Rego et al., 2015). To solve the main drawback of classical end-point protocols, Giaever et al. (Giaever and Keese, 1986) proposed the so-called Electrical Cell-Substrate Sensing (ECIS) technique as an alternative procedure to perform real-time monitoring of CCs, thereby avoiding multiple samples, and performing all measurements over the same culture. The ECIS method is based on placing the culture between two electrodes. When an AC voltage (the most common is sinusoidal, at 1 kHz frequency) is applied between the electrodes, the cells in the current line’s path cause a lower or higher current depending on their higher or lower resistance. A low-density cell culture means a large current due to its lower resistance, and vice versa.
This real-time monitoring procedure for cell culture requires the bioimpedance test between the 2-electrodes system, using the corresponding circuits for that. Also, an adequate electric model for the electrode-medium-cell system is required to decode the bioimpedance measurements, and to know approximately how many cells are present in the culture at a given instant.
In addition, to have a full and exact bioimpedance description of a biological material, in most cases it is required to test it in a wide frequency range. Bioinstrumentation must be properly designed to work in the frequencies of interest. Electronic systems for a BI test apply algorithms and strategies to pick-up the BI value of every biological sample under test (BSUT), requiring specific circuits with strong specifications, making the required instrumentation circuit difficult to design and implement.
BI techniques have been widely developed by many authors. A classical reference describing the general methods and applications can be found in (Grimnes and Martinsen, 2008), while (Pérez García, 2019) provides a more detailed review on the cell culture field. Most of them consider the need of using a sinusoidal generator circuit as a voltage generator to be applied at the system under test. This is difficult for electronic designers and increases the cost for spectroscopy applications.
The Oscillation-Based (OB) technique (Huertas et al., 2015) has been proposed as a useful approach for BI tests. Advantages over different design strategies include reduction of the number of electronic building blocks and avoidance of the sinusoidal signal generator. The OBT is fundamentally based on designing an electronic oscillator with the BSUT located in the electrical oscillation path. Such implementation forms an electronic bio-oscillator with specific oscillation amplitudes and frequencies directly related to the BSUT.
For the second important point, the electrical model to decode the bioimpedance measurements, several proposals have been delivered, with two being the most relevant. In (Giaever and Keese, 1991) the cell culture is considered as a monolayer and the solution of Maxwell’s equations is obtained for the electrical field in the electrode-cell interface. To find the solution, parameter values such as Rb (barrier resistance between cells), h (electrode-cell interface distance), and r (cell radius) were proposed and selected to fulfil the equations derived. In a subsequent study, Huang et al. (Huang et al., 2004), considered a single cell on top of an electrode and extracted the electrical performance of the system by simulating its electrical response to an AC signal with finite-element simulation tools. A new resistance Rgap–the so-called gap resistance–was incorporated to the electrode-cell electrical model that represented the obstruction to the electrical current flowing along the electrode-cell interface, which usually extends several nanometres. They also included a geometrical parameter ff–the so-called fill factor–that described the percentage of electrode area covered by the cells. In this work, the second model was chosen, because in a general cell culture, the monolayer phase is only of application in the confluence phase, with the ff parameter being an adequate parameter for real-time monitoring of the cell culture.
This work presents an extension of the OB technique to spectroscopy analysis by introducing programmable electronic bio-oscillator parameters. The Bio-Oscillator will be described in more detail in the paper. First, the main components of the OB programmable system will be defined, together with the frequency programming procedure, system constraints, and specifications. Then, mathematical simulations and results for several study cases will be described. In parallel, the Figures-of-Merit (FOM) for design optimization and spectroscopy will be defined. Finally, discussion and conclusions will be highlighted.
Materials and Methods
The Programmable OB System Design
The Oscillation-Based (OB) method is an established sensing circuit approach for BI assessment (Huertas et al., 2015) which reuses the methodology of the Oscillation Based Test (OBT) as described in (Pérez et al., 2017). The major advantage of this technique is the avoidance in designing a sinusoidal circuit generator for signal injection. OBT simplifies the hardware resources required to perform the impedance measurement. The main blocks involved in OB technique are a Band Pass Filter (BPF) and a non-linear element closing the feedback loop, usually a comparator (C) (Huertas et al., 2015).
A block diagram for a programmable OB circuit is proposed in Figure 1. The voltage inverter amplifier introduces the biological sample under test (BSUT) into the oscillation feedback loop. A programmable BPF is used to implement the suggested spectroscopy analysis. This block provides different peak frequencies (fpeak) and quality factor (Q) which will define the different electrical oscillations related with the biological impedance under test (BSUT).
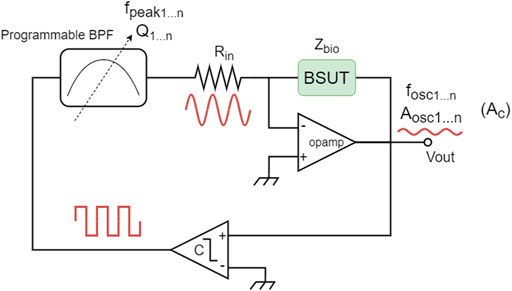
FIGURE 1. Simplified schematic for the programmable Oscillation-Based (OB) approach for bioimpedance measurements and spectroscopy analysis.
The whole OB system can be modelled by the transfer functions which govern the individual blocks in the closed-loop oscillator. The transfer function corresponding to BSUT (and its electrical interface, Zbio) will be denoted as Hz(s) in what follows. Oscillations are formed and stable if the Barkhausen criteria is accomplished. This mathematical condition implies that an OB loop is formed and a couple of oscillation parameters, namely frequency (fosc) and amplitude (aosc), will be achieved, which contain relevant information about the BSUT. Moreover, in this case, a spectroscopy analysis will be performed with different fpeak and Q programmed values. Biological impedance information is implicit in the oscillation parameters (fosc, aosc) and, therefore, such information can be derived by measuring the amplitude and frequency of the output signal (Vout).
System Constrains and Specifications
The scheme proposed in Figure 1 is a powerful tool proposed for bioimpedance spectroscopy analysis. As a major governing block in the system (Figure 1), the Band Pass Filter (BPF) parameters strongly define performance and electrical behavior of the formed oscillation loop. These parameters are quality factor (Q) and central frequency (fpeak). Medium and high Q filters are required to decrease distortion and increase signal-to-noise ratio (SNR). Central frequency modifies the oscillation frequency by establishing a maximum frequency and adapting sensitivity and dynamic ranges to the set value. A direct implication of this is that specific applications of OB, such as OBT (Huertas et al., 2015), requires a certain knowledge of the impedance values for the samples under test, so that central frequency could be established to a relevant value for the process under analysis (Pérez et al., 2016), (Pérez et al., 2018).
Existing OB methods in the literature report a constant central frequency fpeak for the specific target application. This design limits its application on a general BI test problem, where the frequency range may be an open specification of the BI frequency range of interest which is not previously defined or known. The Oscillation-Based Spectroscopy (OBS) is defined as a method for searching the optimum frequency range of OB systems and analyzing the sample under test for a wide range of frequencies, by programming its central frequency. Previous works manage to describe the design process for culture applications and a fine tuning of the OB parameters (Pérez et al., 2020).
BI spectroscopy analysis applications are widely described in the literature (Stupin et al., 2021) for very different applications such as cell growth, cell characterization, tissue analysis, medical diagnosis, and many more. A technique extensively employed to observe cell culture growth (Pérez et al., 2018) is based on the Electrical Cell-substrate Impedance Sensing (ECIS) technique (Giaever and Keese, 1986), (Wegener et al., 2000), (Borkholder, 1998). The electrode model for the underlying process is described in Figure 2.
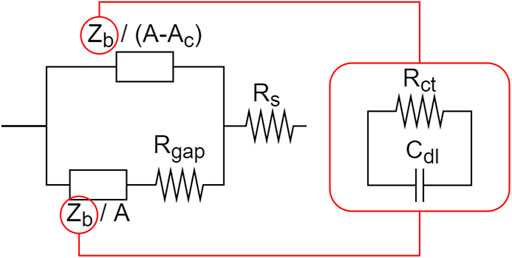
FIGURE 2. Circuit model for an electrode of area A. Electrode area is partially covered (Ac) with cells. Impedance Zb represents the contributions of the Charge transfer resistance and the double layer capacitance (Pérez García, 2019), (Borkholder, 1998).
The above impedance model along with the interface, presented in Figure 1, is described by a transfer function with the following form:
Where:
The Hz(s) transfer function represents the gain of a standard opamp-based inverter amplifier with Rin input resistance, with the equivalent impedance in Figure 2 at the feedback path. The parameters
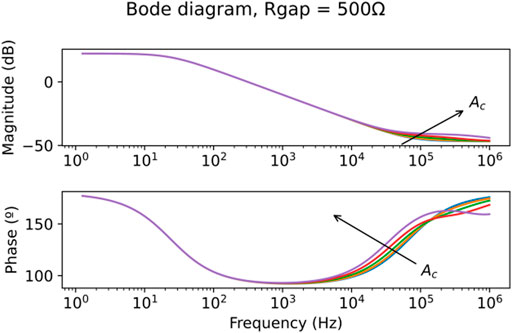
FIGURE 3. Electrical impedance spectrometry for Hz(s) with
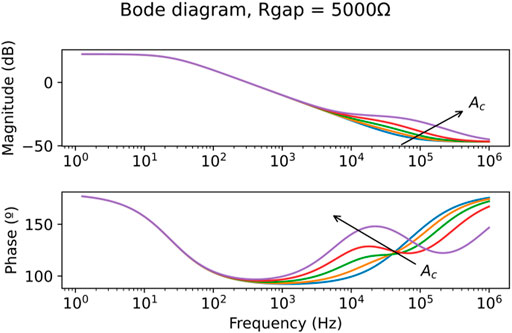
FIGURE 4. Electrical impedance spectrometry for Hz(s) with
The
The Oscillation-Based Test (OBT) (Huertas et al., 2015) technique approaches this process by establishing an electrical oscillator at a fixed frequency and implementing the bio-sample under test within the sample loop. This type of sensor would require a certain tuning for optimization of the operating frequency so that the best test is performed. Furthermore, since frequency is typically fixed, the operation is constrained to specific applications and may not perform the best operation frequency when exposed to processes of different natures or magnitudes.
The variation observed with respect to
As was commented, the OB system is based upon a BPF, the bioimpedance interface, and a non-linear element (a comparator in our case). The scheme was illustrated in Figure 1. BPF transfer function
Design of the band pass filter parameters Q factor
Where
Where
Results
As was explained, the Oscillation-Based system is defined by the BPF parameters, namely Q factor
Spectroscopy extension requires modification of the BPF parameters to establish oscillations in different tuning points. Oscillation amplitude
Using the above expressions and the oscillation equations described, the OB system is solved to evaluate the oscillation parameters for different biological samples with discrete
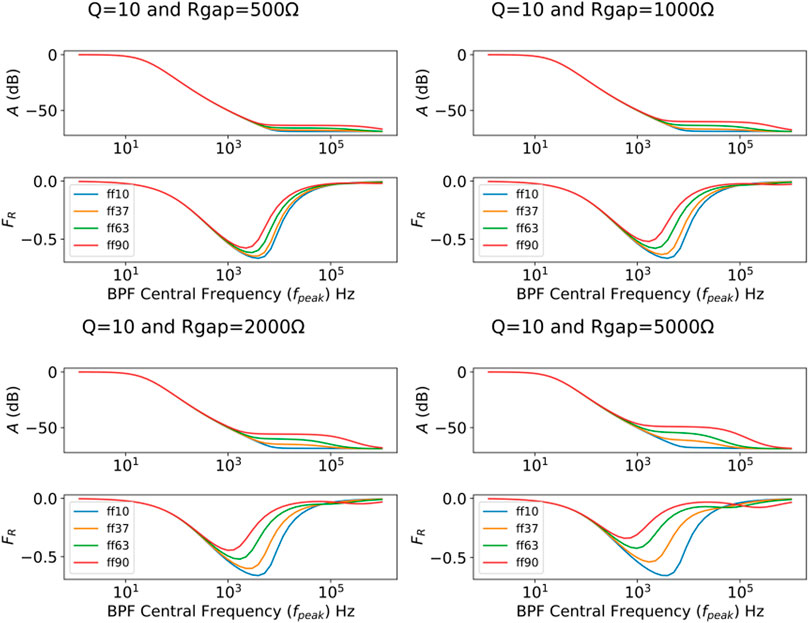
FIGURE 5. Oscillation-Based (OB) parameters for different values of
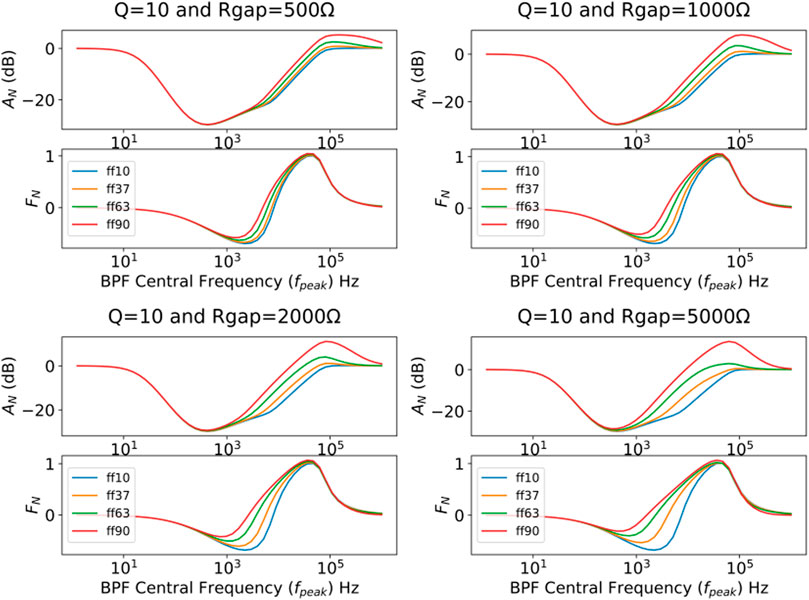
FIGURE 6. Oscillation Based Spectroscopy (OBS) normalized response for different values of
Response variation is significant for a single order of magnitude range over
An even better way of comparing these dynamic ranges is proposed by applying a normalization with respect to the model of the empty electrode.
Where
The
OB Spectroscopy features an additional parameter,
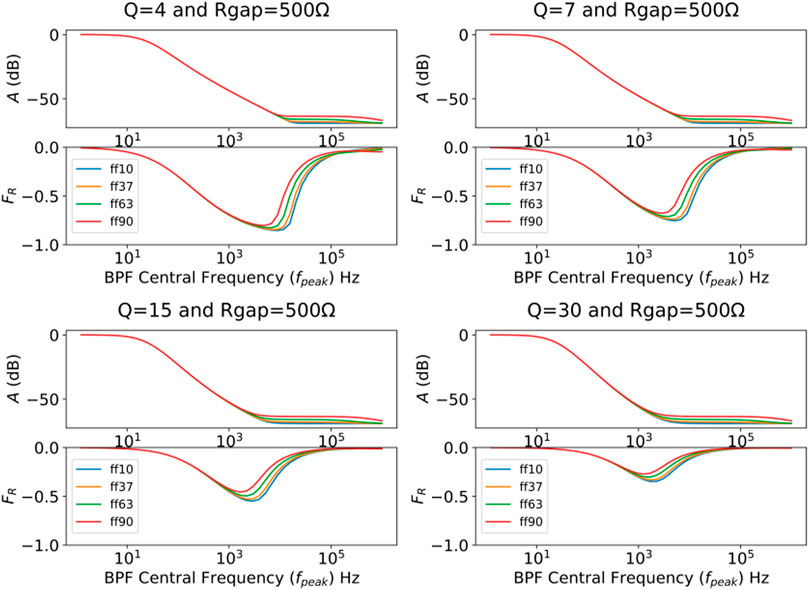
FIGURE 7. Oscillation-Based (OB) Spectroscopy system for different values of
Amplitude curves for the different
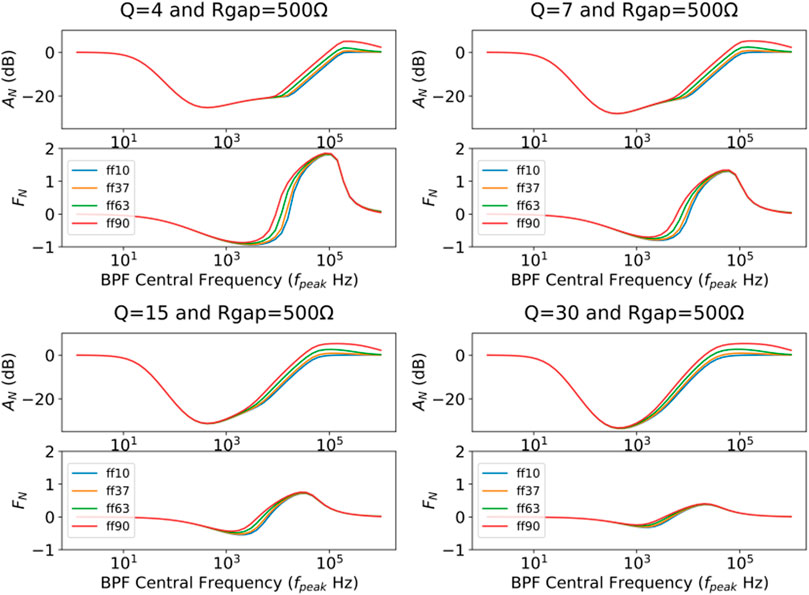
FIGURE 8. Oscillation-Based (OB) Spectroscopy normalized response for different values of
Spectroscopy extension of the OB sensor is oriented toward maximization of the cell culture sensor sensitivity in terms of both oscillation parameters: amplitude and frequency. Figure 8 normalized the results from Figure 7 with respect to the empty electrode model and describes the effect
The curves above illustrate a potential to perform a multi-
Discussion
This article proposes a design strategy to implement an Oscillation Based Spectroscopy (OBS) cell culture monitoring sensor. Advantages over the single frequency OBT approach were described and illustrated with the mathematical modeling of the Electrode Cell-substrate Impedance Sensing (ECIS) interface, the system blocks, and the oscillator behavior. Major contributions or conclusions of this work are:
• The system constraints and design parameters have been identified and modeled in the transfer function equations. Using such a design, an extensive symbolic mathematical solving method was applied by a computer program combining Wolfram Mathematica and Python. The implemented code in the form of Jupyter Notebook to replicate or evaluate this work is published and accessible at (Pérez, 2021).
• Spectroscopy extension of the OBT sensor can improve the performance of this kind of system in both sensitivity and adaptability with respect to different biological impedance samples, specifically cell culture samples, and different types of electrodes. Optimum sensitivities can be found by maximizing the dynamic range of amplitudes and frequencies of system oscillations. This fact will increase the signal to noise ratio (SNR), improving the measurement quality.
• The proposed technique enables people to work with electrodes with different geometries or alternative specifications, for example, materials, since it is possible to program the final central frequency of the BPF for the best performance, considering the actual electrodes employed.
• Along with the spectroscopy frequency sweep for the impedance under test, a second dimension is explored with the
• The main electrode-cell parameter employed in our work is Rgap. In several works we have demonstrated that this parameter is dependent on the cell line, so it can be used for cell identification tasks also. Alternative electrical models (Giaever and Keese, 1991) deliver other parameters, such as barrier resistance, Rb, that it is a well-accepted biomarker for cell cultures for biology researchers. However, Rb is not able to be introduced into the flow design because of the complexity of its math modeling.
Conclusion
In this work, we have described the potential of an Oscillation Based spectroscopy analysis system to observe the electrical response of a biological system under test, and consequently how to incorporate this information into the system test procedure. The system under test considered in this paper is a biological sample of cell cultures, the impedance of which would be obtained by fine tuning an OB system at an adequate central frequency and quality factor to optimize the dynamic range for OB oscillation and hence achieve greater sensitivity.
The results presented in this work are useful for real-time OB sensing systems. The extension of these systems to perform spectroscopy analysis would remove the constraints imposed by tuning the oscillator at a fixed frequency for maximizing ranges in a particular sample (with a specific measurement electrode set). This method isolates the OB measurement system from the sample and electrical interface physical since the process is stepping up from a single frequency acquisition to a full spectrum data analysis.
Data Availability Statement
The raw data supporting the conclusion of this article will be made available by the authors, without undue reservation.
Author Contributions
All authors listed have made a substantial, direct, and intellectual contribution to the work and approved it for publication.
Funding
This work was supported by the project, Sistema de medida y electroestimulación para aplicaciones de diferenciación y motilidad celular, funded by: “Fondo Europeo de Desarrollo Regional (FEDER) y a la Consejería de Transformación Económica, Industria, Conocimiento y Universidades de la Junta de Andalucía, dentro del Programa Operativo FEDER 2014-2020. Referencia: US-1380661. Universidad de Sevilla. We also thanks to the Andalucía Government’s, PAIDI 2017-2020, P18-FR-2308. Proyectos I+D+i Junta de Andalucía, Proyectos de Excelencia (Frontera): Sistema de medida y electroestimulación para aplicaciones de diferenciación y motilidad celular. US-1380661.
Conflict of Interest
The authors declare that the research was conducted in the absence of any commercial or financial relationships that could be construed as a potential conflict of interest.
Publisher’s Note
All claims expressed in this article are solely those of the authors and do not necessarily represent those of their affiliated organizations, or those of the publisher, the editors and the reviewers. Any product that may be evaluated in this article, or claim that may be made by its manufacturer, is not guaranteed or endorsed by the publisher.
References
Alexander, F. A., Price, D. T., and Bhansali, S. (2013). From cellular cultures to cellular spheroids: Is impedance spectroscopy a viable tool for monitoring multicellular spheroid (MCS) drug models? IEEE Rev. Biomed. Eng. 6, 63–76. doi:10.1109/RBME.2012.2222023
Bagnaninchi, P. O., and Drummond, N. (2011). Real-time label-free monitoring of adipose-derived stem cell differentiation with electric cell-substrate impedance sensing. Proc. Natl. Acad. Sci. U. S. A. 108 (16), 6462–6467. doi:10.1073/pnas.1018260108
Borkholder, D. (1998). Cell based biosensors using microelectrodes. Stanford, CA: Stanford University.
ECIS cell-based assays from applied BioPhysics.”Available at: http://www.biophysics.com/(Accessed Feb 04 2018).
Giaever, I., and Keese, C. R. (1991). Micromotion of mammalian cells measured electrically. Proc. Natl. Acad. Sci. U. S. A. 88, 7896–7900. doi:10.1073/pnas.88.17.7896
Giaever, I., and Keese, C. R. (1986). Use of electric fields to monitor the dynamical aspect of cell behavior in tissue culture. IEEE Trans. Biomed. Eng. 33 (2), 242–247. BME-. doi:10.1109/TBME.1986.325896
Grimnes, S., and Martinsen, Ø. G. (2008). Bioimpedance and bioelectricity basics. Massachusetts: Academic.
Holland, I., McCormick, C., and Connolly, P. (2018). Towards non-invasive characterisation of coronary stent re-endothelialisation – an in-vitro, electrical impedance study. PLoS One 13 (11), e0206758. doi:10.1371/journal.pone.0206758
Hsu, C.-L., Sun, A., Zhao, Y., Aronoff-Spencer, E., and Hall, D. A. (2018). “A 16×20 electrochemical CMOS biosensor array with in-pixel averaging using polar modulation,” in 2018 IEEE Custom Integrated Circuits Conference (CICC) (San Diego, CA, USA: IEEE), 1–4. doi:10.1109/CICC.2018.8357044
Huang, X., Nguyen, D., Greve, D. W., and Domach, M. M. (2004). Simulation of microelectrode impedance changes due to cell growth. IEEE Sens. J. 4 (5), 576–583. doi:10.1109/JSEN.2004.831302
Huertas, G., Maldonado, A., Yúfera, A., Rueda, A., and Huertas, J. L. (2015). The bio-oscillator: A circuit for cell-culture assays. IEEE Trans. Circuits Syst. Ii. 62 (2), 164–168. doi:10.1109/TCSII.2014.2386233
Jun, M.-H., Kim, S., Ku, B., Cho, J., Kim, K., Yoo, H. R., et al. (2018). Glucose-independent segmental phase angles from multi-frequency bioimpedance analysis to discriminate diabetes mellitus. Sci. Rep. 8 (1), 648. doi:10.1038/s41598-017-18913-7
Keese, C. R., Wegener, J., Walker, S. R., and Giaever, I. (2004). Electrical wound-healing assay for cells in vitro. Proc. Natl. Acad. Sci. U. S. A. 101 (6), 1554–1559. doi:10.1073/pnas.0307588100
Nordberg, R. C., Zhang, J., Griffith, E. H., Frank, M. W., Starly, B., Loboa, E. G., et al. (2017). Electrical cell-substrate impedance spectroscopy can monitor age-grouped human adipose stem cell variability during osteogenic differentiation. Stem Cells Transl. Med. 6 (2), 502–511. doi:10.5966/sctm.2015-0404
Parekh, A., Das, D., Das, S., Dhara, S., Biswas, K., Mandal, M., et al. (2018). Bioimpedimetric analysis in conjunction with growth dynamics to differentiate aggressiveness of cancer cells. Sci. Rep. 8 (1), 783. doi:10.1038/s41598-017-18965-9
Pérez García, P. (2019). Circuit design for biomedical laboratories based on impedance measurement. [Online]. Available: https://idus.us.es/handle/11441/88997 (Accessed Jun 14, 2021).
Pérez, P. Research/FIE2021 at main · pablopgus/Research, Available: https://github.com/pablopgus/Research/tree/main/FIE2021 (accessed Dec. 15, 2021).
Pérez, P., Huertas, G., Maldonado-Jacobi, A., Martin, M., Serrano, J. A., Olmo, A., et al. (2018). Sensing cell-culture assays with low-cost circuitry. Sci. Rep. 8 (1), 8841. doi:10.1038/s41598-018-27295-3
Pérez, P., Jacobi, J. A. M., López, A. J., and Martínez, C. (2017). “Remote sensing of cell-culture assays,” in New insights into cell culture technology. Editors j. Sivakumar, and T. Gowder (India: InTech).
Pérez, P., Maldonado, A., Yúfera, A., Huertas, G., Rueda, A., Huertas, J. L., et al. (2016). Towards bio-impedance based labs: A review. J. Electr. Eng. 4, 116–127. doi:10.17265/2328-2223/2016.03.002
Pérez, P., Serrano, J. A., Martín, M. E., Daza, P., Huertas, G., and Yúfera, A. (2020). A computer-aided design tool for biomedical OBT sensor tuning in cell-culture assays. Comput. Methods Programs Biomed. 200, 105840. doi:10.1016/j.cmpb.2020.105840
Rego, D., Costa, L., Pereira, M. T., and Redondo, L. M. (2015). Cell membrane permeabilization studies of chlorella sp. by pulsed electric fields. IEEE Trans. Plasma Sci. 43 (10), 3483–3488. doi:10.1109/TPS.2015.2448660
Schmidt, S., Schubler, M., Hessinger, C., Schuster, C., Bertulat, B., Kithil, M., et al. (2019). Microwave induced electroporation of adherent mammalian cells at 18 GHz. IEEE Access 7, 78698–78705. doi:10.1109/ACCESS.2019.2923073
Schwan, H. P. (1957). Electrical properties of tissue and cell suspensions. Adv. Biol. Med. Phys. 5, 147–209. doi:10.1016/B978-1-4832-3111-2.50008-0
Serrano, J. A., Huertas, G., Maldonado-Jacobi, A., Olmo, A., Perez, P., Martin, M., et al. (2018). An empirical-mathematical approach for calibration and fitting cell-electrode electrical models in bioimpedance tests. Sensors 18 (7), 2354. doi:10.3390/s18072354
Stupin, D. D., Kuzina, E. A., Abelit, A. A., Emelyanov, A. K., Nikolaev, M. D., Koniakhin, S. V., et al. (2021). Bioimpedance spectroscopy: Basics and applications. ACS Biomater. Sci. Eng. 7 (6), 1962–1986. GIF. doi:10.1021/ACSBIOMATERIALS.0C01570/ASSET/IMAGES/MEDIUM/AB0C01570_0017
Wegener, J., Keese, C. R., and Giaever, I. (2000). Electric cell–substrate impedance sensing (ECIS) as a noninvasive means to monitor the kinetics of cell spreading to artificial surfaces. Exp. Cell. Res. 259 (1), 158–166. doi:10.1006/excr.2000.4919
Keywords: oscillation based test, bioimpedance, microelectrode, spectroscopy, ECIS
Citation: Pérez P, Serrano-Viseas JA, Fernández-Scagliusi S, Martín-Fernández D, Huertas G and Yúfera A (2022) Oscillation-Based Spectroscopy for Cell-Culture Monitorization. Front. Electron. 3:836669. doi: 10.3389/felec.2022.836669
Received: 15 December 2021; Accepted: 31 May 2022;
Published: 22 July 2022.
Edited by:
Pedro Bertemes-Filho, Santa Catarina State University, BrazilReviewed by:
Karabi Biswas, Indian Institute of Technology Kharagpur, IndiaAnna-Maria Pappa, Khalifa University, United Arab Emirates
Copyright © 2022 Pérez, Serrano-Viseas, Fernández-Scagliusi, Martín-Fernández, Huertas and Yúfera. This is an open-access article distributed under the terms of the Creative Commons Attribution License (CC BY). The use, distribution or reproduction in other forums is permitted, provided the original author(s) and the copyright owner(s) are credited and that the original publication in this journal is cited, in accordance with accepted academic practice. No use, distribution or reproduction is permitted which does not comply with these terms.
*Correspondence: Alberto Yúfera, eXVmZXJhQGltc2UtY25tLmNzaWMuZXM=