 Maggie Delano
 Vidya Ganapati†
 Bryan Le
 Rey Mendoza
- Engineering Department, Swarthmore College, Swarthmore, PA, United States
Fluid overload is a chronic medical condition that affects over six million Americans with conditions such as congestive heart failure, end-stage renal disease, and lymphedema. Remote management of fluid overload continues to be a leading clinical challenge. Bioimpedance is one technique that can be used to estimate the hydration of tissue and track it over time. However, commercially available bioimpedance measurement systems are bulky, expensive, and rely on Ag/AgCl electrodes that dry out and can irritate the skin. The use of bioimpedance today is therefore limited to clinical and research settings, with measurements performed at daily intervals or over short periods of time rather than continuously and long-term. This paper proposes using wearable calf bioimpedance measurements integrated into a compression sock for long-term fluid overload management. A PCB was developed using standard measurement techniques that measures the calf bioimpedance using a custom analog front-end built around an AD8302 gain-phase detection chip. Data is transmitted wirelessly via Bluetooth Low Energy to an iOS device using a custom iOS app. Bioimpedance data were collected both from the wearable system and a commercial measurement system (ImpediMed SFB7) using RRC networks, Ag/AgCl electrodes, and the textile compression sock. Bioimpedance data collected from the wearable system showed close agreement with data from the SFB7 when using RRC networks and in five healthy human subjects with Ag/AgCl electrodes. However, when using the textile compression sock the wearable system had worse precision than the SFB7 (4% run to run compared to
1 Introduction
Millions of Americans suffer from chronic fluid overload (Adamson, 2009; Zoccali et al., 2017; Schwaiger et al., 2020), costing the US healthcare system more than $30 billion in 2012 (Virani et al., 2021). Fluid overload is characterized by an excess expansion of the extra-cellular space (Sergi et al., 2004; Abbas et al., 2015). Symptoms of fluid overload include swelling (edema) in the extremities, lungs and abdomen, high blood pressure, and shortness of breath. Chronic fluid overload can occur due to conditions such as congestive heart failure (CHF), cirrhosis and end-stage renal disease (ESRD). Despite affecting over six million Americans, managing patient fluid status remains a clinical challenge today (Lukaski et al., 2019; La Franca et al., 2020; Virani et al., 2021). The lack of home monitoring solutions prevents physicians, patients, and caregivers from “closing the loop” and preventing adverse outcomes and hospitalizations. There is a need for a reliable, affordable, and clinically relevant home fluid status monitoring system that can readily integrate into patients’ daily lives.
The standard of care for home fluid status monitoring is the weight scale. However, weight monitoring has low levels of patient compliance and low specificity in predicting decompensation in CHF patients (Adamson, 2009; Abraham et al., 2011b). Implantable pressure monitors, such as the CardioMEMS HF system, measure heart filling pressures, which are the first measurable physiological markers to fluid overload that originates in the intravascular space (Adamson, 2009; Abraham et al., 2011a; Troughton et al., 2011). However, these monitoring systems require a costly, invasive implantation procedure and manual interrogation of the device to collect data. Systems for fluid status monitoring also exist for monitoring patients during hemodialysis such as the commercially available Crit-line hematocrit monitor or experimental methods using bioimpedance (Zhu et al., 2008a; Beckmann et al., 2009; Medrano et al., 2010; Montgomery et al., 2013; Abbas et al., 2015).
An advantage of bioimpedance based techniques is that they are non-invasive and lower cost than implantable devices (Khalil et al., 2014; Grimnes and Martinsen, 2015). However, there are important clinical and technical challenges that need to be addressed for bioimpedance to be used successfully in home environments. Bioimpedance is an indirect estimate of fluid status, and these estimates need to be accurate, precise, and with a known relationship to the patient’s overall fluid status. Previous research has shown that measuring calf bioimpedance can help manage patients on hemodialysis in a clinical setting (Zhu et al., 2008a,b). Developing accurate and precise devices for home use would allow evaluation of whether bioimpedance can be used to predict developing fluid overload, rather than fluid reduction as in hemodialysis. This paper will focus on the technical challenges to obtaining accurate, precise, and reliable bioimpedance measurements using textile electrodes for long term measurements, which can then in turn be used to evaluate whether these estimates can provide actionable information for fluid overload management.
Bioimpedance measures the electrical properties of tissue by driving a small current through the body and sensing the resulting voltage. The bioimpedance can in turn be used to indirectly estimate the fluid volumes in the measured body segment(s). Several factors influence the accuracy and consistency of bioimpedance measurements, including the measurement circuitry, the type and placement of electrodes, and other factors such as skin temperature, posture, and motion artifacts (Kyle et al., 2004). While measurement circuitry can be calibrated using known impedances such as resistor-capacitor networks that can reduce or eliminate artifacts due to e.g., cables (Yang et al., 2006), factors such as electrode type and placement and patient factors are more challenging to address. In clinical settings, standards have been developed to help ensure consistent results, such as electrode placement in reference to anatomical markers, and having the subject lie supine for 5–10 min before testing (Kyle et al., 2004). For a home environment such as what we are interested in this paper, most researchers have focused on devices that are meant to be used at regular intervals [e.g., daily, or during a home hemodialysis session (Bonnet et al., 2016; Ferreira et al., 2017)]. However, these devices would require the patient to perform specific protocols such as lying supine before using them, or the patient could only use the device during their scheduled hemodialysis session. Other devices involve wearables at the chest, which might result in detecting fluid overload sooner, but are less likely to be worn for extended periods of time (Schlebusch et al., 2010; Posada-Quintero et al., 2018). These are not ideal for ready adoption of this technology for wider use, especially for patients who are not on hemodialysis.
Numerous research groups have already developed portable and wearable bioimpedance systems that may be suitable for ambulatory calf bioimpedance measurements, including a previous portable device developed by the first author (Yang et al., 2006; Bonnet et al., 2016; Hersek et al., 2017; Delano, 2018; Dheman et al., 2020). However, none of these devices have been tested specifically with an electrode configuration optimized for long-term measurements of calf bioimpedance. We intend to address this in the present paper.
In this paper, we present a prototype of a wearable calf bioimpedance measurement system as a first step toward evaluating the utility of calf bioimpedance measurements for long-term, ambulatory measurements. Because we are specifically interested in evaluating the performance of the compression sock for use in a wearable setting, we developed a small, battery powered system that uses measurement techniques previously established in the literature to record the calf bioimpedance (Yang et al., 2006). The measurement system is enclosed in a 3D-printed enclosure and can in turn be connected to a custom designed compression sock with integrated band textile electrodes. Data from the measurement system is transmitted over Bluetooth Low Energy to a custom iOS app that saves data to a remote server for subsequent analysis.
The prototype has three potential advantages over previous work:
1. Current distribution: The prototype uses band electrodes to distribute current uniformly through the calf, minimizing the impact of calf fat and ensuring accurate calf fluid volume estimation, unlike conventional spot Ag/AgCl electrodes (Delano, 2020).
2. Long-term measurements: The band electrodes are made of textile fabric that can be used to measure calf bioimpedance over an extended period of time, both because the fabric is comfortable and because it does not rely on gels or adhesives that dry out over time (Wang et al., 2019).
3. Ease of use: The prototype integrates into a standard compression sock, which many patients with fluid overload already wear, allowing for a “set it and forget it” use case that could potentially increase patient compliance and improve their experiences using the device.
The goal of this paper was to evaluate the performance of the prototype against a commercial system to determine whether it can provide accurate and precise bioimpedance data. We tested the system on the bench using RRC networks and with five healthy subjects using Ag/AgCl electrodes along with the textile compression sock. We found that the wearable system obtained results comparable to the commercially available SFB7 system for RRC networks and using Ag/AgCl electrodes, but was less reliable when using the textile compression sock compared with the SFB7. This suggests improvements are needed to the standard research grade hardware being used in the literature to enable bioimpedance measurements using textile electrodes at the calf. We discuss implications and potential improvements to the system to enable more reliable long-term measurements in the future.
2 Methods
2.1 Bioimpedance Background
Bioimpedance measurements performed across frequencies are known as bioimpedance spectroscopy (BIS) measurements. These measurements can be analyzed at individual frequencies or fit to a model. In this paper, we chose to fit the data to the Cole model, which is the most frequently used model for BIS measurements (Cole, 1940). The Cole model is a four-parameter model where the measured bioimpedance Z can be represented by
where R0 and R∞ are the resistance at frequencies ≪ 1/τ and ≫ 1/τ, respectively. τ is the characteristic time constant and α determines the frequency “width” of the transition of the bioimpedance from R0 to R∞. An example calf bioimpedance waveform can be found in Figure 1. The resistances R0 and R∞ are the resistances of the extra-cellular and total water (sum of extra-cellular and intra-cellular water), respectively. The time constant τ is related to the properties and number of cell membranes in the tissue. The α parameter represents the fact that tissue includes an element called a constant phase element (CPE), which has a constant phase of -90° × α where α is between 0 and 1, with α = 1 representing a pure capacitor and α = 0 representing a pure resistor. The α term is important to include as the modeled bioimpedance would not be accurate without it other than at very low and high frequencies.

FIGURE 1. Two views of an example calf bioimpedance waveform with
The fluid compartment volumes of the calf can be estimated using a combination of calf bioimpedance and calf circumference measurements. Estimates assume the calf is a homogeneous cylinder comprised of a conductive fluid with suspended spheres with capacitive membranes (i.e., cells). It is also assumed that current is distributed uniformly through the measured tissue. These assumptions are necessary to establish a clear inverse relationship between measured resistance (i.e., bioimpedance) and compartment volumes (i.e., extra-cellular and intra-cellular). Based on these assumptions, the volume of calf extra-cellular water (VolcECW), calf total water (VolcTW) and calf intra-cellular water (VolcICW) are estimated as: 1.
where L is the inter-electrode distance, ρECW and ρ∞ are the resistivity of extra-cellular water and total water, respectively, and Volcalf = LA where A is the cross-sectional area derived from the calf circumference circ (
2.2 Circuit Design
2.2.1 Analog Front End
The design of the analog front end was based on a paper by Yang et al. (2006) (with some modifications to measure at lower bioimpedance magnitudes). The system uses the Magnitude-Ratio and Phase Difference Detection Method (MRPDD) to measure bioimpedance. This involves a single op-amp (ADA-4891) voltage controlled current source (VCCS) that drives current through both the body and a reference resistance (51 Ω, confirmed by DMM6500 digital multimeter) (Seoane et al., 2011; Yang et al., 2006) (see Figure 2). The reference resistance sets the range over which the magnitude readings are most accurate as the AD8302 is most accurate for ± 20 dB with respect to the reference. A reference resistance of 51 Ω therefore affords a range of 5.1–510 Ω. A typical calf bioimpedance measurement is on the order of 20–70 Ω (Delano M. and Sodini C., 2018; Wang et al., 2019). The input sine wave to the VCCS is generated on board using an AD9837 direct digital synthesizer, followed by a high pass filter and a single op-amp gain stage to center the resulting waveform around the middle of the voltage rails and amplify the sine wave to 1Vpp. The sine wave is then used to drive the VCCS; the input sine wave amplitude along with the value of Rbias (3.6 kΩ) sets the current to 94 μArms (as verified by a DMM6500 digital multimeter), which is below the threshold set by the IEC60601-1 product safety standards for medical devices of 100 μA at 1 kHz. The frequency of the sine wave is swept from 1 to 500 kHz. Each sweep takes just under 2 s.

FIGURE 2. Block diagram of wearable calf bioimpedance measurement system using the Magnitude Ratio and Phase Difference Detection Method based on Yang et al. (2006).
Differential voltages across the reference resistance and the body are measured using instrumentation amplifiers (AD8231), and then these single ended voltages are input into a gain phase detection chip (AD8302). The IA gain (16) was chosen based on the required input voltage range to the gain phase detector for optimal operation; inputs should ideally be within −15 dBm to 8 dBm with respect to 50 Ω, corresponding to root mean square voltages of 39.764 mV–0.562 V. After the instrumentation amplifier stage, the signals are buffered and then matched to 50 Ω impedance for input to the gain phase detection chip. The resulting voltages are then sampled by an ADC on an nRF52811 microcontroller (see Section 2.2.2).
The PCB has standard 2.54 mm header connections for all four electrodes that can be connected to other PCBs and/or electrodes. The PCB can be used on the bench top as a standalone measurement system or optionally enclosed in a 3D printed enclosure that houses the PCB and battery, with space for the electrode wires and velcro to secure the device around the calf (see Figure 3). The PCB is 4 cm × 5.5 cm × 0.8 cm, and the enclosure is 4.8 cm × 7.8 cm × 2.4 cm.

FIGURE 3. (A) The custom PCB inside the enclosure. Electrode connection and other wires not pictured. (B) The textile compression sock while worn.
The analog front end was calibrated with three RRC networks mounted on small PCBs using quadratic Lagrange interpolation prior to each measurement session to reduce the impact of cable impedance and non-linearities of the front end (Yang et al., 2006). Each RRC network is configured with three circuit elements to mimic the electrical properties of the body (see Figure 4), where Re and Ri are the resistance of the extra- and intra-cellular fluid, and Cm is the capacitance of the cell membranes. These are related to the Cole parameters as follows:

FIGURE 4. Topology of the RRC networks used to simulate calf bioimpedance. Values and a visualization for the RRC networks can be found in Table 1; Figure 5, respectively.
Circuit parameters for each calibration RRC network are listed in Table 1 and a bode plot of the calibration impedances can be found in Figure 5. All resistors on the RRC network PCBs had at least ± 1% tolerance and all capacitors had at least ± 10% tolerance.
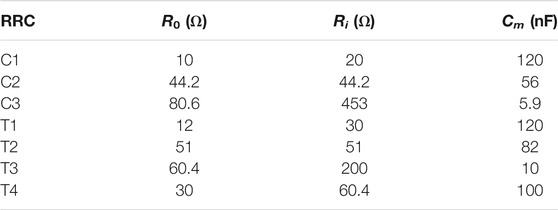
TABLE 1. Values of the RRC network PCBs. PCB names starting with “C” are PCBs used for calibration and names starting with “T” are used for testing.

FIGURE 5. Bode plot of the calibration and test RRC networks used. Values for the RRCs can be found in Table 1.
The system is powered by a lithium-ion battery (850 mAh, DTP603443) and regulated to 3 V using an LDO linear regulator (ADP3301). The board also has on board charging using a linear, single-cell Li + battery charger (ADP2291). The battery life of the system while measuring continuously is about 8 h.
2.2.2 Digital Back End
The digital back end is built around an nRF52811 system-on-chip that includes a 64 MHz Cortex-M4 ARM processor with Bluetooth Low Energy data transmission using an external chip antenna. The ARM processor is programmed using a Serial Wire Debug (SWD) protocol and a 9-pin converter using an nRF52840 development kit. The microcontroller communicates with the direct digital synthesizer (AD9837) using SPI, and also controls relevant input/output pins such as the instrumentation amplifier gain. The nRF52811 has several built-in, 12 bit ADC channels, two of which are used to sample the magnitude and phase output voltages from the gain phase detection chip. The custom iOS app receives the bioimpedance magnitude and phase data and displays the results in real time. The data are also transmitted to a remote server using SFTP.
2.3 Textile Design
The wearable compression sock consisted of four band electrodes made from a textile material to ensure uniform current distribution throughout the measured part of the calf. A uniform current distribution is necessary in order to estimate volume based on bioimpedance (see Section 2.1), and to ensure that bioimpedance is not artificially high due to fat on the calf (Delano, 2020). Band electrodes ensure this uniformity by driving current through the calf from around the calf circumference, rather than from a single point as with spot Ag/AgCl electrodes. The band electrodes were sewn into commercially available compression socks to create a comfortable and wearable way to measure the calf bioimpedance. The electrodes were sewn to have the same electrode spacing as used in previous studies in the first author’s research group [see e.g., Delano and Sodini (2018a,b); Wang et al. (2019)], with a 10 cm spacing between the voltage electrodes and with each current electrode 5 cm outside the voltage electrodes (see Figure 6). This spacing was chosen originally for comparison with previous studies of other groups such as Zhu et al. (2008b), Montalibet and McAdams (2018). The choice of textile was based on a previous study comparing 5 different textiles (Wang et al., 2019).

FIGURE 6. Layout of the textile compression sock, including spacing of the band electrodes inside the compression sock.
The compression sock consists of two layers of compression sock substrate with the conductive fabric sewn on. The innermost layer of fabric, which touches the skin, has the Technitex conductive fabric sewn in four bands onto the compression sock substrate. Then there is a second layer of conductive fabric used as a trace to connect the signals from the outer bands to snaps at the center of the sock. Four snaps are sewn into the sock toward its center, and are then connected to the headers on the custom PCB via snaps soldered to wires. Conductive thread is used as needed to connect the different layers. A picture of the sock being worn can be found in Figure 3. The sock circumference at the top and bottom of the sock are 26 and 17 cm respectively, but can stretch by over 10 cm each.
2.4 Bioimpedance Measurements
Bioimpedance measurements were performed both with the wearable system developed here and a commercial system (ImpediMed SFB7). The wearable system measured bioimpedance from 1 to 500 kHz with 10 points per decade. Each sweep took just under 2 s. Meanwhile the SFB7 measures 256 frequencies from 3 kHz to 1 MHz in less than 1 s. In order to compare the results from both measurement systems, magnitude and phase values from the SFB7 were interpolated to match the same frequencies as those used from the wearable system, resulting in a total of 28 frequencies measured by the wearable system and 23 frequencies measured by the SFB7.
While both the bioimpedance magnitude and phase are acquired by both measurement systems, only the magnitude was used to fit to the Cole model. This is because the phase is more susceptible to artifacts (Scharfetter et al., 1998; Bogónez-Franco et al., 2009; Buendia et al., 2014), and the AD8302 measures magnitude and phase separately, decoupling them. Additionally, the AD8302 is not accurate measuring phase values at frequencies below 20 kHz (Yang et al., 2006; Mohamadou et al., 2018) and for the low phase values that occur when performing calf bioimpedance measurements (see Figure 7). Magnitude data were fit using the Levenberg–Marquardt algorithm and MATLAB’s lsqcurvefit. The maximum frequency used for fitting was always 500 kHz; the minimum frequency varied from 1 to 16 kHz depending on measurement system (the SFB7 starts measuring at 3 kHz), and the presence of low-frequency artifacts (Bogónez-Franco et al., 2009; Gómez-Sánchez et al., 2012; Buendia et al., 2014; Wang et al., 2019). See Table 2 for a list of all minimum frequencies used. Initial conditions for the fitting algorithm were iterated 50 times to help ensure the algorithm converged to a global best fit.

FIGURE 7. (A–D) Bode plot results measuring the test RRC PCBs T1 through T4 using both the wearable and SFB7. Values for the RRCs can be found in Table 1.

TABLE 2. Minimum frequencies used for fitting to the Cole model. All values shown in kHz. Fitting was not performed for textiles for subjects S4/S5 due to artifacts in the measurements (see Section 3.2).
2.5 Testing
Bioimpedance measurements were performed on the bench level using RRC networks, and in healthy subjects using both Ag/AgCl electrodes (3M-2560) and the textile compression sock. In each case, measurements were performed using both the wearable system and the SFB7.
2.5.1 Bench Level Testing
The goal of the bench level testing was to compare bioimpedance measurements using the custom analog front end PCB that is part of the wearable system presented here with the performance of the commercially available ImpediMed SFB7, which is one of the most commonly bioimpedance spectroscopy systems used for research. Testing was performed using four small custom PCBs with a network of resistors and capacitors used to emulate the electrical properties of the calf muscle (using an RRC network, see Figure 4) and the skin-electrode interface impedance (using a single series resistor of 1 kΩ for each current electrode and a short for each voltage electrode). The bioimpedance of each RRC network was measured 5 times each using both the SFB7 measurement system and the wearable bioimpedance system. The estimated R0 and R∞ were then extracted from the bioimpedance spectroscopy data, and the mean of the 5 measurements was compared with the actual value (for R0) or calculated value (for R∞, see Eq. 6) A summary of the values of each test RRC network can be found in Table 1.
2.5.2 Human Subjects Testing
The goal of the human subjects testing was to compare the performance of the wearable system and the SFB7 under more realistic conditions, including using Ag/AgCl electrodes along with the textile compression sock. All subjects gave informed consent to participate in the study and all experimental procedures were approved by the Swarthmore College Institutional Review Board (Protocol # 17-18-073-SC and PA). Inclusion criteria for the study were: over the age of 18 and not currently enrolled as a student of the research supervisor. Exclusion criteria for the study were: implanted medical devices, skin sensitivity to medical adhesives and electrodes, pregnancy, amputations, metal in legs, and ulcers or other skin conditions at the potential electrode sites.
Measurements were first performed on the calf using Ag/AgCl electrodes. Spacing was similar to that on the textile sock (see Figure 6). The researcher measured the distance between the middle of the patella (knee) and lateral malleolus (ankle) and placed the voltage electrodes on the lateral side of the leg, 5 cm on either side of the midpoint of this distance. Current electrodes were placed 5 cm outside each voltage electrode. A similar procedure was followed for testing with the compression sock: the sock was slipped on and pulled up until the middle of the sock was at the midpoint between the knee and ankle such that the textile bands had the same spacing and placement as the spot Ag/AgCl electrodes. The electrode connectors for the sock were always oriented to the outside of the subject. Measurements of each type were then performed 5 times with each measurement system, and the mean of the 5 measurements was used to compare the two systems.
2.5.3 Data Analysis
A successful bioimpedance system will be accurate, precise, and with a known relationship to overall fluid status. In this paper, we will focus on accuracy and precision as a first step toward evaluating the relationship to overall fluid status. Performance of the two systems was based on a comparison of the Cole model parameters extracted from the data for each measurement system (accuracy) and the precision of those extracted Cole parameters. Cole parameters were estimated based on 5 frequency sweeps for both the wearable system and the SFB7 measurement system. For bench level testing, these parameters were compared with the parameters on the RRC networks; for human subjects testing these parameters were compared with each other, with the SFB7 considered the “gold standard.”
To calculate precision, the standard deviation and mean of the five different R0 and R∞ values were used to calculate the precision p:
where R is the set of R0 or R∞ values for each case. The precision p is therefore the percentage variation of the different measurement runs, normalized by the mean to allow comparisons across test RRC network values, subjects and electrode types.
3 Results
3.1 Bench Level Testing
Both the wearable system and the SFB7 were able to accurately estimate the R0 and R∞values of the test RRC networks, with all estimations within ±1.5% (see Table 3 and Figure 7). Both measurement systems also had low Cole parameter precision, with all values for both systems of less than 1% (see Table 5). Cole parameter precision was consistently lower for the SFB7 than the wearable bioimpedance system except for the low impedance of the T1 RRC, for which the precision for R0 was about the same (0.35% for wearable vs. 0.37% for SFB7).

TABLE 3. Percent error of the Cole parameters extracted from bioimpedance measurements from both measurement systems for the test RRCs compared with the actual values of the RRCs.
3.2 Human Subjects Testing
Human subjects testing was conducted with five subjects (see Table 4). Data from S1 and S3–S5 were obtained using the dry textile sock only. Two additional tests were also conducted with S2 to determine the influence of pressure and wetting on bioimpedance measurements at low frequencies: additional pressure was applied to the current electrodes using medical tape [as was done in a previous study (Wang et al., 2019)], and the current electrodes were lightly patted with a wet piece of textile. Results for all three conditions are presented.

TABLE 4. Demographics of subjects who volunteered to be part of the study. Hair stands for calf hair and was ranked on a scale from 1 to 5 where 1 was no hair and 5 was very hairy.
Cole parameter precision for both systems when using the Ag/AgCl electrodes was on the same order as the data for the RRC networks (see Table 5); all parameter precision values for R0 and R∞ were below 2%. Extracted parameters for the Ag/AgCl were within ± 6% between the two systems (see Table 6).

TABLE 5. Cole parameter precision for the four different test RRC networks (T1–4) and the human subjects (S1–S5) using Ag/AgCl and textile electrodes. All values in percent of the mean of that parameter (see Eq. 9). Fitting was not performed for textiles for subjects S4/S5 due to artifacts in the measurements (see Section 3.2).

TABLE 6. Percent error between the Cole parameters as measured by the wearable measurement system compared with the SFB7 for all human subjects for the textile and Ag/AgCl electrodes. Fitting was not performed for textiles for subjects S4/S5 due to artifacts in the measurements (see Section 3.2).
For subjects S2-S5, there was saturation of the VCCS op-amp present for the wearable system PCB at low frequencies (see Table 2 for minimum frequencies used for fitting). Low frequency artifacts on the SFB7 varied depending on the subject; for S2 and S3 there appeared to be no low-frequency artifact (see Figure 8 for an example measurement), but there were artifacts for S4 and S5 (though the presentation of those artifacts was different than for the wearable system, see Section 4 and Figure 9 for an example measurement). The artifacts for subjects S4 and S5 when using textile electrodes were such that the data could not be consistently fit to the Cole model, with precision of greater than 100% for some parameters. Precision and Cole parameter errors are not reported for these subjects for either system. Precision for the SFB7 was consistently below 1%; meanwhile precision for the wearable system was higher for R0 when low frequency artifacts were present (4.22% for S2 and 3.82% for S3). Agreement between the two systems was consistently below 5%, except for R0 for S2 and R∞ for S3, which were 8.00% and −8.14%, respectively (see Table 6).

FIGURE 8. Bioimpedance magnitude data for S2 (average of 5 runs) showing three different conditions for both the wearable bioimpedance measurement system and the commercial SFB7: dry textiles (dry), light pressure applied to textiles using medical tape (pressure), and lightly wet textiles (wet). The presence or absence of low frequency artifacts can be observed by comparing the measurements for the two systems at frequencies below 15 kHz. The artifacts are worst for the dry condition, reduced for the pressure condition, and eliminated for the wet condition.

FIGURE 9. Bioimpedance magnitude and phase data for S5 (average of 5 runs) showing the bioimpedance data that was unusable for fitting due to high precision run to run. The magnitude data is zoomed in to show the slope of the SFB7 data; the wearable data goes up to about 900 Ω at 1 kHz. The high phase data for the wearable is where the system saturated the voltage rails; after this point both systems have negative but increasing phase rather than negative and decreasing phase from zero as in e.g., Buendia et al. (2014).
Two different tests were repeated with S2 to determine if additional pressure on the current electrodes or lightly wetting the current electrodes would reduce skin-electrode interface impedance and improve low frequency bioimpedance measurements (especially when using the wearable system). Both applying pressure or lightly wetting the current electrodes improved the precision for both measurement systems, with a larger improvement for the wearable bioimpedance system (see Table 5). Applying additional pressure resulted in saturation on the wearable bioimpedance system below 2 kHz only and lightly wetting the electrodes eliminated saturation for all measured frequencies. Precision for both measurement systems was less than 2% for R0 and R∞. Applying pressure or lightly wetting the current electrodes also improved the percent difference between the measured Cole parameters between the two measurement systems, with the light wetting reducing all measured differences to less than 5%.
4 Discussion
The goal of this paper was to compare the performance of a research grade wearable calf bioimpedance measurement system and commercially available hardware (ImpediMed SFB7) using RRC networks, Ag/AgCl electrodes, and a custom designed textile compression sock. We found that the research grade hardware had comparable results to the SFB7 when using RRC networks and Ag/AgCl electrodes, but had more low frequency artifacts when compared with the SFB7 when using the custom textile compression sock that impacted both precision and agreement between the two tested systems.
4.1 Bench Level Testing
The wearable system performed comparably to the SFB7 when it came to estimating the resistor values of the test RRC networks, but had worse precision. Overall, both systems could estimate R0 and R∞ of the test RRC networks within ± 1.5% with a precision of less than 1%. These results suggest that the wearable system, when used to extract Cole parameters from RRC networks, can accurately estimate R0 and R∞ and obtain results consistent with the commercially available SFB7 measurement system.
4.2 Human Subjects Testing
Results using Ag/AgCl electrodes for both measurement systems had precision on the same order as using RRC networks, and R0 and R∞ data were all within 6% between the two systems. Results using the textile sock with subject S1 were comparable to the results obtained using Ag/AgCl electrodes. However, there were low frequency artifacts on the wearable system (and sometimes the SFB7) for subjects S2–S5. For S2, increasing pressure or lightly wetting the current electrodes improved the results.
4.3 Low Frequency Artifacts
4.3.1 Presentation
Our results show that using standard research grade bioimpedance measurement circuits (in this case, a voltage controlled current source and commercially available instrumentation amplifiers, a common topology used in portable and wearable bioimpedance spectroscopy systems, see e.g., Yang et al. (2006); Bonnet et al. (2016); Hersek et al. (2017); Dheman et al. (2020)), results in low frequency artifacts when using textile electrodes (see Figure 8). This effect appears to be due to insufficiently low skin-electrode interface impedance as the effect dissipates when wetting the textiles. The SFB7 appears to be less affected than the wearable system, but there were two subjects where the SFB7 also had low frequency artifacts (S4, S5, see Figure 9). For the wearable system, the low frequency artifacts presented first as saturation of the PCB’s voltage controlled current source op-amp’s voltage rails for the first several data points (typically below 5 kHz) and also as artificially high bioimpedance magnitude at frequencies 5 kHz up to 15 kHz compared to what would be expected from the Cole model. The phase was highly positive (200°) when the voltage rails were saturated and negative trending positive for frequencies around where the artifact was present. When artifacts were present for the SFB7, there does not appear to be any saturation (though internals of the SFB7 cannot be readily accessed to confirm), but there does appear to be artificially high magnitude at low frequencies, and a phase that is, artificially low at low frequencies and increases.
4.3.2 Potential Causes
The two subjects with bioimpedance measurements that could not be used by either system both had higher levels of body hair. Body hair prevents good contact of the textile electrodes with the skin, which could potentially explain these results. However, there were also artifacts in the wearable system for additional subjects when there was less body hair, and these artifacts were not present using the SFB7. Because the low frequency artifacts for S2 were reduced on the wearable system with light pressure or wetting, they are most likely also due to high skin-electrode interface impedance. Given that there were no artifacts using the SFB7 system for low amounts of body hair, there must be differences between the hardware on the two systems that prevented the wearable system from handling the larger skin-electrode interface impedance.
Although the tetrapolar configuration used for bioimpedance measurements theoretically eliminates the influence of the skin-electrode interface impedance, the especially high impedance of textile electrodes, coupled with the fact that textile electrodes connect capacitively rather than resistively to the skin, can result in low frequency artifacts (Gómez-Sánchez et al., 2012; Beckmann et al., 2010). Previous research has shown that low frequency artifacts using Ag/AgCl electrodes occur primarily due to electrode mismatch and/or cross-talk between the current and voltage electrodes (Buendia et al., 2014), and that artifacts tend to be higher in localized bioimpedance measurements (Bogónez-Franco et al., 2009, 2017; Montalibet and McAdams, 2018). However, the low-frequency artifacts measured in this study appear different from those presented in Buendia et al. (2014), especially in the phase. While there was an artificially high magnitude at low frequencies in the presence of high skin-electrode interface impedance for the electrode mismatch and cross-talk (similar to that presented here), the phase always started from zero. Additionally, other studies that focus on electrode mismatch found little effects at low frequencies, focusing on the impact of electrode mismatch of high frequencies (Montalibet and McAdams, 2018; Bogónez-Franco et al., 2009, 2017). Further research is needed to determine whether these low frequency artifacts observed using textile electrodes are also due to electrode mismatch, which could potentially be addressed through modifications to the underlying hardware, such as increasing the CMRR of the analog front end (Buendia et al., 2014), and/or measuring and eliminating the contact impedance directly (Shochat et al., 2006; Ferreira et al., 2017; Dheman et al., 2020). Alterations to the compression sock, such as a tighter sock, could also potentially improve results.
4.3.3 Implications of Artifacts
One important question is whether the low frequency artifacts in this study are a concern at all. For example, if one simply moves up the minimum frequency, perhaps low frequency artifacts could be ignored entirely, as we argued in Wang et al. (2019). Results here suggest that there could be adverse impacts of these low frequency artifacts that cannot be fully determined without future work. There are two factors to consider: the impact of the artifact on the estimated Cole parameters themselves, and the impact of the artifact on the Cole parameter precision. If the artifact prevents accurate estimation of the Cole parameters, these data cannot be used for fluid status estimation. If the artifact results in higher precision, additional measurements would need to be taken in order to detect small changes in bioimpedance over time.
While we cannot know the “true” values of the calf bioimpedance, in this study we found that there were larger differences between the SFB7 and wearable system when low frequency artifacts were present for the wearable system only (i.e., S2—dry and S3) compared to when no low frequency artifacts were present (i.e., S1, S2—wet, S2—pressure), and that the precision was much higher than in other cases. The difference between the two systems for S2—dry was 8.00% for R0 (though the difference for R∞ was −3.20%). Meanwhile, the difference between the two systems for S3 was 2.92% for R0 and − 8.14% for R∞. The precision for S2—dry and S3 was about 4%, compared with 1.5% or less for cases where there were no low frequency artifacts present. Based on these data it is not clear that the impact of the artifacts presented here is strictly limited to low frequencies. The cases where neither system obtained usable bioimpedance data (S4/S5) may have been due to body hair, which is not as much of a concern with older patients with fluid overload.
4.3.4 Significance of Findings
While it has been previously established that high skin-electrode interface impedance is a challenge for bioimpedance measurements (Bogónez-Franco et al., 2009; Buendia et al., 2014; Bogónez-Franco et al., 2017; Montalibet and McAdams, 2018), these studies have not directly involved testing using textile electrodes. Our results suggest there might be important differences between Ag/AgCl and textile electrodes in terms of their impact on low frequency artifacts and also between research grade and commercial hardware. We demonstrated that the artifacts presented do not appear consistent with those presented in previous research using Ag/AgCl electrodes. We also showed that research grade hardware performs worse than the SFB7 when testing with band textile electrodes. This suggests that future research is needed to determine whether these artifacts are similar to or distinct from artifacts due to Ag/AgCl electrodes, and then to improve the hardware and/or textile interface in order to use a wearable bioimpedance system with textile electrodes in the future.
5 Conclusion
Fluid overload management remains a leading clinical challenge, with few options for remote monitoring to close the loop between patients and caregivers. We propose managing fluid overload at home by measuring calf bioimpedance using a wearable compression sock. This would enable measurements that distribute current uniformly through the calf, enabling accurate calf volume estimation, and can be made over hours and days, while integrating into a patient’s daily routine. Here we presented results comparing the performance of a wearable calf bioimpedance measurement system using standard research grade hardware with the commercially available SFB7 using measurements on the bench, and measurements with Ag/AgCl and the textile electrodes embedded in a compression sock. We found that measurements between the two systems were similar on the bench and with Ag/AgCl electrodes. However, both devices were unable to measure calf bioimpedance from two out of five subjects. The wearable bioimpedance system was more influenced by artifacts at low frequencies than the SFB7. This suggests that the standard research grade hardware used in the literature requires improvements to be used for calf bioimpedance measurements using textile electrodes. Future research should address artifacts at low frequencies, especially in research grade hardware, in order to improve measurement performance for long-term, ambulatory calf bioimpedance measurements.
Data Availability Statement
The raw data supporting the conclusion of this article will be made available by the authors, without undue reservation.
Ethics Statement
The studies involving human participants were reviewed and approved by the Swarthmore College Institutional Review Board. The patients/participants provided their written informed consent to participate in this study.
Author Contributions
MD had the initial idea for the research paper, designed the analog front end and PCB, analyzed the data, wrote the first draft of the research paper, and supervised the work of the other authors. VG designed and prototyped the wearable compression sock. RK and MD wrote the embedded systems code. BL and MD wrote the iOS app code. RK and RM performed the bench level testing. BL, JL, and MD performed the human subjects testing. All authors reviewed and edited the manuscript draft before submission.
Funding
This research was funded in part by the Summer Research Fellowships from Swarthmore College.
Conflict of Interest
The authors declare that the research was conducted in the absence of any commercial or financial relationships that could be construed as a potential conflict of interest.
Publisher’s Note
All claims expressed in this article are solely those of the authors and do not necessarily represent those of their affiliated organizations, or those of the publisher, the editors and the reviewers. Any product that may be evaluated in this article, or claim that may be made by its manufacturer, is not guaranteed or endorsed by the publisher.
Acknowledgments
The authors would like to thank Becca Keating, Mac Lord, Jerry Gu, Arijit Nerurkar, and Harry Huchra for their work on previous versions of the wearable calf bioimpedance measurement system. They would also like to thank Matt Zucker for designing and fabricating the enclosure for the wearable measurement system.
Footnotes
1see Delano and Sodini (2018a) for a detailed derivation.
References
Abbas, S. R., Zhu, F., and Levin, N. W. (2015). Bioimpedance Can Solve Problems of Fluid Overload. J. Ren. Nutr. 25, 234–237. doi:10.1053/j.jrn.2014.10.014
Abraham, W. T., Adamson, P. B., Bourge, R. C., Aaron, M. F., Costanzo, M. R., Stevenson, L. W., et al. (2011a). Wireless Pulmonary Artery Haemodynamic Monitoring in Chronic Heart Failure: A Randomised Controlled Trial. The Lancet 377, 658–666. doi:10.1016/S0140-6736(11)60101-3
Abraham, W. T., Compton, S., Haas, G., Foreman, B., Canby, R. C., Fishel, R., et al. (2011b). Intrathoracic Impedance vs Daily Weight Monitoring for Predicting Worsening Heart Failure Events: Results of the Fluid Accumulation Status Trial (FAST). Congest. Heart Fail. (Greenwich, Conn.) 17, 51–55. doi:10.1111/j.1751-7133.2011.00220.x
Adamson, P. B. (2009). Pathophysiology of the Transition from Chronic Compensated and Acute Decompensated Heart Failure: New Insights from Continuous Monitoring Devices. Curr. Heart Fail. Rep. 6, 287–292. doi:10.1007/s11897-009-0039-z
Beckmann, L., Cordes, A., Saygili, E., Schmeink, A., Schauerte, P., Walter, M., et al. (2009). “Monitoring of Body Fluid in Patients with Chronic Heart Failure Using Bioimpedance - Spectroscopy,” in 25/7 in IFMBE Proceedings. Editors O. Dössel, and W. C. Schlegel (Munich, Germany: Springer Berlin Heidelberg), 532–535. doi:10.1007/978-3-642-03885-3_148World Congress on Medical Physics and Biomedical Engineering
Beckmann, L., Neuhaus, C., Medrano, G., Jungbecker, N., Walter, M., Gries, T., et al. (2010). Characterization of Textile Electrodes and Conductors Using Standardized Measurement Setups. Physiol. Meas. 31, 233–247. doi:10.1088/0967-3334/31/2/009
Bogónez-Franco, P., Nescolarde, L., Bragós, R., Rosell-Ferrer, J., and Yandiola, I. (2009). Measurement Errors in Multifrequency Bioelectrical Impedance Analyzers with and without Impedance Electrode Mismatch. Physiol. Meas. 30, 573–587. doi:10.1088/0967-3334/30/7/004
Bogónez-Franco, P., Pham, P., Gehin, C., Massot, B., Delhomme, G., McAdams, E., et al. (2016). Problems Encountered during Inappropriate Use of Commercial Bioimpedance Devices in Novel Applications. Prog. Rep. Impedance Spectrosc. Measurements, Model. Appl. 138, 138–154. doi:10.1515/9783110449822-014
Bonnet, S., Bourgerette, A., Gharbi, S., Rubeck, C., Arkouche, W., Massot, B., et al. (2016). “Wearable Impedance Monitoring System for Dialysis Patients,” in Proceedings of the Annual International Conference of the IEEE Engineering in Medicine and Biology Society, 5196–5199. doi:10.1109/EMBC.2016.7591898
Buendia, R., Seoane, F., Bosaeus, I., Gil-Pita, R., Johannsson, G., Ellegård, L., et al. (2014). Robustness Study of the Different Immittance Spectra and Frequency Ranges in Bioimpedance Spectroscopy Analysis for Assessment of Total Body Composition. Physiol. Meas. 35, 1373–1395. doi:10.1088/0967-3334/35/7/1373
Cole, K. S. (1940). Permeability and Impermeability of Cell Membranes for Ions. Cold Spring Harbor Symposia Quantitative Biol. 8, 110–122. doi:10.1101/SQB.1940.008.01.013
Delano, M. (2018). A Portable Bioimpedance Spectroscopy System for Congestive Heart Failure Management. Ph.D. thesis (Cambridge, MA: Massachusetts Institute of Technology).
Delano, M. (2020). “Band Electrodes Reduce Simulated Calf Bioimpedance Measurement Errors Due to Muscle Anisotropy,” in 2020 42nd Annual International Conference of the IEEE Engineering in Medicine Biology Society (EMBC), 3981–3984. doi:10.1109/EMBC44109.2020.9175272
Delano, M., and Sodini, C. (2018a). Evaluating Calf Bioimpedance Measurements for Fluid Overload Management in a Controlled Environment. Physiol. Meas. 39, 125009. doi:10.1088/1361-6579/aaf277
Delano, M. K., and Sodini, C. G. (2018b). “Electrode Placement for Calf Bioimpedance Measurements during Hemodialysis,” in 2018 40th Annual International Conference of the IEEE Engineering in Medicine Biology Society, Honolulu, Hawaii(EMBC), 5910–5913. doi:10.1109/EMBC.2018.8513563
Dheman, K., Mayer, P., Magno, M., and Schuerle, S. (2020). Wireless, Artefact Aware Impedance Sensor Node for Continuous Bio-Impedance Monitoring. IEEE Trans. Biomed. Circuits Syst. 14, 1122–1134. doi:10.1109/TBCAS.2020.3021186
Ferreira, J., Pau, I., Lindecrantz, K., and Seoane, F. (2017). A Handheld and Textile-Enabled Bioimpedance System for Ubiquitous Body Composition Analysis. An Initial Functional Validation. IEEE J. Biomed. Health Inform. 21, 1224–1232. doi:10.1109/JBHI.2016.2628766
Gómez-Sánchez, J. A., and Felice, C. J. (2012). Description of Corrections on Electrode Polarization Impedance Using Isopotential Interface Factor. J. Electr. Bioimpedance 3, 29–35. doi:10.5617/jeb.298
Grimnes, S., and Martinsen, Ørjan. G. (2015). Bioimpedance & Bioelectricity Basics. 3rd edn. Academic Press / Elsevier.
Hersek, S., Toreyin, H., Teague, C. N., Millard-Stafford, M. L., Jeong, H.-K., Bavare, M. M., et al. (2017). Wearable Vector Electrical Bioimpedance System to Assess Knee Joint Health. IEEE Trans. Biomed. Eng. 64, 2353–2360. doi:10.1109/TBME.2016.2641958
Khalil, S., Mohktar, M., and Ibrahim, F. (2014). The Theory and Fundamentals of Bioimpedance Analysis in Clinical Status Monitoring and Diagnosis of Diseases. Sensors 14, 10895–10928. doi:10.3390/s140610895
Kyle, U. G., Bosaeus, I., De Lorenzo, A. D., Deurenberg, P., Elia, M., Manuel Gómez, J., et al. (2004). Bioelectrical Impedance Analysis-Part II: Utilization in Clinical Practice. Clin. Nutr. 23, 1430–1453. doi:10.1016/j.clnu.2004.09.012
La Franca, E., Manno, G., Ajello, L., Di Gesaro, G., Minà, C., Visconti, C., et al. (2021). Physiopathology and Diagnosis of Congestive Heart Failure: Consolidated Certainties and New Perspectives. Curr. Probl. Cardiol. 46, 100691. doi:10.1016/j.cpcardiol.2020.100691
Lukaski, H. C., Vega Diaz, N., Talluri, A., and Nescolarde, L. (2019). Classification of Hydration in Clinical Conditions: Indirect and Direct Approaches Using Bioimpedance. Nutrients 11, 809. doi:10.3390/nu11040809
Medrano, G., Eitner, F., Floege, J., and Leonhardt, S. (20101992). A Novel Bioimpedance Technique to Monitor Fluid Volume State during Hemodialysis Treatment. ASAIO J. (American Soc. Artif. Intern. Organs 56, 215–220. doi:10.1097/MAT.0b013e3181d89160
Mohamadou, Y., Momo, F., Theophile, L., Njike Kouekeu Landry, C., Fabrice, T., and Emmanuel, S. (2018). Accuracy Enhancement in Low Frequency Gain and Phase Detector (AD8302) Based Bioimpedance Spectroscopy System. Measurement 123, 304–308. doi:10.1016/j.measurement.2018.03.079
Montalibet, A., and McAdams, E. (2018). “A Practical Method to Reduce Electrode Mismatch Artefacts during 4-electrode BioImpedance Spectroscopy Measurements,” in 2018 40th Annual International Conference of the IEEE Engineering in Medicine and Biology Society (EMBC) (Honolulu, HI: IEEE), 5775–5779. doi:10.1109/EMBC.2018.8513656
Montgomery, L. D., Gerth, W. A., Montgomery, R. W., Lew, S. Q., Klein, M. M., Stewart, J. M., et al. (2013). Monitoring Intracellular, Interstitial, and Intravascular Volume Changes during Fluid Management Procedures. Med. Biol. Eng. Comput. 51, 1167–1175. doi:10.1007/s11517-013-1064-3
Posada-Quintero, H., Reljin, N., Eaton-Robb, C., Noh, Y., Riistama, J., and Chon, K. (2018). Analysis of Consistency of Transthoracic Bioimpedance Measurements Acquired with Dry Carbon Black PDMS Electrodes, Adhesive Electrodes, and Wet Textile Electrodes. Sensors 18, 1719. doi:10.3390/s18061719
Scharfetter, H., Hartinger, P., Hinghofer-Szalkay, H., and Hutten, H. (1998). A Model of Artefacts Produced by Stray Capacitance during Whole Body or Segmental Bioimpedance Spectroscopy. Physiol. Meas. 19, 247–261. doi:10.1088/0967-3334/19/2/012
Schlebusch, T., Röthlingshöfer, L., Kim, S., Köny, M., and Leonhardt, S. (2010). “On the Road to a Textile Integrated Bioimpedance Early Warning System for Lung Edema,” in 2010 International Conference on Body Sensor Networks (Biopolis, Singapore: BSN), 302–307. doi:10.1109/BSN.2010.21
Schwaiger, E., Simon, A., Wabel, P., Schairer, B., Berner, C., Signorini, L., et al. (2020). Bioimpedance Spectroscopy for Fluid Status Assessment in Patients with Decompensated Liver Cirrhosis: Implications for Peritoneal Dialysis. Sci. Rep. 10, 1–10. doi:10.1038/s41598-020-59817-3
Seoane, F., Macías, R., Bragós, R., and Lindecrantz, K. (2011). Simple Voltage-Controlled Current Source for Wideband Electrical Bioimpedance Spectroscopy: Circuit Dependences and Limitations. Meas. Sci. Technol. 22, 115801. doi:10.1088/0957-0233/22/11/115801
Sergi, G., Lupoli, L., Volpato, S., Bertani, R., Coin, A., Perissinotto, E., et al. (2004). Body Fluid Distribution in Elderly Subjects with Congestive Heart Failure. Ann. Clin. Lab. Sci. 34, 416–422.
Shochat, M., Charach, G., Meyler, S., Meisel, S., Weintraub, M., Mengeritsky, G., et al. (2006). Prediction of Cardiogenic Pulmonary Edema Onset by Monitoring Right Lung Impedance. Intensive Care Med. 32, 1214–1221. doi:10.1007/s00134-006-0237-z10.1007/s00134-006-0237-z
Troughton, R. W., Ritzema, J., Ritzema, J., Eigler, N. L., Melton, I. C., Krum, H., et al. (2011). Direct Left Atrial Pressure Monitoring in Severe Heart Failure: Long-Term Sensor Performance. J. Cardiovasc. Trans. Res. 4, 3–13. doi:10.1007/s12265-010-9229-z
Virani, S. S., Alonso, A., Aparicio, H. J., Benjamin, E. J., Bittencourt, M. S., Callaway, C. W., et al. (2021). Heart Disease and Stroke Statistics-2021 Update: A Report from the American Heart Association. Circulation 143, e254–e743. doi:10.1161/CIR.0000000000000950
Wang, K., Zelko, D., and Delano, M. (2019). Textile Band Electrodes as an Alternative to Spot Ag/AgCl Electrodes for Calf Bioimpedance Measurements. Biomed. Phys. Eng. Express 6, 015010. doi:10.1088/2057-1976/ab5b02
Yang, Y., Wang, J., Yu, G., Niu, F., and He, P. (2006). Design and Preliminary Evaluation of a Portable Device for the Measurement of Bioimpedance Spectroscopy. Physiol. Meas. 27, 1293–1310. doi:10.1088/0967-3334/27/12/004
Zhu, F., Kuhlmann, M. K., Kotanko, P., Seibert, E., Leonard, E. F., and Levin, N. W. (2008a). A Method for the Estimation of Hydration State during Hemodialysis Using a Calf Bioimpedance Technique. Physiol. Meas. 29, S503–S516. doi:10.1088/0967-3334/29/6/S42
Zhu, F., Leonard, E. F., and Levin, N. W. (2008b). Extracellular Fluid Redistribution during Hemodialysis: Bioimpedance Measurement and Model. Physiol. Meas. 29, S491–S501. doi:10.1088/0967-3334/29/6/S41
Keywords: bioimpedance spectroscopy, calf bioimpedance, remote monitoring, fluid overload, dry electrodes, textile electrodes
Citation: Delano M, Ganapati V, Kamal R, Le B, Le J and Mendoza R (2022) Evaluating Research Grade Bioimpedance Hardware Using Textile Electrodes for Long-Term Fluid Status Monitoring. Front. Electron. 2:762442. doi: 10.3389/felec.2021.762442
Received: 21 August 2021; Accepted: 30 December 2021;
Published: 21 January 2022.
Edited by:
Todd Freeborn, University of Alabama System, United StatesReviewed by:
Mart Min, Tallinn University of Technology, EstoniaPedro Bertemes-Filho, Santa Catarina State University, Brazil
Copyright © 2022 Delano, Ganapati, Kamal, Le, Le and Mendoza. This is an open-access article distributed under the terms of the Creative Commons Attribution License (CC BY). The use, distribution or reproduction in other forums is permitted, provided the original author(s) and the copyright owner(s) are credited and that the original publication in this journal is cited, in accordance with accepted academic practice. No use, distribution or reproduction is permitted which does not comply with these terms.
*Correspondence: Maggie Delano, bWRlbGFubzFAc3dhcnRobW9yZS5lZHU=
†ORCID: Vidya Ganapati, orcid.org/0000-0003-2597-5640
‡These authors have contributed equally to this work