 Olga Kanz
 Karsten Bittkau1
 Angèle Reinders
- 1IEK-5 Photovoltaik, Forschungszentrum Jülich GmbH, Jülich, Germany
- 2Eindhoven University of Technology (TU/e), Eindhoven, Netherlands
This work presents a review of life-cycle assessment (LCA) studies of hydrogen electrolysis using power from photovoltaic (PV) systems. The paper discusses the assumptions, strengths and weaknesses of 13 LCA studies and identifies the causes of the environmental impact. Differences in assumptions of system boundaries, system sizes, evaluation methods, and functional units make it challenging to directly compare the Global Warming Potential (GWP) resulting from different studies. To simplify this process, 13 selected LCA studies on PV-powered hydrogen production have been harmonized following a consistent framework described by this paper. The harmonized GWP values vary from 0.7 to 6.6 kg CO2-eq/kg H2 which can be considered a wide range. The maximum absolute difference between the original and harmonized GWP results of a study is 1.5 kg CO2-eq/kg H2. Yet even the highest GWP of this study is over four times lower than the GWP of grid-powered electrolysis in Germany. Due to the lack of transparency of most LCAs included in this review, full identification of the sources of discrepancies (methods applied, assumed production conditions) is not possible. Overall it can be concluded that the environmental impact of the electrolytic hydrogen production process is mainly caused by the GWP of the electricity supply. For future environmental impact studies on hydrogen production systems, it is highly recommended to 1) divide the whole system into well-defined subsystems using compression as the final stage of the LCA and 2) to provide energy inputs/GWP results for the different subsystems.
Introduction
With the increased interest in hydrogen as a sustainable fuel, the life-cycle environmental performance of its production is gaining importance. Hydrogen is generally considered to be a clean fuel because of the absence of emissions during its use. However, so far, the predominant production processes of hydrogen have been steam methane reforming and coal gasification, both of which, due to the use of fossil fuels, result in the emission of a large amount of greenhouse gases, which are by-products of hydrogen production (Bundesministerium für Wirtschaft und Energie (BMWi), 2020; IEA, 2019). In order to contribute to emission reduction targets, hydrogen production has to be powered by renewable electricity sources such as PV systems (Dincer and Acar, 2015). Life-cycle assessment (LCA) can be used to measure and compare the sustainability of different hydrogen production chains. LCA is generally defined as a compilation and evaluation of the inputs, outputs and potential environmental impacts of a product system throughout its life cycle following DIN 14040 and DIN 14044 (DIN 14040, 2006; DIN 14044, 2006).
From a literature study, it is found that almost all LCA studies on hydrogen production by means of electrolysis report the global warming potential (GWP) in the following unit: kg CO2-eq/kg H2. The biggest impact on the GWP is caused by the power supply of hydrogen production (Koroneos et al., 2004; Granovskii et al., 2006; Granovskii et al., 2007; Lombardi et al., 2011; Ozbilen et al., 2011; Simons et al., 2011; Cetinkaya et al., 2012; Pereira and Coelho, 2013; Suleman, 2014; Reiter and Lindorfer, 2015; Suleman et al., 2015; Schmidt Rivera et al., 2018; Lundberg, 2019). The reviews of Bhandari et al. (Bhandari et al., 2014), Valente et al. (Valente et al., 2017) and Mehmeti et al. (Mehmeti et al., 2018) demonstrate how the GWP results change depending on the electricity source used.
To the best of the authors’ knowledge, no extensive review of LCA studies of PV-powered hydrogen production is currently existing. Such a review could be useful because values of emissions per kilogram of PV-generated hydrogen found in the literature vary significantly and are often not comparable due to different system boundary assumptions, system sizes, methods, and functional units (FU). Thus, this work aims to fill this gap by identifying these differences and presenting a comparison of harmonized results from various LCAs of PV-powered hydrogen production. In this manner, a more understandable and comparable framework can be developed. To achieve this goal, 13 LCA studies (Koroneos et al., 2004; Granovskii et al., 2006; Granovskii et al., 2007; Lombardi et al., 2011; Ozbilen et al., 2011; Simons et al., 2011; Cetinkaya et al., 2012; Pereira and Coelho, 2013; Suleman, 2014; Reiter and Lindorfer, 2015; Suleman et al., 2015; Schmidt Rivera et al., 2018; Lundberg, 2019) on PV-powered hydrogen production technologies were selected, analyzed and harmonized. As a reference for the harmonization framework, a guidance document published by the European Union and Fraunhofer ISE with the framework of recommendations for LCA on hydrogen production was applied (Masoni and Zamagni, 2011; Lozanovski et al., 2013). The harmonization allows direct comparison between the GWP results of these studies, by recalculating the GWP to the same scope, functional unit and system boundaries.
Methodology
Life Cycle Assessment Methodology
LCA is a valuable instrument to analyze the environmental performance of any system or product. LCA is commonly described as a compilation and evaluation of the inputs, outputs, and potential environmental impacts of a product system throughout its life cycle. LCA studies consist of four main phases, which are covered through ISO standards (DIN 14044; ISO 14040:2006) (DIN 14040, 2006; DIN 14044, 2006): 1) goal and scope definition, 2) inventory analysis, 3) impact assessment and 4) interpretation. In the following, each step will be shortly introduced to the reader.
The first step of the LCA is used to define the goal and scope of the study. During the second step, a life cycle inventory (LCI) model is analyzed, through which data is collected and organized. The LCI analysis quantifies all elementary flows associated with individual processes, i.e. mass (materials and resources) and energy flows, land use, emissions to air, water, soil, and products of the processes as outputs. The third step is the life cycle impact assessment (LCIA). It is used to understand the relevance of all the inputs and outputs in an environmental framework. The fourth step is the interpretation which covers a systematic technique to identify, check, and evaluate information resulting from the LCIA (see Figure 1).
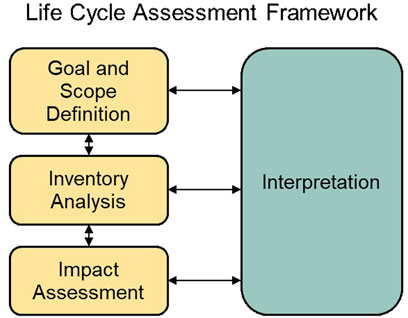
FIGURE 1. Schematic illustration of the LCA framework (DIN 14040, 2006; DIN 14044, 2006).
Due to their impact on the global climate, GHG emissions are a major factor of today’s energy policy, and their quantification is therefore essential for any comparative energy technology assessment. The LCIA for the reviewed studies is therefore completed for the impact category global warming and are used as an indicator of contribution to climate change. Those GHG emissions and GWP are just a few of the many outputs, which are, however, very important for this application, because of the assumed usage of hydrogen for GHG reductions in the energy and transport transition. Additional LCA impact categories that could be interesting for hydrogen based on its application fields are Acidification Potential (AP), Eutrophication Potential (EP), and Photochemical Ozone Creation Potential (POCP) (Masoni and Zamagni, 2011; Lozanovski et al., 2013). The 100 years global warming potentials based on the latest IPCC are applied, according to their radiative forcing capacity relative to the reference substance CO2. The global warming potential (GWP) during the life cycle stages are given as kg CO2 equivalent. The GWP can be normalized to CO2 equivalent emissions to describe the overall contribution to global climate change. CO2 equivalent includes all major emissions CO2 (GWP = 1), CH4 (GWP = 25), N2O (GWP = 298) and chlorofluorocarbons (GWP = 4,750–14,400) and was calculated in a well-known LCA tool named GaBi (Thinkstep, 2019).
Hydrogen Production via PV Electrolysis
The electrolysis systems analyzed in the reviewed studies are alkaline electrolyzers and proton exchange membrane (PEM) electrolyzers. These electrolyzers produce hydrogen at low temperatures, without any external heating. Thus, their operation can be powered by electricity generated by PV systems only. Alkaline electrolyzers have two electrodes operating in a liquid alkaline electrolyte solution of potassium hydroxide (KOH) or sodium hydroxide (NaOH). The anode (positive electrode) is typically made of nickel and copper and is coated with oxides of metals such as manganese, tungsten, and ruthenium. The cathode (negative electrode) is typically made of nickel, coated with small quantities of platinum as a catalyst. A gas separator, or diaphragm, is used to avoid mixing of the hydrogen and oxygen molecules, although it allows free movement of ions. The lifetime of an alkaline electrolyzer is reported to be up to 30 years, however, the electrodes and the diaphragms have to be replaced after 7–15 years. The purity of hydrogen produced by alkaline electrolyzer reaches 99.9 vol% without auxiliary purification equipment. The alkaline technology was not intended to be flexible, i.e. it has traditionally been operated at constant load and maximum efficiency to meet industrial demand.
On the other hand, PEM electrolyzers do not require any liquid electrolyte. Instead, it is replaced by a gas-tight thin polymer membrane (see Figure 2). A synthetic polymer, Nafion, is usually used as the membrane material, which limits the lifetime expectations to 15–20 years. The purity of hydrogen is typically above 99.99 vol%. Since proton transport through the PEM responds quickly to power fluctuations, the PEM electrolyzer has a higher efficiency at a lower current density. Thus, intermittent PV electricity can be efficiently used as an energy source for PEM electrolyzers. The energy required at the theoretical efficiency limit is 39.4 kWh per kilogram of hydrogen. PEM electrolyzers operating at low current density may approach this efficiency limit. Although there are some major differences between the PEM and alkaline technology, the LCA - relevant inputs and outputs are similar for both technologies.
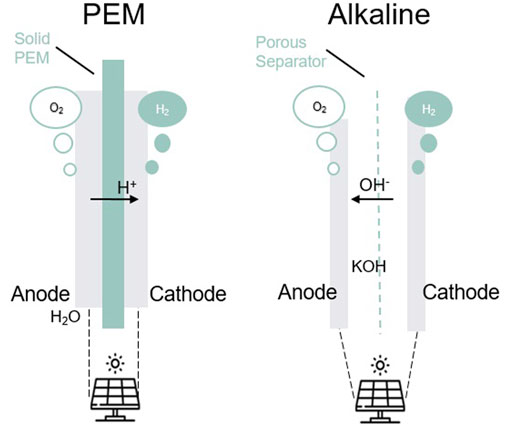
FIGURE 2. Schematic illustration of the different electrolyzer configurations discussed in this paper (L) Proton Exchange Membrane Electrolyzer Cell (PEM) with Nafion as a membrane. Proton (H+) transport between electrodes (r) Alkaline electrolyzer with potassium hydroxide (KOH) liquid electrolyte. Hydroxyl ions (OH-) transport between the electrodes.
The Selection and Harmonization Process
13 studies, consisting of 10 peer-reviewed papers (Koroneos et al., 2004; Granovskii et al., 2006; Granovskii et al., 2007; Lombardi et al., 2011; Ozbilen et al., 2011; Cetinkaya et al., 2012; Pereira and Coelho, 2013; Reiter and Lindorfer, 2015; Suleman et al., 2015; Schmidt Rivera et al., 2018) and three reports on LCAs (Simons et al., 2011; Suleman, 2014; Lundberg, 2019) on PV-powered hydrogen production technologies, were selected for this review and the subsequent GWP harmonization process. The studies were published between 2004 and 2019. These publications were identified by searching notable electronic databases ScienceOpen, ResearchGate, SpringerLink and Scopus using the keywords “hydrogen”, “PV”, “life cycle assessment” and reviewing the reference lists of the articles found. The search was restricted to titles and keywords. No restrictions were placed on language and publication date. Since the focus of this work is on PV based hydrogen production, the boundaries of the system are defined corresponding to a cradle-to-gate approach (see Figure 3). This scope provides a robust way to interpret various studies that extent to hydrogen compression and exclude hydrogen transport and application. Essential inputs for the operation are electricity and deionized water. To produce 1 kg hydrogen, 55–57.5 kWh of electricity and 9–10 L of water are required [10, 14, 15]. The water must be deionized to suppress undesirable electrochemical reactions.
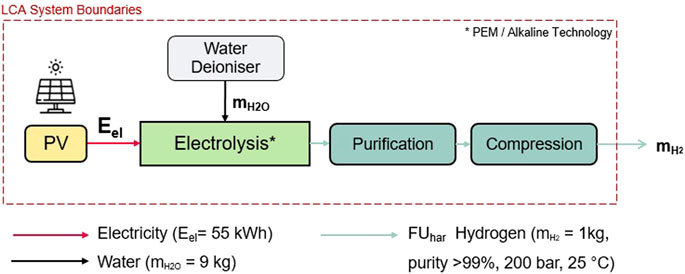
FIGURE 3. The system boundaries of reviewed LCA studies divided into electrolysis incl. purification and compression subsystems.
For the harmonization process, the final conditions of the harmonized functional unit (FUhar) in terms of purity, pressure and temperature are defined as the “provision of 1 kg of hydrogen” (purity >99% vol. pressure 20 MPa (
Since the stages after hydrogen compression are excluded from the system boundaries, the GWP has to be recalculated up to the final stage. Based on Figure 4 and Table 1, the GWP results of the 13 studies were harmonized and recalculated referring to the FUhar. The variation in technological aspects (e.g., feedstock, operating conditions and capacity, the lifetime of the pant etc.) defined by the authors of each case study are not affected by the harmonization, which deals only with methodological choices in LCA.
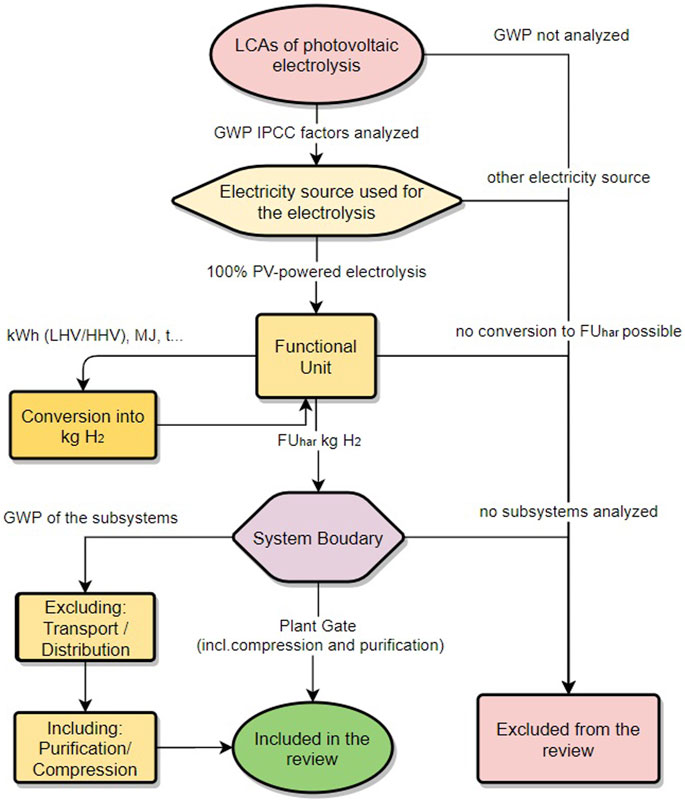
FIGURE 4. The selection and harmonization process of reviewed LCA studies. IPCC - Intergovernmental Panel on Climate Change, GWP - Global Warming Potential, kWh LHV–Lower Heat Value, HHW - Higher Heat Value.
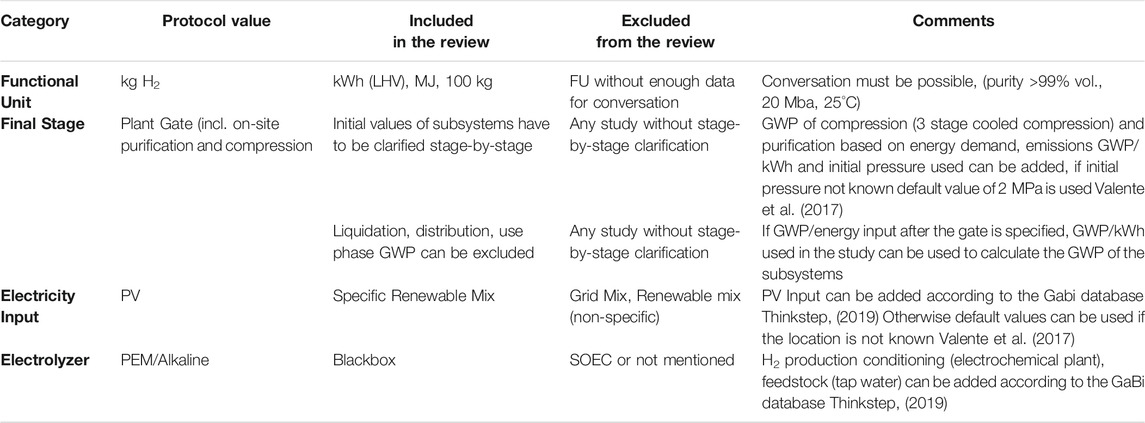
TABLE 1. Calculating of harmonized Global Warming Potential (GWP).
Results
Harmonized GWP Life Science Identifiers
The majority of reviewed studies could not be harmonized. A total number of 34 case studies was pre-selected, 13 of which could be harmonized (Cetinkaya et al., 2012; Granovskii et al., 2006; Granovskii et al., 2007; Koroneos et al., 2004; Lombardi et al., 2011; Lundberg, 2019; Ozbilen et al., 2011; Pereira and Coelho, 2013; Reiter and Lindorfer, 2015; Simons et al., 2011; Suleman et al., 2015; Suleman, 2014; Schmidt Rivera et al., 2018). The studies were excluded after screening because of the absence of open access data; for instance, the GWP results were not broken down into sub-systems and the FU parameters were not fully quantified (Dincer and Acar, 2015; Bhandari et al., 2014; Valente et al., 2017; Mehmeti et al., 2018; Utgikar and Thiesen, 2006; Hacatoglu et al., 2012; Kalinci et al., 2012; Boyano et al., 2011; Lotrič et al., 2021; Zhao et al., 2020; Kovač et al., 2021; Sharma et al., 2020; Ozawa et al., 2017). Hence, in these cases, it was not possible to convert the original FU to FUhar of 1 kg of hydrogen for the desired system boundaries. After the selection process, 13 LCA´s on electrochemical PV-based hydrogen production, shown in Table 2, could be harmonized (Koroneos et al., 2004; Granovskii et al., 2006; Granovskii et al., 2007; Lombardi et al., 2011; Ozbilen et al., 2011; Simons et al., 2011; Cetinkaya et al., 2012; Pereira and Coelho, 2013; Suleman, 2014; Reiter and Lindorfer, 2015; Suleman et al., 2015; Schmidt Rivera et al., 2018; Lundberg, 2019).
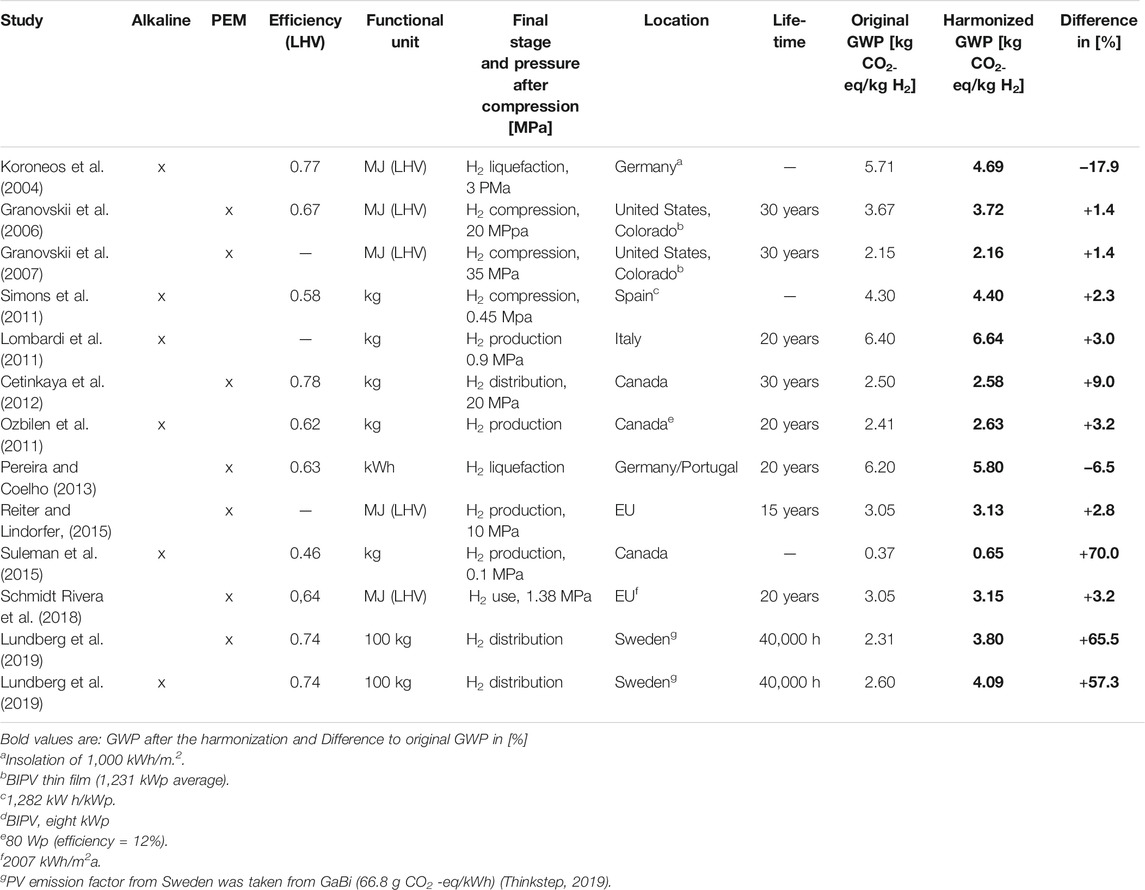
TABLE 2. Overview of the reviewed LCA Studies.
Figure 5 presents a comparison between original and harmonized GWP results that show an average difference of 0.27 kg CO2/FUhar and a maximum difference of 1.5 kg CO2/FUhar. The average GWP of all reviewed studies is 3.71 kg CO2/FUhar and the median of 3.69 kg CO2/FUhar. These differences between original and harmonized GWP are mainly caused by the harmonization of the compression stage, which resulted in extra emissions of 0.24 kg CO2/FU on average. In all studies besides Koroneos et al. (2004) and Ramos Pereira and Coelho (2013) higher emissions were calculated after the harmonization due to the extra electricity demand of compressing hydrogen from the initial pressure used in the studies (0.1–20 MPa) to the goal pressure of the harmonization (20 MPa). In Koroneos et al. (2004) and Ramos Pereira and Coelho (2013) the FU is liquefied hydrogen. The GWP upon compression had to be accurately quantified, to recalculate the original GWP to FUhar and the emissions caused by liquefaction were subtracted, causing lower GWP of FUhar compared to original results. In the study of Lundberg (2019) also the electricity demand of the electrolyzer was replaced by 100% PV electricity of Sweden based on GaBi data (Thinkstep, 2019), causing higher emissions than the PV mix with hydro plants initially used in the study. The study by Suleman et al. (2015) (Suleman et al., 2015) showed the lowest GWP of 0.7 kg CO2/FUhar and the study by Lombardi et al. (Lombardi et al., 2011) the highest GWP of 6.6 kg CO2/FUhar. This can be explained by different assumptions on the emissions of PV electricity and electrolyzer energy consumption. The study of Suleman et al. (2015) assumes very small emission factors for PV. Even though the efficiency of the electrolyzer is low, the original GWP of FUhar is 0.37. Assuming 33.33 kWh/kghydrogen and reported efficiency of the electrolyzer of 0.46, the GWP value can only be achieved by PV emission factor below 0.005 kg CO2/kWh. Compared to other studies this value seems to be unrealistically low, however, it can be achieved by very green production of PV. The high GWP results of 6.6 kg CO2/FUhar found in Lombardi (Lombardi et al., 2011) are caused by high emission factors of PV. Those are based on old PV manufacturing and performance data from 1995 to 1997 combined with assumptions on low PV efficiency and minor solar output. Similarly, in the study by Ramos Pereira and Coelho (Pereira and Coelho, 2013), low irradiation values of Germany (insolation of 1,000 kWh/m2) combined with low-efficiency modules (11%) cause relatively high emission factors of photovoltaic modules and thus high GWP of the FUhar.
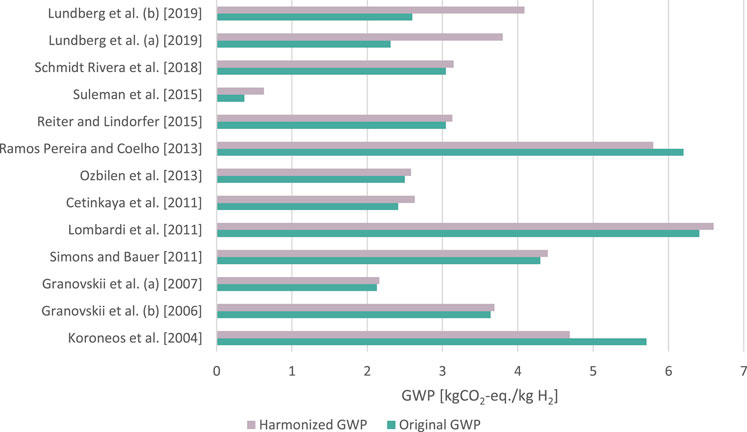
FIGURE 5. Originally reported (green) and harmonized (purple) Global Warming Potential (GWP) of the functional unit of 1 kg hydrogen produced by PV power. Original GWP recalculated to kg H2 up to the H2 compression (when not reported in the original case study; up to the stage before compression). Original Data stem from the studies (Koroneos et al., 2004; Granovskii et al., 2006; Granovskii et al., 2007; Lombardi et al., 2011; Ozbilen et al., 2011; Simons et al., 2011; Cetinkaya et al., 2012; Pereira and Coelho, 2013; Suleman, 2014; Reiter and Lindorfer, 2015; Suleman et al., 2015; Schmidt Rivera et al., 2018; Lundberg, 2019).
GWP of the stages involved in the system’s life cycle impact (e.g., purification, compression, storage, distribution, and use) were not always reported and thus could not be exactly allocated. Five studies accurately described the contribution of the subsystems and divided the results into the impact of the PV system, the electrolyzer, compression and transport. Figure 6 demonstrates the results, allowing direct comparison of the stages. However, since different parameters are used, the interpretation should only be completed based on the background information given in Table 2. In all studies, PV electricity is the largest process contributing to overall GWP. However, the PV impacts vary considerably between the studies. The main reasons are different efficiencies and thus electricity consumption of the electrolyzer, PV technology and production, location of use and operation time. The efficiencies of the electrolyzer differ between 58% by (Simons et al., 2011) and 78% reported by (Cetinkaya et al., 2012; Simons et al., 2011) do not report the lifetime assumed. PV technology analyzed is also different (Granovskii et al., 2006, Granovskii et al., 2007 and Cetinkaya et al., 2012): analyze BIPV thin-film technology. Ground-mounted multi-crystalline silicon panels with the efficiency of 14% are considered in (Schmidt Rivera et al., 2018), assuming the insolation level of 5.5 kWh/m2. day corresponding to the average solar irradiation equatorial areas. Other studies do not state any specific technology (Schmidt Rivera et al., 2018). assumes 20 years of operation and (Granovskii et al., 2006, Granovskii et al., 2007 and Cetinkaya et al., 2012) assume 30 years of operation. Except for (Simons et al., 2011), all studies focus on analyzing PEM electrolyzers. Unfortunately, not enough information is given to understand why the impacts of the electrolyzers seem to be different. Final pressure reported in the studies varies between 0.45 MPa used in (Simons et al., 2011) and 35 MPa used in (Granovskii et al., 2007. Granovskii et al., 2006) assume a lower isothermal compression efficiency of 0.65, rather higher final pressure of 20 MPa and lower gas-turbine power plant efficiency used for compression. This leads to a higher GWP of the compression stage. After the harmonization, the final pressure is 20 MPa and the GWP of the “extra compression” stage is demonstrated separately.
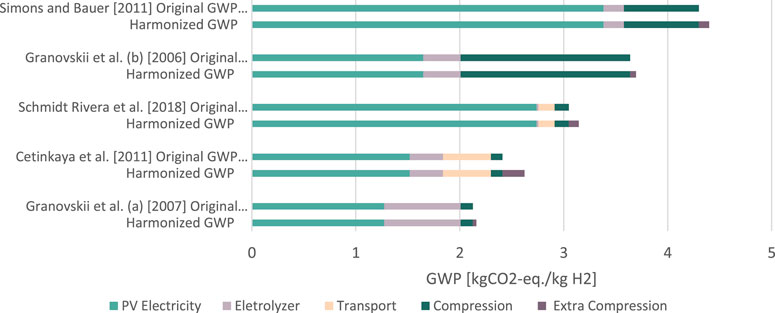
FIGURE 6. Originally reported and harmonized Global Warming Potential (GWP) of the functional unit of 1 kg hydrogen produced by PV power divided into subsystems. Original Data stem from the studies (Koroneos et al., 2004; Granovskii et al., 2006; Granovskii et al., 2007; Lombardi et al., 2011; Ozbilen et al., 2011; Simons et al., 2011; Cetinkaya et al., 2012; Pereira and Coelho, 2013; Suleman, 2014; Reiter and Lindorfer, 2015; Suleman et al., 2015; Schmidt Rivera et al., 2018; Lundberg, 2019).
Sensitivity Analysis
The following parameters can affect the GWP results: electrolyzer manufacturing data (technology choice, capacity), operation conditions (full load hours and lifetime expectancy) and electricity emissions. Electrolyzer system aspects (technology, capacity) hardly influence the GWP results. The GWP of PEM and alkaline technology have very similar results and do not show any major differences in the LCI (Utgikar and Thiesen, 2006; Hacatoglu et al., 2012; Kalinci et al., 2012). Hence, most studies use a “black box” and do not focus on the GWP of the stack and Balance of Plant. Operating conditions have a bigger impact on the GWP. Usually, around 40,000 full load hours are assumed and the amount of hydrogen gas produced during the estimated lifetime is calculated by multiplying the production/hour with the lifetime of the electrolyzers. The efficiency and costs can be indicated by the electricity demand for production (Yang and Ogden, 2007). The impact of the electrolyzer efficiency on the GWP was analyzed by Reiter et al. (Reiter and Lindorfer, 2015). Doubling of the electricity demand of H2 production leads to an increase in GWP between 87 and nearly 100%. Consequently, the emissions caused by the electricity demand of hydrogen production dominate its GWP, independently of the operation assumptions.
The emissions associated with electricity input for hydrogen depend mainly on PV technology and PV performance (e.g. irradiation based on location and orientation, degradation rate, lifetime expectations). The study of Schmidt Rivera et al. (Schmidt Rivera et al., 2018) focuses on the influence of the efficiency of the PV system from 11 to 17% and insolation level. The results indicate that the GWP is not significantly affected by the efficiency. To understand the impacts on the GWP of hydrogen, we modelled hydrogen production in the LCA in the software Gabi (Thinkstep, 2019) using different PV inputs and locations of hydrogen production. The most complete LCIAs of a 1 MW PEM stack and Balance of Plant was modelled based on the data from Bareiß et al. (Bareiß et al., 2019). Material flows of the electrolyzer stack and Balance of Plant are given in Appendix A1, A2 The data for the Nafion membrane are not available so that the data for perfluorosulfonyl fluoride have been used instead. The reference year of used electrolyzer data is 2019. The photovoltaic power generation mix (CIS, CdTe, mono-crystalline and multi-crystalline) was modelled based on the background data of the ecoinvent database (Wernet et al., 2016). The data sets cover all relevant process steps and technologies along the supply chain. The inventory is partly based on primary industry data; partly on secondary literature data. The most important technologies for power generation are considered according to the national situation. The model is based on the global average market mix of photovoltaic technologies installed: Mono-Silicon 42%, Multi-Silicon 47%, Cadmium-Telluride (CdTe) 7% and Copper-Indium-Gallium-Diselenide 4%. The assumptions on irradiance values and PV performance dominate the GWP of PV. Hence, in the LCA model following countries were analyzed in more detail as operating regions for electrolysis: Germany (DE), Italy (IT), China (CN) and Portugal (PT). All technologies were modelled individually based on country-specific annual irradiance values applied in the GaBi (Thinkstep, 2019) and ecoinvent databases (Wernet et al., 2016).
The manufacturing and operation of the whole system are considered in the model. Key PV characteristics were taken from Report IEA-PVPS Task 12 (Frischknecht et al., 2020). Those are e.g. the PV degradation rate of 0.7%/year and life expectancy of 20 years. Since oxygen produced via water electrolysis is technically not used as a co-product, no multi-functionality occurred. Additionally, since the hydrogen production requirement of 1 kg hydrogen varies between 55 and 57.5 kWh, two different scenarios were modelled for each country: a “high energy demand scenario” with 57.5 kWh and a “low energy demand scenario” with 55 kWh. Adjusting for this demand has a large impact on the GWP results of hydrogen (see Figure 7). The operation phase dominates the environmental impacts during the lifetime. GWP of hydrogen from photovoltaics even from the high energy demand scenario still exhibits a lower GWP than any fossil-dominated alternatives production methods like SMR or coal gasification. Experts estimate that in the near future minor efficiency improvements of water electrolysis can be expected (Schmidt et al., 2017). Better efficiencies will lead to a decreased energy demand of hydrogen production and thus reduced GWP per kg of hydrogen. Increasing the efficiency of the electrolyzer results in lower GWP with an approximately linear correlation.
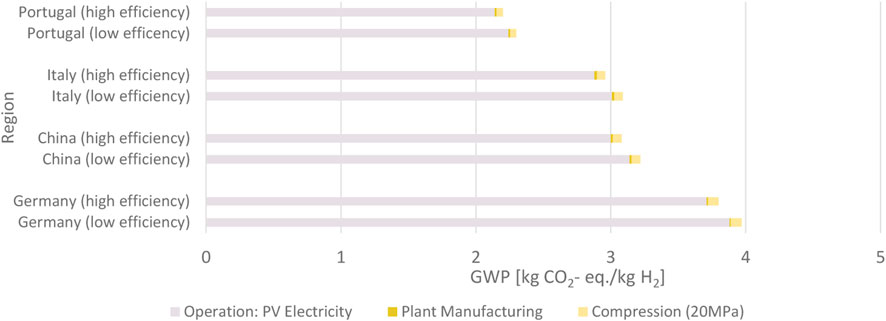
FIGURE 7. Sensitivity analysis for different insolation levels and electrolyzer consumptions. GWP of PV- powered Hydrogen Production by country with high-efficiency scenario (power consumption 55 kWh/kg H2) and low efficiency (electricity demand of 57.5 kWh/kg H2). Purple–GWP caused by PV electricity, yellow - GWP of plant manufacturing and yellow–GWP of compression.
Conclusion
The majority of the environmental impacts during the lifespan of the electrolyzer occur from electricity usage in the operation phase. Even for PV powered electrolysis, the electricity used is crucial for the determination of the environmental impacts. The selection process conducted in this study revealed that the majority of the studies show deviations from the evolving impact assessment methodologies within the LCA community. The incomplete reporting of many LCA reviews caused the impossibility of the harmonization of the GWP results. The results after harmonization and sensitivity analysis show that the viability highly depends on the region of deployment and the use-case scenario. All the reviewed studies confirm that the design of the hydrogen plant has less impact and that different electrolyzer technologies (e.g., PEM and Alkaline) have similar outcomes. However, the electricity consumption of the plant and PV emission factors, that are used to cover the demand, have a large impact on the GWP of hydrogen. The remaining difference between the studies after the harmonization process is shown in Figure 5. Even the harmonized GWP results range between 0.7 and 6.6 kg CO2-eq/FUhar depending on the use case. The differences between original and harmonized GWP range up to 1.5 kg CO2-eq/FUhar in individual cases are mainly caused by the harmonization of the pressure. Based on the previous findings, the lowest GWP, which was found in Suleman et al. (Suleman, 2014), can be confirmed for the “green” electricity scenario, where optimistically low consumption of the electrolyzer and low PV emissions are assumed.
In the future, innovative technologies of PV should be analyzed more precisely. If manufactured in an environmentally friendly way, they offer the opportunity to reduce the GWP of hydrogen by lowing the emission factor of consumed electricity. The ecological benefit of prolonged operation time and recycling options should additionally be included in further analyses. Based on a comprehensive database, a full set of harmonized life-cycle sustainability indicators to be analyzed besides GWP.
For further studies of hydrogen production systems, the authors highly recommended 1) breaking down the entire system into well-defined subsystems and using compression as the final stage of the LCA and/or 2) providing energy inputs/GWP results broken down for the different stages. In the case where the system boundaries of the LCA are not limited to the production plant, a FU of 1 kW h (LHV) hydrogen can also be used to assess the environmental sustainability of hydrogen. If the use phase of hydrogen is the focus of the study, a FU 1 kWh (LHV) can simplify the comparison of its environmental impacts with other energy fuels. The results for the transport and distribution of hydrogen should usually be presented separately from production to avoid undesired combinations and to shift the attention on the impact of different transport scenarios with the option to combine production pathways with diverse distribution possibilities.
Author Contributions
Conceptualization - AR, UR, KD, KB; methodology - OK, AR; software and validation - OK; formal analysis - KB; writing—original draft preparation, OK; writing—review and editing - AR, KB, KD, and UR; supervision - AR. All authors have read and agreed to the published version of the manuscript.
Funding
This research was funded by the Federal Ministry for Education and Research in the framework of the project ‘YESPV-NIGBEN’ grant number: 03SF0576A. The authors declare no conflict of interest.
Conflict of Interest
The authors declare that the research was conducted in the absence of any commercial or financial relationships that could be construed as a potential conflict of interest.
Publisher’s Note
All claims expressed in this article are solely those of the authors and do not necessarily represent those of their affiliated organizations, or those of the publisher, the editors and the reviewers. Any product that may be evaluated in this article, or claim that may be made by its manufacturer, is not guaranteed or endorsed by the publisher.
References
Bareiß, K., de la Rua, C., Möckl, M., and Hamacher, T. (2019). Life Cycle Assessment of Hydrogen From Proton Exchange Membrane Water Electrolysis in Future Energy Systems. Appl. Energ. 237, 862–872. doi:10.1016/j.apenergy.2019.01.001
Bhandari, R., Clemens, A., and Zapp, P. (2014). Life Cycle Assessment of Hydrogen Production via Electrolysis – a Review. J. Clean. Prod. 85 (151e163), 0959–6526. doi:10.1016/j.jclepro.2013.07.048
Boyano, A., Blanco-Marigorta, A. M., Morosuk, T., and Tsatsaronis, G. (2011). Exergoenvironmental Analysis of a Steam Methane Reforming Process for Hydrogen Production. Energy. 36, 2202–2214. doi:10.1016/j.energy.2010.05.020
Bundesministerium für Wirtschaft und Energie (BMWi) (2020). Die Nationale Wasserstoffstrategie. Available at: https://www.bmwi.de/Redaktion/DE/Publikationen/Energie/die-nationale-wasserstoffstrategie.html (Accessed March, , 2021).
Cetinkaya, E., Dincer, I., and Naterer, G. F. (2012). Life Cycle Assessment of Various Hydrogen Production Methods. Int. J. Hydrogen Energ. 37, 2071–2080. doi:10.1016/j.ijhydene.2011.10.064
DIN 14040 (2006). Environmental management-Life cycle assessment-Principles and framework (ISO 14040:2006 + Amd 1:2020); German version EN ISO 14040:2006 + A1:2020. doi:10.31030/3179655
DIN 14044 (2006). Environmental management-Life cycle assessment-Requirements and guidelines (ISO 14044:2006 + Amd 1:2017 + Amd 2:2020); German version EN ISO 14044:2006 + A1:2018 + A2:2020. doi:10.31030/3179656
Dincer, I., and Acar, C. (2015). Review and Evaluation of Hydrogen Production Methods for Better Sustainability. Int. J. Hydrogen Energ. 40 (34), 11094–11111. doi:10.1016/j.ijhydene.2014.12.035
Frischknecht, R., Stolz, P., Krebs, L., de Wild-Scholten, M., Sinha, P., Fthenakis, V., et al. (2020). Life Cycle Inventories and Life Cycle Assessment of Photovoltaic Systems, International Energy Agency (IEA) PVPS Task 12, Report. T12-19, 2020. doi:10.13140/RG.2.2.17977.19041
Granovskii, M., Dincer, I., and Rosen, M. (2006). Life Cycle Assessment of Hydrogen Fuel Cell and Gasoline Vehicles. Int. J. Hydrogen Energ. 31, 337–352. doi:10.1016/j.ijhydene.2005.10.004
Granovskii, M., Dincer, I., and Rosen, M. A. (2007). Exergetic Life Cycle Assessment of Hydrogen Production From Renewables. J. Power Sourc. 167, 461–471. doi:10.1016/j.jpowsour.2007.02.031
Hacatoglu, K., Rosen, M. A., and Dincer, I. (2012). Comparative Life Cycle Assessment of Hydrogen and Other Selected Fuels. Int. J. Hydrogen Energ. 37–9940. doi:10.1016/j.ijhydene.2012.04.020
IEA (2019). The Future of Hydrogen Seizing Today’s Opportunities Technology Report — June 2019. Paris: The Future of Hydrogen, IEA. Available at: (Accessed March, 2021).
Kalinci, Y., Hepbasli, A., and Dincer, I. (2012). Life Cycle Assessment of Hydrogen Production From Biomass Gasification Systems. Int. J. Hydrogen Energ. 37, 14–14039. doi:10.1016/j.ijhydene.2012.06.015
Koroneos, C., Dompros, A., Roumbas, G., and Moussiopoulos, N. (2004). Life Cycle Assessment of Hydrogen Fuel Production Processes. Int. J. Hydrogen Energ. 29, 1443e1150. doi:10.1016/j.ijhydene.2004.01.016
Kovač, A., Paranos, M., and Marciuš, D. (2021). Hydrogen in Energy Transition: A Review. Int. J. Hydrogen Energ. 46, 10016–10035. doi:10.1016/j.ijhydene.2020.11.256
Lombardi, L., Carnevale, E., and Corti, A. (2011). Life Cycle Assessment of Different Hypotheses of Hydrogen Production for Vehicle Fuel Cells Fuelling. Int. J. Energ. Environ. Eng. 2, 63e78.
Lotrič, A., Sekavčnik, M., Kuštrin, I., and Mori, M. (2021). Life-Cycle Assessment of Hydrogen Technologies With the Focus on EU Critical Raw Materials and End-Of-Life Strategies. Int. J. Hydrogen Energ. 46, 10143–10160. doi:10.1016/j.ijhydene.2020.06.190
Lozanovski, A., Schuller, O., Faltenbacher, M., Fischer, M., and Sedlbauer, K. (2013). Guidance Document for Performing LCA on Hydrogen Production. Stuttgart, Germany: Fraunhofer-Institut für Bauohysik.
Lundberg, S. (2019). Comparative LCA of Electrolyzers for Hydrogen Gas Production. Available at: (Accessed February, 2021).
Mehmeti, A., Angelis-Dimakis, A., Arampatzis, G., McPhail, S., and Ulgiati, S. (2018). Life Cycle Assessment and Water Footprint of Hydrogen Production Methods: From Conventional to Emerging Technologies. Environments 5 (2), 24. doi:10.3390/environments5020024
Ozawa, A., Inoue, M., Kitagawa, N., Muramatsu, R., Anzai, Y., Genchi, Y., et al. (2017). Assessing Uncertainties of Well-To-Tank Greenhouse Gas Emissions from Hydrogen Supply Chains. Sustainability. 9, 1101. doi:10.3390/su9071101
Ozbilen, A., Dincer, I., and Rosen, M. (2011). Environmental Evaluation of Hydrogen Production via Thermochemical Water Splitting Using the Cu-Cl Cycle: a Parametric Study. Int. J. Hydrogen Energ. 36, 9514. doi:10.1016/j.ijhydene.2011.05.067
Pereira, S. R., and Coelho, M. C. (2013). Life Cycle Analysis of Hydrogen - A Well-To-Wheels Analysis for Portugal. Int. J. Hydrogen Energ. 38, 2029–2038. doi:10.1016/j.ijhydene.2012.12.029
Reiter, G., and Lindorfer, J. (2015). Global Warming Potential of Hydrogen and Methane Production From Renewable Electricity via Power-To-Gas Technology. Int. J. Life Cycle Assess. 20, 477–489. doi:10.1007/s11367-015-0848-0
Schmidt, O., Gambhir, A., Staffell, I., Hawkes, A., Nelson, J., and Few, S. (2017). Future Cost and Performance of Water Electrolysis: An Expert Elicitation Study. Int. J. Hydrogen Energ. 42, 30470–30492. doi:10.1016/j.ijhydene.2017.10.045
Schmidt Rivera, X. C., Topriska, E., Kolokotroni, M., and Azapagic, A. (2018). Environmental Sustainability of Renewable Hydrogen in Comparison With Conventional Cooking Fuels. J. Clean. Prod. 196, 863–879. doi:10.1016/j.jclepro.2018.06.033
Sharma, H., Mandil, G., Zwolinski, P., Cor, E., Mugnier, H., and Monnier, E. (2020). Integration of Life Cycle Assessment with Energy Simulation Software for Polymer Exchange Membrane (PEM) Electrolysis. Proced. CIRP. 90, 176–181. doi:10.1016/j.procir.2020.02.139
Simons, A., and Bauer, C. (2011). “Life Cycle Assessment of Hydrogen Production,” in Transition to Hydrogen e Pathways toward Clean Transportation. Editors A. Wokaun, and E. Wilhelm (Cambridge, UK: Cambridge University Press), 13–57. doi:10.1017/CBO9781139018036.006
Sphera Solutions, Inc (2019). GaBi Software and Database. Available at: www.gabi-software.com/databases/gabi-databases (Accessed February, 2021).
Suleman, F. (2014). Comparative Study of Various Hydrogen Production Methods for Vehicles. Oshawa, ON, Canada: Master Thesis.
Suleman, F., Dincer, I., and Agelin-Chaab, M. (2015). Environmental Impact Assessment and Comparison of Some Hydrogen Production Options. Int. J. Hydrogen Energ. 40, 6976–6987. doi:10.1016/j.ijhydene.2015.03.123
Utgikar, V., and Thiesen, T. (2006). Life Cycle Assessment of High Temperature Electrolysis for Hydrogen Production via Nuclear Energy. Int. J. Hydrogen Energ. 31, 944. doi:10.1016/j.ijhydene.2005.07.001
Valente, A., Iribarren, D., Dufour, J., and Spazzafumo, G. (2017). Harmonised Life-Cycle Global Warming Impact of Renewable Hydrogen. J. Clean. Prod. 149, 762–772. doi:10.1016/j.jclepro.2017.02.163
Wernet, G., Bauer, C., Steubing, B., Reinhard, J., Moreno-Ruiz, E., and Weidema, B. (2016). The Ecoinvent Database Version 3 (Part I): Overview and Methodology. Int. J. Life Cycle Assess. 21 (9), 1218–1230. doi:10.1007/s11367-016-1087-8
Yang, C., and Ogden, J. (2007). Determining the Lowest-Cost Hydrogen Delivery Mode. Int. J. Hydrogen Energ. 32, 268–286. doi:10.1016/j.ijhydene.2006.05.009
Zhao, G., Kraglund, M. R., Frandsen, H. L., Wulff, A. C., Jensen, S. H., Chen, M., et al. (2020). Life Cycle Assessment of H2O Electrolysis Technologies. Int. J. Hydrogen Energ. 45, 23765–23781. doi:10.1016/j.ijhydene.2020.05.282
Appendix
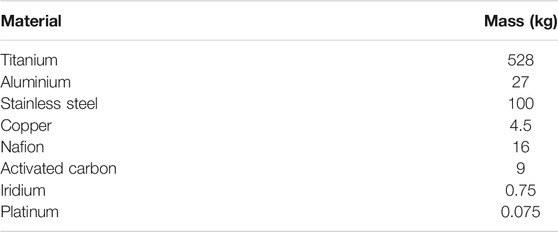
TABLE A1. A1 Materials for a 1 MW PEM stack, state-of-the-art (Bareiß et al., 2019).
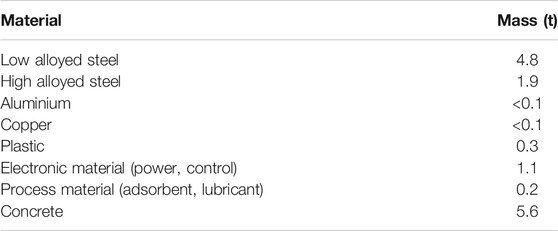
TABLE A2. A2 Main materials and assumed masses for the PEM Balance of Plant (Bareiß et al., 2019).
Keywords: hydrogen production, global warming potential, photovoltaic electrolysis, LCA, CO2 emissions
Citation: Kanz O, Bittkau K, Ding K, Rau U and Reinders A (2021) Review and Harmonization of the Life-Cycle Global Warming Impact of PV-Powered Hydrogen Production by Electrolysis. Front. Electron. 2:711103. doi: 10.3389/felec.2021.711103
Received: 17 May 2021; Accepted: 05 August 2021;
Published: 09 September 2021.
Edited by:
Xiaojing Hao, University of New South Wales, AustraliaReviewed by:
Atse Louwen, Eurac Research, ItalyMingqing Wang, University College London, United Kingdom
Copyright © 2021 Kanz, Bittkau, Ding, Rau and Reinders. This is an open-access article distributed under the terms of the Creative Commons Attribution License (CC BY). The use, distribution or reproduction in other forums is permitted, provided the original author(s) and the copyright owner(s) are credited and that the original publication in this journal is cited, in accordance with accepted academic practice. No use, distribution or reproduction is permitted which does not comply with these terms.
*Correspondence: Olga Kanz, by5rYW56QGZ6LWp1ZWxpY2guZGU=