
95% of researchers rate our articles as excellent or good
Learn more about the work of our research integrity team to safeguard the quality of each article we publish.
Find out more
ORIGINAL RESEARCH article
Front. Electron. , 06 January 2022
Sec. Wearable Electronics
Volume 2 - 2021 | https://doi.org/10.3389/felec.2021.700363
With the rising need for on-body biometric sensing, the development of wearable electrophysiological sensors has been faster than ever. Surface electrodes placed on the skin need to be robust in order to measure biopotentials from the body reliably and comfortable for extended wearability. The electrical stability of nonpolarizable silver/silver chloride (Ag/AgCl) and its low-cost, commercial production have made these electrodes ubiquitous health sensors in the clinical environment, where wet gels and long wires are accommodated by patient immobility. However, smaller, dry electrodes with wireless acquisition are essential for truly wearable, continuous health sensing. Currently, techniques for the robust fabrication of custom Ag/AgCl electrodes are lacking. Here, we present three methods for the fabrication of Ag/AgCl electrodes: oxidizing Ag in a chlorine solution, electroplating Ag, and curing Ag/AgCl ink. Each of these methods is then used to create three different electrode shapes for wearable application. Bench-top and on-body evaluation of the electrode techniques was achieved by electrochemical impedance spectroscopy (EIS), calculation of variance in electrocardiogram (ECG) measurements, and analysis of auditory steady-state response (ASSR) measurement. Microstructures produced on the electrode by each fabrication technique were also investigated with scanning electron microscopy (SEM) and energy-dispersive X-ray spectroscopy (EDX). The custom Ag/AgCl electrodes were found to be efficient in comparison with standard, commercial Ag/AgCl wet electrodes across all three of our presented techniques, with Ag/AgCl ink shown to be the better out of the three in bench-top and biometric recordings.
There is a variety of electrophysiological signals from the body that help give inference about the patient’s condition. Such information can be valuable in diagnosing and treating various illnesses (Kamarajan and Porjesz, 2015). However, symptom onset can be triggered by environmental factors outside of professional care. Therefore, wearable electrophysiological sensing is useful for researchers and medical professionals to monitor the patient’s health and wellness in various environmental conditions (Bonato, 2010; Borhani et al., 2021). In order for the recordings to be a reliable reference for diagnosis and study, electrodes with a good contact and signal quality are needed. Conventional electrodes used for electrophysiological measurements are based on an electrolytic gel to bridge between the skin and a silver/silver chloride (Ag/AgCl) layer on the electrode face in order to achieve a good electrical connection. Unfortunately, the gel can irritate which causes patient discomfort and dry out over time which diminishes the signal quality, making it inconvenient for long-term use (Myers et al., 2015; Li et al., 2018).
The so-called “dry” electrodes do not require any gel and thus are more suitable for wearable sensing due to their long-term sensing and reusability (Li et al., 2018). However, because of the missing moist electrolytic material, having a strong conductive connection with the skin is substantially more difficult. Therefore, maintaining a low skin-electrode contact impedance is much more important and difficult (Spach et al., 1966; Li et al., 2018). Most commonly Ag/AgCl is used directly against the skin, which works reasonably well due to its nonpolarized layer, stable half-cell potential, and nontoxicity (Rohaizad et al., 2019; Meziane et al., 2013).
Unfortunately, for wearable applications, dry electrode recordings are susceptible to more noise if there is not a good contact between the electrode and the skin. Therefore, custom shapes of electrodes are typically needed to match the often nonuniform geometries of the body or penetrate the hair (Fayyaz Shahandashti et al., 2019; Paul et al., 2019; Gargiulo et al., 2019). As developers work on increasingly complex and intricate designs for electrode shapes, there is a need for an effective and reliable fabrication method that is applicable for various geometries which allows for a streamlined manufacturing process.
This article reviews three fabrication methods for making Ag/AgCl electrodes: oxidizing Ag in a chlorine solution, electroplating the Ag, and curing Ag/AgCl ink. All three fabrication methods have uniquely different protocols for viable Ag/AgCl fabrication with high applicability for various shapes. Here, we investigate differences in the mechanical, electrical, and signal consistency properties yielded by each of these methods. Three on-body measurements were performed to characterize each Ag/AgCl electrode type (i.e., bleach, electroplating, and ink): electrocardiogram (ECG) which measures the biopotential of the heart, auditory steady-state response (ASSR) which measures the EEG response of a frequency-modulated auditory stimulus, and electrochemical impedance spectroscopy (EIS) which is used to characterize the electrode-skin contact impedance (Posada-Quintero et al., 2015).
Pure silver (Ag) was first modeled in different shapes. Ag/AgCl was then fabricated with the modeled pure Ag as the base material. Three shapes were made for the Ag/AgCl electrodes: bullet, rod, and disc, potentially suited for different sensing locations including chest, scalp, and in-ear. The bullet and rod were fashioned from a 10-gauge 99.99% pure Ag wire. The 99.9% Ag Â1/2â€RND 24-gauge discs (Rio Grande Inc., Detroit, MI, United States) were sourced commercially.
Three fabrication methods were used to create the Ag/AgCl electrodes: bleaching, electroplating, and ink. The bleached electrodes were made by submerging the Ag in 6.0% sodium hypochlorite (The Clorox Company, Oakland, CA, United States) for 30 min. The electroplating electrodes were made by applying 3.3 V across the 5.1 kΩ resistor in series with the Ag electrodes submerged in 1 M of saline for 6 min. If there are areas where electroplating did not occur, the areas are sanded and reversed in polarity to remove the chlorine layer with the same voltage and resistance. Then the polarity is reversed again to apply the chlorine layer. The 1 M is exchanged when reapplying the new layer. A 330 Ω resistor was used for disc for 3 min. The ink electrodes were made by curing medical-grade electrically conductive ink (124-36 from Creative Materials Inc., Ayer, MA, United States) in a convection oven at 80âf for 20 min. The procedure of each fabrication method is illustrated in Figure 1.
To characterize the surface morphology and microstructures of the electrodes made by each method, scanning electron microscopy (SEM) images and energy-dispersive X-ray spectroscopy (EDX) were taken for three types of rod-shaped electrodes and a pure silver rod (FEI Apreo HiVac Schottky Field Emission Scanning Electron Microscope). For the SEM, the settings were current 0.10 nA, mag 20 000x, and PW 6.74. The average of the granule diameter was computed using ImageJ. For the EDX, the setting used was 30 kV and 0.80 nA.
There were three on-body measurements that were performed: ECG, ASSR, and EIS. For all three, the fabricated electrodes were in dry contact with the skin. The lead II ECG recordings of the bleached, electroplated, ink, and wet-gel commercial 3 M Red Dot electrodes (3 M, Saint Paul, MN, United States) were simultaneously measured from a 52-year-old female. For each channel, both the negative and positive leads utilized only the bullet-shaped electrodes of the same type and the ground lead utilized the wet-gel electrode for all recordings. For the ECG with wet electrodes, wet electrodes were used for all three leads. The BioRadio instrument only allows for one ground for simultaneous recording, and we have chosen the wet-gel electrode to be ground due to its lower impedance and being less affected by motion artifact, so the signal corruption to other channels was minimized. Bullet-shaped electrodes were used for all on-body measurements to stay consistent in using one shape in all on-body recordings. The recording was sampled at 250 Hz utilizing BioRadio and processed by BioCapture v5.5 via Bluetooth (Great Lakes Neurotechnologies Cleveland, OH, United States). A fourth-order bandpass Butterworth with a cutoff frequency of 0.50 and 100 Hz along with the second-order 60 Hz Butterworth notch filter was applied and analyzed in Matlab R2020a.
The epoch of the ECG waveform was divided by finding the R peaks of each heartbeat and grabbing the first 70 samples before and the first 180 samples after, which results in a 1 s epoch. The average of the 35 waveforms epochs for each electrode along with its standard deviation as shaded bars is plotted in Figure 2C. The mean of the variance at each time point of the epoch along with the correlation value of the epochs from fabricated electrodes to the epochs from the wet commercial electrode which is our gold standard was reported at the subplot legend. The ratio of the mean variance of each fabricated electrode to the mean variance of the wet commercial electrode is plotted in Figure 2E in order to compare the variations in the signal of fabricated electrodes.
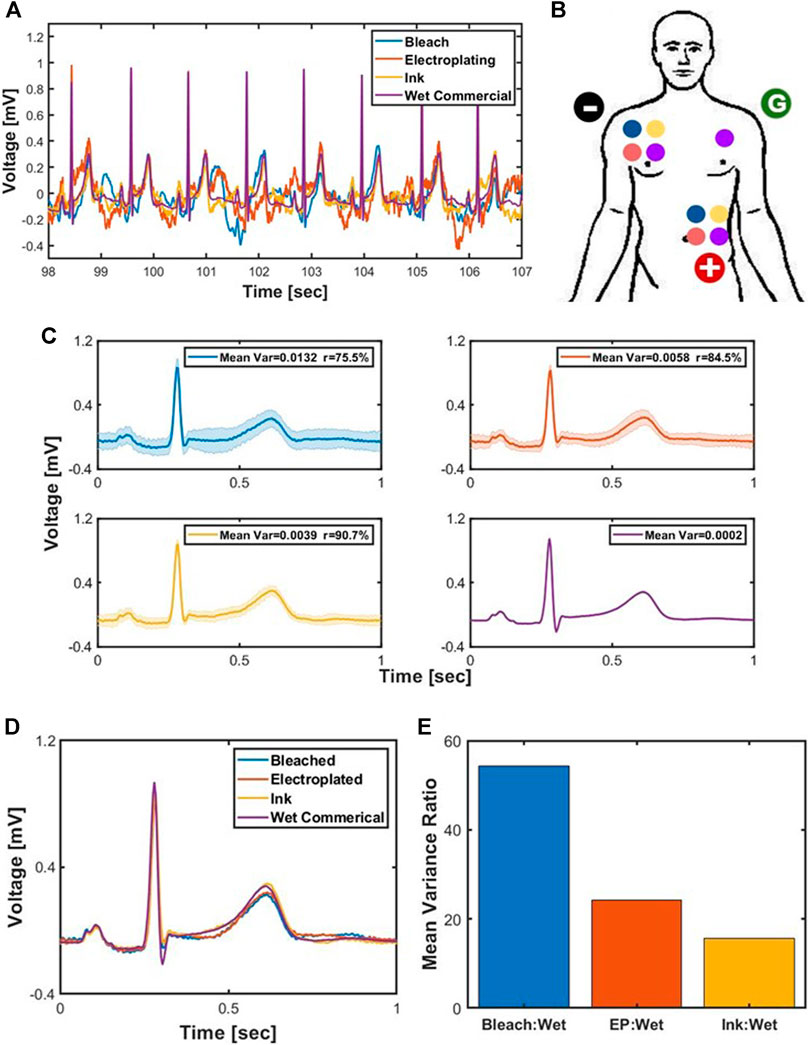
FIGURE 2. ECG recording and analysis where the blue graph is for bleached, orange for electroplating, yellow for ink, and purple for wet commercial electrode. (A) Time-series ECG recordings of the electrodes. (B) Placement of the electrodes for lead II. (C) Subplot of ECG average with mean and error along with its variance. (D) Overlay of the average of the ECG waveform for each electrodes. (E) Ratio of the mean variance for bleach, electroplating (EP), and ink to the mean variance of wet.
The motion artifact experiment shown in Figure 3 recorded the lead II ECG simultaneously using BioRadio at three different states, still, 90 beats per min, and 120 beats per min for three different subjects, 24-year-old male, 26-year-old male, and 52-year-old female. The same electrode placement and configuration were used as the previous ECG experiment with the electrodes attached to the skin with 3M foam tape. For the first state still, the subject’s ECG was recorded when the subject was not in motion. For the second and third state, the subject was walked in place at the beat of a metronome at 90 and 120 beats per min (BPM). Each experiment had a duration of 30 s. No filter was applied to the raw data. The average log power spectral density across subjects for each electrode for each state along with the area underneath the curve of the power spectral density in units of μV2/Hz from 0 to 20 Hz was recorded. The unit of the area is μV.
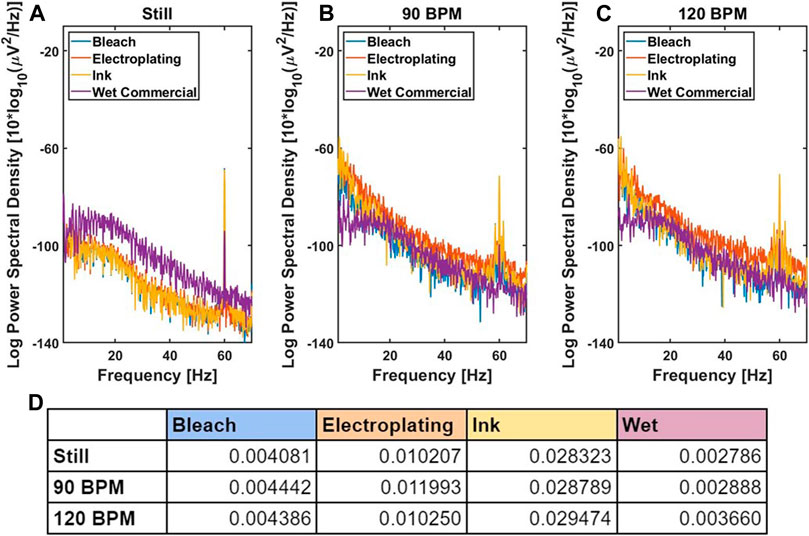
FIGURE 3. Motion artifact analysis. The average log power spectral density of ECG recordings of still (A), subject walking in place at 90 BPM (B), and subject walking in place at 120 BPM (C). The area underneath the curve of the PSD at units of μV2/Hz from 0 to 20 Hz. The units of the values in this table are μV.
The ASSR measurement was performed asynchronously for 1 min with the bleach, electroplating, and ink bullet electrodes as well as wet commercial electrodes on a 24-year-old male, a 26-year-old male, and a 52-year-old female. Three of the same type of electrode was used during recording, and the electrode placements were the negative differential lead at the left mastoid, positive differential lead at the right forehead, and the ground at the left forehead Figure 4A. The 65 dB auditory stimuli were a uniform white noise fully amplitude modulated at 40 Hz. The EEG was measured at 1,000 Hz sampling rate with BioRadio and processed by BioCapture v5.5 via Bluetooth. No filter was applied before computing the power spectral density in Matlab. Furthermore, the amplitude of the 40 and 60 Hz peak was found in Matlab for comparison along with its SNR.
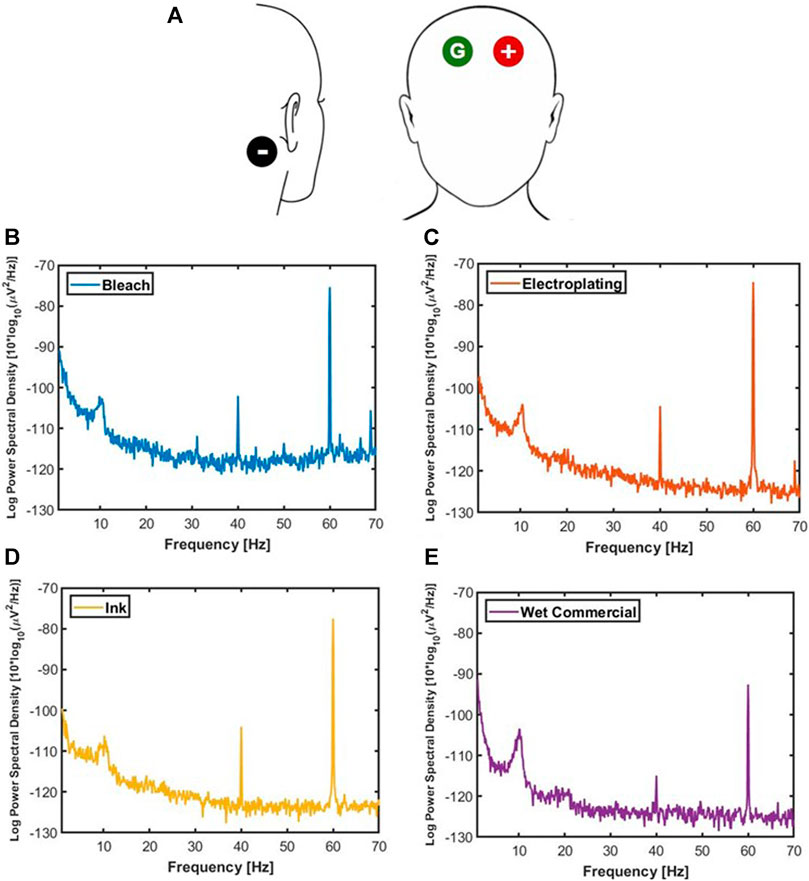
FIGURE 4. (A) Head outline with electrode placement for the ASSR. The average log power spectral density of bleach (B), electroplating (C), ink (D), and wet commercial (E).
The three-wire EIS measurements were performed on the left palmar forearm of a 24-year-old male, a 26-year-old male, and a 52-year-old female with the three bullet-shaped electrodes from the same fabrication method as the working, reference, and counter for each fabrication method. For each experiment run, the three electrodes were placed at the same location 4 cm apart where there is very little hair. The instrumentation used was the PalmSens4 along with its compatible company software PSTrace v5.8 (PalmSens, Utrecht, Houten, NL). The settings used were galvanostatic impedance spectroscopy, pretreatment range set from 100 pA to 100 μA, applied current range at 100 μA, scan type fixed, i dc at 0.0, i ac 0.01, and frequency type scan. Three repetitive measurements were conducted for each type of fabricated Ag/AgCl electrodes and the wet commercial electrodes for each subject. In Matlab, the average of the recordings across subjects and its standard deviation as shaded bars were plotted for all four types of electrodes: bleach, electroplating, ink, and wet in Figure 5.
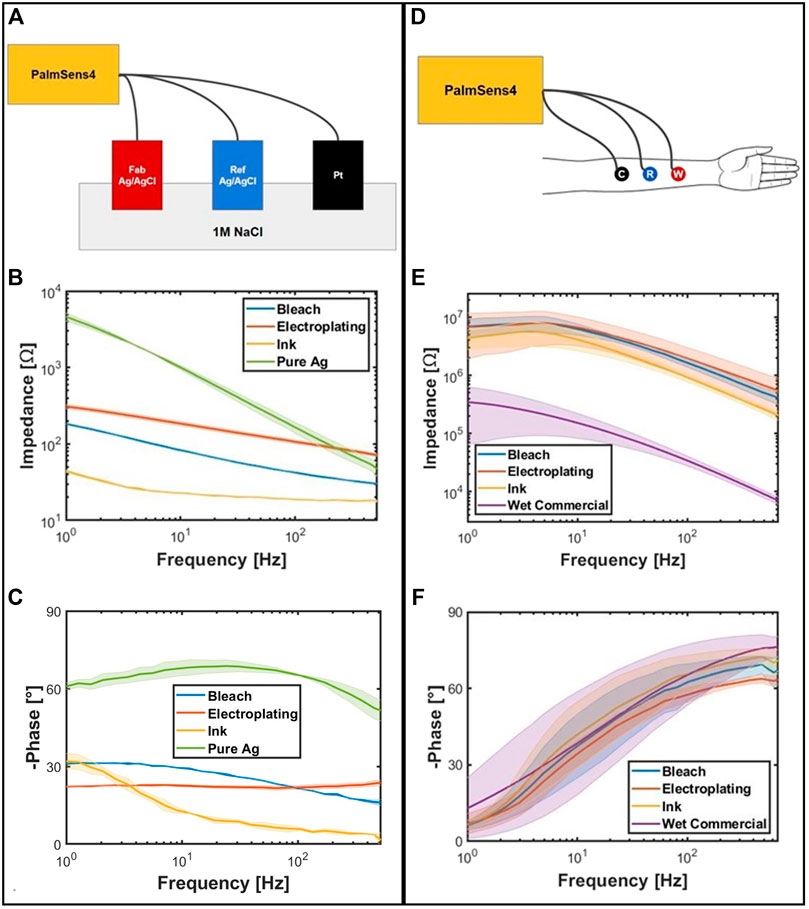
FIGURE 5. (A) EIS setup for saline. Red is the fabricated working electrode. Blue is the Ag/AgCl aqueous reference electrode. Black is the platinum counter electrode. (B) Average impedance vs. frequency of the EIS in saline. (C) Average negative phase vs. frequency of the EIS in saline. (D) EIS setup for skin. Bullet electrodes fabricated by the same fabrication method were used as the counter, reference, and working electrodes. (E) Average impedance vs. frequency of the EIS on skin. (F) Average negative phase vs. frequency of the EIS in skin.
For the saline EIS measurements, one of the fabricated electrodes, Ag/AgCl reference electrode [filled with saturated potassium chloride (36% w/w) electrode potential: 199 mV vs. normal hydrogen electrode (NHE)], and platinum rod were used as the working, reference, and counter electrodes, respectively (Gamry Instruments, Warminster, PA, United States). Each was submerged in the 1 M NaCl and was distanced 2 cm apart. The same instrument and software were used with the exception of the applied current range set to 1 mA instead of 100 μA. Instead of the wet commercial, a 99.99% pure Ag was used. Three subsequent measurements were performed, and the data were later processed in Matlab for computing its average.
Figure 6 shows the fabrication results of each method. The bleach and electroplating retained the shape of the Ag underneath. However, the ink has apparent thickness which extends from the shape of the Ag underneath. This can cause apparent dents and protrusions as shown in the disc and distortion in shape as shown at the tip of bullet and rod ink.
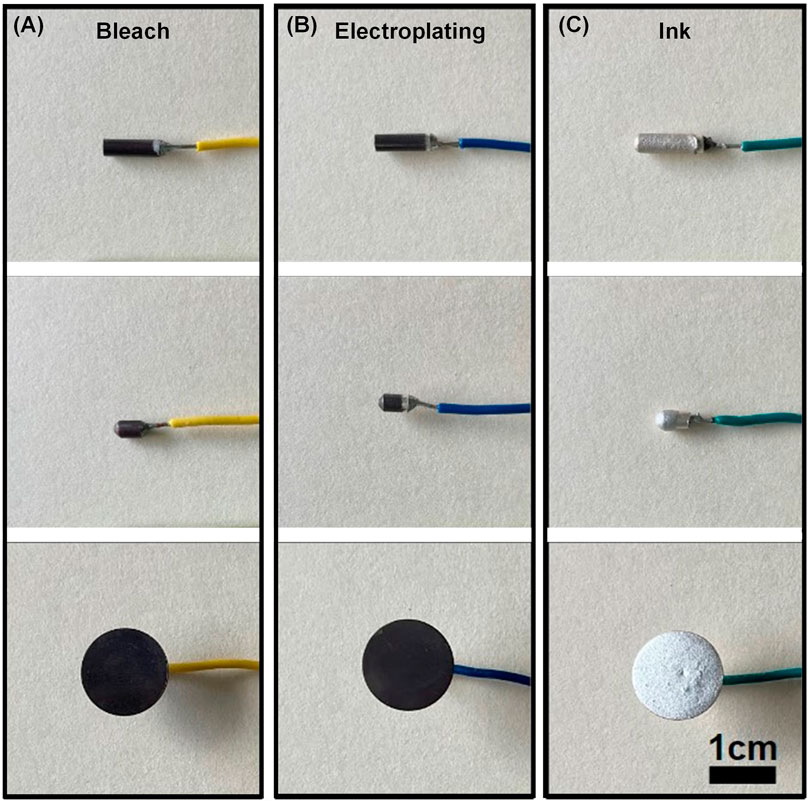
FIGURE 6. (A) Ag/AgCl electrodes made with different fabrication methods for different shapes. The three shapes are rod, bullet, and disc for the first, second, and third row, respectively. The bleached, ink, and electroplated electrodes are in the first, second, and third columns from left to right.
Figure 7 shows the SEM results of the three fabricated electrodes. The average of five random granules was 0.30 μm for the pure Ag, 0.41 μm for the bleach, 0.88 μm for the electroplating, and 2.7 μm for the ink. Bleached electrodes exhibit the formation of granules which grow from the original shape of pure Ag. Electroplated electrodes exhibit larger granule size and emergence of nearby granules. Ink electrodes are porous with laminate flake structures. From the EDX, the weight percentage ratio of Ag to Cl was 3.87 for bleach, 4.09 for electroplating, and 14.36 for ink.
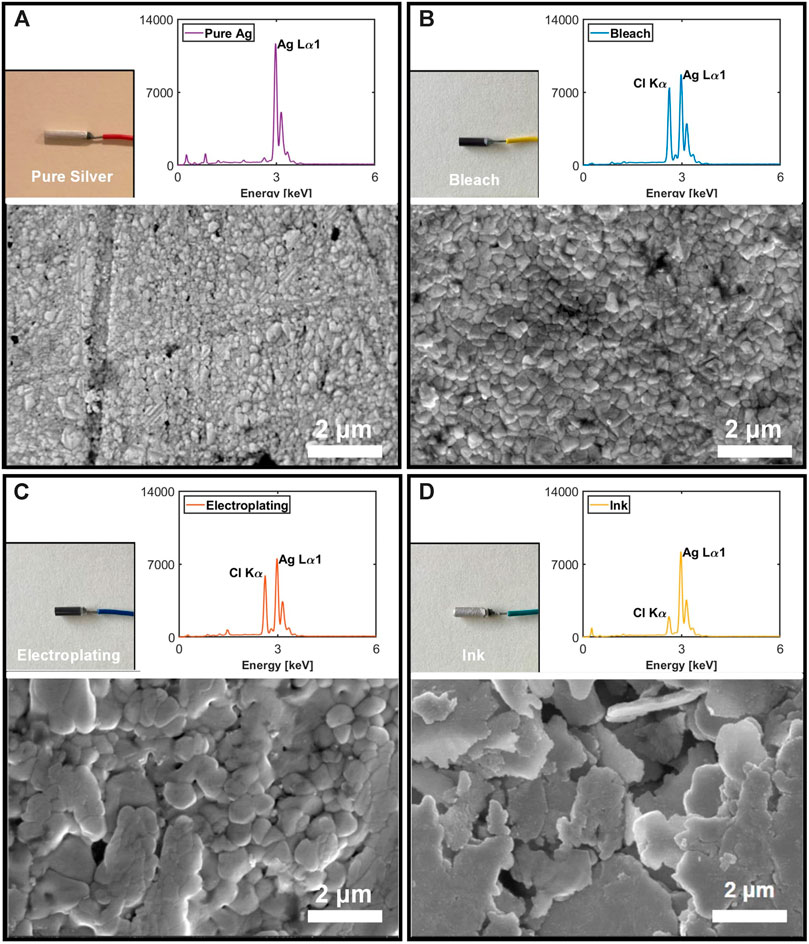
FIGURE 7. Rod electrode image, EDX result, and SEM image for pure Ag (A), bleach (B), electroplating (C), and ink (D).
The overall impedance of the saline is much lower than the skin due to the transfer of ions being faster in saline solution with a high concentration of chlorine ions. In the saline EIS, the fabricated electrodes have much lower impedance in the order of ink, bleach, and electroplating in respect to pure Ag. For the saline experiment, the impedance at roughly 10 Hz was 79.22 Ω for bleach, 178.19 Ω for electroplating, 22.53 Ω for ink, and 893.27 Ω for pure Ag. The impedance at roughly 100 Hz was 41.78 Ω for bleach, 105.48 Ω for electroplating, 18.70 Ω for ink, and 158.72 Ω for pure Ag. The pure Ag is more capacitive than the fabricated electrodes because it has a steeper slope in the impedance vs. frequency. In the case of skin EIS, the wet electrode had the lowest impedance and higher overall capacitance than the fabricated electrodes for dry contact (Chi et al., 2010). The average impedance for ink was lower than the average impedance of bleach and electroplating over all frequencies. The average impedance for electroplating and bleach was very similar at lower frequencies, but electroplating had higher average impedance at higher frequencies. The impedance at roughly 10 Hz was 6.2 MΩ for bleach, 6.5 MΩ for electroplating, 4.0 MΩ for ink, and 0.15 MΩ for wet commercial. The impedance at roughly 100 Hz was 1.7 MΩ for bleach, 1.9 MΩ for electroplating, 0.89 MΩ for ink, and 0.033 MΩ for wet commercial.
Bleach had the highest error at all time points, followed by electroplating, ink, and wet electrodes. The mean of the variance of each time point was 0.013 for bleach, 0.0058 for electroplating, 0.0039 for ink, and 0.0002 for wet commercial. The correlation value was 75.5% for bleach, 84.5% for electroplating, and 90.7% for ink. The ratio of the mean variance of bleach to wet is 56.59, that of electroplating to wet is 24.83, and that of ink to wet is 16.83.
Variance in ECG measurements taken across electrode types showed an apparent minimum at the QRS complex centered at approximately 0.3 s in Figure 2C. Specifically, the calculated variance approaches 0 at the rising and falling edges of the QRS complex, with the R peak itself indicating a small variance in the custom electrode. The variance seen along the P and T regions of the ECG waveform is less conserved across the three custom dry electrode types, but is highly conserved at the QRS region. The commercial wet electrode’s variance is by far the lowest as expected, with near 0 values across the entirety of the QRS complex, as well as at P and T.
In Figure 3B-E, the log power spectral density of the 40 Hz peak was 6.21 × 10⁻¹¹ μV2/Hz for the bleach, 4.20 × 10⁻¹¹ μV2/Hz for the electroplating, 4.50 × 10⁻¹¹ μV2/Hz for the ink, and 2.51 × 10⁻¹² μV2/Hz for the wet commercial. The log power spectral density of the 60 Hz peak was 2.76 × 10⁻⁸ μV2/Hz for the bleach, 3.26 × 10⁻⁸ μV2/Hz for the electroplating, 1.65 × 10⁻⁸ μV2/Hz for the ink, and 5.41 × 10⁻¹⁰ μV2/Hz for the wet commercial.
The SNR of the ASSR was calculated by taking the ratio of the PSD in units of μV2/Hz at 40 Hz to the mean PSD in units of μV2/Hz from 35 to 45 Hz, excluding 40 Hz (Kaveh et al., 2020). The SNR was 32.14 for the bleach, 65.78 for the electroplating, 74.53 for the ink, and 5.82 for the wet commercial.
This study first examines the application and the physical profile from the three different fabrication methods for Ag/AgCl electrodes. We have shown that each method is applicable for various shapes, and each method has a unique surface profile at the microscopic scale in Figures 6, 7.
This study then examines the various characteristics for each fabrication. The study indicates that the ink performed the best out of the three fabrication methods followed by bleach and electroplating in the saline and skin EIS. However, it does not confirm that the latter two are not viable fabrication methods, nor does it suggest that the protocol cannot be improved to increase their performance. As shown in the ECG and the ASSR experiment, all electrodes are capable of recording the desired electrophysiological signal. Additionally, in the saline EIS experiment which compared the Ag/AgCl fabricated electrodes to the pure Ag electrodes, it was shown that all Ag/AgCl electrodes had less measured impedance and capacitance across the board. This supports the general understanding in the field that Ag/AgCl, because of their greater nonpolarizability and lower resistivity, make for better dry-contact surface electrode than Ag alone (Albulbul, 2016).
In the ECG recordings, we see great variance in the dry custom electrodes compared to the wet commercial electrode. This was to be expected when comparing dry vs. wet electrode interfaces, with the dry electrode–skin interface presenting higher impedance and greater noise. Among the custom electrodes, it is apparent the variation was highest in the bleach electrode and lowest in the Ag ink electrodes, which also had the lowest measured impedance of the custom electrodes in the EIS results. Additionally, in the ASSR experiment, the bleach had the lowest SNR out of the three fabricated electrodes. The bleached electrodes, however, did not have the highest impedance as would have been expected from the high ECG variance. Electroplating had a slightly higher impedance and was efficient in both ASSR and ECG recordings similar to ink electrodes.
In manufacturability, bleach was the best because large quantities can be easily made at once in batches. Ink was the second because the commercially bought ink can be easily applied and the curing process can be done simultaneously in the convection oven. Electroplating receives the lowest score for our protocol because it needs to be made one at a time. In performance, ink performed the best in impedance and on-body measurements. Electroplating did have higher impedance than bleach but had more promising biometric recordings than bleach. In reproducibility, bleach and ink were fairly consistent because the commercial materials used were controlled. However, it is difficult to have a consistently specific 3D shape due to the initial fabrication steps requiring the ink, in liquid form, to settle into the desired shape. Since electroplating is made one at a time and depends on the surface area and cathode and anode distance, a lower score was given. In cost, bleach is the cheapest in terms of materials needed to make large quantities. Electroplating requires controlled power supply, resistors, and solution which can be done with a simple breadboard, 9 V, and a voltage regulator. The conductive ink was sourced commercially and can prove to be more expensive than the others. In individual fabrication time, electroplating had the shortest protocol, followed by ink and bleach. Bleached electrodes did have the poorest performance in this set of validations; however, there is still a strong case for their use in specific applications. For example, when R–R interval detection (heartbeat) and low-cost, consistent mass production are more important than clinical-grade monitoring (e.g., atrial fibrillation), say for a consumer fitness tracker, bleached Ag electrodes with their highly conserved low variance in QRS detection and simple fabrication protocol could be most suitable. The scores in Figure 8 were based on the observations and results from the fabrication methods that we have tested and may vary between each person’s altercations of the methods and their applications. Overall, we hope that our work will be useful to readers to make informed decisions after reviewing each electrode type’s methods and performance profile before proceeding to make their wearable device.
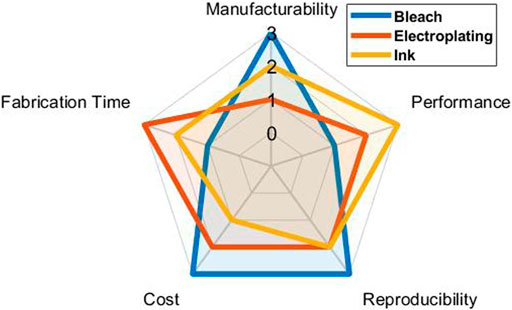
FIGURE 8. Score of the electrode’s manufacturability, performance, reproducibility, cost, and fabrication time based on results and observations of the current protocols for three fabrication methods.
The raw data supporting the conclusion of this article will be made available by the authors, without undue reservation.
The studies involving human participants were reviewed and approved by the UCSD Institutional Review Board. The participants provided their written informed consent to participate in this study.
All authors contributed to the data analysis, experiment design, and content of the manuscript. ML, AP, and YX carried out experiments, discussion, and writing of the manuscript.
This research was supported by the UCSD Center for Wearable Sensors, National Institutes of Health, and NBMC. This research was also sponsored by the Army Research Laboratory and was accomplished under Cooperative Agreement Number W911NF-20-2-0259. The views and conclusion contained in this document are those of the authors and should not be interpreted as representing the official policies, either expressed or implied, of the Army Research Laboratory or the U.S. Government. The U.S. Government is authorized to reproduce and distribute reprints for Government purposes notwithstanding any copyright notation herein.
The authors declare that the research was conducted in the absence of any commercial or financial relationships that could be construed as a potential conflict of interest.
All claims expressed in this article are solely those of the authors and do not necessarily represent those of their affiliated organizations, or those of the publisher, the editors and the reviewers. Any product that may be evaluated in this article, or claim that may be made by its manufacturer, is not guaranteed or endorsed by the publisher.
The authors thank Hyun Jung Kim and Min Kyu Lee for experiment aid, Allison Chen and Annika Seo for reviewing the manuscript, Michael J McBrearty for EIS and silver ink consultation, and Ryan Nicholl for SEM and EDX measurement and consultation. This work was performed in part at the San Diego Nanotechnology Infrastructure (SDNI) of UCSD, a member of the National Nanotechnology Coordinated Infrastructure (NNCI), which is supported by the National Science Foundation (Grant ECCS-1542148). The authors also thank Robert Sah for lending us equipment for experiments.
Albulbul, A. (2016). Evaluating Major Electrode Types for Idle Biological Signal Measurements for Modern Medical Technology. Bioengineering 3, 20. doi:10.3390/bioengineering3030020
Bonato, P. (2010). Wearable Sensors and Systems. IEEE Eng. Med. Biol. Mag. 29, 25–36. doi:10.1109/MEMB.2010.936554
Borhani, S., Zhao, X., Kelly, M. R., Gottschalk, K. E., Yuan, F., Jicha, G. A., et al. (2021). Gauging Working Memory Capacity from Differential Resting Brain Oscillations in Older Individuals with a Wearable Device. Front. Aging Neurosci. 13, 36. doi:10.3389/fnagi.2021.625006
Chi, Y. M., Jung, T.-P., and Cauwenberghs, G. (2010). Dry-contact and Noncontact Biopotential Electrodes: Methodological Review. IEEE Rev. Biomed. Eng. 3, 106–119. doi:10.1109/RBME.2010.2084078
Fayyaz Shahandashti, P., Pourkheyrollah, H., Jahanshahi, A., and Ghafoorifard, H. (2019). Highly Conformable Stretchable Dry Electrodes Based on Inexpensive Flex Substrate for Long-Term Biopotential (EMG/ECG) Monitoring. Sensors Actuators A: Phys. 295, 678–686. doi:10.1016/j.sna.2019.06.041
Gargiulo, G., Bifulco, P., Cesarelli, M., McEwan, A., Nikpour, A., Jin, C., et al. (2019). Fully Open-Access Passive Dry Electrodes Bioadc: Open-Electroencephalography (Eeg) Re-invented. Sensors 19, 772. doi:10.3390/s19040772
Kamarajan, C., and Porjesz, B. (2015). Advances in Electrophysiological Research. Alcohol Res. 37, 53–87.
Kaveh, R., Doong, J., Zhou, A., Schwendeman, C., Gopalan, K., Burghardt, F. L., et al. (2020). Wireless User-Generic Ear Eeg. IEEE Trans. Biomed. Circuits Syst. 14, 727–737. doi:10.1109/TBCAS.2020.3001265
Li, G., Wang, S., and Duan, Y. Y. (2018). Towards Conductive-gel-free Electrodes: Understanding the Wet Electrode, Semi-dry Electrode and Dry Electrode-Skin Interface Impedance Using Electrochemical Impedance Spectroscopy Fitting. Sensors Actuators B: Chem. 277, 250–260. doi:10.1016/j.snb.2018.08.155
Meziane, N., Webster, J. G., Attari, M., and Nimunkar, A. J. (2013). Dry Electrodes for Electrocardiography. Physiol. Meas. 34, R47–R69. doi:10.1088/0967-3334/34/9/r47
Myers, A. C., Huang, H., and Zhu, Y. (2015). Wearable Silver Nanowire Dry Electrodes for Electrophysiological Sensing. RSC Adv. 5, 11627–11632. doi:10.1039/C4RA15101A
Paul, A., Akinin, A., Lee, M. S., Kleffner, M., Deiss, S. R., and Cauwenberghs, G. (2019). “Integrated In-Ear Device for Auditory Health Assessment,” in 2019 41st Annual International Conference of the IEEE Engineering in Medicine and Biology Society (EMBC), Berlin, Germany, 23-27 July 2019 (IEEE). doi:10.1109/EMBC.2019.8856455
Posada-Quintero, H. F., Reyes, B. A., Burnham, K., Pennace, J., and Chon, K. H. (2015). Low Impedance Carbon Adhesive Electrodes with Long Shelf Life. Ann. Biomed. Eng. 43, 2374–2382. doi:10.1007/s10439-015-1282-y
Rohaizad, N., Mayorga-Martinez, C. C., Novotný, F., Webster, R. D., and Pumera, M. (2019). 3D-printed Ag/AgCl Pseudo-reference Electrodes. Electrochemistry Commun. 103, 104–108. doi:10.1016/j.elecom.2019.05.010
Keywords: fabrication and characterization, impedance measurement, electrophysiology, Ag/AgCl, electrode
Citation: Lee MS, Paul A, Xu Y, Hairston WD and Cauwenberghs G (2022) Characterization of Ag/AgCl Dry Electrodes for Wearable Electrophysiological Sensing. Front. Electron. 2:700363. doi: 10.3389/felec.2021.700363
Received: 26 April 2021; Accepted: 25 June 2021;
Published: 06 January 2022.
Edited by:
Yeonsik Noh, University of Massachusetts Amherst, United StatesReviewed by:
Murat Kaya Yapici, Sabancı University, TurkeyCopyright © 2022 Lee, Paul, Xu, Hairston and Cauwenberghs. This is an open-access article distributed under the terms of the Creative Commons Attribution License (CC BY). The use, distribution or reproduction in other forums is permitted, provided the original author(s) and the copyright owner(s) are credited and that the original publication in this journal is cited, in accordance with accepted academic practice. No use, distribution or reproduction is permitted which does not comply with these terms.
*Correspondence: Gert Cauwenberghs, Z2VydEB1Y3NkLmVkdQ==
Disclaimer: All claims expressed in this article are solely those of the authors and do not necessarily represent those of their affiliated organizations, or those of the publisher, the editors and the reviewers. Any product that may be evaluated in this article or claim that may be made by its manufacturer is not guaranteed or endorsed by the publisher.
Research integrity at Frontiers

Learn more about the work of our research integrity team to safeguard the quality of each article we publish.