 I. Parajuli
 G. Ciovati
 A. Gurevich1
- 1Center for Accelerator Science, Department of Physics, Old Dominion University, Norfolk, VA, United States
- 2Thomas Jefferson National Accelerator Facility, Newport News, VA, United States
The performance of superconducting radio-frequency Nb cavities at high radio-frequency (rf) fields in the absence of field emission can be limited by either a sharp decrease of the quality factor Q0(Bp) above peak surface magnetic fields Bp ∼100 mT or by a quench. We have measured Q0(Bp) at 2 K of several 1.3 GHz single-cell Nb cavities with different grain sizes, and with different ambient magnetic fields and cooldown rates below the critical temperature. Temperature mapping and a novel magnetic field mapping systems were used to find the location of “hot-spots” and regions of trapped magnetic flux. The use of a variable input coupler allowed further exploring the dissipative state. The results showed a remarkable thermal stability in some cavities with up to 200 W of rf power dissipation at 2 K, whereas other cavities quenched at much lower rf power. We observed a narrow distributions of the onset fields of hot-spots which were not affected by thermal cycling or by conditions which favor the formation of Nb hydrides. Furthermore, a poor correlation was found between the location of hot-spots and trapped vortices. We suggest that the totality of our experimental data can be explained by a sharp increase of the residual surface resistance above 120–140 mT due to the field-induced breakdown of a proximity-coupled metallic suboxide layer at the surface.
1 Introduction
The performance of superconducting radio-frequency (SRF) Nb cavities has been improving over the past decades, both in terms of the maximum accelerating gradient and the maximum quality factor, making them one of the building blocks or modern particle accelerators. In the absence of extrinsic effects such as field emission or multipacting, the performance of Nb cavities at high peak radio-frequency (rf) surface magnetic field, Bp > 100 mT is limited by either a sharp decrease of the quality factor Q0(Bp), leading to an unacceptably high cryogenic heat load, and referred to in the literature as “high-field Q-slope” (HFQS), or by a sudden breakdown of superconductivity, referred to as “quench” (Padamsee, 2001).
The origin of the HFQS has been the subject of numerous studies for more than 20 years. Some of the most popular models attribute the HFQS to the presence of impurities, defects or nano-precipitates within the rf penetration depth or losses related to the native oxide layer (Halbritter, 1978; Visentin, 2003; Ciovati, 2006a; Ciovati, 2006b; Visentin, 2006; Ciovati et al., 2010; Weingarten, 2011; Romanenko et al., 2013a). Empirically, it has been found that a low-temperature baking (LTB) of the cavities at
It has been shown experimentally, that the origin of quenches in SRF cavities can be either “magnetic” or “thermal” (Padamsee et al., 1981; Eremeev and Palczewski, 2014). Magnetic field quenches have been associated with the presence of topographic defects on the inner surface causing a local magnetic field enhancement (Xie and Liepe, 2013). Thermal quenches have been associated with the presence of normal-conducting defects at the inner surface causing excessive local heating (Shu et al., 1996). Another essential factor increasing the residual surface resistance and reducing the SRF breakdown field has been associated with trapped vortices which appear during cavity cooldown through Tc. Trapped vortices in such flux spots produce additional RF heating so that the flux spots also become hotspots which can be detected by temperature mapping (Padamsee, 2009). A distinctive feature of vortex hotspots is that they exhibit hysteretic behavior upon cycling the rf field and can be changed or moved by applying temperature gradients caused by either external heaters or laser beams (Ciovati and Gurevich, 2008; Gurevich and Ciovati, 2013). The amount of trapped magnetic flux in SRF cavities is reduced by magnetic shielding and by cooling them through Tc with a high temperature gradient (Vogt et al., 2013; Romanenko et al., 2014; Huang et al., 2016; Posen et al., 2016). Optimizing cavity manufacturing and processing as well as the cavity cooling rate have significantly improved the SRF performance (Antoine, 2012; Posen et al., 2022). The highest peak surface magnetic fields in SRF cavities tested at 2 K are typically achieved by applying electropolishing (EP) and LTB as final surface treatments, resulting in Bp > 120 mT limited by quenching (Geng et al., 2011).
While the detrimental effects of trapped flux on the residual rf losses and the SRF breakdown field have been well-documented (Padamsee, 2009; Gurevich and Ciovati, 2013; Liarte et al., 2018), it remains unclear whether the HFQS is primarily driven by the trapped flux or microstructural materials defects. Understanding the mechanisms of the HFQS thus requires a combination of different experimental techniques which would allow us to separate the contributions of trapped vortices and materials defects to Q0(Bp) at high rf fields. This is a goal of this work in which we combine the rf measurements of Q0(Bp) on several Nb cavities which underwent different treatments, along with the temperature mapping and a recently developed magnetic mapping of the cavity surface using arrays of magnetic field sensors (Parajuli et al., 2022). This allows us not only to identify the SRF hostpots and magnetic flux spots but also to superimpose the temperature and magnetic maps to see any correlation between the hotspots and flux spots in the HFQS field region. Particularly, we investigate if the hotspots which show a sharp increase of the overheating at the onset of HFQS are also the magnetic flux spots exhibiting the hysteretic behavior upon cycling the rf field or changing the cooling rate near Tc, as characteristic of trapped vortices. The lack of such correlation would mean that the HFQS is primarily driven by SRF performance-limiting materials defects.
We present experimental results aiming at addressing the following outstanding questions: (i) does the HFQS “saturate” beyond a certain Bp-value? (ii) is the HFQS caused by hotspots and regions of trapped magnetic flux and are the hotspot locations reproducible with respect to repeated cool-down? (iii) is the HFQS impacted by holding the cavity at 90–150 K, which favors the formation of normal-conducting niobium hydrides? (iv) does the HFQS result in thermal quench? (v) what could be the mechanisms of HFQS? To answer these questions we measured Q0(Bp) of 1.3 GHz single-cell cavities at 2.0 K, using a variable input coupler antenna (Ciovati and Turlington, 2019). Temperature maps have been acquired during some of the high-power rf tests. Magnetic field maps have also been measured during some of the rf tests using a magnetic field scanning system described in Ref. (Parajuli et al., 2022).
The paper is organized as follows. In Section 2 we present the totality of our experimental data including Q0(Bp) measurements on cavities subjected to different treatments, temperature mapping revealing hotspots and distribution of local field onsets of HFQS and magnetic field mapping revealing flux spots of trapped vortices and their correlation with the hotspots and grain boundary structures. Section 3 contains discussion of our experimental data in light of different models of HFQS suggested in the literature followed by our thermal feedback model combined with a model of superconductivity breakdown in proximity-coupled suboxide layer, which captures the features of HFQS observed in this work. Section 4 finishes with conclusions.
2 Experimental results
The single-cell cavities used for this study were made from high-purity (residual resistivity ratio greater than 300) ≃ 3 mm thick Nb. Two of them, labeled N3 and PJ1-1 were made from large-grain (LG) Nb (Kneisel et al., 2015) disks from OTIC Ningxia, China. Other cavities labeled RTD-TD01, EZ-SSC-01, TE1G001 and TE1NS001 were made of standard fine-grain (FG) Nb from Tokyo-Denkai, Japan. N3 and PJ1-1 have the TESLA/XFEL center-cell shape with the geometry factor, G = 269.8Ω, Bp/Eacc = 4.12 mT/(MV/m), where Eacc is the accelerating gradient. The other cavities have the TESLA/XFEL end-cell shape [G = 277.8Ω, Bp/Eacc = 4.23 mT/(MV/m)] (Aune et al., 2000).
Some of the cavities have a long processing history as they have been used for R&D projects on N-doping (RDT-TD01), flux expulsion (EZ-SSC-01), high-gradient and large-grain material (PJ1-1 and N3). The highest temperature the cavities have been annealed at in a vacuum furnace is listed in Table 1, along with the last chemical treatment prior to the rf tests conducted for this study. Cavities N3 and PJ1-1 have been etched by buffered chemical polishing (BCP) (HF:HNO3:H3PO4 = 1:1:2 by volume,
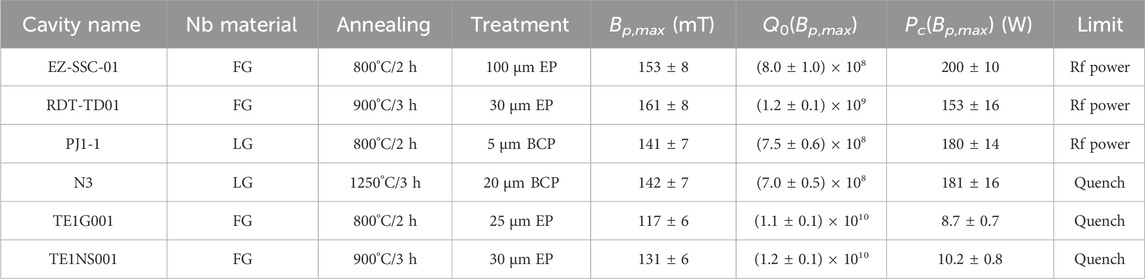
TABLE 1. Summary of the cavities rf performance at 2.0 K, along with the type of material, highest annealing temperature and time and last chemical process prior to the rf test.
The final preparation prior to the rf test of each cavity consisted of a 30 min degreasing with a detergent diluted in ultra-pure water and with ultrasonic agitation, high-pressure (80 bar) rinsing with ultra-pure water for
A summary of the cavities rf performance at 2.0 K is given in Table 1; Figure 1 shows representative plots of Q0(Bp) for some of these cavities. For cavities TE1G001, TE1NS001 and N3, the maximum rf field was limited by a quench, whereas the other cavities were limited by the output power of the rf amplifier,
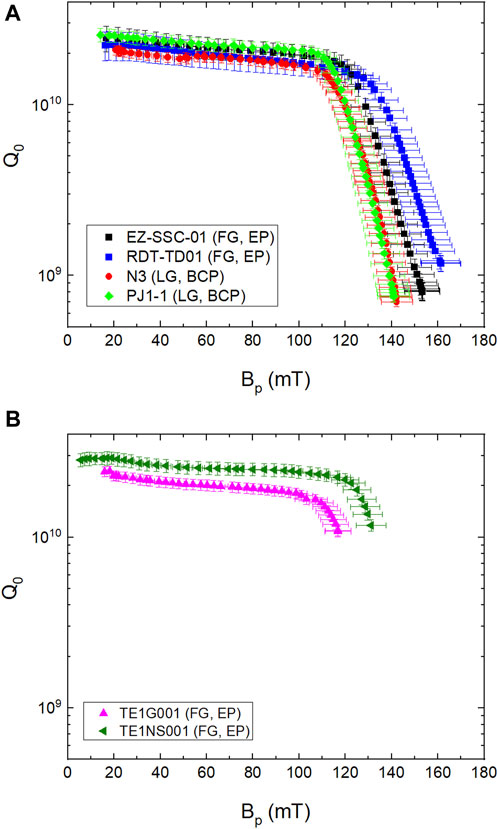
FIGURE 1. Q0(Bp) measured at 2.0 K for 1.3 GHz single-cell cavities limited by the HFQS (A) or by a premature quench (B).
The variable input coupler was adjusted prior to measuring each data point, during each rf test, in order to maintain close to the critical coupling conditions, which maximize the fraction of forward power from the high-power amplifier into the cavity. The ratio of reflected power divided by the forward power at the maximum gradient was 25%, 1% and 0.3% for cavities RDT-TD01, PJ1-1 and EZ-SSC-01, respectively. The input antenna was not long enough to allow better coupling for RDT-TD01 at the highest field.
The power Pc dissipated in the cavity at the highest field reached 150 W, 180 W and 200 W in cavities RTD-TD01, PJ1-1 and EZ-SSC-01, respectively. The cooling capacity of the plant supplying liquid helium at Jefferson Lab’s Vertical Test Area is
2.1 Results of temperature mapping
As mentioned in Section 1, varying temperature gradients and residual dc magnetic field applied to SRF cavities being cooled below Tc can impact their residual resistance: gradients exceeding 0.03 K/cm result in better expulsion of the magnetic flux (Vogt et al., 2013; Romanenko et al., 2014; Huang et al., 2016; Posen et al., 2016). It was also shown that holding a Nb cavity at temperatures 90–150 K for several hours promotes the formation of lossy Nb hydrides, which also impact the residual resistance (Bonin et al., 1992; Knobloch, 2003). To reveal hotspots produced by bundles of trapped vortices and lossy precipitates, we performed cryogenic rf tests of cavities RDT-TD01 and PJ1-1 combined with the temperature mapping as an additional diagnostic tool. This enabled us to evaluate the impact of different cool-down rates, residual dc magnetic field and hydride formation on the intensity and distribution of the hotspots which may cause the HFQS. Detailed information about the values of dT/dz, the residual field Ba and quench location for each of the rf tests discussed in this Section are listed in the Appendix, along with representative Q0(Bp) curves.
Our temperature mapping system consisted of an array of 576 carbon resistance temperature devices (RTDs) attached to the outer cavity surface. Apiezon N grease is applied between the sensors and the cavity to improve the thermal contact. Details about the temperature sensors’ calibration, heat transfer efficiency and the temperature mapping system can be found in Refs. (Romijn et al., 1983; Knobloch et al., 1994; Knobloch, 1997; Ciovati, 2005). The setup was used to measure the temperature maps ΔT (r, Bp) = T (r, Bp) − T0 as a function of the rf field, where T (r, Bp) is the local temperature of the cavity outer surface measured by each RTD and T0 is the temperature of the He bath. To detect hotspots relative to the baseline, we adopted the following criterion: |ΔT − ΔT0|≥ σB⟨dΔT/dBp⟩, where σB ∼ 0.06Bp is the standard deviation of the Bp-measurement, and ⟨dΔT/dBp⟩ is the average slope of ΔT (Bp) in a hotspot at the field Bp at which the temperature map was measured. The value of ⟨dΔT/dBp⟩ increases with Bp beyond the onset of the HFQS, therefore the temperature maps measured at 129 mT were chosen for comparison of different tests. We observed ⟨dΔT/dBp⟩∼ 8 mK/mT at 129 mT and 146 mT for cavities PJ1-1 and RDT-TD01, respectively, compared to
The residual magnetic field was measured with three single-axis cryogenic flux-gate magnetometers (FGMs) distributed around the equator circumference, at a radial distance of
The temperature gradient induced along the cavity during its cool-down was determined by two Cernox® RTDs mounted on the top beam tube and two mounted at the bottom beam tube, the distance between the two pairs being
2.1.1 Impact of cool-down conditions
Figure 2 shows the “unfolded” temperature maps measured at 2.0 K just before quench for cavities PJ1-1 and RDT-TD01 during the baseline rf test, after cool-down with high dT/dz = 3.5 K/cm and low Ba = 0.8 μT to minimize any trapped flux. Significant overheating occurs in the equator area, being more diffused in the fine-grain cavity RDT-TD01 and with sharper hot-spots in the large-grain cavity PJ1-1, consistent with the findings of Ref. (Eremeev and Padamsee, 2006).
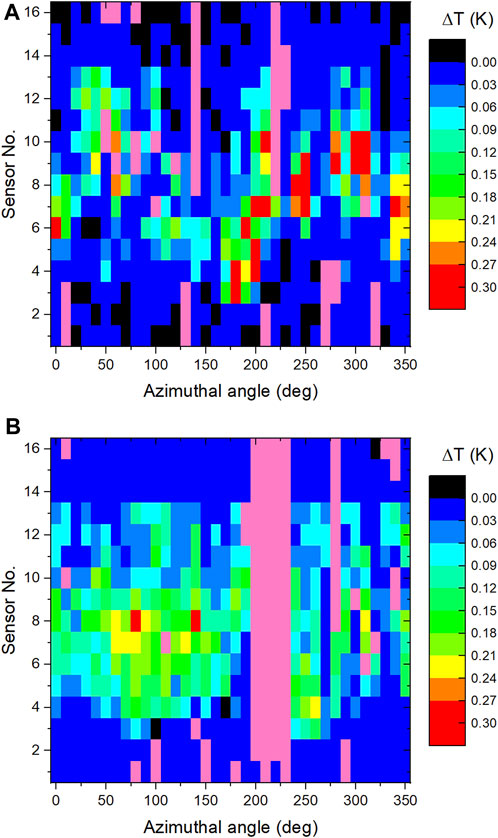
FIGURE 2. Unfolded temperature map at Bp = 165 mT and at Bp = 140 mT measured at 2.0 K during the baseline for cavities PJ1-1 (A) and RDT-TD01 (B), respectively. Sensor 1 is at the top iris, sensor 16 is at the bottom beam tube, close to the iris. Sensor 8 is on the equator weld. Faulty channels/sensors are shown in pink in the color map.
The HFQS T-map results from the rf tests following the baseline can be summarized as follows: (i) the T-maps were reproducible following similar cool-down conditions as for the baseline; (ii) the T-maps did not change after cool-down with low Ba and low dT/dz; (iii) the T-maps did not change after holding the cavities between 90–160 K. Changes in temperature maps compared to the baseline test occurred after cool-down conditions with low dT/dz and high Ba, leading to significant flux trapping. Figure 3 shows an example of the difference between the temperature map measured at 2.0 K, 129 mT after cool-down with such conditions and the T-map measured during the baseline test at the same He bath temperature and rf field, for cavity PJ1-1. Additional hotspots occurred mainly in the high surface magnetic field region of the cavity due to the magnetic flux trapping during cool-down.
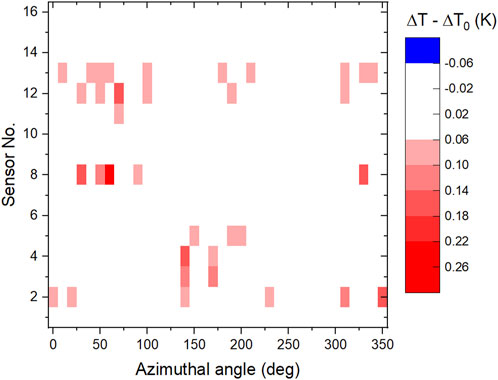
FIGURE 3. Difference between temperature maps at 2.0 K, 129 mT measured for cavity PJ1-1 after cool-down with low dT/dz and high Ba and during the baseline test (high dT/dz and low Ba). The surface magnetic field is within 1% of the peak value in the region between sensors No. 4 and No. 12.
Both cavities were limited by quench. The quench location was different after each cool-down, suggesting that the quench was induced by trapped flux. The rf field was ramped up to the quench and ramped down to
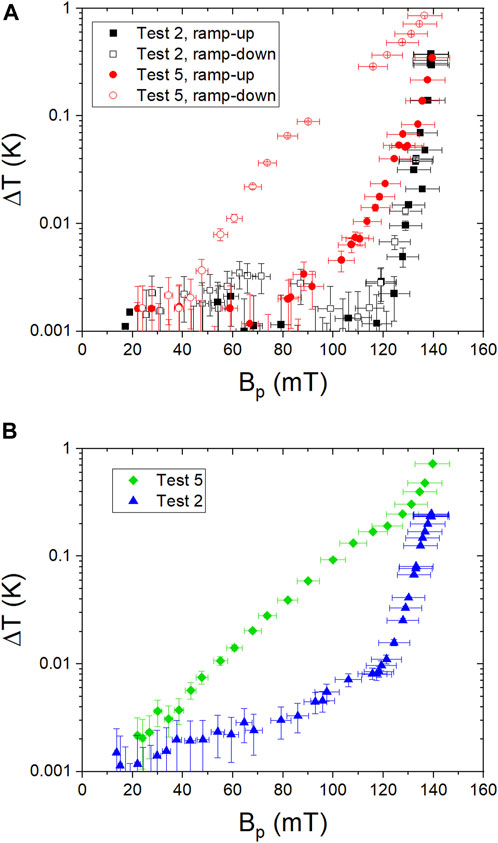
FIGURE 4. ΔT (Bp) for hot-spots at locations 200°/4 (A) and 60°/8 (B) of cavity PJ1-1 measured during Tests No. 2 (high dT/dz and low Ba) and 5 (low dT/dz and high Ba). Empty symbols in (A) represent data taken while decreasing the rf field, after quench. The data from a second ramp-up of the rf field in (A), not shown for clarity, follow the empty symbols.
The macroscopic size of the crystalline grains in cavity PJ1-1 allowed us to determine whether the hotspots are located at grain boundaries. We found that only 8 out of 49 hotspots were located on grain boundaries. A similar weak correlation between the hotspots locations and grain boundaries was reported in Ref. (Ciovati et al., 2007).
2.1.2 Hotspots analysis
The HFQS appears as a fairly sharp decrease of Q0(Bp), as shown in Figure 1. In order to determine the distribution of the local field onsets of the HFQS over the cavity surface, we analyzed 49 hotspots with maximum ΔT ranging from ≃ 40 mK to ≃ 400 mK measured on cavities PJ1-1 and RDT-TD01 during the baseline test. For each hotspot, the surface rf magnetic field corresponding to the onset of the local HFQS, B0, was calculated from the intersection of least-squares linear fits of ln(ΔT) vs. ln(Bth) at low and high rf field, as shown in Figure 5. Here Bth is the amplitude of the rf surface magnetic field at the thermometer location, given by the distribution of the magnetic field on the cavity inner surface calculated with a two-dimensional electromagnetic field solver Superfish (Billen and Young, 1996). For Bth < B0, a quadratic dependence of the ΔT vs. Bth is observed: this is consistent with Joule heating without anomalous rf losses. Figure 6 shows histograms of B0 for these two cavities, both being consistent with a normal distribution following Shapiro-Wilks test, with a mean values of 121 mT and 142 mT for PJ1-1 and RDT-TD01, respectively, and standard deviations of 3.3 mT and 1.8 mT for PJ1-1 and RDT-TD01, respectively.
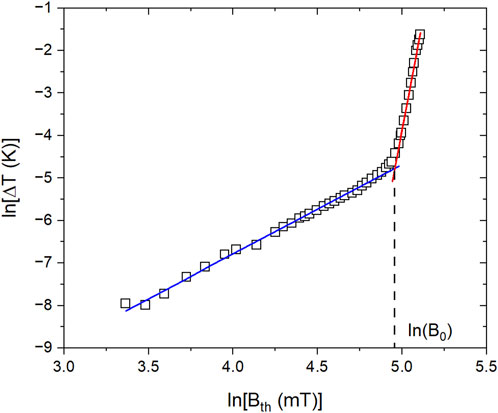
FIGURE 5. Hot-spot at location 90°/6 in the baseline test of cavity RDT-TD01 illustrating the method to determine the onset of the HFQS. Solid lines are least-squares linear fits to ln (ΔT) vs. ln (Bth) at low and high rf field.
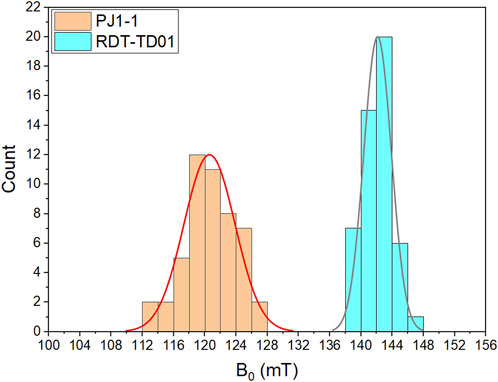
FIGURE 6. Distribution of the onset field, B0, for the HFQS from 49 hotspots for cavities PJ1-1 (LG, BCP) and RDT-TD01 (FG, EP). Solid lines represent normal distributions for each cavity.
2.2 Results of magnetic field mapping
After completion of the rf tests the end-flanges were disassembled from cavity PJ1-1 and the cavity was degreased, high-pressure water rinsed, the end-flanges with fixed input and pick-up antennas were re-assembled back to the cavity. The cavity was then evacuated to
Two Cernox® RTDs were mounted on the top beam tube and two at the bottom beam tube, the distance between the two pairs being
After inserting the test stand into the cryostat, the experimental procedure consists of: (i) reset of the AMR sensors’ magnetization by applying a current pulse at room temperature, in low ambient field, Ba ∼ 0.5 μT; (ii) cool-down to
Figure 7A shows the difference, ΔB = Bf(r, Bp) − Bf(r, 0), between the magnitude of the local dc magnetic field
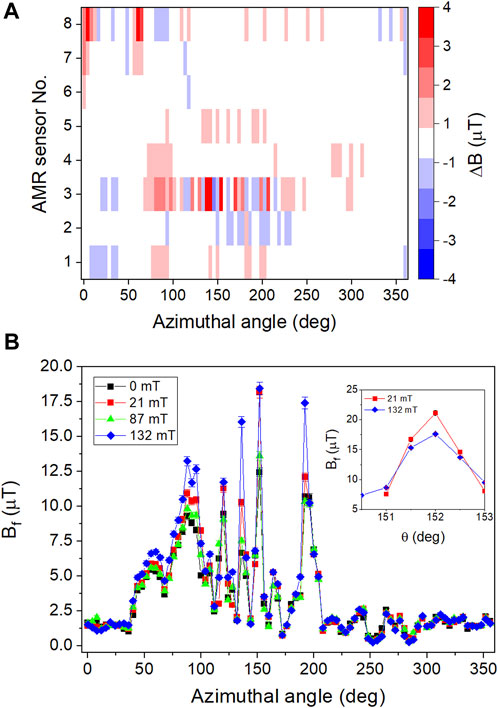
FIGURE 7. (A) Difference between Bf measured at 132 mT minus Bf measured with no rf field, both at 2.0 (K) (B) Bf(θ) measured by sensor No. 3 at different Bp-values. The inset in (B) shows a finer resolution scan of the peak at 150°.
We investigated a possible correlations between the locations of flux spots revealed by magnetic field scanning and hotspots observed by temperature mapping. Figure 8 shows an example of an overlay between a temperature map at 2 K and Bp = 136 mT and a magnetic field map measured by Hall probes at the same temperature and rf field, after cool-down with high dT/dz and low Ba. It should be noted that the area sampled by a thermometer during T-mapping is
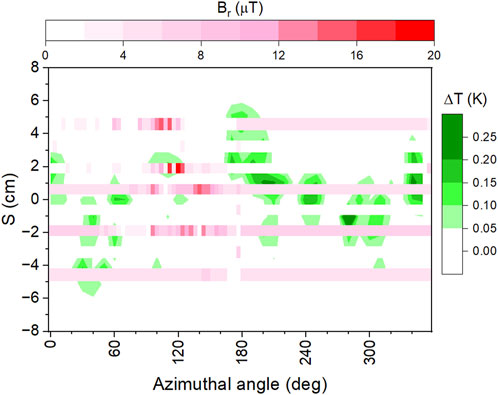
FIGURE 8. Overlay between unfolded temperature maps and magnetic field map with Hall probes, both measured at 2 K and Bp = 136 mT, after cool-down in similar conditions. The variable S is the distance from the equator along the cavity profile. Positive S-values are above the equator. The width of the B-map with the 8 Hall probes is not to scale.
3 Discussion
In spite of differences in the cavities surface preparation and treatment history, Figure 1A shows that their HFQS behavior is fairly similar. The totality of experimental data presented in Section 2 showed a remarkable difference in the magneto-thermal limitations of Nb cavities. On the one hand, cavities with the HFQS remain thermally stable even when dissipating Pc ∼ 200 W at 2 K. In such conditions the average power density
The above results pose the following questions: (i) What can result in the sharp downturn of Q(Bp) at Bp ≈ 120 mT? (ii) Why do the cavities with the extended HFQS remain thermally stable even if they dissipate more than ten times than the cavities without the HFQS at the breakdown field? For instance, some cavities quench with no overheating and very low total dissipated power while others they can sustain 200 W without quench, even though Rs(Bp,max)/Rs(0) ∼ 30. (iii) What mechanisms determine the magnitude of the HFQS and the breakdown field?
To address these questions, we use a thermal feedback model (Gurevich, 2012) in which T(Bp) at the inner cavity surface is determined by the balance of rf power and cooling power of heat transfer through the cavity wall:
Here hK is the Kapitza thermal conductance and κ is the thermal conductivity taken at the temperature of the coolant T0, d is the thickness of the cavity wall. For the sake of simplicity we assume that Eq. 1 describes an averaged temperature T(Bp), RBCS(T) is independent of Bp and Ri(Bp) is independent of T:
Here we use RBCS(T) in the dirty limit (Gurevich, 2012) and adopt a phenomenological model in which the residual surface resistance Ri (Bp) has a transition from a low-resistance state Ri ≈ R1 at Bp ≲ B0 to a high-resistance state with Ri ≈ R1 + 2R2 at Bp ≳ B0. Mechanisms of the transition field B0 and the broadening parameter B1 are discussed later. It is convenient to write Eq. 1 in the dimensionless form
where
We solved Eqs 1–3 numerically to calculate T(Bp) and the surface resistance Rs[Bp, T(Bp)] affected by the parameters B0, B1 and R2 of the resistive transition. Graphic solutions of Eq. 4 shown in Figure 9 give an insight into the greater thermal stability of the HFQS state. At Bp below a thermal breakdown field Bb, there are two stationary temperature states T1 and T2: a stable state 1 and an unstable state 2. The existence of the unstable state 2 implies that the state 1 is metastable with respect to a heat pulse causing the overheating larger than T2 − T1 and igniting a thermal quench. The points 1 and 2 merge at a thermal breakdown field Bb above which no stable states exist because the cooling power cannot balance the RF power.
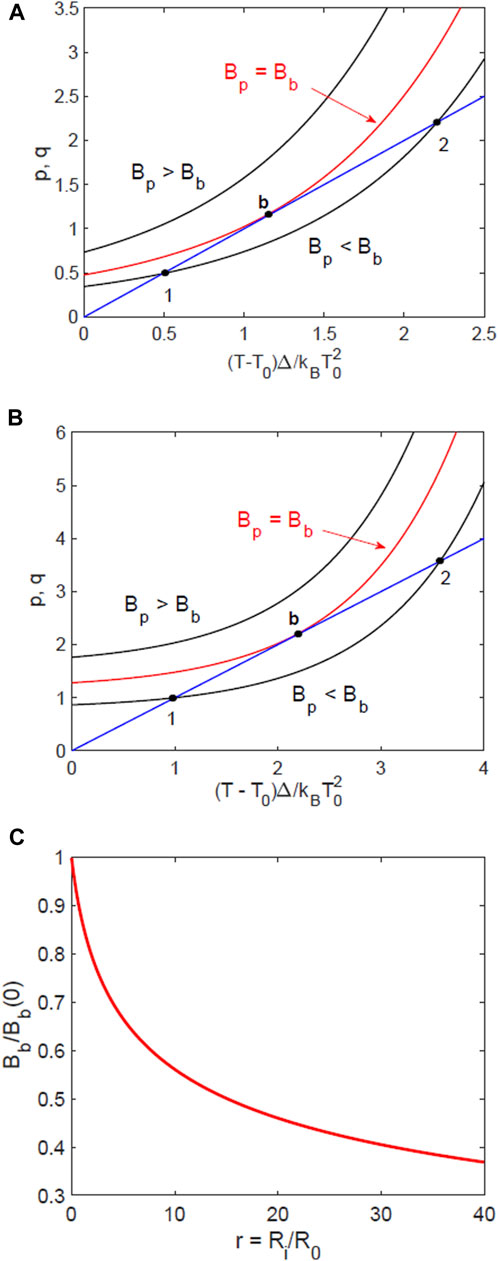
FIGURE 9. Graphic solution of the heat balance Eqs 1–3 for: (A) Ri = 0.2R0 and (B) Ri = 10R0. The blue line shows the dimensionless cooling power q = θ in the r.h.s. of Eq. 4 and the black and red curves show the rf power p in the l.h.s. of Eq. 4 at different fields. The points 1 and 2 correspond to stable and unstable uniform states, respectively. (C) The decrease of the thermal breakdown field Bb with Ri.
The thermal breakdown of superconductivity is primarily driven by the strong increase of RBCS(T) with T resulting in thermal runaway at Bp = Bb at a critical overheating Tb − T0 much smaller than either Tc and T0. For instance, at Ri ≪ R0 the thermal runaway occurs at a rather weak overheating
where e = 2.718. Figure 10A shows the evolution of Q0(Bp) as the magnitude 2R2 of the resistive step in Ri(Bp) increases. In all cases the thermal quench occurs at the end points of the Q0(Bp) curves. The HFQS state followed by quench is clearly visible at R2 = 20R0. At a smaller R2 = 5R0 the model predicts a partial HFQS followed by the flattening of Q0(Bp) before quench. Figure 10B shows that this thermal feedback model with B0 = 142.4 mT, B1 = 12.3 mT and R2 = 33.6R0 fits our HFQS experimental data quite well. Here R1 = 0.35R0 was obtained from a least-squares fit of Rs(T) at low rf field, and the thermal quench occurs at Bb = 143 mT, beyond the last datapoint in Figure 10B. Therefore, the resistive transition in Ri(Bp) does not eliminate the thermal quench but increases stable overheating causing an extended decrease of Q0(Bp) with Bp and a significant increase of the rf power before the thermal breakdown at Bp = Bb. In what follows we discuss possible mechanisms of the stepwise increase of Ri(Bp).
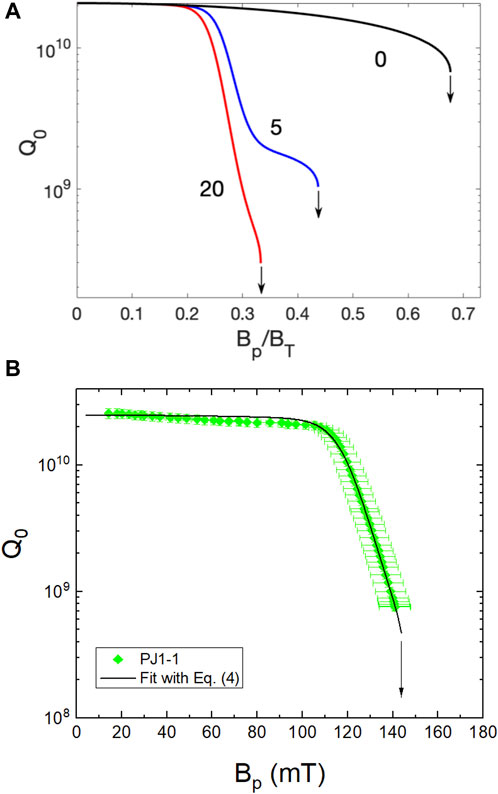
FIGURE 10. (A) Q0(Bp) calculated for a field-induced transition at B0 = 0.3BT with B1 = 0.1B0, R1 = 0.2R0 and kBT0/Δ = 1/9. The numbers by the curves show R2 in units of R0. The black curve shows Q0(Bp) without the field-induced transition, where Q0 at Bp = 0 was set to 2.5 × 10¹⁰. The arrows at the end points of Q0(Bp) depict the thermal quench. (B) Q0(Bp) measured at 2 K for cavity PJ1-1 without temperature mapping, shown in Figure 1A, and least-squares fit with Eq. 4 for B0 = 142.4 mT, B1 = 12.3 mT, R2 = 33.6R0 and R1 = 0.35R0. The arrow represents the quench field predicted by the model.
The experimental results presented in Section 2 show that: (i) the hotspots distribution is not affected strongly by the magnitude of a temperature gradient applied during cool-down; (ii) additional hotspots are produced by trapped magnetic flux, resulting from an ambient field ≳ 4 μT during cool-down, but the overheating starts at low rf field and it is less steep, with increasing rf field, than what is measured in the HFQS region; (iii) no strong correlation was found between trapped flux locations and hotspots associated with the HFQS, after cool-down with conditions which minimize the amount of trapped flux. Even though an earlier study showed that some HFQS hotspots may be attributed to trapped vortices (Ciovati and Gurevich, 2008), our experimental data indicate that trapped vortices are hardly a dominant cause of the HFQS in the cavities studied in this work.
The above conclusion is consistent with numerical simulations of trapped vortices perpendicular to the surface and interacting with randomly distributed pinning centers (Pathirana and Gurevich, 2020; Pathirana and Gurevich, 2021). In this case Ri(Bp) increases with Bp at low fields and levels off above a depinning field Bd which depends on the elementary pinning forces, pin density and rf frequency. Although the rf depinning of trapped vortices can produce a stepwise increase of Ri(Bp) at Bp ≳ Bd (Dhakal et al., 2020; Pathirana and Gurevich, 2020; Pathirana and Gurevich, 2021), it can hardly explain the observed features of HFQS at B0 ≃ 120–160 mT. First, the depinning field Bp ≲ 0.1–0.3Bc1 ∼ 10–40 mT obtained in numerical simulations is well below B0 even for strong pins (like 10–20 nm oxide or hydride precipitates). Second, the calculated width of the rf depinning transition ≃ Bp is much wider than the observed sharp transition to the HFQS state with the width ≲ 0.1B0. Such broadening of the depinning transition results from random distribution of pinning centers and strong variations of the pin spacings from the cavity surface.
The HFQS may also be attributed to the presence of normal-conducting nano-precipitates within the rf penetration depth. These nano-precipitates are superconducting at low rf field due to the proximity effect and become normal above a threshold field, related to the onset of the HFQS. Such nano-precipitates can be niobium hydrides (Romanenko et al., 2013a) or metallic suboxides (Weingarten, 2011). Hydride precipitates caused by excessive hydrogen can nucleate on crystal defects, such as vacancies and low-angle grain boundaries (Sung et al., 2017). Evidence of nanohydrides within a
A field dependence of Rs(Bp), based on a distribution of precipitates with different sizes, was proposed in Ref. (Romanenko et al., 2013a). The model of Ref. (Weingarten, 2011). invokes the presence of NbO nano-precipitates at the Nb surface but several TEM studies of the Nb surface revealed a uniform, layered oxide structure with no evidence of NbO nano-precipitates (Batchelor et al., 2007; Tao et al., 2011; Sung et al., 2014; Trenikhina et al., 2015). Another possibility of the HFQS involves penetration of mixed Abrikosov-Josephson (AJ) vortices (Gurevich, 2002; Sheikhzada and Gurevich, 2017) along a network of strongly coupled grain boundaries in a polycrystalline Nb. All these scenarios have one common feature inconsistent with the observed sharp downturn of Q0(Bp) at the onset of the HFQS with a narrow transition width B1 ≃ (8–9)%B0 shown in Figure 1. Indeed, a random distribution of nano-precipitates would produce a broader transition to a HFQS, not only because of different sizes and shapes of nanoprecipitates but also because the superconductivity breakdown of the ith precipitate spaced by Li from the surface occurs at the applied field B0 ∼ (Jciλ/μ0) exp (Li/λ), where Jci is a shape-dependent critical current density causing the breakdown. Hence, random local spacings of precipitates from the surface can produce an exponentially broad distribution of local transition fields manifesting themselves in a broad HFQS. The same argument is applicable to a broad distribution of local penetration fields of AJ vortices along grain boundaries with different Josephson currents and random orientation with respect to the surface. Those materials broadening mechanisms are augmented by a “natural” width of the HFQS transition due to a lateral variation of the rf field at the cavity equatorial surface for the TM010 mode.
A mechanism which could account for the observed sharp HFQS transition may be related to the breakdown of proximity induced superconductivity at Bp = B0 in the metallic suboxide layer of thickness d ≃ 1 nm (Sun et al., 2023). Such suboxide layer is directly exposed to the rf field, so the transition occurs at a well-defined field without exponential broadening due to a random distribution of Li. Yet because the surface rf field varies along the cavity surface, the breakdown of superconductivity in the suboxide layer would first occur at the equator and then spread over the surface as Bp is increased. In this case the resistive transition in the global Ri(Bp) would be broadened over an intrinsic width B1 depending on the cavity geometry and the excited resonant mode.
To see if the above mechanism could produce the step in Ri(B0) accounting for the HFQS shown in Figure 10B, we evaluate the extra rf power Pi in a suboxide overlayer of thickness d as it becomes normal at Bp > B0. Here Pi is controlled by the electric field E = ωBλ at the cavity surface,
where σi is the normal conductivity of the overlayer. The ratio r = Ri/RBCS defined by Eqs 2, 7 is then:
Taking here Δ/kBT = 9 at 2 K, d/λ = 0.025–0.05, σi = σn and 9kBT/4ℏω = 47 at 2 GHz, gives r ≈ 6–12. Moreover, the broadening of the DOS peaks reduces the factor ln(9kBT/4ℏω) in Eq. 8 to ln(kBT/Γ), where Γ is the Dynes parameter (Gurevich, 2023). For Γ ≃ 10−2Δ (Lechner et al., 2020), we get kBT/Γ ≃ 11, so that RBCS is reduced by a factor ≃ 1.61 and the ratio r increases to r ≃ 10–20. In turn, the breakdown of the proximity coupled superconductivity in the suboxide causes superconductivity suppression in an adjacent surface layer of Nb (Kubo and Gurevich, 2019), further increasing the thickness of the dissipative layer at the surface. As a result, the breakdown of proximity-induced superconductivity in the suboxide may significantly increase Ri (Bp) at Bp > B0, giving rise to the HFQS.
Microscopic calculations of the breakdown field Bsn of a proximity-coupled thick normal overlayer with di ≳ ξn show that Bsn can be well below the superheating field Bs (Fauchére and Blatter, 1997). However for thin (di ≪ ξn) suboxide overlayers characteristic of Nb surface, Bsn is of the order of Bs but the actual value of Bsn depends strongly on such materials-sensitive parameters as σi, di and the interface contact resistance between the N layer and the bulk Nb (Kubo and Gurevich, 2019). A thin proximity-coupled suboxide layer not only reduces the field onset of HFQS but also causes a slight decrease in Δ affecting RBCS(T). A correlation between the reduction of B0 and Δ was observed in Ref. (Ciovati et al., 2007).
4 Conclusion
The use of a variable coupler, along with a novel magnetic field scanning apparatus and the traditional temperature mapping setup provided valuable insights into the dissipative state of Nb cavities at high rf fields. We found that the location of hotspots causing the HFQS is reproducible upon thermal cycling through Tc, the intensity and location of hotspots causing the HFQS are not altered significantly after holding the cavity at temperatures which promote the formation of Nb hydrides. A narrow distribution of the onset field for the HFQS at different hotspot locations was observed, resulting in a sharp upturn of Rs(Bp) above
The remarkable thermal stability of some cavities with the HFQS can be explained by the thermal feedback model, incorporating a field-dependent residual resistance. The observed Q0(Bp) curves can be described well by a model in which the residual resistance has a sharp transition from a low-resistance state to a high-resistance state, above a threshold rf field. Such transition can result from suppression of the proximity effect-induced superconductivity in a thin metallic suboxide layer between the dielectric surface oxide and the bulk Nb by rf currents at strong fields Bp ≳ B0. In this scenario the HFQS can result from surface treatments increasing the thickness of the suboxide layer or the interface boundary resistance R□, shifting the transition field B0 below the thermal breakdown field Bb. Conversely, materials treatments such as the LTB which may shrink the suboxide layer and reduce R□, or change the superconducting parameters at the surface in such a way that the ratio r in Eq. 8 is decreased, would either diminish the HFQS or eliminate it completely if B0 > Bb.
Data availability statement
The raw data supporting the conclusions of this article will be made available by the authors, without undue reservation.
Author contributions
IP: Data curation, Formal Analysis, Investigation, Software, Writing–review and editing. GC: Conceptualization, Data curation, Formal Analysis, Funding acquisition, Methodology, Resources, Supervision, Writing–original draft, Writing–review and editing. AG: Formal Analysis, Funding acquisition, Writing–original draft, Writing–review and editing.
Funding
The author(s) declare financial support was received for the research, authorship, and/or publication of this article. The work of AG and IP was supported by NSF under grant PHY 100614-010 and by DOE under grant SC10087-20. GC is supported by Jefferson Science Associates, LLC under U.S. DOE Contract No. DE-AC05-06OR23177.
Acknowledgments
We would like to acknowledge P. Dhakal, R. Geng, G. Eremeev, and A. Palczewski for providing some of the cavities used for this study and the SRF Cavity Production Group at Jefferson Lab for helping with some of the cavity preparation and cool-down.
Conflict of interest
The authors declare that the research was conducted in the absence of any commercial or financial relationships that could be construed as a potential conflict of interest.
Publisher’s note
All claims expressed in this article are solely those of the authors and do not necessarily represent those of their affiliated organizations, or those of the publisher, the editors and the reviewers. Any product that may be evaluated in this article, or claim that may be made by its manufacturer, is not guaranteed or endorsed by the publisher.
Supplementary material
The Supplementary Material for this article can be found online at: https://www.frontiersin.org/articles/10.3389/femat.2024.1339293/full#supplementary-material
References
Antoine, C. (2012). Materials and surface aspects in the development of SRF Niobium cavities. EuCARD Editor. Ser. Accel. Sci. Technol. 12. EuCARD-BOO-2012-001
Aune, B., Bandelmann, R., Bloess, D., Bonin, B., Bosotti, A., Champion, M., et al. (2000). Superconducting TESLA cavities. Phys. Rev. St. Accel. Beams 3, 092001. doi:10.1103/physrevstab.3.092001
Barkov, F., Romanenko, A., Trenikhina, Y., and Grassellino, A. (2013). Precipitation of hydrides in high purity niobium after different treatments. J. Appl. Phys. 114, 164904. doi:10.1063/1.4826901
Batchelor, A. D., Leonard, D. N., Russell, P. E., Stevie, F. A., Griffis, D. P., and Myneni, G. R. (2007). TEM and SIMS analysis of (100), (110), and (111) single crystal niobium. AIP Conf. Proc. 927, 72. doi:10.1063/1.2770680
Billen, J. H., and Young, L. M. (1996). Poisson SUPERFISH, tech. Rep. LA-UR-96-1834. Los Alamos, NM, United States: Los Alamos National Laboratory. revised February 6, 2003.
Bonin, B., and Röth, R. W. (1992). “Q-degradation of niobium cavities due to hydrogen contamination,” in Proceedings of the 5th workshop on RF superconductivity, hamburg, Germany, 1991. Editor D. Proch (Hamburg, Germany: DESY), 210–244.
Charrier, J. P., Coadou, B., and Visentin, B. (2019). “Improvements of superconducting cavity performances at high accelerating gradients,” in Proc. EPAC’98 (Geneva, Switzerland: JACoW Publishing), 1185–1887.
Ciovati, G. (2004). Effect of low-temperature baking on the radio-frequency properties of niobium superconducting cavities for particle accelerators. J. Appl. Phys. 96, 1591–1600. doi:10.1063/1.1767295
Ciovati, G. (2005). Investigation of the superconducting properties of niobium radio-frequency cavities (United States: Old Dominion University). Ph.D. thesis.
Ciovati, G. (2006a). “Review of the frontier workshop and Q-slope results, Physica C: superconductivity,” in proceedings of the 12th International Workshop on RF Superconductivity 441, Ithaca, NY, USA, 10 - 15 July 2005, 44.
Ciovati, G. (2006b). Improved oxygen diffusion model to explain the effect of low-temperature baking on high field losses in niobium superconducting cavities. Appl. Phys. Lett. 89, 022507. doi:10.1063/1.2220059
Ciovati, G., Eremeev, G., and Hannon, F. (2018). High field q slope and the effect of low-temperature baking at 3 ghz. Phys. Rev. Accel. Beams 21, 012002. doi:10.1103/physrevaccelbeams.21.012002
Ciovati, G., and Gurevich, A. (2008). Evidence of high-field radio-frequency hot spots due to trapped vortices in niobium cavities. Phys. Rev. St. Accel. Beams 11, 122001. doi:10.1103/physrevstab.11.122001
Ciovati, G., and Kneisel, P. (2006). Measurement of the high-field Q drop in the TM010 and TE011 modes in a niobium cavity. Phys. Rev. St. Accel. Beams 9, 042001. doi:10.1103/physrevstab.9.042001
Ciovati, G., Kneisel, P., and Gurevich, A. (2007). Measurement of the high-field Q drop in a high-purity large-grain niobium cavity for different oxidation processes. Phys. Rev. St. Accel. Beams 10, 062002. doi:10.1103/physrevstab.10.062002
Ciovati, G., Myneni, G., Stevie, F., Maheshwari, P., and Griffis, D. (2010). High field Q slope and the baking effect: review of recent experimental results and new data on Nb heat treatments. Phys. Rev. St. Accel. Beams 13, 022002. doi:10.1103/physrevstab.13.022002
Ciovati, G., and Turlington, L. (2019). “A simple variable coupler for the cryogenic test of SRF cavities,” in Proc. SRF’19 (Geneva, Switzerland: JACoW Publishing), 282–284.
Dhakal, P., Ciovati, G., and Gurevich, A. (2020). Flux expulsion in niobium superconducting radio-frequency cavities of different purity and essential contributions to the flux sensitivity. Phys. Rev. Accel. Beams 23, 023102. doi:10.1103/physrevaccelbeams.23.023102
Eremeev, G., Padamsee, H., Liepe, M., and Roy, R. (2013). “Effect of mild baking on high field Q-drop of BCP cavity,” in Proc. SRF’03 (Geneva, Switzerland: JACoW Publishing), 70–73.
Eremeev, G., and Palczewski, A. D. (2014). Characterization of superconducting radiofrequency breakdown by two-mode excitation. J. Appl. Phys. 115, 023901. doi:10.1063/1.4861396
Eremeev, G. V., and Padamsee, H. (2006). “A comparison of large grain and fine grain cavities using thermometry,” in Proc. EPAC’06 (Geneva, Switzerland: JACoW Publishing), 475–477.
Fauchére, A. L., and Blatter, G. (1997). Magnetic breakdown in a normal-metal–superconductor proximity sandwich. Phys. Rev. B 56, 14102–14107. doi:10.1103/physrevb.56.14102
Geng, R. L., Dai, J., Eremeev, G. V., and Palczewski, A. D. (2011). “Progress of ILC high gradient SRF cavity R&D at Jefferson Lab,” in Proc. IPAC’11 (Geneva, Switzerland: JACoW Publishing), 334–336.
Gurevich, A. (2002). Nonlinear dynamics of vortices in easy flow channels along grain boundaries in superconductors. Phys. Rev. B 65, 214531. doi:10.1103/physrevb.65.214531
Gurevich, A. (2012). Superconducting radio-frequency fundamentals for particle accelerators. Rev. Acceler. Sci. Technol. 5, 119–146. doi:10.1142/s1793626812300058
Gurevich, A. (2023). Tuning microwave losses in superconducting resonators. Supercond. Sci. Technol. 36, 063002. doi:10.1088/1361-6668/acc214
Gurevich, A., and Ciovati, G. (2013). Effect of vortex hotspots on the radio-frequency surface resistance of superconductors. Phys. Rev. B 87, 054502. doi:10.1103/physrevb.87.054502
Gurevich, A. V., and Mints, R. (1987). Self heating in normal metals and superconductors. Rev. Mod. Phys. 59, 941–999. doi:10.1103/revmodphys.59.941
Huang, S., Kubo, T., and Geng, R. L. (2016). Dependence of trapped-flux-induced surface resistance of a large-grain nb superconducting radio-frequency cavity on spatial temperature gradient during cooldown through Tc. Phys. Rev. Accel. Beams 19, 082001. doi:10.1103/physrevaccelbeams.19.082001
Kim, Y.-J., Tao, R., Klie, R. F., and Seidman, D. N. (2013). Direct atomic-scale imaging of hydrogen and oxygen interstitials in pure niobium using atom-probe tomography and aberration-corrected scanning transmission electron microscopy. ACS Nano 7, 732–739. doi:10.1021/nn305029b
Kneisel, P., Ciovati, G., Dhakal, P., Saito, K., Singer, W., Singer, X., et al. (2015). Review of ingot niobium as a material for superconducting radiofrequency accelerating cavities. Nucl. Instrum. Methods Phys. Res. Sect. A Accel. Spectrom. Detect. Assoc. Equip. 774, 133–150. doi:10.1016/j.nima.2014.11.083
Knobloch, J. (1997). Advanced thermometry studies of superconducting radio-frequency cavities (United States: Cornell University). Ph.D. thesis.
Knobloch, J. (2003). The “Q disease” in superconducting niobium RF cavities. AIP Conf. Proc. 671, 133. doi:10.1063/1.1597364
Knobloch, J., Muller, H., and Padamsee, H. (1994). Design of a high speed, high resolution thermometry system for 1.5 GHz superconducting radio frequency cavities. Rev. Sci. Instrum. 65, 3521–3527. doi:10.1063/1.1144532
Kubo, T., and Gurevich, A. (2019). Field-dependent nonlinear surface resistance and its optimization by surface nano-structuring in superconductors. Phys. Rev. B 100, 064522. doi:10.1103/physrevb.100.064522
Lechner, E. M., Oli, B. D., Makita, J., Ciovati, G., Gurevich, A., and Iavarone, M. (2020). Electron tunneling and x-ray photoelectron spectroscopy studies of the superconducting properties of nitrogen-doped niobium resonator cavities. Phys. Rev. Appl. 13, 044044. doi:10.1103/physrevapplied.13.044044
Lechner, E. M., Oli, B. D., Makita, J., Ciovati, G., Gurevich, A., and Iavarone, M. (2023). Characterization of dissipative regions of a n-doped superconducting radio-frequency cavity. Front. Electron. Mater. 3. doi:10.3389/femat.2023.1235918
Liarte, D. B., Hall, D., Koufalis, P. N., Miyazaki, A., Senanian, A., Liepe, M., et al. (2018). Vortex dynamics and losses due to pinning: dissipation from trapped magnetic flux in resonant superconducting radio-frequency cavities. Phys. Rev. Appl. 10, 054057. doi:10.1103/physrevapplied.10.054057
Padamsee, H. (2001). The science and technology of superconducting cavities for accelerators. Supercond. Sci. Technol. 14, R28–R51. doi:10.1088/0953-2048/14/4/202
Padamsee, H. (2009). “Residual losses from trapped dc magnetic flux,” in RF superconductivity: Science, technology, and applications (Weinheim, Germany: WILEY-VCH Verlag), 69–70.
Padamsee, H., Proch, D., Kneisel, P., and Mioduszewski, J. (1981). Field strength limitations in superconducting cavities-multipacting and thermal breakdown. IEEE Trans. Magnetics 17, 947–950. doi:10.1109/tmag.1981.1061065
Parajuli, I. (2022). Characterization of losses in superconducting radio-frequency cavities by combined temperature and magnetic field mapping (United States: Old Dominion University). Ph.D. thesis.
Parajuli, I., Ciovati, G., and Delayen, J. R. (2022). High resolution diagnostic tools for superconducting radio frequency cavities. Rev. Sci. Instrum. 93, 113305. doi:10.1063/5.0117868
Parajuli, I. P., Ciovati, G., and Delayen, J. R. (2021). Magnetic field sensors for detection of trapped flux in superconducting radio frequency cavities. Rev. Sci. Instrum. 92, 104705. doi:10.1063/5.0063177
Pathirana, W. P. M. R., and Gurevich, A. (2020). Nonlinear dynamics and dissipation of a curvilinear vortex driven by a strong time-dependent meissner current. Phys. Rev. B 101, 064504. doi:10.1103/physrevb.101.064504
Pathirana, W. P. M. R., and Gurevich, A. (2021). Effect of random pinning on nonlinear dynamics and dissipation of a vortex driven by a strong microwave current. Phys. Rev. B 103, 184518. doi:10.1103/physrevb.103.184518
Posen, S., Checchin, M., Crawford, A., Grassellino, A., Martinello, M., Melnychuk, O., et al. (2016). Efficient expulsion of magnetic flux in superconducting radiofrequency cavities for high Q0 applications. J. Appl. Phys. 119, 213903. doi:10.1063/1.4953087
Posen, S., Cravatta, A., Checchin, M., Aderhold, S., Adolphsen, C., Arkan, T., et al. (2022). High gradient performance and quench behavior of a verification cryomodule for a high energy continuous wave linear accelerator. Phys. Rev. Accel. Beams 25, 042001. doi:10.1103/physrevaccelbeams.25.042001
Reece, C., Almeida, B., Powers, T., and Susta, J. (1991). “A closed cycle cryogenic system for testing superconducting RF cavities,” in Proc. PAC’91 (Geneva, Switzerland: JACoW Publishing), 2325–2328.
Romanenko, A., Barkov, F., Cooley, L. D., and Grassellino, A. (2013a). Proximity breakdown of hydrides in superconducting niobium cavities. Supercond. Sci. Technol. 26, 035003. doi:10.1088/0953-2048/26/3/035003
Romanenko, A., Grassellino, A., Barkov, F., and Ozelis, J. P. (2013b). Effect of mild baking on superconducting niobium cavities investigated by sequential nanoremoval. Phys. Rev. St. Accel. Beams 16, 012001. doi:10.1103/physrevstab.16.012001
Romanenko, A., Grassellino, A., Crawford, A., Sergatskov, D., and Melnychuk, O. (2014). Ultra-high quality factors in superconducting niobium cavities in ambient magnetic fields up to 190 mg. Appl. Phys. Lett. 105, 234103. doi:10.1063/1.4903808
Romijn, R., Weingarten, W., and Piel, H. (1983). Calibration of the scanning thermometer resistor system for a superconducting accelerating cavity. IEEE Trans. Magn. 19, 1318–1321. doi:10.1109/tmag.1983.1062425
Sheikhzada, A., and Gurevich, A. (2017). Dynamic transition of vortices into phase slips and generation of vortex-antivortex pairs in thin film josephson junctions under dc and ac currents. Phys. Rev. B 95, 214507. doi:10.1103/physrevb.95.214507
Shu, Q. S., Möller, W.-D., Pekeler, M., Proch, D., Junquera, T., and Fouaidy, M. (1996). “Experimental investigation of quenches in superfluid He of TESLA 9-cell superconducting cavities,” in Proc. SRF’95 (Geneva, Switzerland: JACoW Publishing), 431–435.
Sun, Z., Baraissov, Z., Dukes, C. A., Dare, D. K., Oseroff, T., Thompson, M. O., et al. (2023). Surface oxides, carbides, and impurities on rf superconducting Nb and Nb3Sn: a comprehensive analysis. Supercond. Sci. Technol. 36, 115030. doi:10.1088/1361-6668/acff23
Sung, Z. H., Cano, A., Murthy, A., Karapetrova, E., Lee, J., Martinello, M., et al. (2023). First direct observation of nanometer size hydride precipitations on superconducting niobium. arXiv:2305.01022 [cond-mat.mtrl-sci] Available at: https://arxiv.org/abs/2305.01022.
Sung, Z.-H., Lee, P. J., and Larbalestier, D. C. (2014). Observation of the microstructure of grain boundary oxides in superconducting rf-quality niobium with high-resolution TEM (transmission electron microscope). IEEE Trans. Appl. Supercond. 24, 68–73. doi:10.1109/tasc.2013.2287050
Sung, Z. H., Wang, M., Polyanskii, A. A., Santosh, C., Balachandran, S., Compton, C., et al. (2017). Development of low angle grain boundaries in lightly deformed superconducting niobium and their influence on hydride distribution and flux perturbation. J. Appl. Phys. 121. doi:10.1063/1.4983512
Tao, R., Todorovic, R., Liu, J., Meyer, R. J., Arnold, A., Walkosz, W., et al. (2011). Electron energy-loss spectroscopy study of metallic Nb and Nb oxides. J. Appl. Phys. 110, 124313. doi:10.1063/1.3665193
Trenikhina, Y., Romanenko, A., Kwon, J., Zuo, J.-M., and Zasadzinski, J. F. (2015). Nanostructural features degrading the performance of superconducting radio frequency niobium cavities revealed by transmission electron microscopy and electron energy loss spectroscopy. J. Appl. Phys. 117, 154507. doi:10.1063/1.4918272
Visentin, B. (2003). “Q-slope at high gradients: review of experiments and theories,” in Proc. SRF’03 (Geneva, Switzerland: JACoW Publishing), 199–205.
Visentin, B. (2006). “Review on Q-drop mechanisms,” in International Workshop on Thin Films and New Ideas for Pushing the Limits of RF Superconductivity, Legnaro, Padua, Italy, 9-12 October 2006.
Visentin, B., Charrier, J. P., Coadou, B., and Roudier, D. (1999). “Cavity baking: a cure for the high accelerator field Q0 drop,” in Proc. SRF’99 (Geneva, Switzerland: JACoW Publishing), 198–202.
Vogt, J.-M., Kugeler, O., and Knobloch, J. (2013). Impact of cool-down conditions at Tc on the superconducting rf cavity quality factor. Phys. Rev. Special Topics-Accelerators Beams 16, 102002. doi:10.1103/physrevstab.16.102002
Weingarten, W. (2011). Field-dependent surface resistance for superconducting niobium accelerating cavities. Phys. Rev. St. Accel. Beams 14, 101002. doi:10.1103/physrevstab.14.101002
Welter, J. -M., and Johnen, F. J. (1977). Superconducting transition temperature and low temperature resistivity in the niobium-hydrogen system. Z. für Phys. B Condens. Matter 27, 227–232. doi:10.1007/bf01325532
Wenskat, M., Čiẑek, J., Liedke, M. O., Butterling, M., Bate, C., Haušild, P., et al. (2020). Vacancy-hydrogen interaction in niobium during low-temperature baking. Sci. Rep. 10, 8300. doi:10.1038/s41598-020-65083-0
Keywords: radiofrequency, niobium, superconducting RF cavities, particle accelerators, surface resistance (Rs), nonlinear rf losses
Citation: Parajuli I, Ciovati G and Gurevich A (2024) Magneto-thermal limitations in superconducting cavities at high radio-frequency fields. Front. Electron. Mater. 4:1339293. doi: 10.3389/femat.2024.1339293
Received: 15 November 2023; Accepted: 20 February 2024;
Published: 08 March 2024.
Edited by:
Tsuyoshi Tajima, Los Alamos National Laboratory (DOE), United StatesReviewed by:
Claire Antoine, Université Paris-Saclay, FranceFang Yuan, Princeton University, United States
Mohammed Fouaidy, UMR9012 Laboratoire de Physique des 2 Infinis Irène Joliot-Curie (IJCLab), France
Copyright © 2024 Parajuli, Ciovati and Gurevich. This is an open-access article distributed under the terms of the Creative Commons Attribution License (CC BY). The use, distribution or reproduction in other forums is permitted, provided the original author(s) and the copyright owner(s) are credited and that the original publication in this journal is cited, in accordance with accepted academic practice. No use, distribution or reproduction is permitted which does not comply with these terms.
*Correspondence: G. Ciovati, Z2Npb3ZhdGlAamxhYi5vcmc=