 Quentin Weinbach1
 Swapneel Vijay Thakkar1
 Alain Carvalho1Gérald Chaplais2Jérôme Combet1Doru Constantin1
 Nicolas Stein3Dominique Collin1
 Laure Biniek1*
- 1Université de Strasbourg, CNRS, Institut Charles Sadron UPR22, Strasbourg, France
- 2Université de Haute-Alsace, Université de Strasbourg, CNRS, Institut de Science des Matériaux de Mulhouse (IS2M), Mulhouse, France
- 3Université de Lorraine, CNRS, IJL, Metz, France
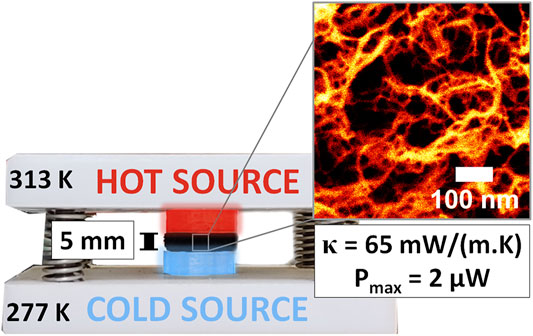
In this study, we describe a reproducible process route to form highly mesoporous, mechanically robust and handleable aerogels based on entangled PEDOT:PSS nanofibers. The conservation of the alcogel 3D network is ensured via thorough control of the solvent exchange and drying steps. Particular consideration has been given to metrology, allowing us to fully characterize the thermoelectric properties of the aerogels. The interconnected fibrillar morphology provides good electrical conductivity and mechanical properties by forming effective pathways for both electron transfer and sustaining mechanical forces. The Seebeck coefficient does not seem to be impacted by the high porosity of the material. Finally, the positive impact of mesoporosity on thermal transport and in particular on the lattice part of the thermal conductivity (klat) is demonstrated here for the first time. Thus, this pure PEDOT:PSS aerogel exhibits very interesting structural and charge transport properties. The high power output of 2 µW, measured for a temperature gradient of 36.5 K on a single aerogel sample, highlights the possibility of integrating PEDOT:PSS aerogels into thermoelectric generators.
GRAPHICAL ABSTRACT
Introduction
Thermoelectric (TE) materials convert heat into electricity via the Seebeck effect. Utilizing these materials to produce energy from waste heat can be an interesting strategy in achieving “Net-zero” emissions. (Finn et al., 2021). The efficiency of TE materials is evaluated by the dimensionless figure of merit (zT) using the equation; zT = σS2T/κ, where σ, S, T, κ represent the electrical conductivity (S.m−1), the Seebeck coefficient (V.K−1), the temperature (K), and the thermal conductivity (W.m−1. K−1), respectively. A promising choice of material for TE applications is based on the “phonon-glass electron-crystal” (PGEC) concept, i.e. where the thermal properties are similar to glass-like materials while the electrical properties are closer to those of crystalline materials. (Slack, 1995). Organic thermoelectric materials, such as doped conjugated polymers, are good candidates to achieve such properties. Indeed, their charge transport properties can be tuned by increasing the crystallinity and structural anisotropy to achieve metal-like conductivities. (Vijayakumar et al., 2019). In parallel, phonon engineering via porosity can be used to reduce the thermal conductivity. (Weinbach et al., 2021). In particular, designing the pore sizes below the mean free path of air molecules (≈70 nm) lowers the contribution of gas molecules to the thermal transport, while decreasing material density assists in reducing the solid material contribution to the thermal conductivity. (Tang et al., 2015; Noroozi et al., 2019). In this direction, fabricating conducting materials in the form of an aerogel (light and mesoporous material) should lead to better control on phonon engineering, which is of interest for TE application.
Aerogels are low-density bulk solids with open pores and are formed due to the interconnection of nanostructures. In general, they are fabricated from wet gels where the liquid component is replaced by air without deteriorating the porous network. (Hüsing and Schubert, 1998). This substitution is usually achieved under supercritical conditions, during which the surface tension of the supercritical fluid is negligible. Drying at this condition prevents the collapse of the pores, thereby giving the final solid a structure similar to its native gel state. (Woignier et al., 2018). Fabricating aerogels using conducting polymers offers technological advantages such as large-scale processability of a few mm thick and very low-density solids that can be utilized to develop vertical TEG.
Conducting polymers, such as poly (3,4-ethylenedioxythiophene):poly (styrene sulfonate) (PEDOT:PSS), are of huge interest in the field of TE application due to their environmental stability, ease in doping, and commercial processability at large scales. These materials have demonstrated state-of-the-art TE performance when fabricated as films. (Bubnova et al., 2011; Kim et al., 2013). Hence, they are excellent candidates to evaluate in the form of aerogels for developing the next generation of lightweight TE devices. To date, there are very few reports on pure porous PEDOT:PPS materials for TE applications and their fabrication methods vary by a large degree. For instance, Wang et al reported the fabrication of porous PEDOT:PSS by lyophilization (freezing followed by sublimation of the ice) of the commercial polymer dispersion. (Wang et al., 2019). This approach provides lightweight films after pressing the porous samples but the porosity is not defined clearly. However, interesting TE properties (power factor = 1.24 μW m−1. K−2; κ = 0.1 W m−1. K−1) are achieved via addition of polar solvent in the dispersion prior to freezing. In another report, Gordon et al developed hydrogels by rehydrating PEDOT:PSS films followed by lyophilization to remove the solvent. (Gordon et al., 2017). Here, the lyophilization highly affects the porous structure of the final product (Deville, 2017) forming macropores (50–200 μm) with no preferential orientation. After post-treatment in ethylene glycol, a power factor of 6.4 μW m−1K−2 was obtained on such structures (it should be emphasized that no study of the effect of porosity on thermal conductivity has been conducted). Alternatively, when PEDOT:PSS gels (prepared by dropping the dispersion in ethanol) are dried in ambient conditions, dense thick films with no porosity were obtained. (Maeda et al., 2019). Nevertheless, the films displayed a high power factor of 28 μW m−1K−2 indicating that gelation enhanced the PEDOT:PSS microstructure. In general, drying the gels by lyophilization or ambient drying techniques does not offer good control over micro/meso-porosity. In contrast, drying PEDOT:PSS alcogels (formed via the oxidative polymerization of EDOT in presence of PSS) under supercritical conditions provides highly mesoporous samples. (Zhang et al., 2010). Unfortunately, the in-situ polymerization of PEDOT led to low electrical conductivity (0.1 S cm−1) when compared with the samples fabricated from the commercial dispersion. Overall, controlling both the gelation of PEDOT:PSS and the drying step under supercritical conditions are the keys to maintaining sufficient charge transport properties in a well-controlled mesoporous structure.
Herein, we developed a simple and reproducible technique to prepare mechanically robust PEDOT:PSS aerogels a few mm thick using a two-step synthesis process. The fiber-like network is created during the gelation and conserved after drying. Solvent exchanges during the gelation but also during supercritical drying are the key steps to guarantee good control over the 3D network and the porous structure. We report on the full characterization of the TE properties, including measurement of effective thermal conductivity and demonstrate the effect of porosity on the lattice part of the thermal conductivity (κlat). Altogether, the aerogels developed in this work exhibit superior TE performance as compared with other PEDOT:PSS porous systems, without any additional processing treatment (such as secondary doping or the use of crosslinker). Finally the potential use of the PEDOT:PSS aerogels in a TE generator is discussed.
Experimental Section
Materials
All materials were obtained from commercial suppliers and used as received, unless otherwise stated. PEDOT:PSS (Clevios™ PH1000, 1.0-1.2 wt%) was purchased from Heraeus, absolute ethanol (EtOH) from Carlo ERBA, silver paste from Agar Scientific (AGG3691), liquid CO2 and liquid ethane from Air Liquide.
Alcogel Fabrication
The fabrication of the gel (called herein alcogel at it is processed in ethanol) is illustrated in Figure 1.
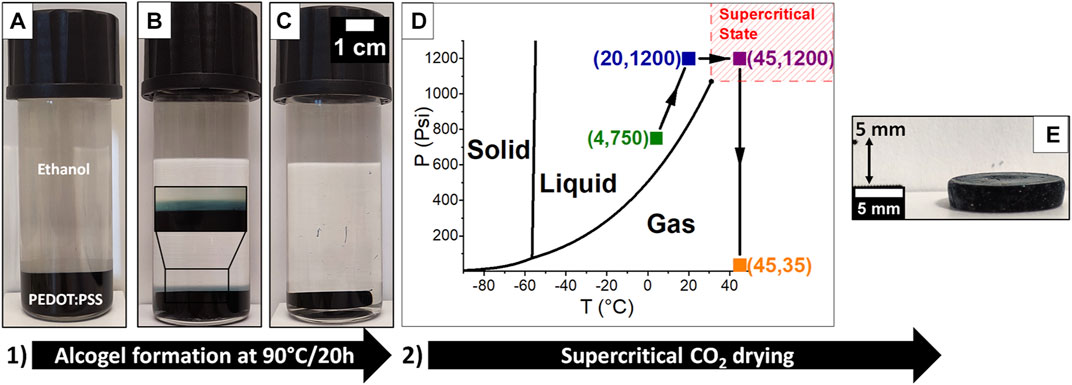
FIGURE 1. Two-step PEDOT:PSS aerogel formation process. (A-C) Photographs were taken during the gelation process at different times: a) t = 0, PEDOT:PSS is deposited at the bottom of ethanol, b) t = 10 h, interaction between ethanol and PEDOT:PSS is visible at the interface of the two phases, c) t = 20 h, the alcogel is formed. (D-E) Supercritical drying process: d) schematic of supercritical drying steps in the (P,T) CO2 diagram; in green: initial temperature and pressure in the closed autoclave containing the alcogel sample, in blue: ethanol-CO2Liquid exchange, in purple: supercritical state of CO2 and dynamic drying, in orange: venting step, e) Resulting PEDOT:PSS aerogel.
The PEDOT:PSS polymer blend (PH1000) is received as a dispersion of nanoparticles with mean diameter of 30 nm at a weight percentage of 1.08% in water (measured on the dried dispersion). The PEDOT:PSS ratio is 1:2.5 in mass. PSS is in excess to facilitate the dispersibility of the blend in water. Based on the work of Maeda et al. (Maeda et al., 2019, 2020), the alcogels were formed by slow diffusion of ethanol (EtOH) into the PEDOT:PSS. Typically, the PH1000 dispersion was vortexed for a few minutes and then filtered through a 0.45 µm PVDF membrane to ensure homogeneous dispersion prior to use. Next, 41.5 ml of ethanol were introduced in a flat bottom Pyrex tube with an SVL screwcap. Then 5 ml of the filtered PEDOT:PSS dispersion were slowly deposited at the bottom of the vial with a syringe. Then, the mixture was immediately placed in a 90 °C oil bath for 20 h. The alcogel, while forming, took the shape of the mold (in this case, a flat bottom cylindrical tube of 22 mm inner diameter gave rise to a gel in the shape of a disc of ∼17 mm diameter). The resulting sample was shrunk and floated in a transparent supernatant suggesting expulsion of liquid from the gel, also known as the syneresis effect. The supernatant was removed after gelation and the gel was washed twice with 50 ml of fresh ethanol.
Aerogel Formation via Supercritical CO2 Drying
Prior to drying, the upper surface of the sample was cut off (∼0.5 mm thickness removal) with a razor blade to obtain a flat surface. The alcogel was loaded with a splash of EtOH into a 100 ml capacity autoclave (manufactured by SFT-110 supercritical fluid extractor) which was then sealed. The CO2 pressure-temperature diagram is shown in Figure 1D. To ensure that CO2 is first in the liquid phase (4°C, 750 psi in the bottle), the temperature in the autoclave was maintained at 20°C and the pressure raised to 1,200 psi. The alcogel in the autoclave was stored in liquid CO2 for 30 min and then the liquid CO2 inside the autoclave was half-drained and flushed in with a fresh one. This solvent exchange was repeated five times in 30-min intervals to completely replace EtOH with liquid CO2 in the alcogel. After the solvent exchange was complete, the autoclave at 1,200 psi was heated up to 45°C for 2 h, to induce the transition of the CO2 from the liquid to the supercritical phase. Then, the outlet valve was slightly opened to create a dynamic flow inside the autoclave, allowing supercritical CO2 to flow through the gel. The sample was kept under these conditions (45°C and 1,200 psi) for 1 h, followed by a slow release of the pressure while keeping the temperature constant. After complete venting (approx. 30 min), the sample was transferred to a vial and degassed for a few minutes, after which the vacuum was switched to argon atmosphere for storage.
The dimensions and weight of alcogels and aerogels are measured respectively with an OTMT digital caliper and an analytical microbalance. Typically, aerogels are at least 3.5 mm thick and 1.3 cm in diameter. A consequent shrinkage from the gel to the aerogel state was observed (∼40% volume loss). The apparent aerogel density is very low (ρaerogel = 0.070 ± 0.007 g cm−3, estimated by its mass and dimensional size) and its very high porosity Θ (∼93%) is estimated with the following equation:
where
Characterization Methods
Scanning Electron Microscopy
Cryo-SEM on alcogels
As ethanol is difficult to sublimate, a gradual solvent exchange with deionized water was applied in the gel phase, prior to cryo-SEM analysis. The exchange was done in several incremental steps to minimize shrinkage and gel structure distortion. Typically, the alcogel (100%vol ethanol) was left for 24 h in different ethanol/water (%vol) solutions (75/25, 50/50, 25/75, and finally in 100% water). Once the solvent in the gel was pure water, a small piece of gel was sliced off with a razor blade, quickly dipped into liquid ethane (used as an efficient coolant to avoid crystalline ice formation (Dubochet et al., 1988; Efthymiou et al., 2017)) and then transferred under high vacuum (10–6 mbar) and low temperature (-150 °C) into the Quorum PT 3010 chamber attached to the microscope. There, the frozen sample was fractured with an adapted razor blade. After a slight sublimation of water at −90°C to reveal the details of the morphology, the sample was eventually transferred in the FEG-cryo-SEM (Hitachi SU8010) and observed at 1 kV at −150°C (under 10–6 mbar).
SEM on Aerogels
The aerogels were cut with a razor blade to reveal the surface of interest. The samples were observed at 1 kV at room temperature with the FEG-cryo-SEM (Hitachi SU8010). A high magnification image of the aerogel is also shown in Supplementary Figure S1.
X-Ray Scattering
SAXS and WAXS (small- and wide-angle X-ray scattering) measurements were performed on the SWING beamline of the SOLEIL synchrotron (Saint-Aubin, France) at a beam energy of E = 16 keV. The sample-to-detector distance was 6.22 and 0.52 m, respectively, covering a total scattering vector range of 0.0016 < q < 2.5 Å−1. The beam size was approximately 500 × 200 μm2 (H × V). All measurements were performed at room temperature (22°C).
The scattered signal was recorded by an Eiger 4 M detector (Dectris Ltd., Switzerland) with pixel size 75 μm. Preliminary data treatment (angular averaging and normalization) was done using the software Foxtrot developed at the beamline, which yielded the intensity as a function of the scattering vector I(q) in absolute units. Subsequent data modeling was done in Igor Pro 7.0 using functions available in the NCNR SANS package (Kline, 2006) (Cylinder PolyRadius, used to model the SAXS data in Figure 2C, and Lorentzian, used to fit the WAXS peak in Figure 2D).
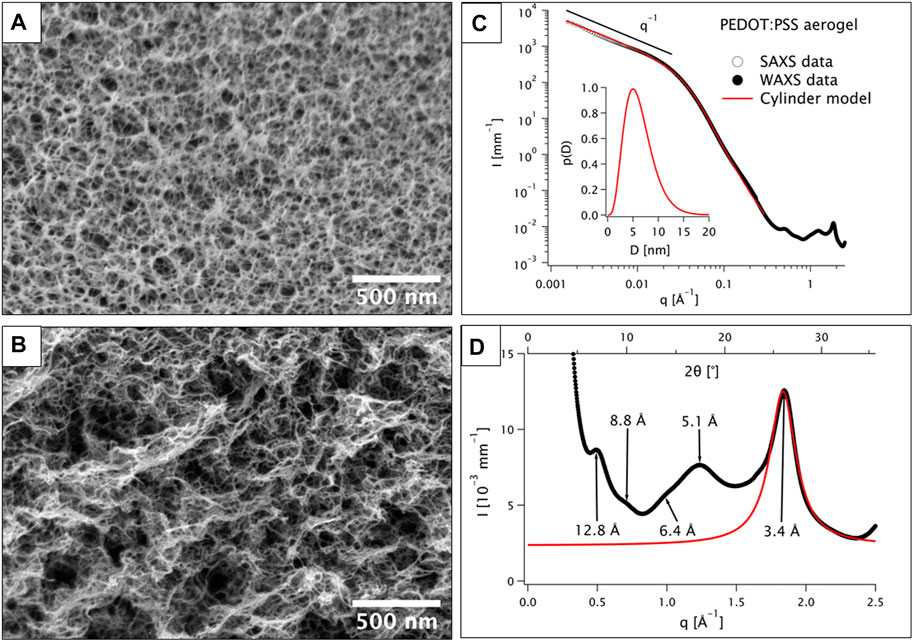
FIGURE 2. (A) Cryo-SEM image of the alcogel, (B) SEM image of the aerogel, (C) Scattered intensity as a function of the scattering vector, I(q), for the SAXS and WAXS configurations (open and solid dots, respectively) and fit with a cylinder model (the diameter polydispersity is described by a Schulz distribution p(D), displayed in the inset). The low-q power law
Nitrogen Physisorption
Textural characterization was done using a Micromeritics ASAP 2420 apparatus by determining nitrogen physisorption isotherms at 77 K. Here, the aerogel samples were cut into small pieces and loaded into an analysis tube. Prior to adsorption measurements the sample was outgassed at 423 K for 6 h under vacuum to remove the moisture from the aerogel. The specific surface area (SBET) was calculated according to the criteria given in the literature (Rouquerol et al., 2007; Walton and Snurr, 2007) and by using the Brunauer−Emmett−Teller (BET) method applied in the 0.02 ≤ p/p0 ≤ 0.20 ranges.
Rheology
Complex shear modulus measurements were performed with a stress-imposed rheometer (Mars III, Haake) working in oscillatory mode. For alcogel and aerogel samples, the parallel plate geometry fixtures (with different diameters) were used to cover the sample area. In the case of alcogels, the bottom plate was modified to allow the sample to be immersed in ethanol (to avoid drying during measurement). To ensure measurements in the linear response domain, the stress applied did not exceed 5 Pa. All measurements were performed at 20°C. The fixtures were adjusted according to the height of the sample without causing an excessive compression of the sample. (Collin et al., 2004). Normal force was measured simultaneously during the shear experiments.
Electrical Conductivity and Seebeck Coefficient
A Keithley 2634B sourcemeter and a Lab Assistant Semiprobe station inside of a Jacomex glovebox under N2 atmosphere (≈1 ppm O2, ≈ 1 ppm H2O) were used to measure the electrical conductivity and the Seebeck coefficient of all samples.
Electrical conductivity: The electrical resistance was measured using a standard collinear four-probe method with a probe space of 1.6 mm. The electrical resistivity and conductivity were calculated with the following equation extracted from Haldor Topsøe’s geometrical factor report. (Topsøe, 1968).
where
The experiment was performed on eight aerogels and the measurements were repeated four times on each sample.
Seebeck coefficient: To measure the Seebeck coefficient, a differential temperature method was used. A homemade setup made of one heating and one cooling Peltier cells allows an in-plane controllable temperature gradient. Measurements were performed by increasing gradually the temperature difference between the two Peltier cells up to 12.8 K (starting from 293 K, the midpoint temperature). For each temperature step, the tension was measured five times with a 20 s interval (see previous report (Hamidi-Sakr et al., 2017) for a description of the setup). To allow good thermal contact between the Peltier cells and the aerogels, copper legs (1 × 1 × 0.2 mm) were bonded on the bottom of the sample with conducting silver paste (see schematic Figure 4C). The tension was measured directly on the silver paste. Calibration of the measurement was made with a constantan wire (see supporting information for the calibration, Supplementary Figure S4). (Bentley, 1998) The experiment was performed on six aerogels.
Cross-plane measurements: Cross plane Seebeck coefficients and output power were measured with a homemade setup, where the samples were sandwiched between hot and cold copper disks of 1 cm diameter.(Frantz et al., 2010; Danine et al., 2018). The applied pressure to the samples was below 0.3 Nm (through the use of a torque screwdriver). Using Peltier modules as heating-cooling sources and embedded thermocouples inside each copper disk, a temperature gradient was then imposed and measured across the two sides of the samples. An external cooling flow system, with the help of a cryostat, was used to keep the thermal gradient across the sample thickness. The operating temperature was defined as 293 K, whereas the maximal thermal gradient was fixed to 7 K. The system allows measuring the potential difference ΔU and the temperature difference ΔT, giving the Seebeck coefficient α from the slope ΔU/ΔT of the voltage-temperature curve. Considering the sample as a thermoelectric generator, the output power was determined as a function of an adjustable external load circuit. When the output power is at its maximum, the load resistance is then equal to the internal resistance of the sample.
Thermal Conductivity
The thermal conductivity of the aerogels was measured using the transient plane source (TPS) technique by utilizing a commercial apparatus (Hot Disk®, TPS 1000). Here, the sensor of radius 3.189 mm (composed of a Nickel double spiral protected with a thin layer of Kapton insulator) was sandwiched between two PEDOT:PSS aerogels, as illustrated in Figure 4E. Only samples with appropriate dimensions in regards to the sensor radius can be considered to satisfy the heat conductivity equation in a thermally infinite medium. The distance from the sensor edge to the nearest free boundary of the sample should be at least equal to the sensor radius (i.e. with this sensor, only samples of minimum 12.8 mm in diameter and 3.2 mm in thickness can be treated).
The setup was placed under a metallic bell to avoid any temperature fluctuations arising from air currents. Before each measurement, the sample was degassed for 30 min to remove the adsorbed moisture from the aerogels and stabilized at room temperature for 10 min to avoid temperature drift of the sample. The thermal equilibrium of the sample was also checked for 40 s before each measurement. The room temperature (in general 19–21 °C) was recorded using a thermocouple, and the value was incorporated in the software prior to launching the measurement.
During the measurement, an electrical current of known power and duration is passed through the sensor which also records the increase in temperature of the sensor as a function of time. The temperature increase (
where R is the total electrical resistance at time t, R0 is the initial resistance at t = 0, α = 6.41 x 10⁻³ 1/°C is the temperature coefficient of resistivity of nickel. Therefore Eq. (4) allows us to accurately determine
With P0, the total output of power from the sensor during the transient, r, the radius of the largest ring of the sensor, D(τ) a complex dimensionless time dependent function (with
The output power and duration time required for a reliable measurement depends strongly on the characteristics of the sample. We first used the reported conditions for polyurethane foams (a thermally isolating lightweight sample with a known κ = 0.042 W m−1. K−1) measurements and then a trial-and-error approach to reach the best conditions to be within the limits of total characteristic time (between 0.33 and 1), (Bohac et al., 2000), temperature increase (2 < ΔT < 5 K) and penetration depth (larger than
Results
PEDOT:PSS Aerogel Fabrication
The fabrication of PEDOT:PSS aerogels involved two fundamental steps: 1) gelation step, followed by 2) drying of gels under supercritical conditions.
To ensure the formation of a robust 3D network, a PEDOT:PSS gel was formed prior to drying. Different ways are described in the literature to produce PEDOT:PSS gels: herein, we followed the work of Maeda and co-workers. (Maeda et al., 2019, 2020). Typically, the PEDOT:PSS aqueous dispersion is poured at the bottom of a vial filled with ethanol. Due to the density difference between the two liquids, the dispersion remains at the bottom of the vial (as shown in Figure 1A). Upon time and at high temperature, ethanol diffuses slowly into the PEDOT:PSS dispersion. A bluish layer appears at the interface of the two phases (Figure 1B) which highlights the solvent exchange process. After 20 h, a solid and dark blue alcogel floating in a transparent solution is obtained and the supernatant is replaced with fresh ethanol (Figure 1C). This gelation process results in a handleable alcogel whose size and shape can be tuned by using a different mold or cutting it accordingly.
The gelation mechanism is still under investigation. Maeda et al. suggested that excess PSS was removed upon the interaction of the dispersion with ethanol, forming gradually a gel state from the surface to the interior. (Maeda et al., 2019). Our investigation using cryo-SEM (discussed below), shows that the initial micelle-like structure of PEDOT:PSS dispersion (as usually described in the literature) converts into the fibrillar structure during this gelation mechanism.
Next, the PEDOT:PSS alcogels were subjected to supercritical drying, providing aerogels. The conditions of this drying are critical to minimize shrinkage and possible gel distortion. Since the gel produced after the synthesis contained EtOH in its pores, the solvent was first replaced with liquid CO2 to facilitate the supercritical drying at mild conditions. The replacement was achieved by a solvent exchange process in the autoclave, during which the concentration of EtOH in the pores decreases due to its miscibility with liquid CO2 and the diffusion of liquid CO2 in the gel under high-pressure conditions (Figure 1D, in blue). After the solvent exchange was completed, the autoclave was heated until the conditions reached beyond the supercritical point of the liquid CO2 (31°C, 1,070 psi, see Figure 1D, in purple). During the heating, the surface energy associated with the liquid-gas interface diminishes, which results in the transformation of the liquid CO2 present in the pores to a supercritical fluid. The capillary forces acting on the network are null, and extracting the fluid from the sample in this condition results in the conservation of the network structure. Therefore, venting (Figure 1D, purple) the autoclave at this condition prevents the collapse of the gel. The resulting aerogel monolith (Figure 1E) is crack-free and retained the same features of the alcogel. However, in our case it suffered from a 40%vol shrinkage which might be attributed to the interaction of the alcogel with liquid CO2 during the solvent exchange process, as this behavior is also seen for PEDOT:PSS gels when immersed in other solvents. Despite optimizing the solvent exchange process, the shrinkage could not be avoided. Nevertheless, the final sample size is still large enough (thickness: 3.5 mm, diameter: 13 mm) to allow the accurate mechanical and thermoelectric characterizations. The aerogels exhibit ultra-low density of 0.07 g cm−3 with porosity of 93%.
Morphology of the Mesoporous Alcogel and Aerogel
Cryo-SEM was performed on the alcogel to observe its native network. First, the gel solvent (ethanol) was replaced by water via several washes (see details in the experimental section). Then, the gel was frozen very quickly in a liquid ethane slush for a few minutes. As the freezing rate is extremely high, the water does not have time to crystallize. Thus, the amorphous ice formed preserves the original structure of the gel. The frozen gel is placed into the cryo-SEM chamber where it is cut with a razor blade to reveal its structure. It is finally sublimated to remove a thin layer of ice. The structure, presented in Figure 2A, is composed of PEDOT: PSS fibers of 11 ± 2 nm mean diameter. They are well interconnected and form a nanostructured 3D network. The aerogel was observed by SEM and its mesoporous structure is presented in Figure 2B. The network is similar to that of the wet gel which is composed of entangled fibers of 9 ± 2 nm mean diameter. The sizes of the voids are estimated within the 10–50 nm range. The textural properties were also confirmed by nitrogen adsorption/desorption tests (see Supplementary Figure S1). A type IV isotherm with adsorption hysteresis at high relative pressure indicates a large number of mesopores formed due to the interconnection of the fibers. A trace amount of macropores, not detectable by nitrogen physisorption might be present in the sample. A very small percentage of micropores can be assessed. The large BET surface area of 315 m2 g−1 can be correlated to an apparent external surface due to the fibrillar nature of the objects.
X-ray scattering experiments were performed at synchrotron Soleil. The scattering of nanostructure constituting the aerogel was studied with the small angle module (SAXS), whereas the polymer chains packing within the nanostructures was analyzed by wide-angle X-ray scattering experiments (WAXS), (Figure 2C,D). At small angles (0.002 Å-1 < q < 0.03 Å-1), the intensity profile decreases and follows a q−1 power law (Figure 2C). This dependence highlights the one dimensionality of the observed nano-objects composing the aerogel. The SAXS domain can be fitted with a cylinder model (of infinite length) with radius polydispersity (Figure 2C inset), yielding a diameter distribution in the range of 3–8 nm. This finding correlates well with the fibrillar structure of the aerogel observed in SEM. At wide angles (0.3 Å-1 < q < 2.5 Å-1), a series of scattering peaks related to the inner structure of the fibers, can be observed (Figure 2D). Five peaks at q values of 0.49, 0.71, 0.98, 1.23 and 1.85 Å-1 correspond to lattice spacing of 12.8, 8.8, 6.4, 5.1 and 3.4 Å, respectively, according to Bragg’s law. A consensus on the assignment of PEDOT:PSS X-ray diffraction peaks has not yet been reached in the literature. Some structural models propose that the spacings at 12.8 Å and 5.1 Å are related to the packing distance of PSS chains. The attribution of the two other peaks (8.8 and 6.4 Å) is not yet clearly understood. (Kim et al., 2012; Takano et al., 2012; Massonnet et al., 2014). Another structural model by Hosseini et al., (Hosseini et al., 2020), attributes the peak at 12.8 Å to the second order of interlamellar spacing between two side-by-side PEDOT lamellae. In all cases, the well-defined peak at small distance (3.4 Å) is known to be the characteristic of the π-π stacking distance of the PEDOT aromatic rings. Interestingly, the π-π stacking spacing measured in the aerogel is slightly lower than the one measured on non-treated PEDOT:PSS films (3.5-3.6 Å) suggesting some increase in molecular packing degree. (Kim et al., 2012). The structural order of PEDOT within the fibers was investigated by fitting the peak at 1.85 Å-1 with a Lorentzian model:
Mechanical Properties
The mechanical properties of both alcogels and aerogels have been investigated by steady state rheology. Figure 3A shows the typical response of the alcogels under oscillatory shear. It is characterized by a quasi-constant behavior of the storage modulus G′ and of the loss modulus G″ with frequency. From the G′-plateau value, an elastic shear modulus of ∼10 kPa can be deduced. This value is a hundred times higher than other PEDOT:PSS gels modulus reported in the literature. (Yao et al., 2017; Feig et al., 2018). To ensure reproducibility, several alcogels were examined: the measurements led to the same qualitative behavior and values of G′ close to 104 Pa. Moreover, to verify the homogeneity of the alcogels, the mechanical response of three horizontal sections of the same sample (located on the upper, middle, and lower part of the sample, respectively) were examined (Supplementary Figure S3A). The results obtained show almost identical values with no particular trend. Therefore, from a macroscopic point of view, alcogel samples are homogeneous and do not show any mechanical anisotropy. Thus, the gelation seems to be isotropic and homogeneous in the conditions of preparation (with no gradient of polymer chain concentration in the sample linked to a flocculation/sedimentation effect during gelation). Furthermore, the G′ and G″ behaviors at low-frequency (Figure 3A) are characteristic of the rheological response under shear as expected for a physical gel in the hydrodynamic regime. This behavior is also consistent with the low-frequency response of a chemical gel with a large number of inhomogeneities. (Rubinstein and Colby, 2003). To distinguish between chemical bonding and physical binding constituting the alcogel network, a static compression can be applied to the material, followed by examination of the evolution of the normal reaction force of the sample. Depending on the nature of the nodes forming the network, this normal force will be maintained over time in the case of permanent nodes (chemical gel) or will relax over time if the nodes are transient (physical gel). The inset of Figure 3B focuses on the short times and shows simultaneously the increase in normal force and the progressive decrease in sample thickness (9% in our case over 1 min of contraction time). A rapid increase in normal force during sample compression, followed by a gradual decrease in this force over time is observed (Figure 3B). This highlights that the alcogel reacts like a physical gel (as also observed for PEDOT:PSS hydrogel (Yao et al., 2017)) since it relaxes its force over time. At the end of the experiment, while the upper plate of the cell returned to its pre-compression position, the sample did not return to its initial thickness, indicating that the change in size was irreversible. Figure 3B also shows two regimes of force decay with time: a rapid decay that extends up to ∼5 h, followed by a slower decay that extends to the end of the experiment (described by a simple linear decrease with time). Assuming that this linear decrease is maintained over time, this force vanishes after 57 h. In other words, we can identify this time with the lifetime of the longest relaxation mode of the alcogel lattice (demonstrating that some elasticity endures over time).
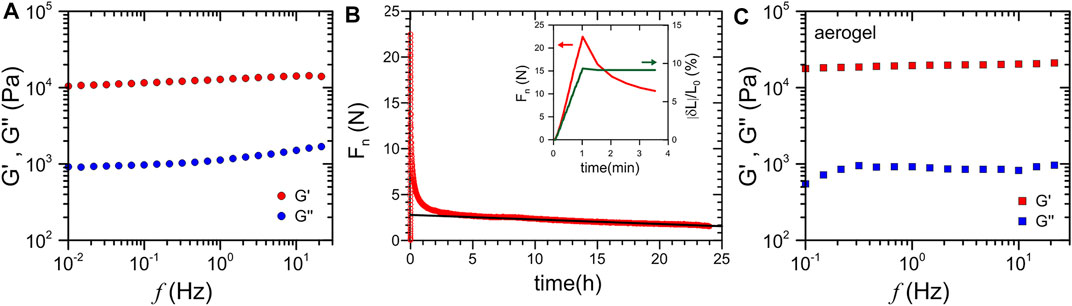
FIGURE 3. (A) Complex shear modulus variation with frequency for an alcogel sample, (B) evolution over time of the normal force of an alcogel sample subjected to a reduction in thickness. The time relaxation of this force highlights the physical gel nature of the alcogel, (C) complex shear modulus variation with frequency for an aerogel sample.
To allow a quantitative comparison of the mechanical properties prior to and after drying, the same sample was studied, first in its alcogel state and then in its aerogel state. Figure 3C shows the typical frequency response of the aerogel. This response is qualitatively very Similar to that of the alcogel, with in particular the existence of a low-frequency plateau for G′ and G''. A slight difference is observed for the plateau of G″, which persists at higher frequencies for aerogel than for alcogel. This frequency extension of the plateau reflects the increase in the lowest relaxation frequency of the internal lattice modes. Approximately a factor of two in the increase in elastic modulus between the alcogel and the aerogel was observed. As shown previously (Figure 1), supercritical drying also leads to a reduction in sample size. Within the accuracy of the measurements, the volume change and the modulus change induced by supercritical drying are comparable (Vaerogel/Valcogel = 0.59 with Valcogel = 0.835 cm3 and Vaerogel = 0.489 cm3 and G’alcogel/G’aerogel = 0.61, see Supporting Information Supplementary Figure S3B). Since the elastic moduli are proportional to the node density of the network, the number of nodes in the alcogel network remains the same after supercritical drying. The initial network in the alcogel is thus preserved during the aerogel formation.
In summary, the results of the rheology experiments on alcogels show the expected behavior for a physical gel: stress relaxation and frequency response characterized by a low-frequency G′- and G″- plateau. The formulation of alcogels yields samples which are isotropic and homogeneous at the macroscopic scale, and whose elastic modulus is around 10 kPa. The aerogel shows a similar rheological behavior as the alcogel, but with twice the elastic modulus (∼20 kPa). A precise analysis of the results carried out on the same sample in the alcogel and aerogel states shows that the increase in elastic modulus comes from the reduction in the volume of the sample during supercritical drying, while the number of nodes for alcogel and aerogel remains the same. Altogether, the aerogels show interesting structural features that sound promising for TE application.
Thermoelectric Properties
Electrical resistance, Seebeck coefficient and thermal conductivity were measured on each sample to ensure a clear correlation between all TE properties. Six to eight different samples were in total to guarantee accurate reproducibility of the results. As a non-destructive method, thermal conductivity was first measured, then electrical resistance before the Seebeck coefficient that required the use of silver paste for a better electrical contact (for the ‘in-plane’ method). Figure 4 shows how the samples have been characterized and a representative curve for each of the measurements. The method of sample preparation for these TE characterizations is described in the experimental section.
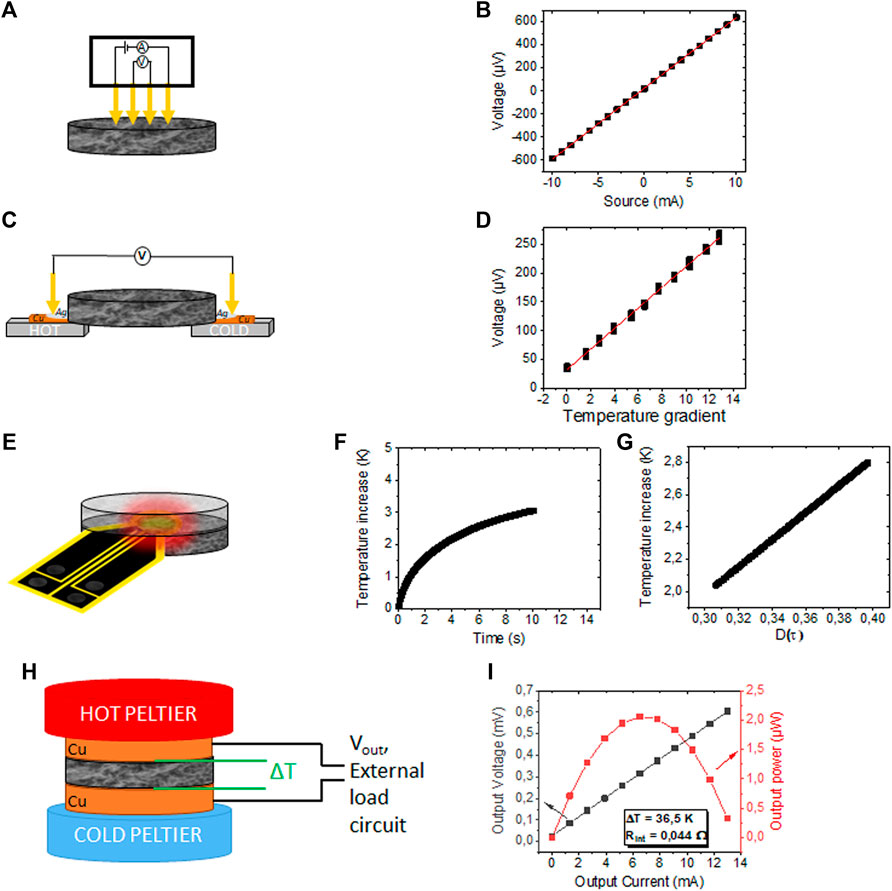
FIGURE 4. (A) Schematic of the electrical resistance measurement using the four-point probe geometry on the aerogel, (B) typical I/V curve of the electrical resistance measurement, (C) schematic of in-plane Seebeck coefficient measurement. To ensure good electrical contact with the probes and a good thermal contact with the Peltier elements, aerogel samples have been pasted on copper foil (Cu) with silver paste (Ag), (D) typical curve for Seebeck measurement, (E) sample configuration for isotropic thermal conductivity measurement, the sensor is sandwiched between two aerogels of fairly identical size. The samples were held in place using a lightweight aluminum pellet at the top of the upper sample, which ensured good contact between the sensor and the surface of the samples, (F) typical transient curve of thermal conductivity measurements, (G) Typical calculated graph (∆T) as a function of D(τ), (H) schematic of cross-plane Seebeck coefficient and power output measurements, (I) output voltage and output power as a function of current for a typical aerogel for a temperature gradient of 36.5 K.
Electrical resistance was measured on the aerogels with a four-probe collinear resistivity setup (as shown in Figure 4A). The resistance appears to be isotropic (measured on both sides of eight samples, on different spots). A typical I-V curve is presented in Figure 4B). The aerogels display a mean electrical conductivity value of 18.1 ± 1.0 S cm−1 which is amongst the highest values reported for pure and porous PEDOT:PSS materials with such high thickness and low density (see Table 1 for comparison). We suggest that such high charge transport property in a highly porous material is due to the long-range nanostructuring of the polymer chains within the fibers during the gelation step (see the WAXS discussion above on the coherence length of the PEDOT domains along the π-π stacking direction). Furthermore, the interconnected fibrillar morphology provides good electrical conductivity by forming effective pathways for electron transfer.
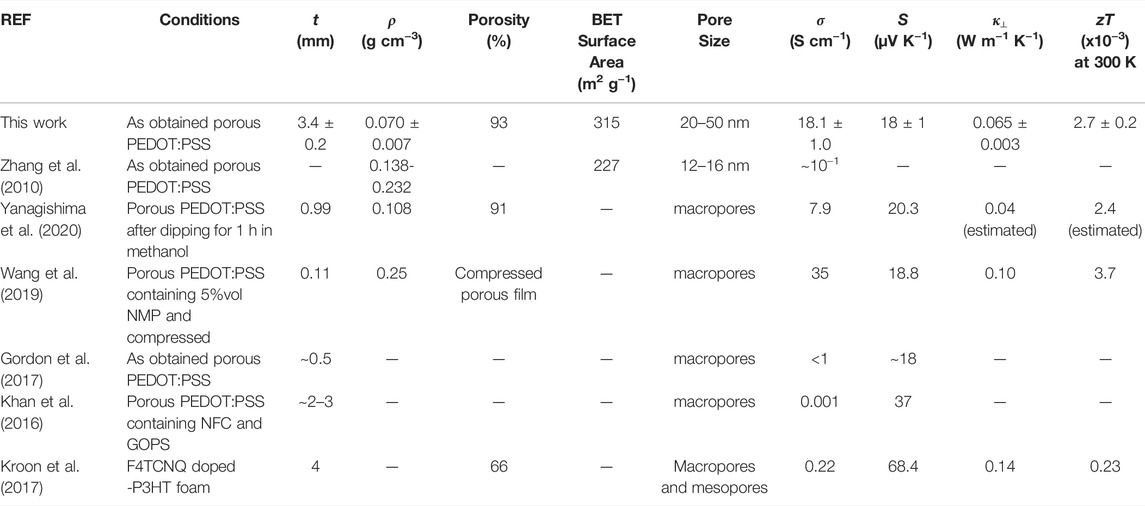
TABLE 1. Physical and TE measured properties of the PEDOT:PSS aerogel fabricated herein compared with other porous PEDOT:PSS and P3HT reported in the literature with t, the thickness, ρ, the density, and BET surface extracted from the Brunauer- Emmett—Teller method. NFC stands for nanofibrillated cellulose and GOPS for glycidoxypropyl trimethoxy silane.
To evaluate the electrical conductivity of our highly porous PEDOT:PSS aerogels (93% porosity) as compared with solid PEDOT:PSS films (no porosity), we can follow different approaches. Experimentally, we have dried the PEDOT:PSS alcogels in air which afforded inhomogeneous but self-supported thick films (∼10 µm) displaying an electrical conductivity of 403 ± 53 S cm−1. This value is close to the ones reported by Maeda and co-workers (Maeda et al., 2019). Theoretically, we can also consider mathematical models that take into account the pore geometry and the volume fraction of the pores to determine the electrical conductivity of the solid without pores (i.e.,
where
The Seebeck coefficient S was measured in-plane on six samples via the differential method (see Figure 4C). The value is calculated by linearly fitting a series of measured thermovoltages over a series of temperature differences across the sample
Thermal conductivity was measured using the transient plane source method (Hot Disk TPS1000 analyzer). The standard uncertainty for thermal conductivity values is given at 5%. The technique provides nondestructive and rapid measurements of both thermal conductivity and diffusivity. The method principle is described in the experimental section.
The measurements were performed on three pairs of aerogels and repeated consecutively ten times with an interval of 30 min between each trial. The average thermal conductivity of the aerogels was calculated to be 0.065 W m−1. K−1 (thermal diffusivity = 0.55 mm2 s−1). This low value accounts for the high porosity of the aerogels and their mesoporous structure. Considering the Wiedemann-Franz law (with a Lorenz number close to the Sommerfeld value (Sommerfeld, 1927)) and the electrical conductivity of our aerogel, we estimate κelec = 0.013 W m−1. K−1 and κlat = 0.052 W m−1. K−1 at room temperature. It is typically assumed that the κlat of TE conducting polymer (in film) is 0.2 W m−1. K−1. (Kang and Snyder, 2017). Furthermore, a substantial decrease of κlat (<0.2 W m−1. K−1), can help to attain zT > 1 for organic thermoelectrics (if the energetic disorder is also minimized). (Scheunemann and Kemerink, 2020). In this work, we demonstrate that introducing porosity and phonon engineering of conducting polymers is an efficient strategy to decrease κlat by a factor of 4.
Finally, from the thermoelectric properties obtained above, a zT of 2.7 × 10⁻³ at 300 K was calculated for mesoporous PEDOT:PSS aerogels. This value is highest amongst those reported in the literature for such thick and light-weight samples. Table 1 summarizes the properties of the PEDOT:PSS aerogels of this work in relation with the existing literature. An exact comparison with other reported values is difficult as porous PEDOT:PSS materials are processed differently which impacts their structural and functional properties. As discussed earlier, most of the reports either omit the gelation aspect of the synthesis or utilize different drying techniques to obtain porous solids (comprised of macropores). To compensate for the resulting poor TE features, they utilize post-processing steps such as immersing in organic solvents (Gordon et al., 2017; Yanagishima et al., 2020) or compression (Wang et al., 2019). However, this comes at the cost of sample shrinkage (pore collapse) or of decrease in sample size (increase in density) respectively. Furthermore, the structural and textural features were not studied in detail and the functional properties were not characterized extensively.
To demonstrate the high potential of these samples in a TE generator, the power output was measured as a function of an adjustable external load circuit in air (at ambient temperature). Here, an aerogel was sandwiched between two copper discs and a temperature gradient of 7 K was applied through two Peltier elements (see Figure 4H). The maximum power output is determined when the load resistance is equal to the internal resistance of the sample (see Figure 4I). The aerogel exhibits a maximum power output of 0.102 µW and a small internal resistance of 0.037 Ω for a small temperature gradient of 7 K (Supplementary Figure S5B). Interestingly, the maximum power output is increased twenty times to 2 µW for a temperature gradient of 36.5 K. The evolution of power output as a function of temperature gradient follows a second order polynomial function (Supplementary Figure S5C). This measurement demonstrates the power output of a one-leg thermoelectric generator. Increasing the number of legs and coupling with n-type aerogel counterparts (with balanced properties) can lead to promising next-generation TE generators. For instance, Wang et al. (Wang et al., 2019) developed a TE generator consisting of six pairs of p-type PEDOT:PSS-based cryogel (with heterogeneous macroporosity) and n-type CNT fibers as legs and the maximum power output of 0.62 µW was generated at a temperature gradient of 60 K.
Conclusion
Here, we have developed a facile process to prepare aerogels that display values competitive with the literature without any post-processing techniques. Moreover, we have established an in-depth study on the aerogels using state-of-the-art characterization tools. We demonstrate the production of homogeneous PEDOT:PSS physical gels over a few mm thickness with high reproducibility. Their fibrillar 3D network is evidenced by SEM images and confirmed by X-ray scattering measurements. Moreover, as demonstrated by rheological studies, the strong network is homogeneous throughout the sample. It is demonstrated by SEM images and modulus measurements that the 3D mesoporous network is conserved in the dried state, despite 40% of the volume loss after drying. The final aerogels are ultralight, handleable, and mechanically robust. With respect to the functional properties, the electronic charge transport was studied thoroughly correlating experimental and theoretical models. A sufficient electrical conductivity was maintained through nanostructuration and the thermal conductivity was reduced due to phonon engineering. Altogether, the combination of both strategies produces a high power output of p-type one-leg-TEG, the next step being the development of its n-type counterpart.
Data Availability Statement
The original contributions presented in the study are included in the article/Supplementary Material, further inquiries can be directed to the corresponding author.
Author Contributions
LB and QW contributed to conception and design of the study. QW conducted most of the experiments (aerogel preparation, SEM, thermoelectric measurements) and provided help to LB in data analysis. ST helped to settle the conditions for the supercritical drying step. AC conducted Cryo-SEM experiments and provided technical support and training on SEM. GC conducted the nitrogen physisorption experiment. DC (6th author) performed the SAXS and WAXS experiments. DC (6th author) and JC contributed to the X-Ray data analysis. NS provided support for the power output measurement and the cross-plane Seebeck coefficient measurement. DC (8th author) performed the steady rheology experiments and the corresponding data analysis. QW, ST, and LB wrote the first draft of the manuscript. All authors contributed to manuscript revision, read, and approved the submitted version.
Funding
Financial support by ANR JCJC 2019 (BODYTEG: ANR-19-CE06-0004) and Région Grand Est 2020 are gratefully acknowledged.
Conflict of Interest
The authors declare that the research was conducted in the absence of any commercial or financial relationships that could be construed as a potential conflict of interest.
Publisher’s Note
All claims expressed in this article are solely those of the authors and do not necessarily represent those of their affiliated organizations, or those of the publisher, the editors and the reviewers. Any product that may be evaluated in this article, or claim that may be made by its manufacturer, is not guaranteed or endorsed by the publisher.
Acknowledgments
Thermoconcept (Cynthia Besson and Alexandre Renault) is acknowledged for training and technical support on the TPS1000 machine. The PLAMICS microscopy facility of ICS is acknowledged for technical support and the use of their equipment. We acknowledge SOLEIL for provision of synchrotron radiation facilities and we thank Thomas Bizien for assistance in using beamline SWING for the SAXS and WAXS experiments. Martin Brinkmann is acknowledged for providing access to the Seebeck in-plane measurement set-up and the collinear four-probe setup both located in a glove box. Patrick Allgayer, Laurent Hermann and Jean-Philippe Lamps are thanked for technical support. We acknowledge Marc Schmutz and Duncan Schwaller for fruitful discussions.
Supplementary Material
The Supplementary Material for this article can be found online at: https://www.frontiersin.org/articles/10.3389/femat.2022.875856/full#supplementary-material
References
Ashby, M. F., Evans, A. G., Fleck, N., Gibson, L. J., Hutchinson, J., and Wadley, H. N. G. (2000). Metal Foams : A Design Guide. Boston: Butterworth-Heineman.
Bentley, R. E. (1998). Handbook of Temperature Measurement Vol. 3: The Theory and Practice of Thermoelectric Thermometry. Singapore: Springer Science & Business Media.
Bohac, V., Gustavsson, M. K., Kubicar, L., and Gustafsson, S. E. (2000). Parameter Estimations for Measurements of thermal Transport Properties with the Hot Disk thermal Constants Analyzer. Rev. Sci. Instr. 71, 2452–2455. doi:10.1063/1.1150635
Bubnova, O., Khan, Z. U., Malti, A., Braun, S., Fahlman, M., Berggren, M., et al. (2011). Optimization of the Thermoelectric Figure of merit in the Conducting Polymer Poly(3,4-Ethylenedioxythiophene). Nat. Mater 10, 429–433. doi:10.1038/nmat3012
Collin, D., Lavalle, P., Garza, J. M., Voegel, J.-C., Schaaf, P., and Martinoty, P. (2004). Mechanical Properties of Cross-Linked Hyaluronic Acid/poly-(L-Lysine) Multilayer Films. Macromolecules 37, 10195–10198. doi:10.1021/ma048683g
Cuevas, F. G., Montes, J. M., Cintas, J., and Urban, P. (2009). Electrical Conductivity and Porosity Relationship in Metal Foams. J. Porous Mater. 16, 675–681. doi:10.1007/s10934-008-9248-1
Danine, A., Schoenleber, J., Ghanbaja, J., Montaigne, F., Boulanger, C., and Stein, N. (2018). Microstructure and Thermoelectric Properties of P-type Bismuth Antimony telluride Nanowires Synthetized by Template Electrodeposition in Polycarbonate Membranes. Electrochim. Acta 279, 258–268. doi:10.1016/j.electacta.2018.05.071
Deville, S. (2017). Freezing Colloids : Observations, Principles, Control, and Use. 1st ed. Cham: Springer.
Dharmasena, K. P., and Wadley, H. N. G. (2002). Electrical Conductivity of Open-Cell Metal Foams. J. Mater. Res. 17, 625–631. doi:10.1557/JMR.2002.0089
Dubochet, J., Adrian, M., Chang, J.-J., Homo, J.-C., Lepault, J., McDowall, A. W., et al. (1988). Cryo-electron Microscopy of Vitrified Specimens. Quart. Rev. Biophys. 21, 129–228. doi:10.1017/s0033583500004297
Efthymiou, C., Williams, M. A. K., and McGrath, K. M. (2017). Revealing the Structure of High-Water Content Biopolymer Networks: Diminishing Freezing Artefacts in Cryo-SEM Images. Food Hydrocolloids 73, 203–212. doi:10.1016/j.foodhyd.2017.06.040
Feig, V. R., Tran, H., Lee, M., and Bao, Z. (2018). Mechanically Tunable Conductive Interpenetrating Network Hydrogels that Mimic the Elastic Moduli of Biological Tissue. Nat. Commun. 9, 2740. doi:10.1038/s41467-018-05222-4
Finn, P. A., Asker, C., Wan, K., Bilotti, E., Fenwick, O., and Nielsen, C. B. (2021). Thermoelectric Materials: Current Status and Future Challenges. Front. Electron. Mater. 1, 1. doi:10.3389/femat.2021.677845
Frantz, C., Stein, N., Gravier, L., Granville, S., and Boulanger, C. (2010). Electrodeposition and Characterization of Bismuth telluride Nanowires. J. Elec Mater. 39, 2043–2048. doi:10.1007/s11664-009-1001-2
Goodall, R., Weber, L., and Mortensen, A. (2006). The Electrical Conductivity of Microcellular Metals. J. Appl. Phys. 100, 044912. doi:10.1063/1.2335672
Gordon, M. P., Zaia, E. W., Zhou, P., Russ, B., Coates, N. E., Sahu, A., et al. (2017). Soft PEDOT:PSS Aerogel Architectures for Thermoelectric Applications. J. Appl. Polym. Sci. 134, 44070. doi:10.1002/app.44456
Hamidi-Sakr, A., Biniek, L., Bantignies, J.-L., Maurin, D., Herrmann, L., Leclerc, N., et al. (2017). A Versatile Method to Fabricate Highly In-Plane Aligned Conducting Polymer Films with Anisotropic Charge Transport and Thermoelectric Properties: The Key Role of Alkyl Side Chain Layers on the Doping Mechanism. Adv. Funct. Mater. 27, 1700173. doi:10.1002/ADFM.201700173
He, Y. (2005). Rapid thermal Conductivity Measurement with a Hot Disk Sensor. Thermochim. Acta 436, 122–129. doi:10.1016/j.tca.2005.06.026
Hosseini, E., Ozhukil Kollath, V., and Karan, K. (2020). The Key Mechanism of Conductivity in PEDOT:PSS Thin Films Exposed by Anomalous Conduction Behaviour upon Solvent-Doping and Sulfuric Acid post-treatment. J. Mater. Chem. C 8, 3982–3990. doi:10.1039/c9tc06311k
Hüsing, N., and Schubert, U. (1998). Aerogels-Airy Materials: Chemistry, Structure, and Properties. Angew. Chem. - Int. Ed. 37, 22–45. doi:10.1002/1521-3773(19980202)37:1/2<22::aid-anie22>3.3.co;2-9
Kang, S. D., and Snyder, G. J. (2017). Charge-transport Model for Conducting Polymers. Nat. Mater 16, 252–257. doi:10.1038/nmat4784
Khan, Z. U., Edberg, J., Hamedi, M. M., Gabrielsson, R., Granberg, H., Wågberg, L., et al. (2016). Thermoelectric Polymers and Their Elastic Aerogels. Adv. Mater. 28, 4556–4562. doi:10.1002/adma.201505364
Kim, N., Lee, B. H., Choi, D., Kim, G., Kim, H., Kim, J.-R., et al. (2012). Role of Interchain Coupling in the Metallic State of Conducting Polymers. Phys. Rev. Lett. 109, 106405. doi:10.1103/PhysRevLett.109.106405
Kim, G.-H., Shao, L., Zhang, K., and Pipe, K. P. (2013). Engineered Doping of Organic Semiconductors for Enhanced Thermoelectric Efficiency. Nat. Mater. 12, 719–723. doi:10.1038/nmat3635
Kline, S. R. (2006). Reduction and Analysis of SANS and USANS Data Using IGOR Pro. J. Appl. Cryst. 39, 895–900. doi:10.1107/S0021889806035059
Kroon, R., Ryan, J. D., Kiefer, D., Yu, L., Hynynen, J., Olsson, E., et al. (2017). Bulk Doping of Millimeter‐Thick Conjugated Polymer Foams for Plastic Thermoelectrics. Adv. Funct. Mater. 27, 1704183. doi:10.1002/adfm.201704183
Liu, P. S., Li, T. F., and Fu, C. (1999). Relationship between Electrical Resistivity and Porosity for Porous Metals. Mater. Sci. Eng. A 268, 208–215. doi:10.1016/s0921-5093(99)00073-8
Maeda, R., Kawakami, H., Shinohara, Y., Kanazawa, I., and Mitsuishi, M. (2019). Thermoelectric Properties of PEDOT/PSS Films Prepared by a Gel-Film Formation Process. Mater. Lett. 251, 169–171. doi:10.1016/j.matlet.2019.05.005
Maeda, R., Shinohara, Y., Kawakami, H., Isoda, Y., Kanazawa, I., and Mitsuishi, M. (2021). The Conducting Fibrillar Networks of a PEDOT:PSS Hydrogel and an Organogel Prepared by the Gel-Film Formation Process. Nanotechnology 32, 135403. doi:10.1088/1361-6528/abd1a9
Massonnet, N., Carella, A., De Geyer, A., Faure-Vincent, J., and Simonato, J.-P. (2014). Metallic Behaviour of Acid Doped Highly Conductive Polymers. Chem. Sci. 6, 412–417. doi:10.1039/C4SC02463J
Noroozi, M., Panahi-Sarmad, M., Abrisham, M., Amirkiai, A., Asghari, N., Golbaten-Mofrad, H., et al. (2019). Nanostructure of Aerogels and Their Applications in Thermal Energy Insulation. ACS Appl. Energ. Mater. 2, 5319–5349. doi:10.1021/acsaem.9b01157
Rouquerol, J., Llewellyn, P., and Rouquerol, F. (2007). Is the BET Equation Applicable to Microporous Adsorbents? Stud. Surf. Sci. Catal. 160, 49–56. doi:10.1016/S0167-2991(07)80008-5
Scheunemann, D., and Kemerink, M. (2020). Non-Wiedemann-Franz Behavior of the thermal Conductivity of Organic Semiconductors. Phys. Rev. B 101, 75206. doi:10.1103/PhysRevB.101.075206
Slack, G. A. (1995). “New Materials and Performance Limits for Thermoelectric Cooling,” in CRC Handbook of Thermoelectrics. Editor D. M. Rowe (CRC Press), 399–432. doi:10.1201/9781420049718.ch34
Sommerfeld, A. (1927). Zur Elektronentheorie der Metalle. Naturwissenschaften 15, 825–832. doi:10.1007/BF01505083
Takano, T., Masunaga, H., Fujiwara, A., Okuzaki, H., and Sasaki, T. (2012). PEDOT Nanocrystal in Highly Conductive PEDOT:PSS Polymer Films. Macromolecules 45, 3859–3865. doi:10.1021/ma300120g
Tang, G. H., Bi, C., Zhao, Y., and Tao, W. Q. (2015). Thermal Transport in Nano-Porous Insulation of Aerogel: Factors, Models and Outlook. Energy 90, 701–721. doi:10.1016/j.energy.2015.07.109
Topsøe, H. (1968). Geometric Factors in Four point Resistivity Measurement. Bulletin 472 (13), 10–16.
Vijayakumar, V., Zhong, Y., Untilova, V., Bahri, M., Herrmann, L., Biniek, L., et al. (2019). Bringing Conducting Polymers to High Order: Toward Conductivities beyond 105 S cm−1 and Thermoelectric Power Factors of 2 mW M−1 K−2. Adv. Energ. Mater. 9 (24). doi:10.1002/aenm.201900266
Walton, K. S., and Snurr, R. Q. (2007). Applicability of the BET Method for Determining Surface Areas of Microporous Metal−Organic Frameworks. J. Am. Chem. Soc. 129 (27), 8552–8556. doi:10.1021/ja071174k
Wang, X., Liu, P., Jiang, Q., Zhou, W., Xu, J., Liu, J., et al. (2019). Efficient DMSO-Vapor Annealing for Enhancing Thermoelectric Performance of PEDOT:PSS-Based Aerogel. ACS Appl. Mater. Inter. 11, 2408–2417. doi:10.1021/acsami.8b19168
Weinbach, Q., Nielsen, C. B., and Biniek, L. (2021). Multi Length Scale Porosity as a Playground for Organic Thermoelectric Applications. J. Mater. Chem. C 9, 10173–10192. doi:10.1039/d1tc02331d
Woignier, T., Phalippou, J., Despetis, F., and Calas-Etienne, S. (2018). “Aerogel Processing,” in Handbook of Sol-Gel Science and Technology: Processing, Characterization and Applications. Editors L. Klein, M. Aparicio, and A. Jitianu (Cham: Springer), 985–1011. doi:10.1007/978-3-319-32101-1_27
Yanagishima, N., Kanehashi, S., Saito, H., Ogino, K., and Shimomura, T. (2020). Thermoelectric Properties of PEDOT:PSS Aerogel Secondary-Doped in Supercritical CO2 Atmosphere with Low thermal Conductivity. Polymer 206, 122912. doi:10.1016/j.polymer.2020.122912
Yao, B., Wang, H., Zhou, Q., Wu, M., Zhang, M., Li, C., et al. (2017). Ultrahigh-Conductivity Polymer Hydrogels with Arbitrary Structures. Adv. Mater. 29, 1700974. doi:10.1002/adma.201700974
Keywords: porous conducting polymer, aerogel, thermal conductivity, thermoelectric properties, supercritical drying, PEDOT:PSS, mechanical properties
Citation: Weinbach Q, Thakkar SV, Carvalho A, Chaplais G, Combet J, Constantin D, Stein N, Collin D and Biniek L (2022) Efficient Control of a Mesoporous Fibrillar PEDOT:PSS Aerogel Structure for Promising Thermoelectric Applications. Front. Electron. Mater. 2:875856. doi: 10.3389/femat.2022.875856
Received: 14 February 2022; Accepted: 21 March 2022;
Published: 02 May 2022.
Edited by:
Simone Fabiano, Linköping University, SwedenReviewed by:
Matteo Massetti, Linköping University, SwedenFrancisco Molina-Lopez, KU Leuven, Belgium
Shaobo Han, Wuyi University, China
Copyright © 2022 Weinbach, Thakkar, Carvalho, Chaplais, Combet, Constantin, Stein, Collin and Biniek. This is an open-access article distributed under the terms of the Creative Commons Attribution License (CC BY). The use, distribution or reproduction in other forums is permitted, provided the original author(s) and the copyright owner(s) are credited and that the original publication in this journal is cited, in accordance with accepted academic practice. No use, distribution or reproduction is permitted which does not comply with these terms.
*Correspondence: Laure Biniek, bGF1cmUuYmluaWVrQGljcy1jbnJzLnVuaXN0cmEuZnI=