 Zhijun Jiang
 Bin Xu
 Sergey Prosandeev2
94% of researchers rate our articles as excellent or good
Learn more about the work of our research integrity team to safeguard the quality of each article we publish.
Find out more
REVIEW article
Front. Electron. Mater, 29 March 2022
Sec. Dielectric and Ferroelectric Materials
Volume 2 - 2022 | https://doi.org/10.3389/femat.2022.869803
This article is part of the Research TopicCelebrating 1 Year of Frontiers in Electronic MaterialsView all 11 articles
Dielectric capacitors are particularly suitable to store the electrical energy of a fast-changing nature. Here, we present a review of recent applications of first principles and first-principles-based effective Hamiltonian approaches to the study of energy storage in ferroelectrics, lead-free antiferroelectrics, relaxor ferroelectrics, and nitride semiconductors. Specifically, these approaches are used to investigate the energy density and efficiency in perovskite BaTiO3, PbTiO3, and KNbO3 ferroelectrics; Bi1−xRxFeO3 antiferroelectric solid solutions (where R is a rare-earth ion); Ba(Zr,Ti)O3 relaxor ferroelectrics; and epitaxial AlN/ScN superlattices. Ultrahigh energy densities and efficiencies are predicted in some of these compounds. In addition, phenomenological models are used to analyze and understand these energy storage results. Consequently, the numerical methods and simple models detailed here can be easily employed to design novel nonlinear dielectrics with further enhanced energy storage performance.
Dielectric capacitors with ultrahigh energy density and efficiency are promising for energy storage applications in various electronic applications due to their fast charging/discharging speeds and high stability (Chu et al., 2006; Hao, 2013; Chauhan et al., 2015; Li et al., 2015; Prateek Thakur and Gupta, 2016; Yao et al., 2017; Yang et al., 2019), and intensive efforts have been devoted to improve their relatively low energy densities. For example, dielectric polymers with high dipole density have the potential to achieve ultrahigh energy density with fast discharge and low hysteresis loss (Chu et al., 2006; Li et al., 2015). Recently, antiferroelectrics, relaxor ferroelectrics, and initially nonpolar-based capacitors have been intensively studied because of their low dielectric loss, high polarization, and high breakdown electric field (Peng et al., 2015; Hou et al., 2017; Instan et al., 2017; Pan et al., 2019; Kim et al., 2020; Pan et al., 2021; Wei et al., 2021). For instance, a giant energy density of 154 J/cm3 with a high efficiency of 97% has been observed in epitaxial lead-free relaxor thin films exhibiting a coexistence of ferroelectric (FE) and anti-FE phases (Peng et al., 2015). A high energy density of 112 J/cm3 with a high energy efficiency of 80% has also been achieved in lead-free BiFeO3-BaTiO3-SrTiO3 solid solution films (Pan et al., 2019). Ultrahigh energy densities and efficiencies have also been reported in 0.68Pb(Mg1/3Nb2/3)O3-0.32PbTiO3 (133 J/cm3 and 75%) and Sm-doped yBFO-(1−y)BTO (152 J/cm3 with a marked enhancement of efficiency above 90%) relaxor ferroelectrics (Kim et al., 2020; Pan et al., 2021). Note that the so-called superparaelectric relaxor ferroelectrics (which exist between the temperature Tm at which the dielectric response exhibits a peak and the Burns temperature Tb) have been demonstrated to possess ultrahigh energy density and efficiency (Pan et al., 2021), which is promising to optimize properties in other relaxor-FE-based systems and nonlinear dielectrics. Other examples include the ultrahigh recoverable energy density in Ba(ZrxTi1−x)O3 relaxor ferroelectric thin films that has been experimentally observed to be 156 J/cm3 at a high electric field around 3 MV/cm with an efficiency of 72.8% (Instan et al., 2017); and the highest record of energy density up to 307 J/cm3 with a high efficiency of 89% at 6.6 MV/cm measured in SrTiO3 films grown on an La0.67Sr0.33MnO3 electrode (Hou et al., 2017).
Note that, for nonlinear dielectrics (i.e., ferroelectrics, antiferroelectrics, and relaxors), the stored energy density (Ust or Wst) is determined by integrating the area between the polarization and the charging curve of the polarization versus electric field (P-E) loop,
The aim of this review article is to discuss the recent first principles and first-principles-based effective Hamiltonian studies aimed at predicting and understanding energy storage in some ferroelectrics (Luo et al., 2016), lead-free antiferroelectrics (Xu et al., 2017), relaxor ferroelectrics (Jiang et al., 2022), and some specific nitride semiconductors (Jiang et al., 2021a).
This article is organized as follows. Section 2 provides details about the first-principles methods and first-principles-based effective Hamiltonian schemes used for investigating the energy storage properties of these different systems (Luo et al., 2016; Xu et al., 2017; Jiang et al., 2021a; Jiang et al., 2022). Section 3 reports and discusses energy storage results in ferroelectrics, antiferroelectrics, relaxor ferroelectrics, and nitride semiconductors, from the use of these ab initio methods. Finally, Section 4 provides a summary and perspective on future studies.
The effective Hamiltonian used to study energy storage in some prototypical ferroelectrics (namely, BaTiO3, PbTiO3, and KNbO3) can be expressed as (Nishimatsu et al., 2008; Luo et al., 2016)
where
The effective Hamiltonian parameters for BaTiO3, PbTiO3, and KNbO3 FE systems were determined from first-principles calculations [see details in References (Waghmare and Rabe, 1997; Waghmare et al., 1998; Nishimatsu et al., 2010)].
An effective Hamiltonian (Heff) approach was developed in Refs (Xu et al., 2015; Jiang et al., 2021b) for Bi1−xNdxFeO3 (BNFO) solid solutions. The total internal energy Eint of this effective Hamiltonian can be expressed as
where
BNFO systems are typically modeled by using 12 × 12 × 12 supercells (containing 8,640 atoms) within this Heff scheme and inside, in which the A site of Bi and Nd ions is randomly distributed. Practically, the total energy of this Heff approach can be used in Monte Carlo (MC) simulations to compute the static properties of BNFO solid solutions at a finite temperature. A total of 20,000 MC sweeps are typically used for equilibration, and an additional 20,000 MC sweeps are employed to compute statistical thermal averages at a finite temperature and an electric field, to obtain converged results (Xu et al., 2017).
The first-principles-based effective Hamiltonian approach has also been recently developed and used to simulate the static and dynamical properties of bulks and films made of Ba(Zr,Ti)O3 solid solutions (Akbarzadeh et al., 2012; Prosandeev et al., 2013a; Prosandeev et al., 2013b; Wang et al., 2016; Jiang et al., 2017; Jiang et al., 2022). The total internal energy of the effective Hamiltonian in Ba(Zr,Ti)O3 contains two main terms too:
where
This effective Hamiltonian has been implemented within MC simulations on 12 × 12 × 12 supercells (8,640 atoms), in order to determine and understand energy storage in disordered Ba(Zr,Ti)O3 (BZT) relaxor ferroelectrics, for the fixed composition of 50% of both Zr and Ti, in both bulks and epitaxial films (Jiang et al., 2022). Note that this Heff successfully predicted the existence of three characteristic temperatures in relaxor ferroelectrics. For instance, for BZT bulks with 50% of Zr and Ti ions, 1) the temperature Tm
In Ref. (Jiang et al., 2021a), first-principles calculations were performed on (001) epitaxial 1 × 1 AlN/ScN superlattices within the local density approximation to density functional theory (DFT) and using norm-conserving pseudopotentials (Hamann, 2013), as implemented in the ABINIT package (Gonze et al., 2002). The epitaxial strain can be expressed as
Let us first present the energy storage results of the prototypical perovskite ferroelectrics BaTiO3, PbTiO3, and KNbO3. A first-principles-based effective Hamiltonian within molecular dynamics simulations was used for these perovskite ferroelectrics and is described in Section 2.1 and Ref. (Luo et al., 2016).
The temperature dependence of the P-E hysteresis and energy density properties for BaTiO3, PbTiO3, and KNbO3 are shown in Figure 1. The energy density of BaTiO3 slowly increases with the temperature below the Curie point at 380 K. In contrast, the energy density rapidly increases with a temperature above the Curie point. Furthermore, the energy density behavior of KNbO3 was numerically found to be very similar to BaTiO3 because of the similarity in the structural phase transition and field-induced phase transition. In the case of PbTiO3, the energy density varies nonmonotonically with the temperature, that is, it first reaches a peak around 820 K and then decreases. This can be explained by the fact that PbTiO3 exhibits a rather weak polarization for temperatures above 820 K. Note that ferroelectrics are not ideal for energy storage applications due to the square shape of their hysteresis loops—which typically gives rise to low energy density and efficiency.
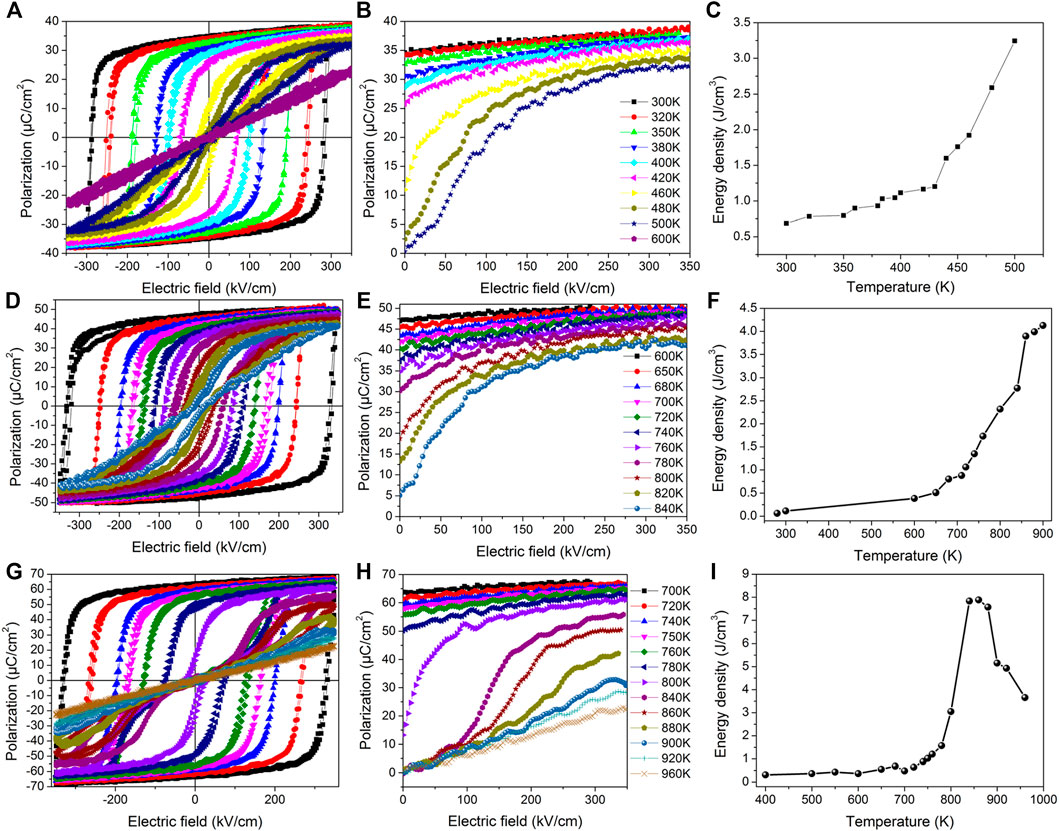
FIGURE 1. Temperature dependence of hysteresis loops (A,D,G), P-E curves (B,E,H), and energy densities (C,F,I) in BaTiO3, KNbO3, and PbTiO3. Reproduced from (Luo et al., 2016), with the permission of AIP Publishing.
As compared to typical FE systems, antiferroelectric (AFE) materials are very promising for high-power energy storage applications because of their characteristic P-E double hysteresis loops, which is schematized in Figure 2A (Xu et al., 2017). There, Eup describes the critical field at which the AFE-to-FE transition appears upon charging when increasing field, while Edown denotes the critical field for the FE-to-AFE phase transition upon discharging (decreasing field). The green area in Figure 2A represents the energy density.
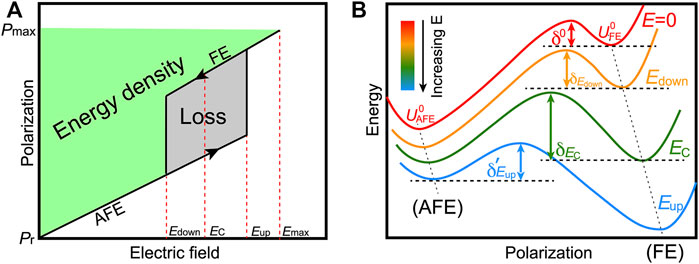
FIGURE 2. (A) Quantities related to stored energy density and energy loss from the P-E double hysteresis loop of antiferroelectrics. The arrows represent the charging and discharging processes. Eup and Edown describe the critical field at the AFE-FE and FE-AFE phase transitions, respectively. EC is the field at which the FE and AFE phases have the same energy. (B) The energy versus polarization curves with increasing electric field. Reprinted figure with permission from (Xu et al., 2017). Copyright 2017 Springer Nature.
As indicated in Section 2.2, a first-principles-based effective Hamiltonian method was employed to investigate the energy storage properties in the rare earth-substituted BiFeO3 multiferroic systems, in general, and disordered BNFO solid solutions, in particular (Xu et al., 2015). This effective Hamiltonian method successfully reproduced the temperature-versus-compositional phase diagram of BNFO (Levin et al., 2010; Levin et al., 2011), showing that the Pnma phase is the equilibrium structure at room temperature for a moderate level of doping Nd. That is the main reason why BNFO was chosen to investigate energy storage properties at room temperature in Ref. (Xu et al., 2017).
Due to the fact that energy density relies on the applied electric field and polarization, the electric fields considered for BNFO solid solutions have been rescaled by a factor of 1/23, so that the computational P-E loop is in good agreement with measurements (Xu et al., 2017). Figure 3 displays the P-E hysteresis curves for four different applied directions of the field (namely, the pseudocubic [001], [100], [110], and [111] directions) for Nd composition changing from 0.4 to 1.0, at room temperature. Note that all the considered compositions adopt the Pnma phase at 300 K under zero field. The polarization increases smoothly within the AFE phase under a small electric field and then abruptly jumps up at the AFE-FE phase transition for fields applied along the pseudocubic [001], [100], [110], and [111] directions, respectively.
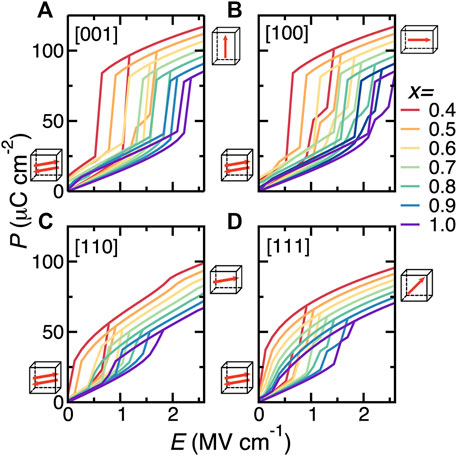
FIGURE 3. (A–D) P-E hysteresis curves at 300 K for electric fields applied along the pseudocubic [001], [100], [110], and [111] directions, respectively, in Bi1−xNdxFeO3 solid solutions for Nd composition ranging between 0.4 and 1.0. Reprinted figure with permission from (Xu et al., 2017). Copyright 2017 Springer Nature.
Let us now focus on the energy density and efficiency, which can be obtained from the P-E curves from Figure 3. Figures 4A,B show the results obtained for different compositions and electric field orientations, using a maximal applied electric field of Emax = 2.6 MV/cm. The energy density for fields applied along the [001] direction gives the largest values in magnitude. In contrast, the smallest energy densities in Figure 4A correspond to fields applied along the [111] direction. Figure 4B further shows that the highest efficiency corresponds to the electric field applied along the [110] direction.
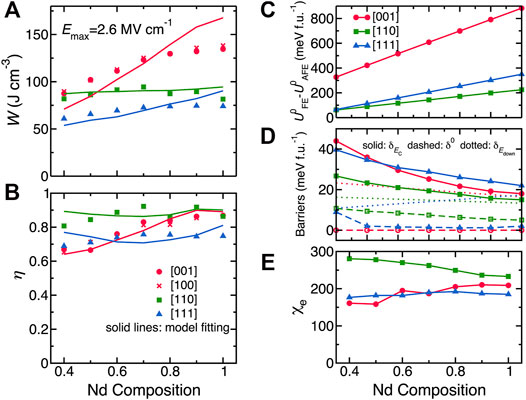
FIGURE 4. (A,B) Energy density and efficiency in Bi1−xNdxFeO3 solid solutions with Nd composition ranging between 0.4 and 1.0 for electric fields applied along the pseudocubic [001], [100], [110], and [111] directions, with the maximum applied electric field being 2.6 MV/cm. The discrete data are calculated from the effective Hamiltonian MC simulations while the solid lines represent the fit of the MC data by the simple model mentioned in the text. (C–E) Model parameters versus various compositions for different field’s orientations. Reprinted figure with permission from (Xu et al., 2017). Copyright 2017 Springer Nature.
Three compositions (x = 0.5, 0.7, and 1.0) were considered for the electric field applied along the [001] direction, and one composition of x = 0.5 has been selected for the field along the [110] direction in BNFO solid solutions. The energy storage-related results are shown in Figure 5 [note that the intrinsic breakdown field of Emax = 4.37 MV/cm was considered, which is estimated based on an empirical relation (Wang, 2006) that takes into account the experimental band gap of BiFiO3 (Ihlefeld et al., 2008)]. More precisely, the related P-E hysteresis curves are shown in Figure 5A, while Figure 5B displays the energy density of BNFO obtained from the P-E hysteresis curves of Figure 5A. The energy densities of other experimentally reported materials are shown for comparison and are smaller than that of BNFO systems. The predicted large energy densities (efficiencies) are 164, 191, and 213 J/cm3 (76%, 88%, and 91%), respectively for x = 0.5, 0.7, and 1, respectively, for the electric field applied along the [001] direction. Similarly, both energy density and efficiency (161 J/cm3 and 91%) of BNFO with x = 0.5 are very large for the field applied along the [110] direction as well. Note also that BNFO superlattices were not numerically found to have different energy storage properties when compared with disordered BNFO systems. These large energy densities and efficiencies therefore indicate that BNFO systems are promising for energy storage.
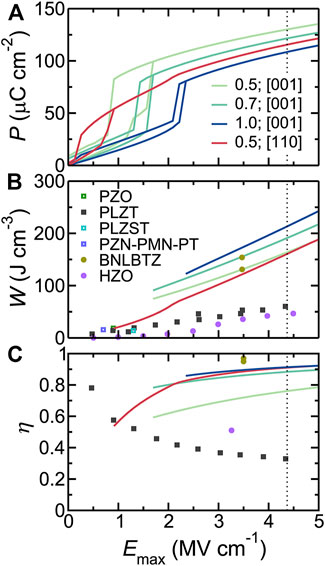
FIGURE 5. (A) P-E hysteresis curves for selected compositions in Bi1−xNdxFeO3 solid solutions. (B) The energy density as a function of the maximum applied electric field (solid lines). The symbols represent the experimental data from different types of materials. (C) The efficiency versus the maximum applied electric field. The dotted vertical line denotes the estimated intrinsic breakdown field for BiFeO3. Reprinted figure with permission from (Xu et al., 2017). Copyright 2017 Springer Nature.
In order to understand the energy storage results of Figure 4, a simple and general model was proposed for AFE materials, which gives
where
Figure 2B shows that the critical field EC and FE polarization can be expressed in terms of the parameters characterizing the relevant energy landscape of the AFE system, which can be obtained as
The energy difference
where
Interestingly, the energy density and efficiency data obtained by the effective Hamiltonian MC simulations and shown in Figures 4A,B can be well fitted by Eq. 9 and Eq. 10, respectively (the related parameters are shown in Figures 4C–E). These good fits of Figures 4A,B testify the validity of the aforementioned simple model, which can thus be used to understand and analyze energy storage properties for other AFE materials.
Relaxor ferroelectrics have also attracted special attention because of their high energy densities and efficiencies, which is highly promising for energy storage applications. Despite the fact that the highest recoverable energy density was achieved in Ba(ZrxTi1−x)O3 relaxor FE thin films at a sustained high electric field of 3.0 MV/cm (Instan et al., 2017), many questions remain to be addressed. For instance, can the first-principles-based effective Hamiltonian method reproduce the experimental finding of ultrahigh energy density in the lead-free relaxor Ba(ZrxTi1−x)O3 system? What will happen if one considers the epitaxial strain on energy storage properties? In particular, could such ultrahigh energy density be understood by a simple phenomenological model? To the best of our knowledge, the effect of the direction of the applied electric field on energy density and efficiency is also presently unknown in Ba(ZrxTi1−x)O3 relaxor ferrolectrics, both in their bulk and epitaxial films.
This section is to answer all these questions by using the first-principles-based effective Hamiltonian approach in Ba(Zr0.5Ti0.5)O3 bulk and epitaxial films (Jiang et al., 2022). The effective Hamiltonian is described in Section 2.3.
Let us focus on the P-E curves in BZT bulk. Note that the simulated electric field is larger than the corresponding experimental one by a factor of 100, which is typical for atomistic effective Hamiltonian simulations (Xu et al., 2017; Jiang et al., 2018) because structural defects are not considered in the theory. A maximum applied field of 3.0 MV/cm was considered, which corresponds to the experimentally applied one in Ba(ZrxTi1−x)O3 thin films (Instan et al., 2017). Figures 6A–C display the polarization versus electric field curves at 300 K for three different fields’ directions (namely, electric fields applied along the pseudocubic [001], [110], and [111] directions, respectively) in BZT bulk. An ideal energy efficiency of 100% is predicted due to the complete reversibility of the charging and discharging processes of the P-E curves.
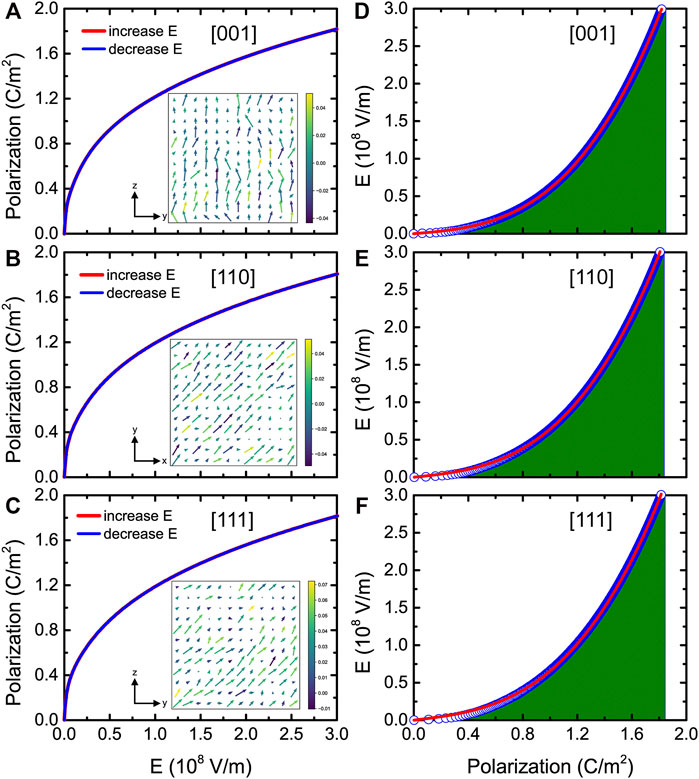
FIGURE 6. (A–C) P-E hysteresis curves at room temperature for fields applied along the pseudocubic [001], [110], and [111] directions, respectively, in BZT bulk. The insets show the dipolar configurations in a given (y, z) or (x, y) plane at room temperature for an applied field equal to 0.1 MV/cm. (D–F) E-P data at room temperature for fields applied along three different directions. The green areas denote the energy densities and the solid red lines denote the fit of the MC data by the phenomenological model. Reprinted figure with permission from (Jiang et al., 2022). Copyright 2022 by the American Physical Society.
The local dipole configurations of Figures 6A–C show that the dipoles align along the electric field’s applied direction. Figures 6D–F display the electric field versus polarization (E-P) data for fields applied along the pseudocubic [001], [110], and [111] directions at room temperature, and the green areas represent the energy densities.
The energy density can thus be extracted from the P-E or E-P data for different temperatures and applied field directions. Figure 7A shows that the energy densities linearly increase with temperature for electric fields applied along the [001], [110], and [111] pseudocubic directions. Ultrahigh energy densities are predicted (between 147 and 155 J/cm3), which agree well with experimental values in Ba(ZrxTi1−x)O3 thin films (Instan et al., 2017).
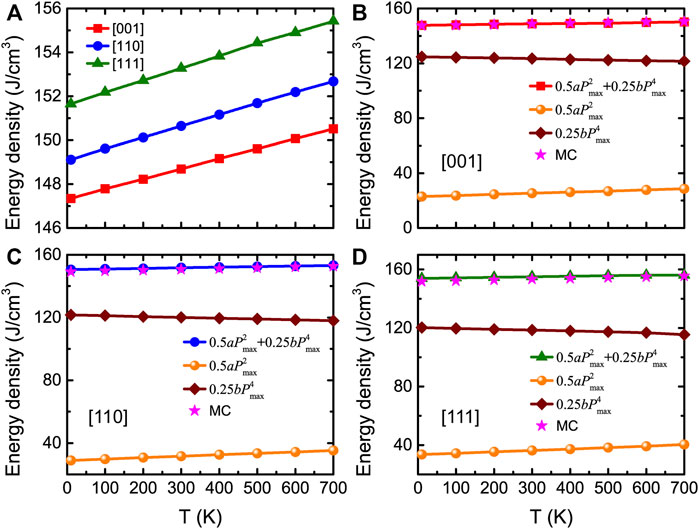
FIGURE 7. (A) Energy density obtained from MC data as a function of temperature for fields applied along three different directions at Emax = 3.0 MV/cm, in BZT bulk. (B–D) Total and decomposed energy densities obtained from Eq. 13 as a function of temperature at Emax = 3.0 MV/cm for three different applied field directions, respectively. Stars display the MC data for comparison. Reprinted figure with permission from (Jiang et al., 2022). Copyright 2022 by the American Physical Society.
In order to understand the origin of these energy storage results, a simple Landau-type free energy model was used to describe nonlinear behaviors (Jiang et al., 2021a) and for which, the free energy is given by
where a and b are coefficients of the quadratic and quartic polarization terms, respectively. At equilibrium condition, one must have
The numerical E-P data for all considered temperatures and field directions were found to be well fitted by Eq. 12, which allows to extract the important a and b parameters. Figures 8A–C show the related a and b parameters as a function of temperature for electric fields applied along the [001], [110], and [111] directions, respectively, at a maximal applied electric field equal to 3.0 MV/cm. The a parameter linearly increases with temperature, and the b parameter only slightly linearly decreases with temperature for the three different field directions. These a and b coefficients are involved in the expression of the energy density as (Jiang et al., 2021a)
where Pmax is the maximum polarization at the maximal applied electric field of Emax. Note that Pmax can be obtained from the MC simulations or via Eq. 12 taken at Emax. Figure 8D shows that both methods give nearly identical results. Eq. 13 therefore indicates that only a, b, and Pmax completely dominate the behaviors and values of the energy density but also tells us that the energy density can be decomposed into two rather simple terms, namely,
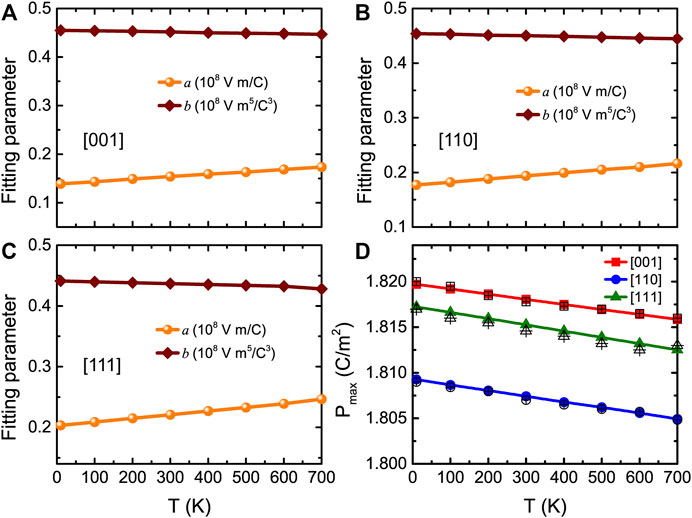
FIGURE 8. (A–C) Temperature dependence of fitting parameters a and b for fields applied along three different directions, with a maximal applied electric field being equal to 3.0 MV/cm, in BZT bulk. (D) Pmax obtained from MC simulations (filled symbols) and Eq. 12 (open symbols) as a function of temperature at Emax = 3.0 MV/cm, for fields applied along three different directions in BZT bulk. Reprinted figure with permission from (Jiang et al., 2022). Copyright 2022 by the American Physical Society.
Figures 7B–D show the total and decomposed energy densities calculated from Eq. 13, along with the total energy densities obtained from the MC data (with a maximal field of 3.0 MV/cm). One can clearly see that, for any considered temperature, the energy densities obtained from the MC simulations provide nearly identical results than those given by Eq. 13.
Let us now focus on the energy storage performance for (001) BZT films versus different epitaxial strains. Figures 9A–C display the P-E curves at room temperature and zero strain for fields applied along the pseudocubic [001], [110], and [111] directions, respectively. Three types of P-E data are shown in Figure 9C, which correspond to the [110] in-plane component of the polarization Pin, [001] out-of-plane component of the polarization Pout, and the total polarization Ptot. Moreover, Figures 9D–F show the E-P data at zero strain and room temperature for fields applied along three different directions, which can be well fitted by Eq. 12 (solid red lines). Figure 10A reports the energy density as a function of strain at 300 K and Emax = 3.0 MV/cm for electric fields applied along the [001], [110], and [111] directions, respectively. Note that the [111]in and [111]out notations distinguish between the in-plane and out-of-plane components of the polarization when the field is applied along the [111] direction. Figure 10A shows that the energy densities for all considered strains are still large in BZT films (basically larger than 100 J/cm3).
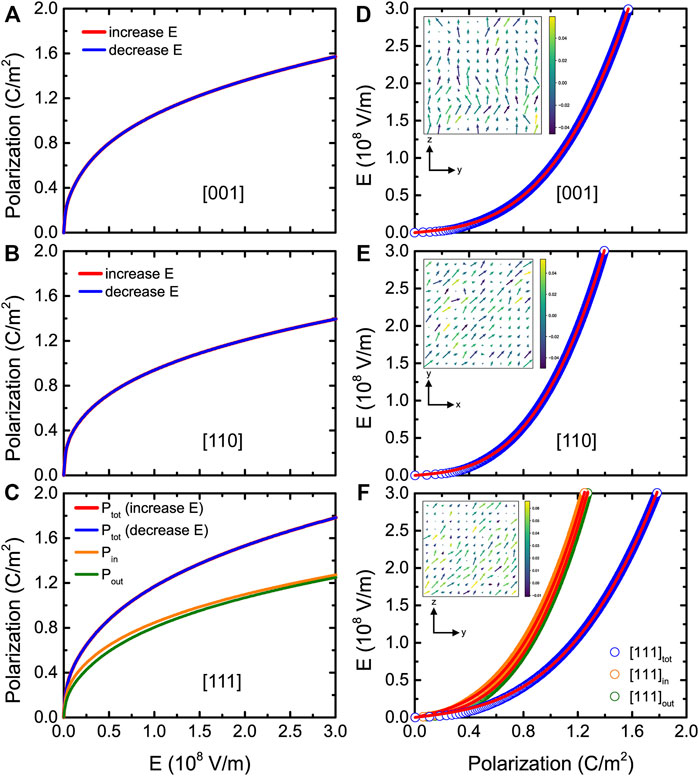
FIGURE 9. (A-C) P-E hysteresis curves at 300 K and 0% strain for fields applied along the pseudocubic [001], [110], and [111] directions, respectively, in (001) BZT films. (D-F) E-P data at 300 K and 0% strain for fields applied along three different directions. Note that the "in" and "out" notations distinguish between in-plane and out-of-plane components of the polarization when the field is applied along the [111] direction. The insets show the dipolar configurations in a given (y, z) or (x, y) plane at 300 K and 0% strain for an applied field equal to 0.1 MV/cm. Reprinted figure with permission from (Jiang et al., 2022). Copyright 2022 by the American Physical Society.
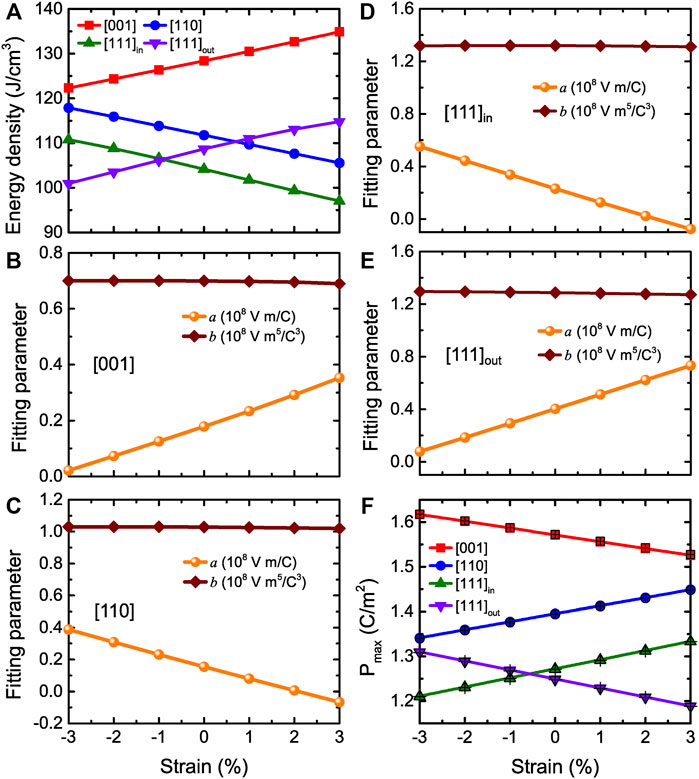
FIGURE 10. (A) Energy density obtained from MC data as a function of strain at 300 K and Emax = 3.0 MV/cm for fields applied three different directions (that is along the [001], [110], and [111] directions, respectively) in BZT films. [111]in versus [111]out components are related to the field applied along [111] direction. (B,C) Same as Figures 8A,B but as a function of strain at room temperature in BZT films. (D,E) display the [111]in (in-plane) and [111]out (out-of-plane) fitting parameters a and b in case of the field applied along the [111] direction, respectively. (F) Same as Figure 8D but versus strain at room temperature in (001) BZT films. Reprinted figure with permission from (Jiang et al., 2022). Copyright 2022 by the American Physical Society.
In order to understand the origin of the energy density results in BZT films, we can also use Eq. 12 and Eq. 13. Figures 10B–E display the fitting parameters a and b, while Figure 10F shows the Pmax obtained from both MC simulations and Eq. 12 at Emax as a function of strain. The a parameter linearly increases with strain ranging between −3% and +3%, while Pmax linearly decreases with strain when fields are applied along the [001] direction. In contrast, the a parameter linearly decreases with strain while Pmax linearly increases with strain when the field is along the [110] direction. The a parameter and Pmax related to the in-plane and out-of-plane components for electric fields applied along the [111] direction have the same qualitative behavior as for fields along the [110] and [111] directions, respectively. Note that for all three field directions, the b parameter of Figures 10B–E is basically a constant with strain.
The behaviors of a, b, and Pmax allow us to understand and analyze the results of the energy density in Figure 10A. The total and decomposed energy densities obtained from Eq. 13 are shown in Figure 11, where the stars display the MC data for the total energy densities for comparison. Figure 11A shows that the first term of
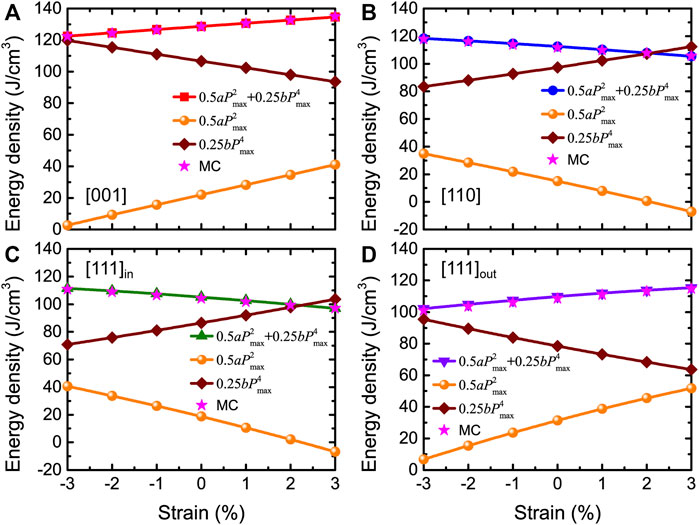
FIGURE 11. (A–D) Total and decomposed energy densities obtained from Eq. 13 as a function of strain for fields applied along [001], [110], and [111] (in-plane versus out-of-plane components of the polarization) directions, at Emax = 3.0 MV/cm and 300 K in BZT films. Stars display the MC data of Figure 10A for comparison. Reprinted figure with permission from (Jiang et al., 2022). Copyright 2022 by the American Physical Society.
In order to improve the energy storage performance, it is timely and important to wonder if there are some multifunctional materials awaiting to be discovered/revealed that have 1) ultrahigh energy storage density; 2) optimal 100% energy efficiency; and 3) giant strain levels when under electric fields. Note that a 100% energy efficiency automatically implies that the transition from the paraelectric/AFE to FE states is fully continuous and reversible. To maximize both energy density and efficiency, one can, for example, imagine a nonlinear dielectric material that exhibits large polarization under feasible high electric fields while being initially in a nonpolar phase at a zero field, and with the charging and discharging processes being completely reversible. The III–V semiconductor-based systems made by mixing AlN and ScN to form Al1−xScxN solid solutions or AlN/ScN superlattices are attractive as these systems can have very large polarization (on the order of 1.0 C/m2) (Jiang et al., 2019b; Fichtner et al., 2019; Noor-A-Alam et al., 2019; Yasuoka et al., 2020; Yazawa et al., 2021), and an FE phase is energetically close to a nonpolar phase (such that the ground state may be tuned by a physical handle) (Jiang et al., 2019b), which is highly promising for the energy storage performance. The aim of Ref (Jiang et al., 2021a) was to demonstrate that ultrahigh energy storage performance can be achieved in 1 × 1 AlN/ScN superlattices, by using first-principles calculations (the method is described in Section 2.4).
Let us now focus on some physical properties of 1 × 1 AlN/ScN superlattices under different epitaxial strains. Previous studies have predicted the existence of different strain-induced regions in 1 × 1 AlN/ScN superlattices (Jiang et al., 2019b), including a wurtzite-derived structure (polar P3m1 space group with a polarization along the c-axis) and a hexagonal-derived phase (paraelectric
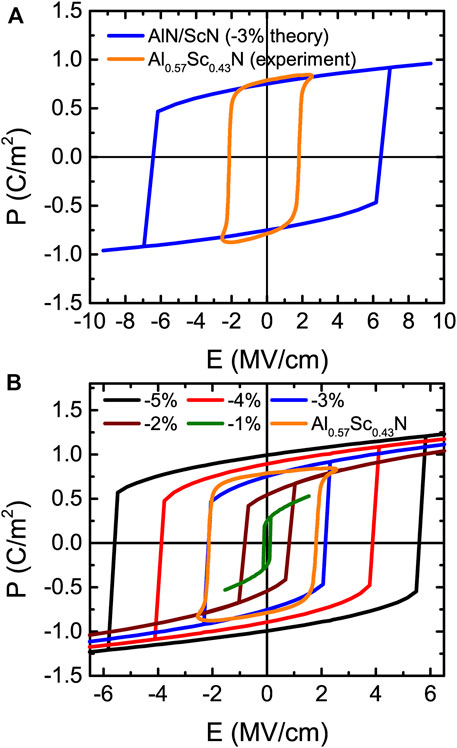
FIGURE 12. (A) P-E loops of 1 × 1 AlN/ScN superlattices for strain at −3% for the actually applied theoretical electric fields and experimentally measured in Al0.57Sc0.43N film. (B) P-E hysteresis loops for different strains with the ground state being a wurtzite-derived phase in 1 × 1 AlN/ScN superlattices (these electric fields are divided by a factor of 3). Reprinted figure with permission from (Jiang et al., 2021a). Copyright 2021 by the American Physical Society.
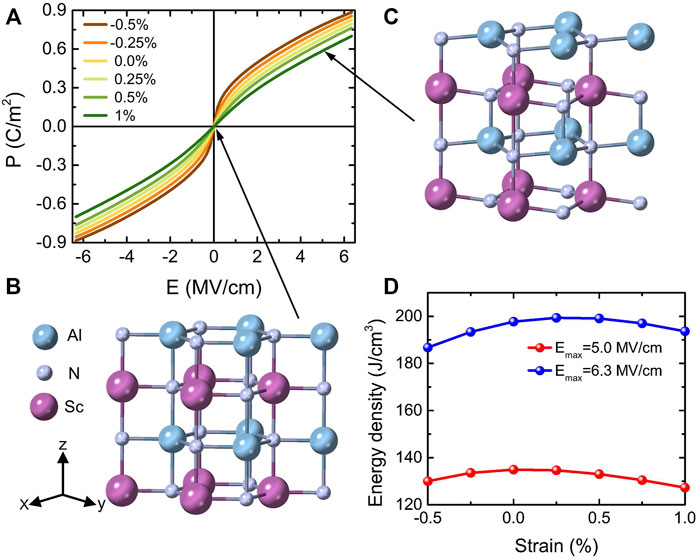
FIGURE 13. (A) P-E hysteresis curves for different strains with the ground state being a hexagonal-derived phase in 1 × 1 AlN/ScN superlattices. (B,C) represent the crystal structures of 1% tensile strain under electric fields of 0 and 5 MV/cm, respectively. (D) Energy density as a function of strain for two different maximum fields of 5.0 and 6.3 MV/cm. Reprinted figure with permission from (Jiang et al., 2021a). Copyright 2021 by the American Physical Society.
Several features are remarkable in Figure 12B and Figure 13A. First of all, the P-E loops of Figure 12B are those typical of ferroelectrics with first-order transitions (between two wurtzite-derived structures) for some values of polarization changing of sign under the application of initially opposite electric fields, but with the magnitude of the critical fields of such transitions being very strongly strain dependent. For example, the magnitude of these critical fields is 5.8 MV/cm versus 0.2 MV/cm for strains of −5% and −1%, respectively. Such a strong dependency of these fields has also been observed but with respect to the Sc composition in Al1−xScxN solid solutions (Fichtner et al., 2019). Consequently, varying composition in these solid solutions or changing the strain for a fixed alloy or superlattice should yield similar physics and results. Secondly and strikingly, Figure 13A reveals a nonlinear behavior of the polarization for small fields (starting from the paraelectric
Let us now focus on energy storage properties for the 1 × 1 AlN/ScN superlattices for misfit strains changing from −0.5% to +1%. Figure 13A shows that the energy efficiency is 100% because the charging and discharging processes are completely reversible. Regarding the calculated energy density, Figure 13D reports it as a function of epitaxial strain ranging between −0.5% and +1%, for electric fields up to two different values, namely, Emax = 5 MV/cm, which has been experimentally realized (Fichtner et al., 2019), and Ebreak = 6.3 MV/cm which has been estimated as the intrinsic breakdown field. The energy density can reach very large values, that is, it varies from 127 to 135 J/cm3 and from 187 to 200 J/cm3 when using 5 and 6.3 MV/cm for the maximal applied field, respectively. All these large energy densities with the ideal efficiency of 100% thus indicate that the 1 × 1 AlN/ScN superlattices are highly promising for high-power energy storage applications.
To understand these energy storage results of Figure 13D, we can also use Eqs 11–13 to describe the behaviors in initially nonpolar 1 × 1 AlN/ScN superlattices. Figure 14A displays the E-P data for electric field applied along the pseudocubic [001] direction at a 0.25% strain. The yellow area represents the energy density. The E-P data can be well fitted by Eq. 12 for all the considered strains ranging from −0.5 to +1%.
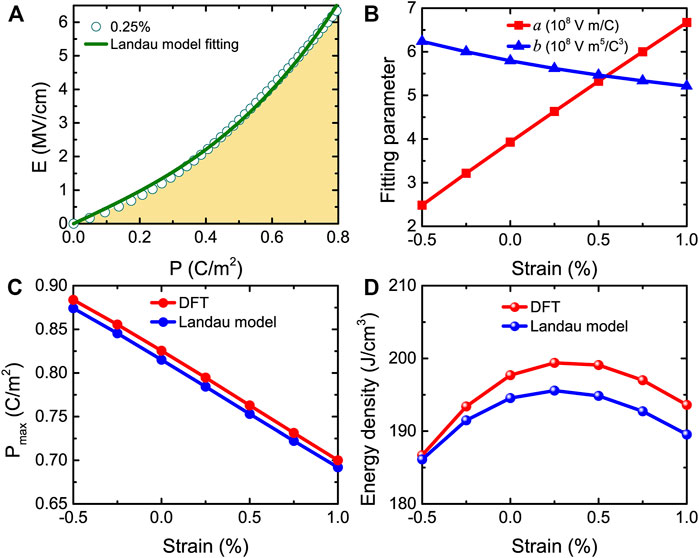
FIGURE 14. (A) E-P data for the strain at 0.25%, with the yellow area showing the energy density (the solid green line represents the fit of the DFT results by Eq. 12). (B) Evolution with strain of fitting parameters a and b. (C,D) The strain dependence of Pmax and energy density obtained from DFT and Eq. 13. These data correspond to Emax = 6.3 MV/cm. Reprinted figure with permission from (Jiang et al., 2021a). Copyright 2021 by the American Physical Society.
Figure 14B displays the a and b fitting parameters versus strain for fields up to the intrinsic breakdown field Ebreak = 6.3 MV/cm. It is worth noting that the a parameter linearly increases with strain ranging from −0.5 to +1%. In contrast, the b parameter linearly decreases with strain. Note that the change in a is much larger in percentage than the change in b. Figure 14C shows the maximum polarization Pmax as a function of strain obtained from DFT calculations and the Landau model at Emax = 6.3 MV/cm. For all considered strains, the DFT and Landau model provide nearly identical results. In order to understand the results of Figure 13D and Eq. 13 is used to obtain the energy density at Emax = 6.3 MV/cm for strain ranging between −0.5 and +1%. Figure 14D shows that the Landau model and DFT-obtained energy density behave in a similar qualitative and even quantitative way with the strain, implying that the Landau model can be trusted.
Once again, Eq. 13 indicates that the energy density can be decomposed into two terms. The first term relies on the product of the fitting a parameter and
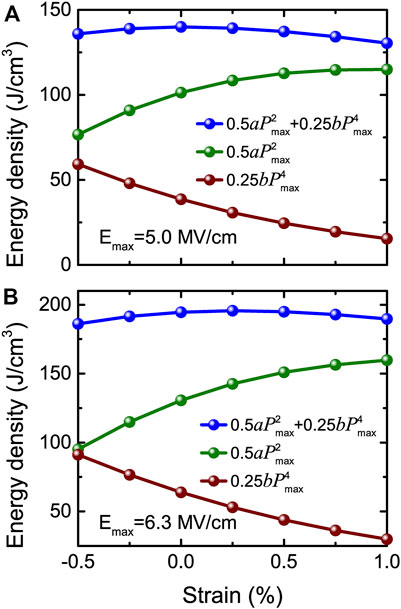
FIGURE 15. Total and decomposed energy density obtained from Eq. 13 versus strain at (A) Emax = 5.0 MV/cm and (B) Emax = 6.3 MV/cm, respectively. Reprinted figure with permission from (Jiang et al., 2021a). Copyright 2021 by the American Physical Society.
This review summarizes and discusses the energy storage properties in ferroelectrics, lead-free antiferroelectrics, relaxor ferroelectrics, and epitaxial AlN/ScN superlattices using direct first-principles and first-principles-based effective Hamiltonian schemes. Ultrahigh energy densities and efficiencies are predicted in 1) rare-earth substituted BiFeO3 AFE compounds; 2) bulks and films made of the lead-free Ba(Zr0.5Ti0.5)O3 relaxor ferroelectrics; and 3) epitaxial AlN/ScN superlattices with initially nonpolar states. Note that an ideal 100% efficiency is predicted in Ba(Zr0.5Ti0.5)O3 relaxor ferroelectrics and epitaxial AlN/ScN superlattices due to the second-order character of the field-induced transition toward an FE state. For the studied AFE materials, a simple phenomenological model was proposed to describe the energy density and efficiency, which should be useful in the search for other high energy storage performance in other antiferroelectrics. Another simple Landau model was developed to analyze and understand the energy storage results in BZT relaxor ferroelectrics and epitaxial AlN/ScN superlattices, which reproduces very well the numerical results. The proposed Landau model can also be easily employed for other relaxor ferroelectrics and nonlinear dielectrics, providing insight that there is a trade-off to maximize the energy density: the system should neither be too close nor too far from an FE phase transition.
Note also that one very recent work using high-throughput second-principles calculations (Aramberri et al., 2020) indicated that FE/paraelectric superlattices can be promising for energy storage as well. Other systems can also be investigated by first-principles-based effective Hamiltonian methods, or other ab initio techniques, in the near future for energy storage. Examples include the prototypical relaxor ferroelectrics Pb(Mg1/3Nb2/3)O3 and Pb(Mg1/3Nb2/3)O3-PbTiO3, and (Bi,R)FeO3 antiferroelectrics with R being a rare-earth species different from Nd. We thus hope that this review is useful to the scientific community and deepens the field of energy storage.
ZJ wrote the original manuscript. LB supervised the study. BX, SP, JÍ, HX and LB revised the manuscript. All authors contributed to the interpretation of the results.
This work is supported by the National Natural Science Foundation of China (Grant No. 11804138), Shandong Provincial Natural Science Foundation (Grant No. ZR2019QA008), and “Young Talent Support Plan” of Xi’an Jiaotong University (Grant No. WL6J004). BX acknowledges financial support from National Natural Science Foundation of China under Grant No. 12074277 and Natural Science Foundation of Jiangsu Province (BK20201404), the startup fund from Soochow University, and the support from Priority Academic Program Development (PAPD) of Jiangsu Higher Education Institutions. JÍ acknowledges funding from the Luxembourg National Research Fund through the CORE program (Grant No. FNR/C18/MS/12705883 REFOX, JÍ). HX is supported by the National Natural Science Foundation of China (Grants No. 11825403 and 11991061). SP and LB acknowledge the Office of Naval Research for the support under Grant No. N00014-21-1-2086. LB also acknowledges the Vannevar Bush Faculty Fellowship Grant No. N00014-20-1-2834 from the Department of Defense and the ARO Grant No. W911NF-21-1-0113.
The authors declare that the research was conducted in the absence of any commercial or financial relationships that could be construed as a potential conflict of interest.
All claims expressed in this article are solely those of the authors and do not necessarily represent those of their affiliated organizations, or those of the publisher, the editors and the reviewers. Any product that may be evaluated in this article, or claim that may be made by its manufacturer, is not guaranteed or endorsed by the publisher.
Akbarzadeh, A. R., Prosandeev, S., Walter, E. J., Al-Barakaty, A., and Bellaiche, L. (2012). Finite-Temperature Properties of Ba(Zr,Ti)O3 Relaxors from First Principles. Phys. Rev. Lett. 108, 257601. doi:10.1103/physrevlett.108.257601
Aramberri, H., Fedorova, N. S., and Íñiguez, J. (2020) Ferroelectric/paraelectric Superlattices for Energy Storage, arXiv:2112.00745.
Burns, G., and Dacol, F. H. (1983). Crystalline Ferroelectrics with Glassy Polarization Behavior. Phys. Rev. B 28, 2527–2530. doi:10.1103/physrevb.28.2527
Chauhan, A., Patel, S., Vaish, R., and Bowen, C. (2015). Anti-Ferroelectric Ceramics for High Energy Density Capacitors. Materials 8, 8009–8031. doi:10.3390/ma8125439
Chen, L., Xu, C., Tian, H., Xiang, H., Íñiguez, J., Yang, Y., et al. (2019). Electric-Field Control of Magnetization, Jahn-Teller Distortion, and Orbital Ordering in Ferroelectric Ferromagnets. Phys. Rev. Lett. 122, 247701. doi:10.1103/physrevlett.122.247701
Chu, B., Zhou, X., Ren, K., Neese, B., Lin, M., Wang, Q., et al. (2006). A Dielectric Polymer with High Electric Energy Density and Fast Discharge Speed. Science 313, 334–336. doi:10.1126/science.1127798
Cross, L. E. (1994). Relaxorferroelectrics: An Overview. Ferroelectrics 151, 305–320. doi:10.1080/00150199408244755
Dkhil, B., Gemeiner, P., Al-Barakaty, A., Bellaiche, L., Dul’kin, E., Mojaev, E., et al. (2009). Intermediate Temperature Scale T* in lead-based Relaxor Systems. Phys. Rev. B 80, 064103. doi:10.1103/physrevb.80.064103
Fichtner, S., Wolff, N., Lofink, F., Kienle, L., and Wagner, B. (2019). AlScN: A III-V Semiconductor Based Ferroelectric. J. Appl. Phys. 125, 114103. doi:10.1063/1.5084945
Gonze, X., Beuken, J.-M., Caracas, R., Detraux, F., Fuchs, M., Rignanese, G.-M., et al. (2002). First-principles Computation of Material Properties: the ABINIT Software Project. Comput. Mater. Sci. 25, 478–492. doi:10.1016/s0927-0256(02)00325-7
Hamann, D. R. (2013). Optimized Norm-Conserving Vanderbilt Pseudopotentials. Phys. Rev. B 88, 085117. doi:10.1103/physrevb.88.085117
Hao, X. (2013). A Review on the Dielectric Materials for High Energy-Storage Application. J. Adv. Dielect. 03, 1330001. doi:10.1142/s2010135x13300016
Hou, C., Huang, W., Zhao, W., Zhang, D., Yin, Y., and Li, X. (2017). Ultrahigh Energy Density in SrTiO3 Film Capacitors. ACS Appl. Mater. Inter. 9, 20484–20490. doi:10.1021/acsami.7b02225
Ihlefeld, J. F., Podraza, N. J., Liu, Z. K., Rai, R. C., Xu, X., Heeg, T., et al. (2008). Optical Band gap of BiFeO3 Grown by Molecular-Beam Epitaxy. Appl. Phys. Lett. 92, 142908. doi:10.1063/1.2901160
Instan, A. A., Pavunny, S. P., Bhattarai, M. K., and Katiyar, R. S. (2017). Ultrahigh Capacitive Energy Storage in Highly Oriented Ba(ZrxTi1-x)O3 Thin Films Prepared by Pulsed Laser Deposition. Appl. Phys. Lett. 111, 142903. doi:10.1063/1.4986238
Jiang, Z., Paillard, C., Vanderbilt, D., Xiang, H., and Bellaiche, L. (2019). Designing Multifunctionality via Assembling Dissimilar Materials: Epitaxial AlN/ScN Superlattices. Phys. Rev. Lett. 123, 096801. doi:10.1103/PhysRevLett.123.096801
Jiang, Z., Paillard, C., Xiang, H., and Bellaiche, L. (2020). Linear versus Nonlinear Electro-Optic Effects in Materials. Phys. Rev. Lett. 125, 017401. doi:10.1103/PhysRevLett.125.017401
Jiang, Z., Nahas, Y., Prokhorenko, S., Prosandeev, S., Wang, D., Íñiguez, J., et al. (2018). Giant Electrocaloric Response in the Prototypical Pb(Mg,Nb)O3 Relaxor Ferroelectric from Atomistic Simulations. Phys. Rev. B 97, 104110. doi:10.1103/physrevb.97.104110
Jiang, Z., Prokhorenko, S., Prosandeev, S., Nahas, Y., Wang, D., Íñiguez, J., et al. (2017). Electrocaloric Effects in the lead-free Ba(Zr,Ti)O3 Relaxor Ferroelectric from Atomistic Simulations. Phys. Rev. B 96, 014114. doi:10.1103/physrevb.96.014114
Jiang, Z., Prosandeev, S., and Bellaiche, L. (2022). Energy Storage in lead-free Ba(Zr,Ti)O3 Relaxor Ferroelectrics: Large Densities and Efficiencies and Their Origins. Phys. Rev. B 105, 024102. doi:10.1103/physrevb.105.024102
Jiang, Z., Xu, B., Prosandeev, S., Nahas, Y., Prokhorenko, S., Íñiguez, J., et al. (2021). Electrocaloric Effects in Multiferroics. Phys. Rev. B 103, L100102. doi:10.1103/physrevb.103.l100102
Jiang, Z., Xu, B., Xiang, H., and Bellaiche, L. (2021). Ultrahigh Energy Storage Density in Epitaxial AlN/ScN Superlattices. Phys. Rev. Mater. 5, L072401. doi:10.1103/physrevmaterials.5.l072401
Kim, J., Saremi, S., Acharya, M., Velarde, G., Parsonnet, E., Donahue, P., et al. (2020). Ultrahigh Capacitive Energy Density in Ion-Bombarded Relaxor Ferroelectric Films. Science 369, 81–84. doi:10.1126/science.abb0631
King-Smith, R. D., and Vanderbilt, D. (1993). Theory of Polarization of Crystalline Solids. Phys. Rev. B 47 (R), 1651–1654. doi:10.1103/physrevb.47.1651
Kornev, I. A., Bellaiche, L., Janolin, P.-E., Dkhil, B., and Suard, E. (2006). Phase Diagram of Pb(Zr,Ti)O3 Solid Solutions from First Principles. Phys. Rev. Lett. 97, 157601. doi:10.1103/physrevlett.97.157601
Kornev, I. A., Lisenkov, S., Haumont, R., Dkhil, B., and Bellaiche, L. (2007). Finite-Temperature Properties of Multiferroic BiFeO3. Phys. Rev. Lett. 99, 227602. doi:10.1103/physrevlett.99.227602
Levin, I., Karimi, S., Provenzano, V., Dennis, C. L., Wu, H., Comyn, T. P., et al. (2010). Reorientation of Magnetic Dipoles at the Antiferroelectric-Paraelectric Phase Transition of Bi1−xNdxFeO3 (0.15≤x≤0.25). Phys. Rev. B 81, 020103(R). doi:10.1103/physrevb.81.020103
Levin, I., Tucker, M. G., Wu, H., Provenzano, V., Dennis, C. L., Karimi, S., et al. (2011). Displacive Phase Transitions and Magnetic Structures in Nd-Substituted BiFeO3. Chem. Mater. 23, 2166–2175. doi:10.1021/cm1036925
Li, Q., Chen, L., Gadinski, M. R., Zhang, S., Zhang, G., Li, H. U., et al. (2015). Flexible High-Temperature Dielectric Materials from Polymer Nanocomposites. Nature 523, 576–579. doi:10.1038/nature14647
Lu, J., Chen, G., Luo, W., Íñiguez, J., Bellaiche, L., and Xiang, H. (2019). Ferroelectricity with Asymmetric Hysteresis in Metallic LiOsO3 Ultrathin Films. Phys. Rev. Lett. 122, 227601. doi:10.1103/physrevlett.122.227601
Luo, B., Wang, X., Tian, E., Wu, L., and Li, L. (2016). First-principles Effective Hamiltonian Simulation of ABO3-type Perovskite Ferroelectrics for Energy Storage Application. J. Appl. Phys. 120, 074106. doi:10.1063/1.4961204
Nishimatsu, T., Iwamoto, M., Kawazoe, Y., and Waghmare, U. V. (2010). First-principles Accurate Total Energy Surfaces for Polar Structural Distortions of BaTiO3, PbTiO3, and SrTiO3: Consequences for Structural Transition Temperatures. Phys. Rev. B 82, 134106. doi:10.1103/physrevb.82.134106
Nishimatsu, T., Waghmare, U. V., Kawazoe, Y., and Vanderbilt, D. (2008). Fast Molecular-Dynamics Simulation for Ferroelectric Thin-Film Capacitors Using a First-Principles Effective Hamiltonian. Phys. Rev. B 78, 104104. doi:10.1103/physrevb.78.104104
Noor-A-Alam, M., Z. Olszewski, O., and Nolan, M. (2019). Ferroelectricity and Large Piezoelectric Response of AlN/ScN Superlattice. ACS Appl. Mater. Inter. 11, 20482–20490. doi:10.1021/acsami.8b22602
Nunes, R. W., and Gonze, X. (2001). Berry-phase Treatment of the Homogeneous Electric Field Perturbation in Insulators. Phys. Rev. B 63, 155107. doi:10.1103/physrevb.63.155107
Nunes, R. W., and Vanderbilt, D. (1994). Real-Space Approach to Calculation of Electric Polarization and Dielectric Constants. Phys. Rev. Lett. 73, 712–715. doi:10.1103/physrevlett.73.712
Nye, J. F. (1985). Physical Properties of Crystals: Their Representation by Tensors and Matrices. Oxford: Oxford University Press.
Palneedi, H., Peddigari, M., Hwang, G.-T., Jeong, D.-Y., and Ryu, J. (2018). High-performance Dielectric Ceramic Films for Energy Storage Capacitors: Progress and Outlook. Adv. Funct. Mater. 28, 1803665. doi:10.1002/adfm.201803665
Pan, H., Lan, S., Xu, S., Zhang, Q., Yao, H., Liu, Y., et al. (2021). Ultrahigh Energy Storage in Superparaelectric Relaxor Ferroelectrics. Science 374, 100–104. doi:10.1126/science.abi7687
Pan, H., Li, F., Liu, Y., Zhang, Q., Wang, M., Lan, S., et al. (2019). Ultrahigh-energy Density lead-free Dielectric Films via Polymorphic Nanodomain Design. Science 365, 578–582. doi:10.1126/science.aaw8109
Peng, B., Zhang, Q., Li, X., Sun, T., Fan, H., Ke, S., et al. (2015). Giant Electric Energy Density in Epitaxial lead-free Thin Films with Coexistence of Ferroelectrics and Antiferroelectrics. Adv. Electron. Mater. 1, 1500052. doi:10.1002/aelm.201500052
Prateek Thakur, V. K., and Gupta, R. K. (2016). Recent Progress on Ferroelectric Polymer-Based Nanocomposites for High Energy Density Capacitors: Synthesis, Dielectric Properties, and Future Aspects. Chem. Rev. 116, 4260–4317. doi:10.1021/acs.chemrev.5b00495
Prosandeev, S., Wang, D., Akbarzadeh, A. R., Dkhil, B., and Bellaiche, L. (2013). Field-Induced Percolation of Polar Nanoregions in Relaxor Ferroelectrics. Phys. Rev. Lett. 110, 207601. doi:10.1103/physrevlett.110.207601
Prosandeev, S., Wang, D., and Bellaiche, L. (2013). Properties of Epitaxial Films Made of Relaxor Ferroelectrics. Phys. Rev. Lett. 111, 247602. doi:10.1103/physrevlett.111.247602
Resta, R. (1994). Macroscopic Polarization in Crystalline Dielectrics: the Geometric Phase Approach. Rev. Mod. Phys. 66, 899–915. doi:10.1103/revmodphys.66.899
Souza, I., Íñiguez, J., and Vanderbilt, D. (2002). First-Principles Approach to Insulators in Finite Electric Fields. Phys. Rev. Lett. 89, 117602. doi:10.1103/physrevlett.89.117602
Svitelskiy, O., La-Orauttapong, D., Toulouse, J., Chen, W., and Ye, Z.-G. (2005). PbTiO3 addition and Internal Dynamics in Pb(Zn1∕3Nb2∕3)O3 Crystal Studied by Raman Spectroscopy. Phys. Rev. B 72, 172106. doi:10.1103/physrevb.72.172106
Waghmare, U. V., and Rabe, K. M. (1997). Ab Initio statistical Mechanics of the Ferroelectric Phase Transition in PbTiO3. Phys. Rev. B 55, 6161–6173. doi:10.1103/physrevb.55.6161
Waghmare, U. V., Rabe, K. M., Krakauer, H., Yu, R., and Wang, C.-Z. (1998). Effective Hamiltonian for the Ferroelectric Phase Transitions in KNbO3. AIP Conf. Proc. 436, 32.
Wang, D., Bokov, A. A., Ye, Z.-G., Hlinka, J., and Bellaiche, L. (2016). Subterahertz Dielectric Relaxation in lead-free Ba(Zr,Ti)O3 Relaxor Ferroelectrics. Nat. Commun. 7, 11014. doi:10.1038/ncomms11014
Wang, L.-M. (2006). “Relationship between Intrinsic Breakdown Field and Bandgap of Materials,” in 25th International Conference on Microelectronics (Belgrade: IEEE), 576–579.
Wei, X.-K., Dunin-Borkowski, R. E., and Mayer, J. (2021). Structural Phase Transition and In-Situ Energy Storage Pathway in Nonpolar Materials: A Review. Materials 14, 7854. doi:10.3390/ma14247854
Xu, B., Íñiguez, J., and Bellaiche, L. (2017). Designing lead-free Antiferroelectrics for Energy Storage. Nat. Commun. 8, 15682. doi:10.1038/ncomms15682
Xu, B., Wang, D., Íñiguez, J., and Bellaiche, L. (2015). Finite-Temperature Properties of Rare-Earth-Substituted BiFeO3 Multiferroic Solid Solutions. Adv. Funct. Mater. 25, 552–558. doi:10.1002/adfm.201403811
Yang, L., Kong, X., Li, F., Hao, H., Cheng, Z., Liu, H., et al. (2019). Perovskite lead-free Dielectrics for Energy Storage Applications. Prog. Mater. Sci. 102, 72–108. doi:10.1016/j.pmatsci.2018.12.005
Yao, Z., Song, Z., Hao, H., Yu, Z., Cao, M., Zhang, S., et al. (2017). Homogeneous/Inhomogeneous-Structured Dielectrics and Their Energy-Storage Performances. Adv. Mater. 29, 1601727. doi:10.1002/adma.201601727
Yasuoka, S., Shimizu, T., Tateyama, A., Uehara, M., Yamada, H., Akiyama, M., et al. (2020). Effects of Deposition Conditions on the Ferroelectric Properties of (Al1−xScx)N Thin Films. J. Appl. Phys. 128, 114103. doi:10.1063/5.0015281
Yazawa, K., Drury, D., Zakutayev, A., and Brennecka, G. L. (2021). Reduced Coercive Field in Epitaxial Thin Film of Ferroelectric Wurtzite Al0.7Sc0.3N. Appl. Phys. Lett. 118, 162903. doi:10.1063/5.0043613
Zhong, W., Vanderbilt, D., and Rabe, K. M. (1995). First-principles Theory of Ferroelectric Phase Transitions for Perovskites: The Case of BaTiO3. Phys. Rev. B 52, 6301–6312. doi:10.1103/physrevb.52.6301
Keywords: energy storage, ferroelectrics, antiferroelectrics, relaxor ferroelectrics, superlattices
Citation: Jiang Z, Xu B, Prosandeev S, Íñiguez J, Xiang H and Bellaiche L (2022) Electrical Energy Storage From First Principles. Front. Electron. Mater. 2:869803. doi: 10.3389/femat.2022.869803
Received: 05 February 2022; Accepted: 21 February 2022;
Published: 29 March 2022.
Edited by:
Zhonghua Yao, Wuhan University of Technology, ChinaReviewed by:
Shuai Dong, Southeast University, ChinaCopyright © 2022 Jiang, Xu, Prosandeev, Íñiguez, Xiang and Bellaiche. This is an open-access article distributed under the terms of the Creative Commons Attribution License (CC BY). The use, distribution or reproduction in other forums is permitted, provided the original author(s) and the copyright owner(s) are credited and that the original publication in this journal is cited, in accordance with accepted academic practice. No use, distribution or reproduction is permitted which does not comply with these terms.
*Correspondence: Zhijun Jiang, empqaWFuZ0B4anR1LmVkdS5jbg==; L. Bellaiche, bGF1cmVudEB1YXJrLmVkdQ==
Disclaimer: All claims expressed in this article are solely those of the authors and do not necessarily represent those of their affiliated organizations, or those of the publisher, the editors and the reviewers. Any product that may be evaluated in this article or claim that may be made by its manufacturer is not guaranteed or endorsed by the publisher.
Research integrity at Frontiers
Learn more about the work of our research integrity team to safeguard the quality of each article we publish.