 Qingxin Yang
 Jing Chen
 Shengjie Nie
 Chao Liu
 Hong Deng
 Guanglin He
94% of researchers rate our articles as excellent or good
Learn more about the work of our research integrity team to safeguard the quality of each article we publish.
Find out more
ORIGINAL RESEARCH article
Front. Ecol. Evol., 03 April 2025
Sec. Evolutionary and Population Genetics
Volume 13 - 2025 | https://doi.org/10.3389/fevo.2025.1572596
This article is part of the Research TopicForensic Investigative Genetic Genealogy and Fine-Scale Structure of Human Populations, Volume IIView all 4 articles
Biogeographical ancestry inference offers valuable clues for forensic cold cases, but limited information is typically obtained from substructured populations within continental East Asian and Southeast groups. This study presents an integrative genomic dataset of 3,461 individuals from East Asia and Southeast Asia to elucidate the fine-scale population substructure and its role in precision forensic medicine. Six nested panels were developed with increasing ancestry-informative marker (AIM) density (ranging from 50 to 2,000 SNPs) to distinguish fine genetic differences between the six language groups and populations within the Sino-Tibetan language family. We found that the 2000 AIM panel exhibited differentiation efficiency in PCA comparable to that of all loci. Additionally, we constructed a classification machine learning model with an average prediction accuracy of 84%, highlighting the critical role of geographical information in improving model accuracy. Furthermore, we validated the accuracy of the deep learning method Locator in predicting geographical coordinates solely based on genetic information. This work highlights the power of integrating genetic and geographic data with artificial intelligence to refine fine-scale biogeographical ancestry inference, offering more profound insights into population structure in East Asia and Southeast Asia, with significant implications for forensic applications.
Large-scale population-specific genomic cohorts have significantly advanced our understanding of genetic diversity, human history, and the genetic and evolutionary factors influencing complex health and disease phenotypes. Notable initiatives, such as the All of Us Research Program, the NHLBI TOPMed Program, and the UK Biobank, have been pivotal in this progress (Taliun et al., 2021; Rubinacci et al., 2023; Bick et al., 2024). Recent high-coverage genomes from geographically diverse populations in projects such as the expanded 1000 Genomes Project, Human Genomic Diversity Project (HGDP), and GenomeAsia 100K have highlighted distinct demographic histories, patterns of genetic variation, and medically relevant features among different populations (GenomeAsia, 2019; Bergström et al., 2020; Byrska-Bishop et al., 2022). However, the majority of participants in these large-scale cohorts are of European ancestry, underscoring the need for better representation of non-European populations in human genomic research (He et al., 2024a; Luo et al., 2024; Wang et al., 2024a). Genomic resources from Southeast Asian and East Asian populations have historically been underrepresented. Recently, projects such as the NyuWa Genome Resource, the 10K Chinese People Genomic Diversity Project, and the YanHuang cohort have aimed to address this gap and improve the equity of genomic studies in Eastern Eurasians (Zhang et al., 2021; He et al., 2025; Wang et al., 2024b). These population genomic datasets, combined with anthropological information, have allowed for a more nuanced reconstruction of fine-scale population genetics and the evolutionary factors at play, such as migration, admixture, adaptation, and introgression (Luo et al., 2024; Sun et al., 2024; He et al., 2025; Wang et al., 2024b). These advances in human genome science, population genetics, and molecular anthropology provide, alongside advancements in sequencing technologies, enhanced applications in forensic genetics, molecular anthropology, and genome medicine, particularly in precision forensic medicine (Luo et al., 2024; Wang et al., 2024a; Wang et al., 2024b).
Compared with distant populations, most populations present a closer genetic relationship with geographically proximate groups, resulting in spatial autocorrelation within genetic data (Prugnolle et al., 2005; Battey et al., 2020). This correlation allows researchers to predict the geographic and genetic origin of a sample by comparing it to a reference set with known locations (Guillot et al., 2016). The overlap of genealogy and geography leaves genetic signals across the genome that can be leveraged for practical ancestry inference (Nielsen et al., 2024). The portion of genetic material inherited from each ancestral group is referred to as ancestry. Ancestry informative markers (AIMs) are DNA markers with different allele frequency spectra that can indicate the likely biogeographic origin of an individual when ancestry is unknown or undisclosed (Rosenberg et al., 2003; Phillips et al., 2007). In forensic science, AIMs are widely used to trace the origin of unknown biological samples found at crime scenes and to identify missing persons or historical remains (Cai et al., 2024; Mandape et al., 2024). Forensic biological materials often experience harsh environmental conditions, limiting their quantity and quality. Therefore, forensic experts aim to extract as much information as possible from a single test, with a key focus on determining the biogeographical origin of suspects. Recently, several forensic AIMs and commercial panels have shown strong population differentiation capabilities at the intercontinental level (Li et al., 2016; Pakstis et al., 2019; He et al., 2021). However, Southeast Asia and East Asia, with their exceptional ethnic and linguistic diversity—spanning the Sino-Tibetan, Altaic, Hmong-Mien, Tai-Kadai, Austronesian, and Austroasiatic language families—pose significant challenges for biogeographical ancestry inference (Wang et al., 2023; Duan et al., 2024; He et al., 2024b; Li et al., 2024; Luo et al., 2024; Sun et al., 2024; Sun et al., 2024; Wang et al., 2024a; He et al., 2025; Wang et al., 2024b). Populations from these linguistic families have distinct demographic histories, exhibit genetic differences, and have undergone substantial gene flow. Current studies face obstacles such as small sample sizes, limited population diversity, and insufficient accuracy in ancestry inference within Southeast and East Asian populations.
New markers with improved resolution provide an opportunity for the development of more efficient forensic biogeographical ancestry panels. Recent algorithmic advances offer strategies to increase the accuracy and applicability of traditional markers. Machine learning (ML) and deep learning (DL), both subfields of artificial intelligence, have shown great promise in recognizing patterns within data and are being applied across biomedical sciences, including genomics, clinical medicine, and forensic science (Al-Zaiti et al., 2023; Bianco et al., 2023; Mantes et al., 2023; Cai et al., 2024; Yang et al., 2024). In forensic anthropology, ML and DL have demonstrated significant potential in biogeographical ancestry inference, enabling ancestry classification and the prediction of geographic origin coordinates (Battey et al., 2020; Deelder et al., 2022). In this study, we used anthropologically informed, population-specific genomic resources from Southeast Asian and East Asian populations—including the Sino-Tibetan, Altaic, Hmong-Mien, Tai-Kadai, Austronesian, and Austroasiatic language families—from the Human Origins (HO) dataset, along with our in-house genomic cohort (He et al., 2025; Wang et al., 2024b). These resources served as reference data for marker selection and model training. The AIMs were selected via the AIM generator. Traditional PCA and model-based ADMIXTURE analyses were applied to determine ancestry composition and genetic relationships, whereas the deep learning algorithm Locator was used to infer the geographic coordinates of samples. Additionally, machine learning classification algorithms were used to predict ancestry.
We present an integrative genomic dataset comprising 3,461 individuals from ethnolinguistically diverse East Asian and Southeast Asian populations on the basis of our recent Hui cohort and publicly available genomic resources (Wang et al., 2021; Mallick et al., 2024). After applying stringent quality control and excluding individuals with up to third-degree genetic kinship, we collected a comprehensive sample of 2,191 Hui individuals from 57 prefecture-level cities across 29 provincial administrative regions in China. The Hui samples were categorized into Northern Hui (1,366) and Southern Hui (825) based on geographical location. Reference populations from the Human Origins dataset, including the Tai-Kadai (345), Hmong-Mien (119), Austronesian (120), Austroasiatic (226), Sino-Tibetan (197), and Altaic (263) populations, were incorporated (Figure 1A; Supplementary Table S1). After data merging and quality control, 86,028 SNPs were retained for analysis. Principal component analysis (PCA) revealed that the Hmong-Mien, Tai-Kadai, Austronesian, and Austroasiatic populations clustered together, forming a southern cluster, which was further confirmed via the model-based ADMIXTURE results (Figures 1B, C). The Southern Hui population was positioned close to this cluster in genetic coordinates. In contrast, Altaic-speaking populations, northern Hui populations, and some Sino-Tibetan populations clustered together, forming a northern cluster. Ancestry-informative markers (AIMs) were selected via the AIM generator, which included 3,461 individuals from five subgroups defined by geographical regions or linguistic affiliations. To achieve optimal inference and differentiation efficiency with the minimal number of loci, the needs of forensic practice must be met. Six nested panels of ancestry-informative SNPs (50, 100, 250, 500, 1,000, and 2,000 AISNPs) were developed to differentiate the eight subpopulations described (Supplementary Table S2). These AIMs were distributed across chromosomes (Figures 1D–I).
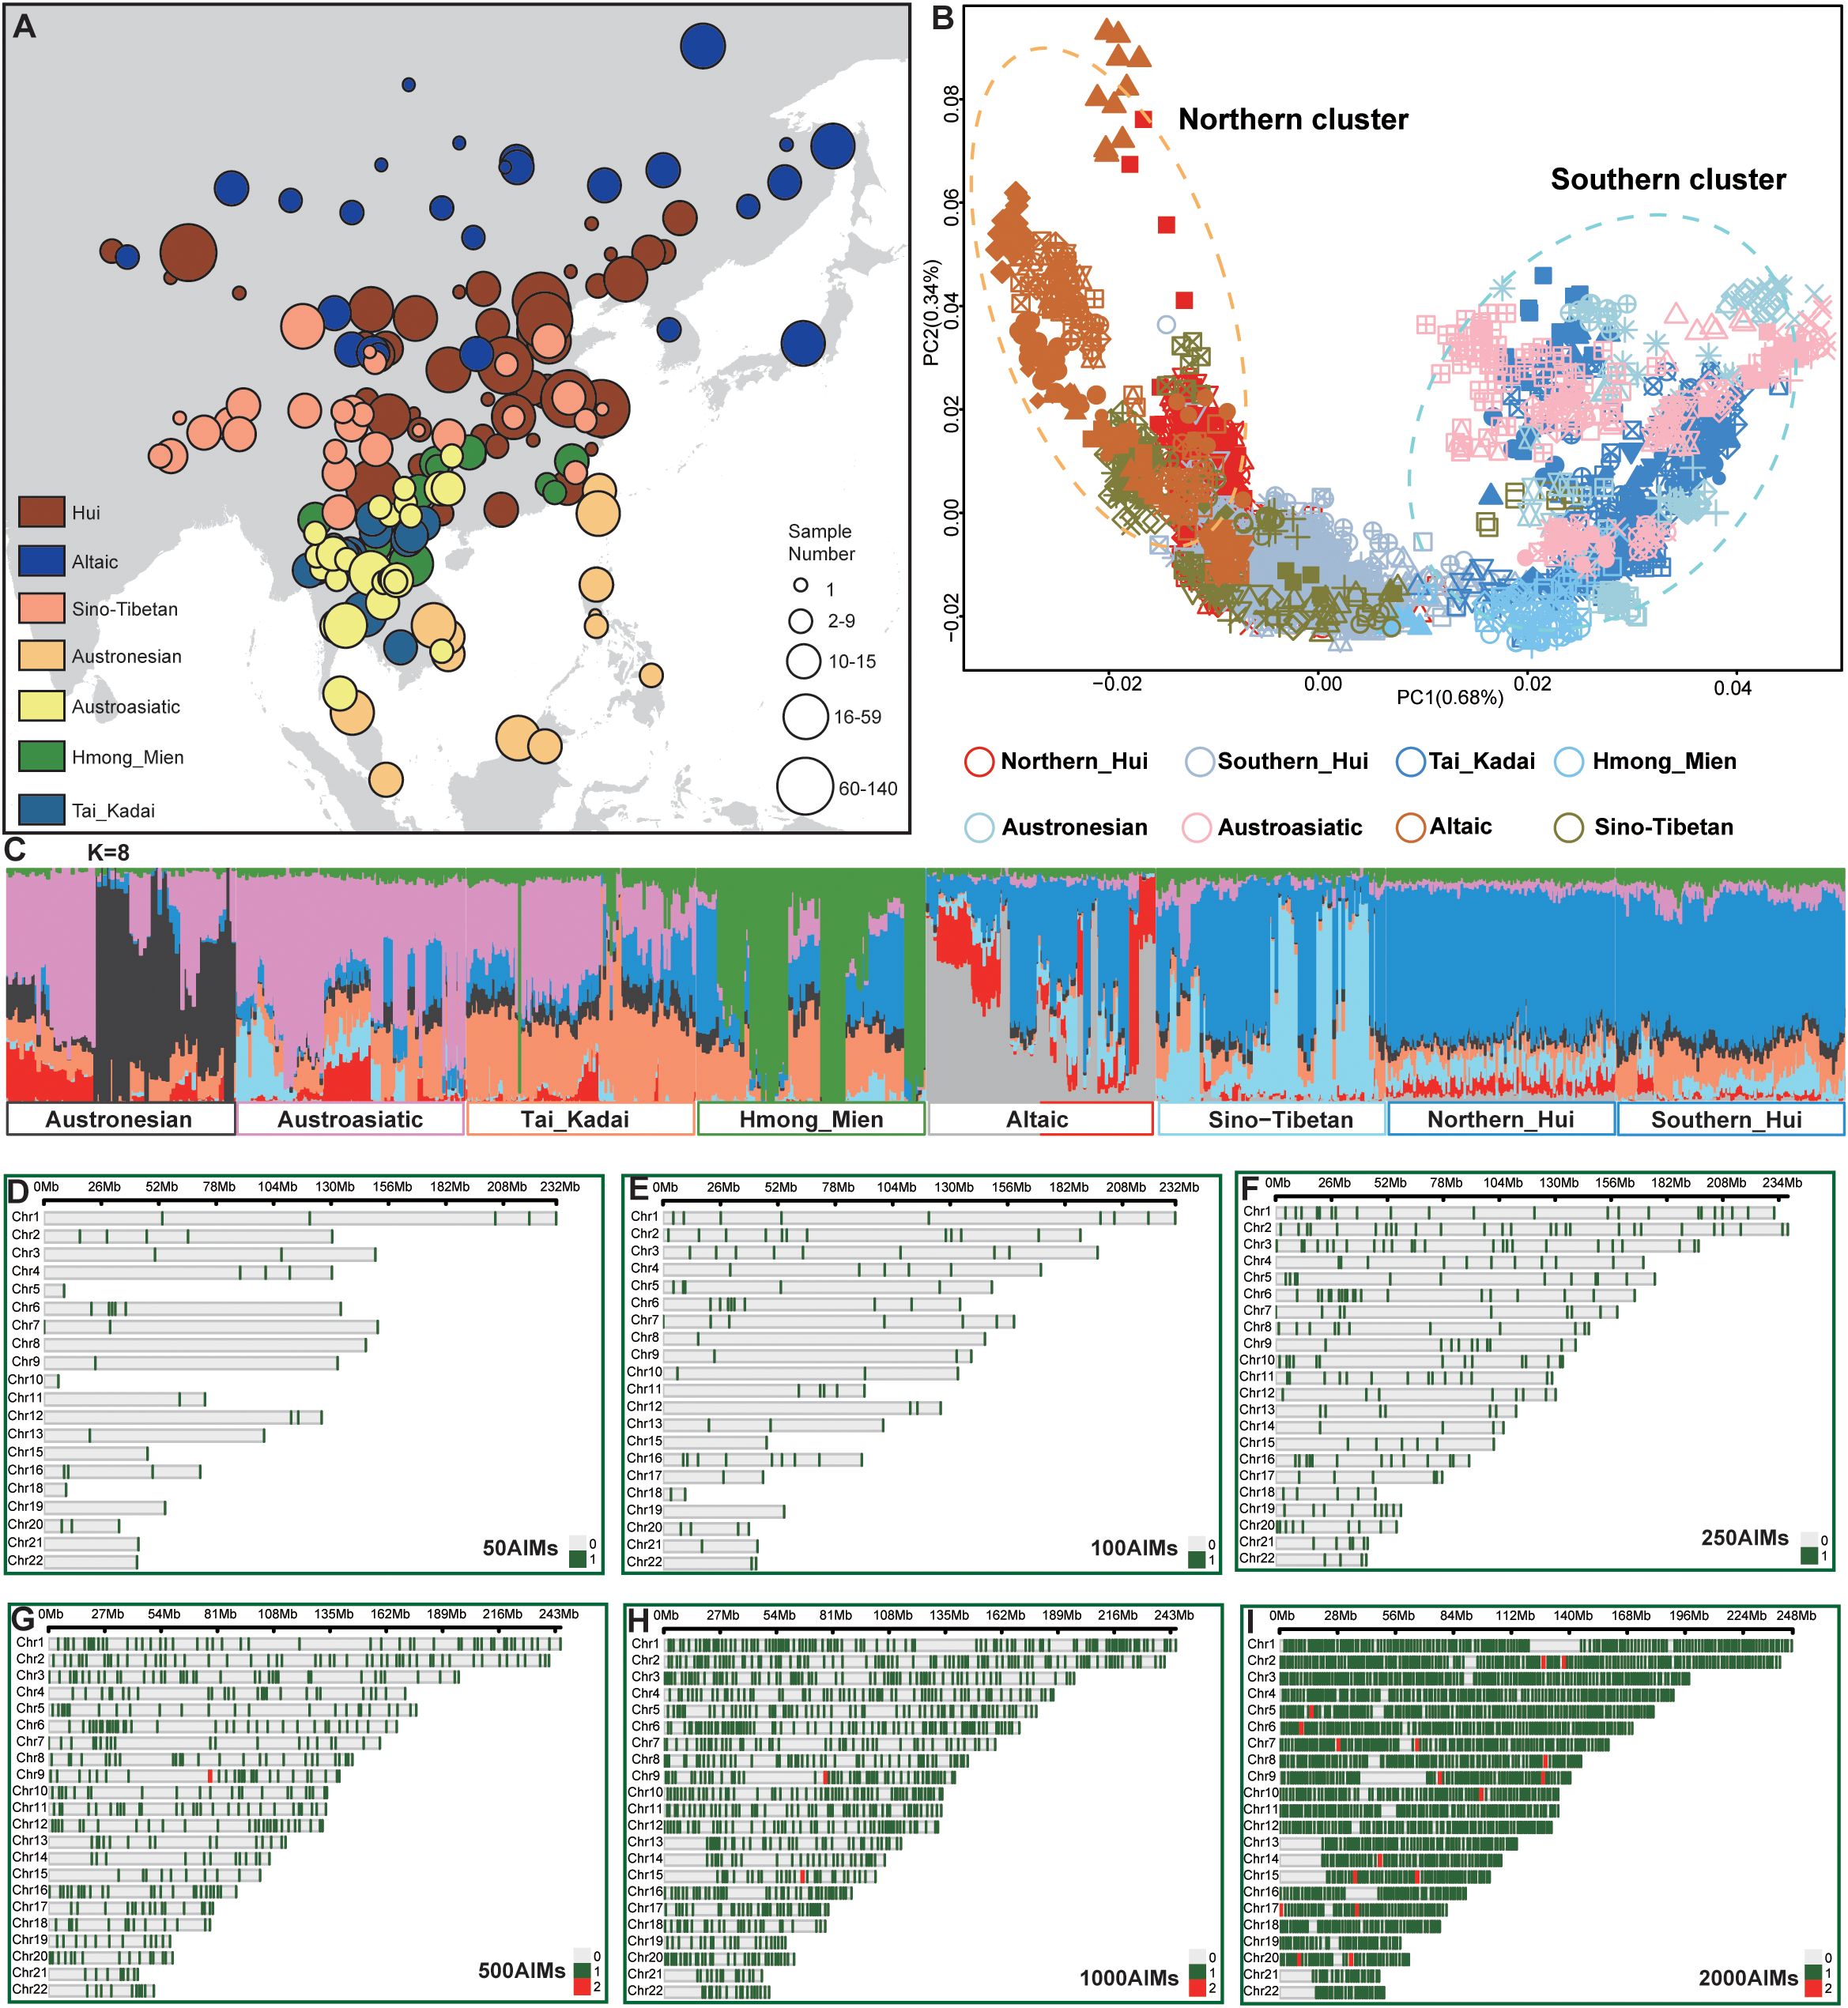
Figure 1. Sampling distribution, basic genetic characteristics of the samples, and six AIM panels. (A) The sample distribution map in this study shows circle sizes representing the sample size, with colors indicating different subpopulations. (B) Principal component analysis of all samples. Icons in different colors represent the subpopulation to which each sample belongs. (C) The ADMIXTURE results at K=8 indicate the ancestral components of the populations using all the SNPs. (D-I) Locus density distribution map of the six AIM panels. The green vertical lines indicate the presence of one AIM at that position, whereas the red lines indicate the presence of two AIMs.
To assess the discriminative power of the selected AIM panels across eight subpopulations and infer ancestral origins, we applied traditional population genetic analysis methods, including PCA and model-based ADMIXTURE analysis, to six nested AIM panels. The PCA results revealed that as the number of AIMs increased, the population structure became more distinct, with the eight major subpopulations forming a north–south cline along PC1 (Figure 2A). This continuous genetic gradient suggests extensive gene flow among East Asian and Southeast Asian populations. Such admixture among populations is widely observed in geographically proximate samples, posing challenges for our analysis. Populations speaking Austronesian, Austroasiatic, Hmong-Mien, and Tai-Kadai languages clustered in southern East Asia, whereas northern Altaic-speaking populations formed a distinct group. The southern and northern Hui populations formed two distinct clusters, with partial overlap in genetic coordinates between the Sino-Tibetan and Hui populations, indicating close genetic relationships. We evaluated the ability of PCA to distinguish among 8 subpopulations via the principal component distance (PCD) between populations. A larger PCD indicates a greater degree of separation between different populations in the PCA coordinates, reflecting stronger discriminative power. In the PCA using all loci, the average PCD between the genetic centroids of the eight subpopulations was 0.067. The average PCDs between populations for the six tiers of AISNP panels were as follows: 0.039 (50 AISNPs), 0.043 (100 AISNPs), 0.052 (250 AISNPs), 0.058 (500 AISNPs), 0.063 (1000 AISNPs), and 0.066 (2000 AISNPs). Notably, the panel with 2000 AISNPs achieved a differentiation efficiency comparable to that of 86,028 SNPs, which is sufficient to meet the requirements of practical forensic casework. Furthermore, ADMIXTURE analysis, which uses the 2,000 AIM panel, revealed that the lowest cross-validation error rate occurred when K=8 (Figure 2B), suggesting that the possibility of eight population substructures can be inferred among known genetic backgrounds of Southeast and East Asians. This model identified unique ancestral components for the Sino-Tibetan, Hui, Austronesian, Austroasiatic, Hmong-Mien, and Tai-Kadai populations, whereas the Altaic-speaking populations presented two distinct ancestral components: one linked to Northeast Asian ancestry, represented by the Ulchi, and the other to West Eurasian ancestry, represented by the Uyghur. Differences in ancestral components were observed between the southern and northern Hui populations, as well as between the Hui and Sino-Tibetan populations. However, widespread admixture across samples leads to shared genetic characteristics, making it challenging to achieve clear differentiation between populations. These shared genetic features blur the boundaries between groups, particularly in regions with high levels of historical and recent gene flow. Consequently, these findings highlight the limitations of traditional unsupervised models and dimensionality reduction algorithms, such as PCA and ADMIXTURE, in capturing fine-scale population structures within East Asia. The reduced discriminative power of these methods underscores the need for more advanced analytical approaches or the incorporation of additional genomic markers to improve resolution and accuracy in distinguishing closely related populations.
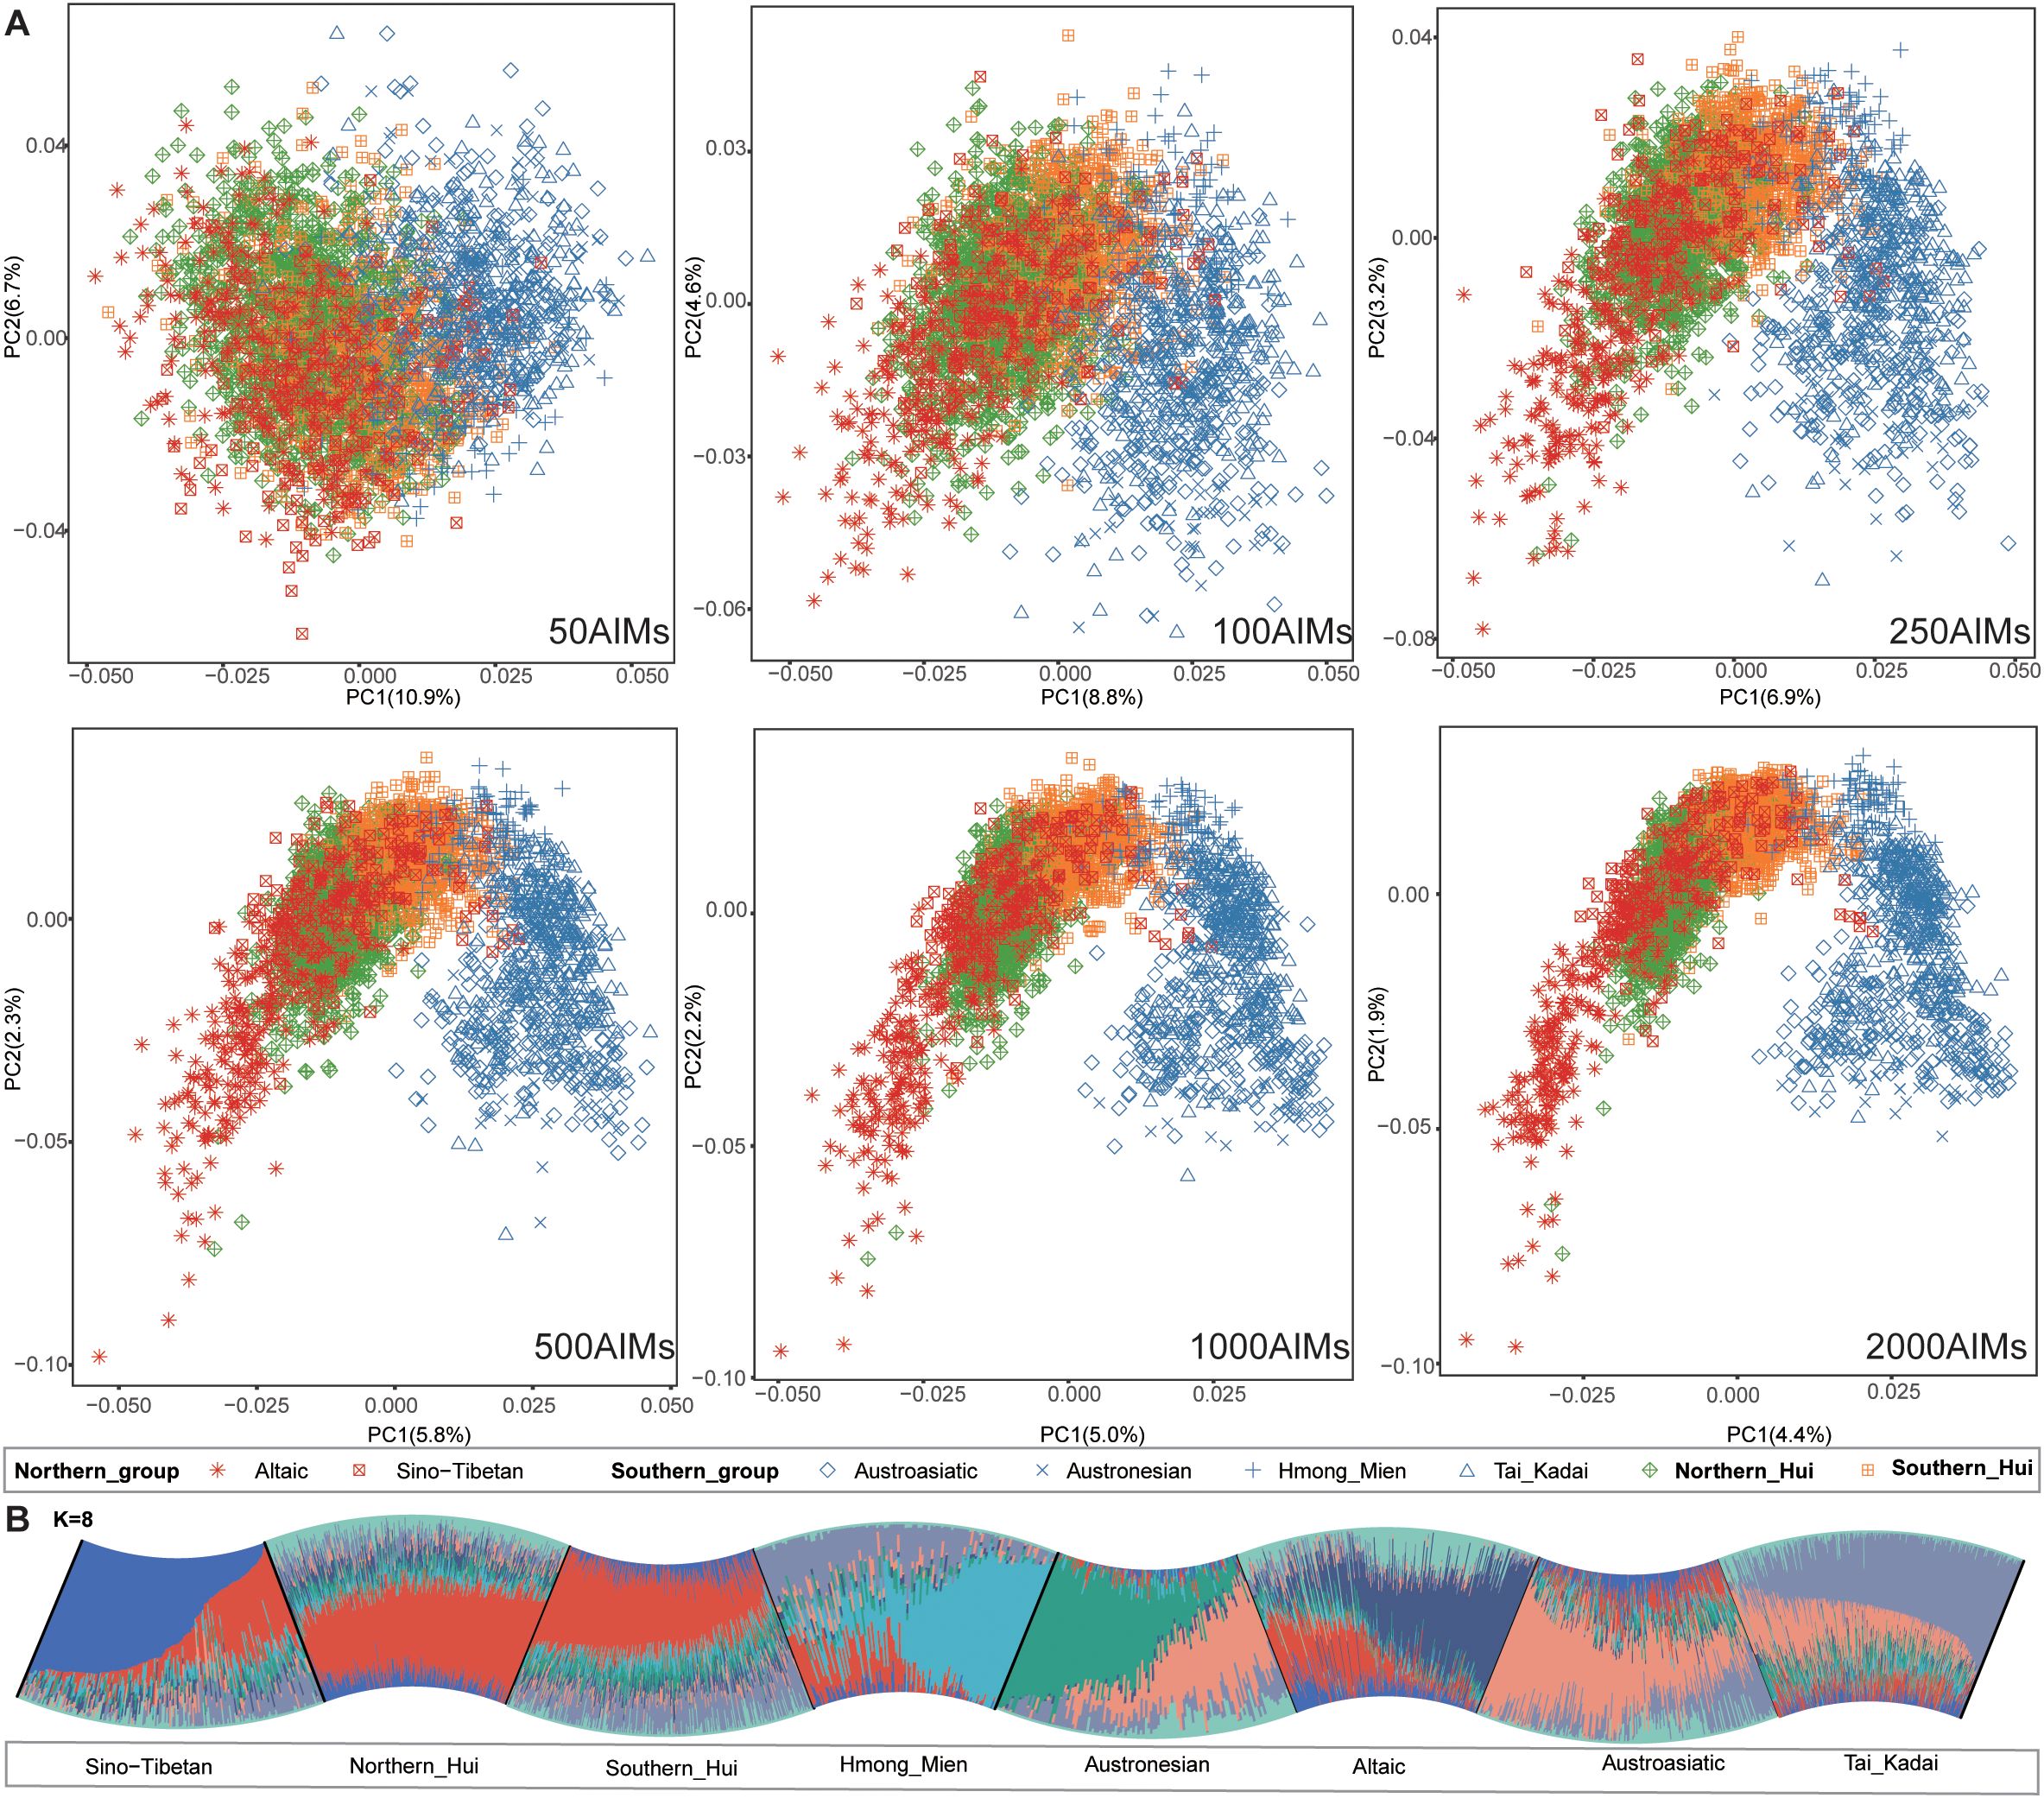
Figure 2. Results of PCA and ADMIXTURE. (A) PCA of six AIM panels. Icons in different colors represent the subpopulation to which each sample belongs. (B) The ADMIXTURE results at K=8 indicate the ancestral components of the populations using 2000 AIMs.
To enhance ancestry inference, we applied two machine learning classification algorithms, random forest (RF) and eXtreme Gradient Boosting (XGBoost), both of which have shown strong performance in multiclass classification tasks. The samples were divided into training and validation sets at an 8:2 ratio, with random sampling conducted within each subpopulation on the basis of this proportion. Subpopulations served as classification outputs, whereas the first 20 principal components from PCA and the results from ADMIXTURE at K=8 were used as feature vectors for modeling. The optimal parameters were identified through a grid search and tenfold cross-validation. The validation set was then used to evaluate the optimal model via metrics such as the confusion matrix and accuracy (Figure 3). In Model_1, we used only genetic information as input. Overall, the RF model outperformed the XGBoost model, with an accuracy of 84%. Specifically, in the RF model, the prediction accuracies for different linguistic and regional groups were as follows: 93.0% for the Northern Hui population, 71.5% for the Southern Hui population, 83.3% for the Hmong-Mien-speaking population, 87.5% for the Austronesian-speaking population, 82.2% for the Austroasiatic-speaking population, 91.3% for the Tai-Kadai-speaking population, 87.3% for the Altaic-speaking population, and 53.8% for the Sino-Tibetan-speaking population (Figures 3A, B; Supplementary Figures S3, S4). For the six linguistic subgroups, the prediction accuracy exceeded 80%, with higher misclassification rates observed between the Austroasiatic and Tai-Kadai language groups. However, the Sino-Tibetan-speaking populations and Hui group, characterized by a high level of admixture, exhibited the lowest classification accuracy among the 8 subpopulations. The majority of classification errors occurred between the Sino-Tibetan-speaking populations and the Southern Hui populations. This may be attributed to the fact that the Hui populations are historically classified within the Sinitic language group and have experienced frequent genetic exchange with neighboring populations. The shared linguistic and cultural background, combined with extensive gene flow, has likely resulted in overlapping genetic characteristics between these groups, complicating their differentiation in genetic analyses. This result aligns with the PCA findings, where some Hui samples were positioned between the southern and northern Hui populations, and certain Sino-Tibetan groups clustered with the Hui, making clear delineation difficult. A significant improvement in model accuracy was observed as the number of AIMs increased; however, this improvement plateaued once the number of AIMs reached 1,000 (Table 1). Our Model_1 has demonstrated sufficient discriminative power among the six major linguistic families; however, its performance within individual linguistic families still requires improvement.
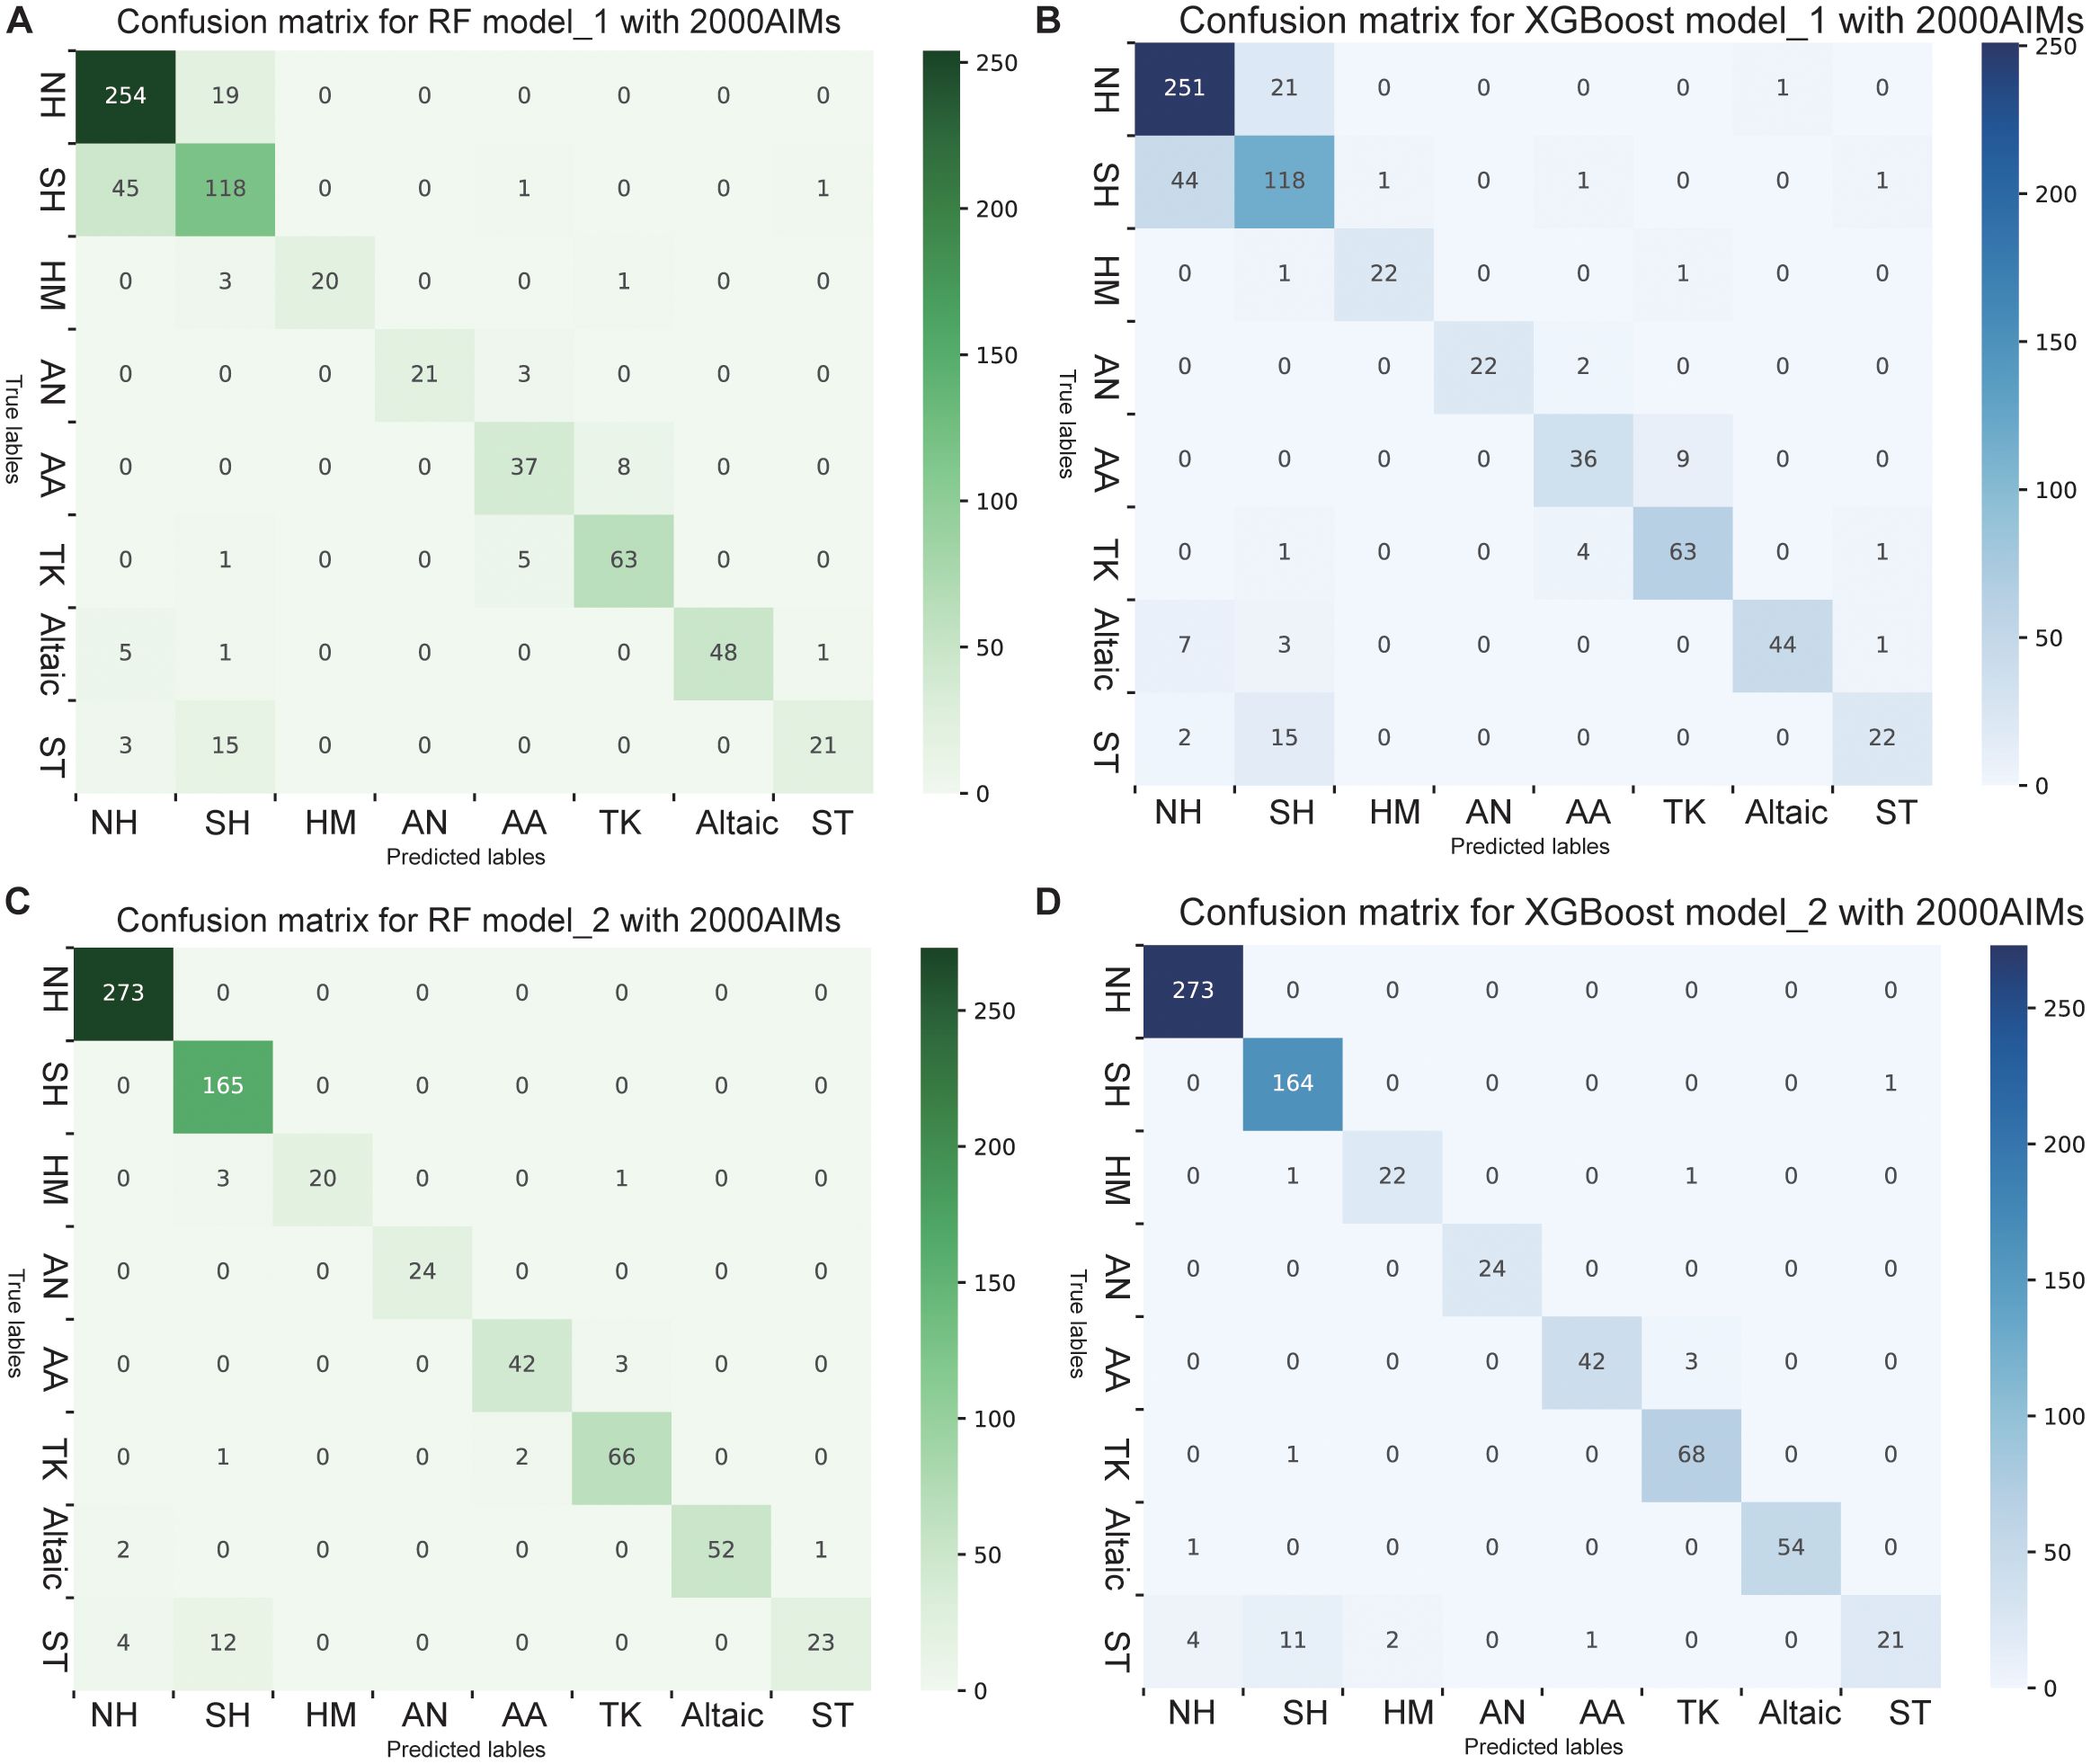
Figure 3. Confusion matrix of the RF and XGBoost models with 2000 AIMs. (A, B) Confusion matrixes of RF and XGBoost for Model_1, which uses only genetic information as input. (C, D) Confusion matrixes of RF and XGBoost of Model_2, which add geographical coordinates as inputs. Each row of the matrix represents the actual class, whereas each column represents the predicted class. The diagonal elements indicate the number of correctly classified samples for each class, whereas the off-diagonal elements represent misclassifications. NH, Northern_Hui; SH, Southern_Hui; HM, Hmong_Mien; AN, Austronesian; AA, Austroasiatic; TK, Tai_Kadai; ST, Sino-Tibetan. For the complete confusion matrix, see Supplementary Materials, Supplementary Figures S1-S4.
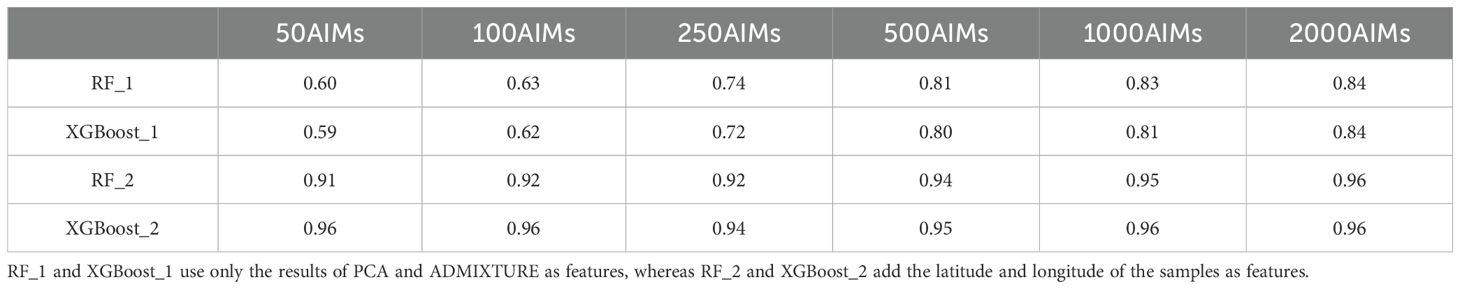
Table 1. Accuracies of the six AIM panels in the RF and XGBoost models.
Compared with models that use only genetic information, those that incorporate geographic latitude and longitude as additional features in Model_2 significantly improved accuracy. In this case, the XGBoost algorithm outperformed the RF algorithm. After integrating latitude and longitude, the confusion matrix revealed a clearer distinction between the southern and northern Hui populations (Figures 3C, D, Supplementary Figures S5, S6). However, a small number of southern Hui individuals were misclassified as belonging to the Sino-Tibetan language family. Model_2 achieved a classification accuracy of 96%, which is sufficient for practical applications. Although the prediction accuracy of Model 2 improved significantly after incorporating sample geographical information, it is possible that overfitting occurred because multiple samples shared the same geographical location. Here, we do not focus on evaluating the overall quality of the model but rather aim to demonstrate that geographical information, as a feature, can enhance the prediction accuracy of forensic biogeographical ancestry inference models. These results underscore the critical role of both genetic and geographic data in forensic biogeographical ancestry inference, highlighting the significant contributions of artificial intelligence algorithms in identifying the biogeographical origins and ancestry of newly inferred samples.
Importantly, in practical cases, researchers typically have access only to genetic information. Although we recognize the critical role of geographical information in biogeographical ancestry inference, such data are often unavailable. To address this limitation, we employed a deep learning approach to predict geographical coordinates solely on the basis of genetic information. To explore the potential of predicting geographic origins from genetic variation, we used high-density SNP data and machine learning methods to estimate the geographic origins of randomly sampled individuals. We applied the deep learning method of Locator, a tool that uses all variant sites as input data to evaluate the accuracy of predicting unknown sample locations. A subset of samples had their true geographic locations masked for validation, whereas the remaining samples with known coordinates were used as the training set. Locator employs deep neural networks to predict genotypes without relying on explicit models of genotype variation across landscapes. To visualize the results, we randomly selected one individual from the predicted samples of each subpopulation. The findings revealed that Locator, which uses 86,028 loci, achieved high accuracy in geolocating Southeast Asian and East Asian populations, including speakers of the Altaic (Ulchi), Hmong-Mien (Hmong), Austronesian (Ami), Austroasiatic (Kankanaey), Tai-Kadai (Black Tai), and Sino-Tibetan (Tibetan Lhasa) languages and some Hui individuals (Figure 4). The mean kernel peak error for these nine samples was 6.02 km on the basis of the kernel density estimation, and the mean centroid error was 5.94 km on the basis of the geodesic centroid (Figure 5). As the number of AIMs increased, the median error between the predicted geographic coordinates and the true coordinates gradually decreased; however, outliers always existed. When all the SNPs were used as inputs, the error for most of the predicted samples was distributed between 0 and 10 km, demonstrating the high accuracy of our prediction model (Figure 5). Notably, the prediction accuracy was greater for island populations, likely because of limited gene flow and lower genetic admixture. However, the accuracy for the Hui population was slightly lower despite the large sample size and precise geographic locations, possibly due to extensive intermarriage and a high degree of genetic similarity with surrounding Sino-Tibetan populations. We further evaluated the effectiveness of AIMs in improving biogeographical inference via the mean kernel peak error in the Locator. The 50-AIM panel produced a mean kernel peak error of 10.22 km, with wider error ranges and some true coordinates falling outside the predicted contours (Supplementary Figure S5). Increasing the number of AIMs to 2,000 reduced the prediction error to 7.47 km, with more concentrated contour lines (Supplementary Figure S6). A comparison of 50 AIMs, 2,000 AIMs, and all SNPs demonstrated that increasing the number of loci improved the prediction accuracy in Locator.
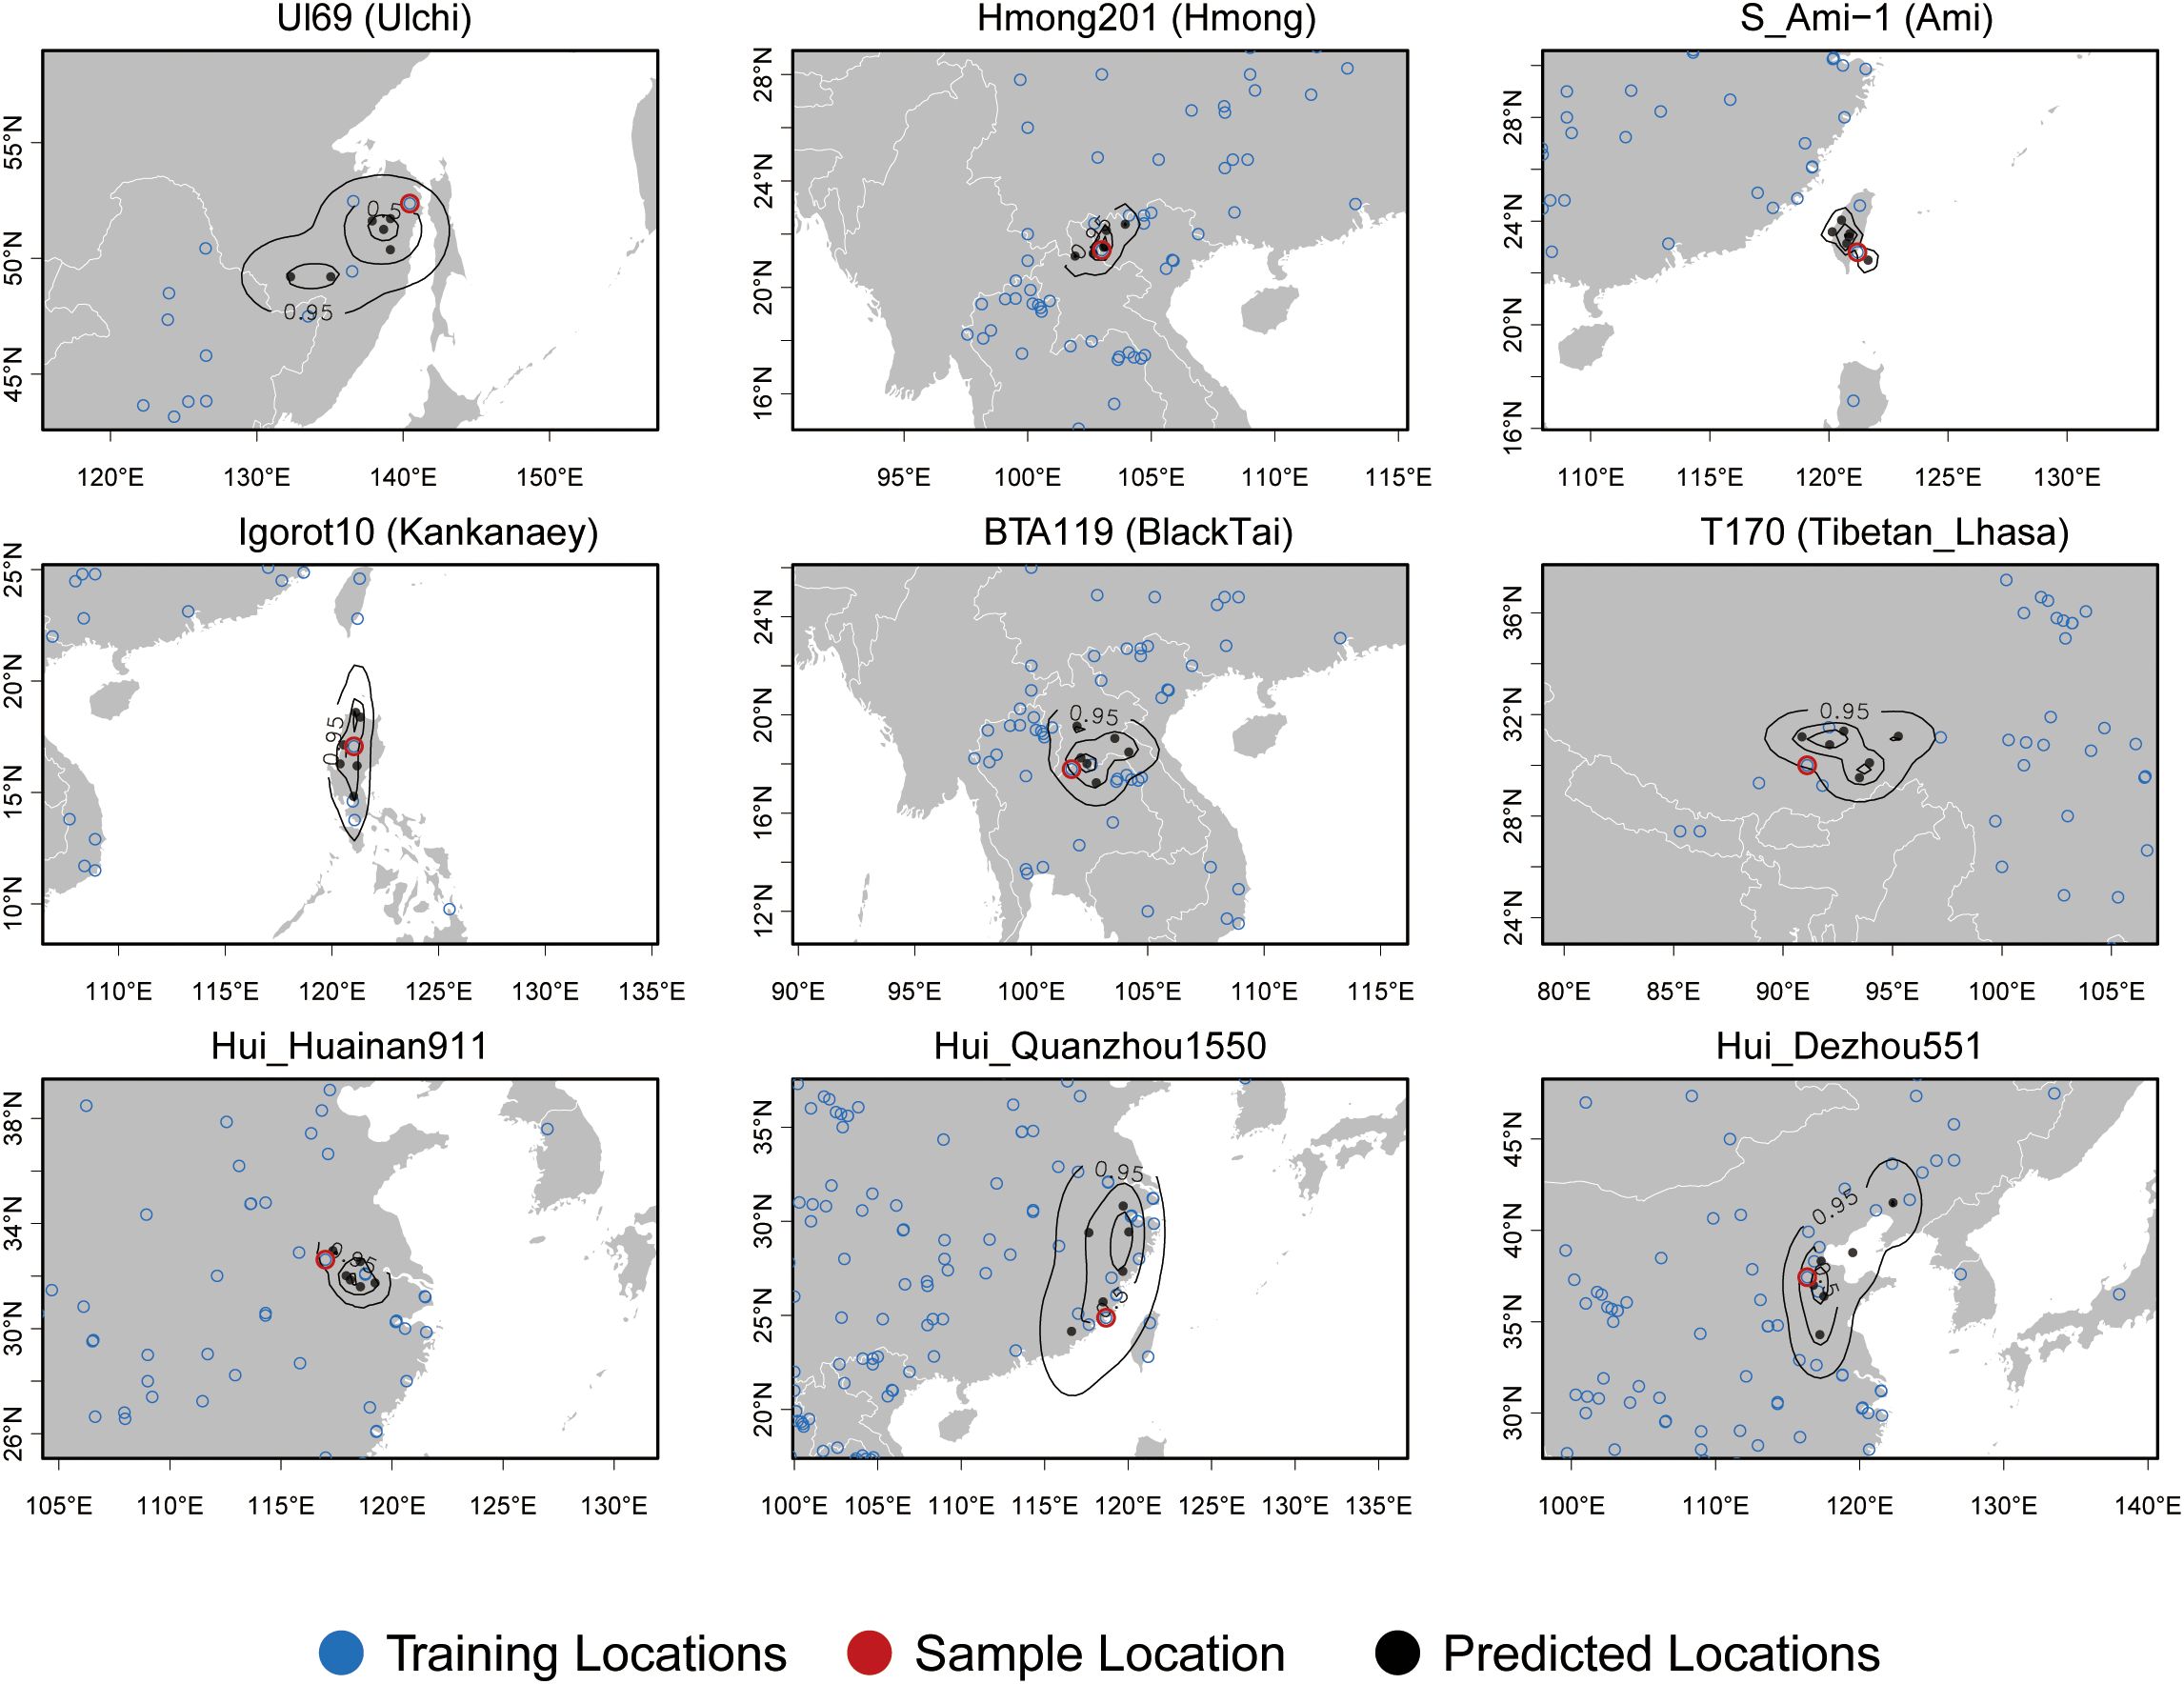
Figure 4. Using all the SNPs as inputs, the geographic coordinates of the nine samples were predicted. The blue circles represent the geographic coordinates of the training samples, the black dots represent the predicted geographic coordinates from five repeated predictions, and the red circles indicate the true geographic coordinates of the samples. The contours show the 95%, 50%, and 10% quantiles of a two-dimensional kernel density across windows.

Figure 5. Box plots and histogram of the kernel peak error and centroid error. The red box represents the kernel peak error, which is a nonparametric statistical method used to estimate the probability density function of a random variable. The green box represents the centroid error, which refers to the error between the estimated centroid and the true centroid. The primary purpose of calculating the centroid error was to measure the accuracy of a model, algorithm, or estimation method in locating the center of the data. We used the Euclidean distance for calculation.
Human populations display significant genetic differences, particularly between African and non-African groups (Bergström et al., 2020). These genetic diversity patterns are closely intertwined with cultural and linguistic variations shaped by the migration, expansion, and diversification of human populations (Henn et al., 2012). Forensic scientists have identified ancestry-informative markers in the human genome that contribute most to population differences (Rosenberg et al., 2003). It is now possible to distinguish populations from different continents via only a few dozen AIMs. However, this level of differentiation is insufficient for practical applications in regions such as East Asia and Southeast Asia, where population diversity is high (Li et al., 2016). To address this, we utilized a recently reported dataset of 2,191 Hui samples, along with 1,268 samples from public databases, representing Sino-Tibetan, Altaic, Hmong-Mien, Tai-Kadai, Austronesian, and Austroasiatic populations—all with high-precision geographic location data. In total, 3,461 samples with 86,028 SNPs were analyzed via artificial intelligence (AI) algorithms to develop a high-resolution biogeographical ancestry inference system for East Asian populations. We applied the AIM generator to select six different AISNP panels, ranging from 50 to 2,000 SNPs, to assess the effectiveness of varying numbers of AISNPs for biogeographical ancestry inference. The results indicated that traditional methods such as PCA and unsupervised algorithms such as ADMIXTURE achieved moderate discriminative power when the number of AIMs reached 500. However, even when all available SNPs were used, admixed samples remained difficult to separate fully. AI techniques, including machine learning classifiers and deep learning algorithms, offer promising approaches for improving human population genomics research. These algorithms enhance forensic biogeographical ancestry inference accuracy through experience and data-driven learning (Cai et al., 2024; Huang et al., 2024). We used genetic information from the PCA and ADMIXTURE results as input features and then trained the models via the RF and XGBoost algorithms. As the number of AIMs increased, the prediction accuracy improved, reaching 84%. The classification accuracy between language families approached nearly 1 (Supplementary Figures S3, S4). However, challenges persisted. The Hui population, which is part of the Sino-Tibetan language family, showed low differentiation from other groups within the same family. Additionally, the prediction accuracy for different subpopulations within the same ethnic group was lower. The incorporation of geographic coordinates as input features significantly improved the prediction accuracy, surpassing 90%, even with the smallest panel of 50 AIMs. This underscores the critical role of geographic information in forensic biogeographical ancestry inference.
Previous studies have demonstrated a correlation between genetic structure and linguistic–cultural classifications in East Asian and Southeast Asian populations (Sun et al., 2024; Yang et al., 2024). In this study, we first categorized our samples into six major linguistic groups and utilized AIMs_generator to identify AISNPs on the basis of allele frequency differences among these groups. The selected AISNPs were then applied to biogeographical ancestry inference both across the six linguistic groups and within the Sino-Tibetan language family, with a particular focus on the genetic differentiation between Southern and Northern Hui populations and other Sino-Tibetan groups. By employing this approach, we aimed to assess whether a set of AISNPs optimized for distinguishing language families could also effectively capture finer-scale substructures within a language family. The results provide insights into the feasibility of forensic ancestry inference at both inter-language and intra-language family levels, highlighting the genetic complexity underlying linguistic classifications in the region. While our findings demonstrate that AISNPs can differentiate major linguistic groups, we also acknowledge the presence of genetic overlap within the Sino-Tibetan family. This suggests that while linguistic classification can serve as a useful framework for structuring forensic reference populations, additional genetic factors and historical admixture should be considered to refine ancestry inference models. Admixtures are common among modern populations that are geographically proximate or belong to the same language family. Similar to the challenges reported in Brazilian admixed populations (Koksal et al., 2023), standard AIM panels struggled with accurate population assignment. Additionally, in the ancestry inference practice conducted by Sammed N. Mandape et al. on unidentified human remains, admixed populations exhibited greater errors (Mandape et al., 2024). Our findings indicate that standard AIM selection strategies may need to be optimized to better capture intralanguage family genetic substructures. Although the selected AISNPs achieve good prediction accuracy between language families, their resolution for distinguishing within a language family remains insufficient. A more refined selection strategy is needed to improve differentiation accuracy. Furthermore, developing new ancestry inference algorithms, such as the parental individual ancestor (PIA) proposed by Pfaffelhuber et al. and the Genetic Distance Algorithm (GDA) used by Cheung et al., as well as integrating various machine learning or deep learning algorithms, may contribute to the prediction of admixed populations (Cheung et al., 2018; Pfaffelhuber et al., 2022; Wang et al., 2025).
A key challenge in forensic genetics is improving the accuracy of inference when only genetic information is available for suspects or unidentified remains. To address this issue, we applied the deep learning-based algorithm Locator, which was trained on both genetic and geographic data from known samples, to predict the latitude and longitude of unknown samples. The prediction accuracy was high for isolated island samples but slightly lower for those genetically similar to surrounding populations. Nevertheless, the Locator significantly improved the identification of general geographic ranges. Currently, Locator uses a simple fully connected architecture, but more advanced architectures, such as recurrent neural networks, could further enhance performance. Biogeographical ancestry inference, particularly when tied to precise geographic locations, plays a crucial role in practical forensic applications. Although the use of deep learning in forensic science remains in its early stages, we anticipate significant advancements in the near future. Another challenge is the collection of samples from genetically underrepresented populations in human genome research, which directly impacts marker selection and model prediction efficiency (Wang et al., 2024a). Additionally, overcoming microarray-based ascertainment bias and reference bias in genetic research on non-European populations remains critical (Wang et al., 2022). The GRCh38 human reference sequence, derived primarily from European-related ancestry, introduces bias into modern and ancient genome research (Wang et al., 2022). A single reference genome cannot capture the full spectrum of human genetic diversity, so a pangenome-based graph reference offers a more accurate approach to genotyping across all human genetic variations (Gao et al., 2023; Liao et al., 2023). Genome sequencing projects focusing on Eastern Eurasians would benefit from the use of population-specific pangenomes, particularly second- or third-generation sequencing data (Gao et al., 2023). These technological advancements in human genome research will provide more candidate genomic variations for ancestry-informative marker screening and translational forensic applications.
We developed and bioinformatically validated a series of nested high-resolution biogeographical ancestry inference panels for Southeast Asian and East Asian populations via advanced AI algorithms and a dataset of over 3,400 samples. The application of machine learning classifiers, particularly RF and XGBoost, significantly improved the prediction accuracy as the number of AIMs increased, with the classification accuracy between language families approaching. The incorporation of geographic data as input features further increased the prediction accuracy, highlighting the critical role of geographic information in forensic biogeographical ancestry inference. Despite these advancements, challenges persist, particularly in distinguishing subpopulations within the same ethnic group, such as the Hui, and in addressing biases introduced by reference genomes primarily derived from European ancestry. The implementation of deep learning techniques, such as the Locator algorithm, showed promising results in predicting geographic coordinates, although more sophisticated architectures could further improve performance. Future research should prioritize the development of population-specific pangenomes to reduce ascertainment and reference biases, thereby increasing the accuracy of ancestry inference in non-European populations. Integrating these technological advancements will be crucial in refining forensic applications and advancing the precision of human population genomics research.
DNA samples from 2,309 self-reported Hui individuals from 29 provincial administrative regions of China were analyzed in this study. The individuals were sourced from 57 different municipal districts, which served as the basis for the initial grouping. DNA was collected from buccal swab samples. The study adhered to the principles outlined in the Declaration of Helsinki and was approved by the Medical Ethics Committees of West China Hospital of Sichuan University (2023-306). Informed consent was obtained from all participants for the use of their genetic variation data to investigate the genetic structure and demographic history of Hui populations and to examine patterns of genetic variation within and among populations. All individuals were genotyped via the Affymetrix Human Origins SNP array, which targets 648,971 SNPs. Genetic relatedness among Hui individuals was inferred via KING version 2.3.0 (Manichaikul et al., 2010). Samples with third-degree relatedness, including 118 individuals, were excluded from further analysis. The remaining data for 2,191 Hui individuals were merged with the Human Origins dataset via EIGENSOFT version 3.0 (Price et al., 2006). Quality control filtering was performed via PLINK 1.9 with parameters set to –mind 0.1, –geno 0.1, –hwe 0.001, and –maf 0.01. After merging and quality control, 86,028 SNPs were retained. Populations speaking the Tai-Kadai (345), Hmong-Mien (119), Austronesian (120), Austroasiatic (226), Sino-Tibetan (197), and Altaic (263) languages from the Allen Ancient DNA Resource datasets (https://reich.hms.harvard.edu/datasets) were included in the analysis (Mallick et al., 2024). The Hui samples were categorized into Northern Hui (1,366) and Southern Hui (825) based on geographical location.
The AIMs_generator (https://github.com/boxiangliu/ANTseq/tree/master/AIMs_generator) was used to screen the top 50, 100, 250, 500, 1000, and 2000 AIMs, and Rosenberg’s In Statistic was used to identify ancestry-informative genetic markers (Rosenberg et al., 2003). AIMs were selected on the basis of the following criteria: (1) exclusion of duplicate SNPs and SNPs located on sex chromosomes; (2) linkage disequilibrium (LD) threshold set at “ldthresh=0.1”, ensuring the independence of selected SNPs; (3) ensuring a minimum distance of 0.9 Mb between SNPs on the same chromosome to reduce linkage disequilibrium effects; (3) population stratification control AIMs were selected on the basis of allele frequency files (pop.frq) of different ancestral populations (Tai-Kadai, Hmong-Mien, Austronesian, Austroasiatic, Sino-Tibetan, Altaic); (4) in combination with Rosenberg’s In statistic (“strategy=In”) to maximize genetic differentiation among ancestral groups; and (5) for ancestral populations comprising multiple subpopulations, a homogeneity test (“hetthresh=0.01”) was conducted to exclude SNPs that exhibited significant heterogeneity among subpopulations, thereby enhancing their applicability in forensic ancestry inference. Allele frequencies and linkage disequilibrium between SNPs were computed via PLINK v1.9.
The effectiveness of these AIMs for population stratification analyses across different regional populations was assessed via principal component analysis (PCA) and ADMIXTURE analysis (Alexander et al., 2009). The ADMIXTURE analysis was run with a default 10-fold cross-validation (CV = 10), setting the number of K from 29 and conducting 100 bootstraps with various random seeds. The results were visualized by creating a scatter plot via R 4.3.2. We evaluated the ability of PCA to distinguish among 8 subpopulations via a metric: the principal component distance between populations. For the principal component distance between populations, we first calculate the centroid of each population in the PCA space on the basis of 20 principal components and then compute the Euclidean distances between population centroids to generate an 8×8 distance matrix. To facilitate comparison, we calculated the average value of this matrix. If the principal component distance calculated via the AISNP panel exceeded that calculated via all loci, the panel was deemed to have satisfactory differentiation ability.
The random forest and XGBoost models were constructed via scikit-learn and XGBoost in Python, respectively. (1) Model_1 was trained using only genetic information, specifically the results from PCA and ADMIXTURE, as features. (2) Model_2 incorporates sample latitude and longitude information as additional features. Both methods use population categories as classifier outputs. Six nested panels of ancestry-informative SNPs (50, 100, 250, 500, 1000, and 2000 AISNPs) were applied for modeling. All the samples were split into a training set and a validation set at an 8:2 ratio. The model was built via the training set, and the optimal parameters were determined via a grid search and tenfold cross-validation. The RF parameters of grid search are as follows: ‘n_estimators’ [200, 500, 700, 1000]:; ‘max_features’: [2, 5, 10, 20]; ‘max_depth’: [10, 20, 50]; and ‘min_samples_split’: [2, 5]. The XGBoost parameters of grid search are as follows: ‘learning_rate’: [0.01,0,1], ‘max_depth’: [10,20,50], ‘n_estimators’: [200, 500, 700, 1000]. The validation set was then used to evaluate the optimal model, with metrics including the confusion matrix and accuracy.
Here, true positive (TP): A positive example of being correctly predicted. That is, the true value of the data was a positive example, and the predicted value was also a positive example. True Negative (TN): Counterexamples in which the true data value is a counter-example, and the predicted value is also a counter-example. False positive (FP): Positive example of misprediction. That is, the true value of the data was a negative example, but it was incorrectly predicted to be a positive example. False Negative (FN): A counter-example of being incorrectly predicted, in which the true value of the data was a positive example but incorrectly predicted to be a negative example.
We had access to the location information for all samples, and 694 individuals (20% of all samples) were randomly sampled from each subpopulation, masking their geographic locations to form the validation set, while the remaining 2,765 samples were used as the training set. We used a deep neural network-based method, Locator (Battey et al., 2020), to train the model via the training set and subsequently predicted the latitude and longitude of the samples in the validation set. The model directly uses unphased genotype data and sample latitude and longitude information as inputs. The network is trained to estimate a nonlinear function that maps genotypes to locations via gradient-based optimization. The models begin with randomly initialized parameters and are fitted to the data by iteratively adjusting the network’s weights and biases through repeated passes over the training set. Predictions from various regions of the genome can be visualized as a cloud of points, with the spatial distribution of these points providing an approximate indication of the uncertainty associated with individual-level predictions. We quantify the uncertainty in the predicted locations by estimating a two-dimensional kernel density surface from the set of predicted locations and offer plotting scripts to visualize the 95%, 50%, and 10% quantiles within geographic space. We use the Adam optimizer with Euclidean distance as a loss function:
The original contributions presented in the study are included in the article/Supplementary Material. Further inquiries can be directed to the corresponding authors.
The studies involving humans were approved by The Medical Ethics Committee of West China Hospital of Sichuan University (2023--306). The studies were conducted in accordance with the local legislation and institutional requirements. This study was conducted following the principles of the Helsinki Declaration of 2013. The participants provided their written informed consent to participate in this study.
QY: Formal Analysis, Methodology, Visualization, Writing – original draft. JC: Validation, Writing – review & editing. SN: Project administration, Writing – review & editing. CL: Project administration, Supervision, Writing – review & editing. HD: Funding acquisition, Writing – review & editing. GH: Conceptualization, Resources, Writing – review & editing.
The author(s) declare that financial support was received for the research, authorship, and/or publication of this article. This study was supported by the National Natural Science Foundation of China (82402203), the Major Project of the National Social Science Foundation of China (23&ZD203), the Open Project of the Key Laboratory of Forensic Genetics of the Ministry of Public Security (2022FGKFKT05 and 2024FGKFKT02), the Center for Archaeological Science of Sichuan University (23SASA01 and 24SASB03), the 1•3•5 Project for Disciplines of Excellence, West China Hospital, Sichuan University (ZYJC20002), and the Sichuan Science and Technology Program (2024NSFSC1518).
The authors declare that the research was conducted in the absence of any commercial or financial relationships that could be construed as a potential conflict of interest.
The author(s) declared that they were an editorial board member of Frontiers, at the time of submission. This had no impact on the peer review process and the final decision.
The author(s) declare that no Generative AI was used in the creation of this manuscript.
All claims expressed in this article are solely those of the authors and do not necessarily represent those of their affiliated organizations, or those of the publisher, the editors and the reviewers. Any product that may be evaluated in this article, or claim that may be made by its manufacturer, is not guaranteed or endorsed by the publisher.
The Supplementary Material for this article can be found online at: https://www.frontiersin.org/articles/10.3389/fevo.2025.1572596/full#supplementary-material
Alexander D. H., Novembre J., Lange K. (2009). Fast model-based estimation of ancestry in unrelated individuals. Genome Res. 19, 1655–1664. doi: 10.1101/gr.094052.109
Al-Zaiti S. S., Martin-Gill C., Zègre-Hemsey J. K., Bouzid Z., Faramand Z., Alrawashdeh M. O., et al. (2023). Machine learning for ECG diagnosis and risk stratification of occlusion myocardial infarction. Nat. Med. 29, 1804–1813. doi: 10.1038/s41591-023-02396-3
Battey C. J., Ralph P. L., Kern A. D. (2020). Predicting geographic location from genetic variation with deep neural networks. Elife 9. doi: 10.7554/eLife.54507.sa2
Bergström A., Mccarthy S. A., Hui R., Almarri M. A., Ayub Q., Danecek P., et al. (2020). Insights into human genetic variation and population history from 929 diverse genomes. Science 367, eaay5012. doi: 10.1126/science.aay5012
Bianco S. D., Parca L., Petrizzelli F., Biagini T., Giovannetti A., Liorni N., et al. (2023). APOGEE 2: multi-layer machine-learning model for the interpretable prediction of mitochondrial missense variants. Nat. Commun. 14, 5058. doi: 10.1038/s41467-023-40797-7
Bick A. G., Metcalf G. A., Mayo K. R., Lichtenstein L., Rura S., Carroll R. J., et al. (2024). Genomic data in the all of us research program. Nature 627, 340–346. doi: 10.1038/s41586-023-06957-x
Byrska-Bishop M., Evani U. S., Zhao X. F., Basile A. O., Abel H. J., Regier A. A., et al. (2022). High-coverage whole-genome sequencing of the expanded 1000 Genomes Project cohort including 602 trios. Cell 185, 3426–342+. doi: 10.1016/j.cell.2022.08.004
Cai M., Lei F., Chen M., Lan Q., Wu X., Mao C., et al. (2024). Systematic analyses of AISNPs screening and classification algorithms based on genome-wide data for forensic biogeographic ancestry inference. Forensic Sci. Int. 357, 111975. doi: 10.1016/j.forsciint.2024.111975
Cheung E. Y. Y., Gahan M. E., McNevin D. (2018). Prediction of biogeographical ancestry in admixed individuals. Forensic Sci. Int. Genet. 36, 104–111. doi: 10.1016/j.fsigen.2018.06.013
Deelder W., Manko E., Phelan J. E., Campino S., Palla L., Clark T. G. (2022). Geographical classification of malaria parasites through applying machine learning to whole genome sequence data. Sci. Rep. 12, 21150. doi: 10.1038/s41598-022-25568-6
Duan S., Wang M., Wang Z., Liu Y., Jiang X., Su H., et al. (2024). Malaria resistance-related biological adaptation and complex evolutionary footprints inferred from one integrative Tai-Kadai-related genomic resource. Heliyon 10, e29235. doi: 10.1016/j.heliyon.2024.e29235
Gao Y., Yang X.F., Chen H., Tan X.J., Yang Z.Q., Deng L., et al. (2023). A pangenome reference of 36 Chinese populations. Nature 619, 112–134. doi: 10.1038/s41586-023-06173-7
GenomeAsia K. C. (2019). The GenomeAsia 100K Project enables genetic discoveries across Asia. Nature 576, 106–111. doi: 10.1038/s41586-019-1793-z
Guillot G., Jonsson H., Hinge A., Manchih N., Orlando L. (2016). Accurate continuous geographic assignment from low- to high-density SNP data. Bioinformatics 32, 1106–1108. doi: 10.1093/bioinformatics/btv703
He G., Liu J., Wang M., Zou X., Ming T., Zhu S., et al. (2021). Massively parallel sequencing of 165 ancestry-informative SNPs and forensic biogeographical ancestry inference in three southern Chinese Sinitic/Tai-Kadai populations. Forensic Sci. International: Genet. 52, 102475. doi: 10.1016/j.fsigen.2021.102475
He G., Wang M., Luo L., Sun Q., Yuan H., Lv H., et al. (2024a). Population genomics of Central Asian peoples unveil ancient Trans-Eurasian genetic admixture and cultural exchanges. hLife. 2, 554–562. doi: 10.1016/j.hlife.2024.06.006
He G., Wang P., Chen J., Liu Y., Sun Y., et al. (2024b). Differentiated genomic footprints suggest isolation and long-distance migration of Hmong-Mien populations. BMC Biol. 22, 18. doi: 10.1186/s12915-024-01828-x
He G., Yao H., Duan S., Luo L., Sun Q., Tang R., et al. (2025). Pilot work of the 10K Chinese People Genomic Diversity Project along the Silk Road suggests a complex east–west admixture landscape and biological adaptations. Sci. China-life Sci. doi: 10.1007/s11427-024-2748-4
Henn B. M., Cavalli-Sforza L. L., Feldman M. W. (2012). The great human expansion. Proc. Natl. Acad. Sci. 109, 17758–17764. doi: 10.1073/pnas.1212380109
Huang Y., Wang M., Liu C., He G.. (2024). Comprehensive landscape of non-CODIS STRs in global populations provides new insights into challenging DNA profiles. Forensic Sci. Int. Genet. 70, 103010. doi: 10.1016/j.fsigen.2024.103010
Koksal Z., Meyer O. L., Andersen J. D., Gusmao L., Mogensen H. S., Pereira V., et al. (2023). Pitfalls and challenges with population assignments of individuals from admixed populations: Applying Genogeographer on Brazilian individuals. Forensic Sci. Int. Genet. 67, 102934. doi: 10.1016/j.fsigen.2023.102934
Li C. X., Pakstis A. J., Jiang L., Wei Y. L., Sun Q. F., Wu H., et al. (2016). A panel of 74 AISNPs: Improved ancestry inference within Eastern Asia. Forensic Sci. Int. Genet. 23, 101–110. doi: 10.1016/j.fsigen.2016.04.002
Li X., Wang M., Su H., Duan S., Sun Y., Chen H., et al. (2024). Evolutionary history and biological adaptation of Han Chinese people on the Mongolian Plateau. hLife 2, 296–313. doi: 10.1016/j.hlife.2024.04.005
Liao W. W., Asri M., Ebler J., Doerr D., Haukness M., Hickey G., et al. (2023). A draft human pangenome reference. Nature 617, 312–31+. doi: 10.1038/s41586-023-05896-x
Luo L., Wang M., Liu Y., Li J., Bu F., Yuan H., et al. (2025). Sequencing and characterizing human mitochondrial genomes in the biobankbased genomic research paradigm. Sci. China-Life Sci. doi: 10.1007/s11427-024-2736-7
Mallick S., Micco A., Mah M., Ringbauer H., Lazaridis I., Olalde I., et al. (2024). The Allen Ancient DNA Resource (AADR) a curated compendium of ancient human genomes. Sci. Data 11, 182. doi: 10.1038/s41597-024-03031-7
Mandape S. N., Budowle B., Mckiernan H., Slack D., Mittelman S., Mittelman K., et al. (2024). Dense SNP-based analyses complement forensic anthropology biogeographical ancestry assessments. Forensic Sci. Int. Genet. 74, 103147. doi: 10.1016/j.fsigen.2024.103147
Manichaikul A., Mychaleckyj J. C., Rich S. S., Daly K., Sale M., Chen W. M., et al. (2010). Robust relationship inference in genome-wide association studies. Bioinformatics 26, 2867–2873. doi: 10.1093/bioinformatics/btq559
Mantes A. D., Montserrat D. M., Bustamante C. D., Giró I. N. X., Ioannidis A. G. (2023). Neural ADMIXTURE for rapid genomic clustering. Nat. Comput. Sci. 3, 621–629. doi: 10.1038/s43588-023-00482-7
Nielsen R., Vaughn A. H., Deng Y. (2024). Inference and applications of ancestral recombination graphs. Nat. Rev. Genet. 26, 47–58. doi: 10.1038/s41576-024-00772-4
Pakstis A. J., Gurkan C., Dogan M., Balkaya H. E., Dogan S., Neophytou P. I., et al. (2019). Genetic relationships of European, Mediterranean, and SW Asian populations using a panel of 55 AISNPs. Eur. J. Hum. Genet. 27, 1885–1893. doi: 10.1038/s41431-019-0466-6
Pfaffelhuber P., Sester-Huss E., Baumdicker F., Naue J., Lutz-Bonengel S., Staubach F., et al. (2022). Inference of recent admixture using genotype data. Forensic Sci. Int. Genet. 56, 102593. doi: 10.1016/j.fsigen.2021.102593
Phillips C., Salas A., Sanchez J. J., Fondevila M., Gomez-Tato A., Alvarez-Dios J., et al. (2007). Inferring ancestral origin using a single multiplex assay of ancestry-informative marker SNPs. Forensic Sci. Int. Genet. 1, 273–280. doi: 10.1016/j.fsigen.2007.06.008
Price A. L., Patterson N. J., Plenge R. M., Weinblatt M. E., Shadick N. A., Reich D. (2006). Principal components analysis corrects for stratification in genome-wide association studies. Nat. Genet. 38, 904–909. doi: 10.1038/ng1847
Prugnolle F., Manica A., Balloux F. (2005). Geography predicts neutral genetic diversity of human populations. Curr. Biol. 15, R159–R160. doi: 10.1016/j.cub.2005.02.038
Rosenberg N. A., Li L. M., Ward R., Pritchard J. K. (2003). Informativeness of genetic markers for inference of ancestry. Am. J. Hum. Genet. 73, 1402–1422. doi: 10.1086/380416
Rubinacci S., Hofmeister R.J., Sousa Da Mota B., Delaneau O. (2023). Imputation of low-coverage sequencing data from 150,119 UK Biobank genomes. Nat. Genet. 55, 1088–1090. doi: 10.1038/s41588-023-01438-3
Sun Y., Wang M., Sun Q., Liu Y., Duan S., Wang Z., et al. (2024). Distinguished biological adaptation architecture aggravated population differentiation of Tibeto-Burman-speaking people. J. Genet. Genomics 51, 517–530. doi: 10.1016/j.jgg.2023.10.002
Sun Q., Wang M., Lu T., Duan S., Liu Y., Chen J., et al. (2024). Differentiated adaptative genetic architecture and language-related demographical history in South China inferred from 619 genomes from 56 populations. BMC Biol. 22, 55. doi: 10.1186/s12915-024-01854-9
Taliun D., Harris D. N., Kessler M. D., Carlson J., Szpiech Z. A., Torres R., et al. (2021). Sequencing of 53,831 diverse genomes from the NHLBI TOPMed Program. Nature 590, 290–299. doi: 10.1038/s41586-021-03205-y
Wang C. C., Yeh H. Y., Popov A. N., Zhang H. Q., Matsumura H., Sirak K., et al. (2021). Genomic insights into the formation of human populations in East Asia. Nature 591, 413–41+. doi: 10.1038/s41586-021-03336-2
Wang T., Antonacci-Fulton L., Howe K., Lawson H. A., Lucas J. K., Phillippy A. M., et al. (2022). The Human Pangenome Project: a global resource to map genomic diversity. Nature 604, 437–446. doi: 10.1038/s41586-022-04601-8
Wang J., Wu J., Sun Q., Wu Q., Li Y., Duan S., et al. (2023). Extensive genetic admixture between Tai-Kadai-speaking people and their neighbours in the northeastern region of the Yungui Plateau inferred from genome-wide variations. BMC Genomics 24, 317. doi: 10.1186/s12864-023-09412-3
Wang M., Chen H., Luo L., Huang Y., Duan S., Yuan H., et al. (2024a). Forensic investigative genetic genealogy: expanding pedigree tracing and genetic inquiry in the genomic era. J. Genet. Genomics. doi: 10.1016/j.jgg.2024.06.016
Wang M., Huang Y., Liu K., Wang Z., Zhang M., Yuan H., et al. (2024b). Multiple human population movements and cultural dispersal events shaped the landscape of chinese paternal heritage. Mol. Biol. Evol. 41 (7), msae122. doi: 10.1093/molbev/msae122
Wang C., Wang S., Zhao Y., Liu J., Zhang D., et al. (2025). A biogeographical ancestry inference pipeline using PCA-XGBoost model and its application in Asian populations. Forensic Sci. Int. Genet. 77, 103239. doi: 10.1016/j.fsigen.2025.103239
Yang Q., Luo L., Lin Z., Wen W., Zeng W., Deng H. (2024). A machine learning-based predictive model of causality in orthopaedic medical malpractice cases in China. PloS One 19, e0300662. doi: 10.1371/journal.pone.0300662
Yang C., Zhang X., Yan S., Yang S., Wu B., You F., et al. (2024). Large-scale lexical and genetic alignment supports a hybrid model of Han Chinese demic and cultural diffusions. Nat. Hum. Behav. 8, 1163–1176. doi: 10.1038/s41562-024-01886-9
Keywords: biological ancestry inference, ancestry-informative markers, East Asian, Southeast Asian, machine learning
Citation: Yang Q, Chen J, Nie S, Liu C, Deng H and He G (2025) Fine-scale biogeographical ancestry inference in Southeast and East Asians via high-efficiency markers and machine learning approaches. Front. Ecol. Evol. 13:1572596. doi: 10.3389/fevo.2025.1572596
Received: 07 February 2025; Accepted: 17 March 2025;
Published: 03 April 2025.
Edited by:
Jun Yao, China Medical University, ChinaReviewed by:
Xiaoye Jin, Guizhou Medical University, ChinaCopyright © 2025 Yang, Chen, Nie, Liu, Deng and He. This is an open-access article distributed under the terms of the Creative Commons Attribution License (CC BY). The use, distribution or reproduction in other forums is permitted, provided the original author(s) and the copyright owner(s) are credited and that the original publication in this journal is cited, in accordance with accepted academic practice. No use, distribution or reproduction is permitted which does not comply with these terms.
*Correspondence: Hong Deng, ZGhvbmcyM0AxNjMuY29t; Guanglin He, Z3VhbmdsaW5oZXNjdUAxNjMuY29t
Disclaimer: All claims expressed in this article are solely those of the authors and do not necessarily represent those of their affiliated organizations, or those of the publisher, the editors and the reviewers. Any product that may be evaluated in this article or claim that may be made by its manufacturer is not guaranteed or endorsed by the publisher.
Research integrity at Frontiers
Learn more about the work of our research integrity team to safeguard the quality of each article we publish.