 Yanchao Sun
 Menghao Qi2
94% of researchers rate our articles as excellent or good
Learn more about the work of our research integrity team to safeguard the quality of each article we publish.
Find out more
ORIGINAL RESEARCH article
Front. Ecol. Evol., 07 April 2025
Sec. Conservation and Restoration Ecology
Volume 13 - 2025 | https://doi.org/10.3389/fevo.2025.1565632
This article is part of the Research TopicEcosystem Condition Assessments: Progress towards a Global StandardView all 6 articles
Introduction: Ecosystem services (ESs) assessment plays a significant role in managing ecological resources. From the perspective of land use, this research aims to uncover the complex interdependence between ESs and their key drivers to clarify and optimize the ecological function zoning in the region.
Methods: This research focuses on Henan Province in China, quantifying five key ESs, namely, carbon storage (CS), habitat quality (HQ), soil conservation (SC), water conservation (WC), and water yield (WY), and assessing their interactions from 2000 to 2020 and in 2035. Moreover, this study explores the social - ecological driving factors influencing these ESs. Finally, it classifies five types of ecosystem service bundles (ESBs).
Results: (1) From 2000 to 2020, the land use evolution was characterized by a large expansion of construction land, a continuous decrease in cultivated land area, and relatively stable changes in other land types. In the ecological protection (EP) scenario of 2035, the cultivated land area decreased the most, and the forest land area increased slightly. CS and HQ showed a trend of degradation, while SC, WY, and WC first fluctuated and then increased. (2) The synergistic relationship between each function was the main one, among which WC-WY, CS-HQ and HQ-SC showed significant synergistic relationships, CS-WC and HQ-WC showed a change from trade-off to synergistic relationship, while CS-WC and HQ-WC were mainly trade-off relationships. Meanwhile, most of the B4 bundles in the central part of the region were dominated, and the rest of the service bundles showed a decrease in volatility. (3) Elevation and slope are the dominant factors restricting the spatiotemporal distribution of CS, HQ, and SC. Temperature and precipitation are the primary conditions affecting the spatiotemporal differentiation of WY and WC. Moreover, the interaction between topographic factors and climatic conditions has a greater impact on each function than a single factor.
Discussion: In conclusion, during the study period from 2000 to 2020, there was a significant spatio-temporal heterogeneity in various ecosystem service functions in Henan Province. Approaches such as exploring the trade-off and synergistic relationships of different ecosystems in 2035, classifying ecosystem service clusters, and discussing potential driving factors can provide references for the territorial space governance and ecological environment protection in Henan Province.
Ecosystem services (ESs) refer to the natural environment conditions and utilities provided by natural systems and processes for human survival and development. They are the cornerstone of directly or indirectly providing human well-being and sustainable social development (Hicks et al., 2015; Costanza et al., 1998, 2017). In the context of rapid economic and social development, massive population growth has led to more severe encroachment on resources. As a result, 15 out of the world’s 24 ESs have been degraded in the past half-century (Bennett et al., 2009). Therefore, in the subsequent United Nations Millennium Ecosystem Assessment, ecosystem services were divided into four categories: supply, regulation, support, and cultural services (Loiselle et al., 2023). This has led more and more scholars to study the intrinsic relationship between ESs and regional development (Jiang et al., 2021).
As the spatial material carrier for human society’s production and life (Xu et al., 2023), land-use patterns and intensities can directly reflect the impact of local human activities on the ecosystem. This is a crucial factor in determining the direct influence on ESs (Rao et al., 2018; Xie et al., 2020). However, due to the interconnectedness of different ESs (Wang et al., 2018), the spatiotemporal heterogeneity of land use (Masood et al., 2023), and the diversity of human needs (Bi et al., 2024), there exist trade-offs and synergies among various ESs. Henan Province lies in the middle of China’s east to west economic development zone. Under the new development pattern, it has a prominent strategic position. Therefore, exploring the spatiotemporal evolution characteristics of ESs and the trade-offs and synergies between different services is of great significance for optimizing the regional land space layout, ensuring ESs, and promoting high-quality regional development.
Due to the differences and diversity among ESs and the interactions and restrictions between their functions, there is a spatiotemporal correlation between the trade-offs and synergies among ESs. This has become a hot topic in current ecosystem research (Duan et al., 2023; He et al., 2023). ESs refer to the tangible or intangible benefits derived from the structures, functions, and processes of ecosystems. In recent years, with the development of research methods such as remote sensing technology and mathematical modeling, many models for ecosystem service assessment have emerged, including the ARtificial Intelligence for Ecosystem Services (ARIES) model, the Social Values for Ecosystem Services (SolVES) model, and the Integrated Valuation of Ecosystem Services and Tradeoffs (InVEST) model. These models provide evidence of the evolution of ESs in a region at a specific spatiotemporal scale. The InVEST model, in particular, has the advantages of simple data requirements and high evaluation accuracy. By leveraging the spatial expression capabilities of GIS software, it enables the visualization of multi-scale spatiotemporal exploration results, offering a model reference for different regions. For example, Li et al. (2024c) and Liu et al. (2024) conducted assessments of ESs in Southwest China and the Wuhan Metropolitan Area, respectively. Both studies found that the ESs in these regions vary significantly with changes in spatial and temporal scales and are closely related to land-use changes in the study areas. However, previous studies only analyzed the spatiotemporal evolution characteristics of ecosystems in the regions, overlooking the spatiotemporal relationships and driving mechanisms among different functions.
In view of this, relevant scholars have adopted different perspectives, such as the spatial superposition analysis method (Cademus et al., 2014), the difference comparison method (Jia et al., 2020), and the pixel correlation analysis method (Yang R. et al., 2024), to analyze the trade-off and synergy relationships of ESs. To explore the driving factors of the spatiotemporal differentiation of regional ESs, scholars mostly use models such as multiple linear regression (Chen et al., 2020), random forest (Li et al., 2024b), and geographical detector (Chen Z. et al., 2024). In addition, the spatiotemporal evolution of land use is a hot topic in the current scenario analysis of ESs (Nie et al., 2023). This makes future land-use scenario simulation an important approach for scholars to better understand the relationship between ESs and land-use change (Xu et al., 2022). Thanks to the powerful spatial computing capabilities of the Cellular Automata (CA) model, spatial prediction and analysis models, such as the CA-Markov model, CLUE-S model, and FLUS model, have been developed. However, these models have certain limitations. For example, they have difficulties in dynamically simulating the patch evolution of multiple land uses, lack flexibility in handling changes in multiple land-use patches, and are restricted in fine-scale simulations.
In contrast, the PLUS model proposed by Liang et al. (2021) retains the flexibility and efficiency of the FLUS model in simulating multiple land uses. Additionally, it integrates a land expansion strategy analysis module and a CA model based on multi-type random patch seeds. This enables a more accurate simulation of the non-linear relationships underlying land use and the analysis of land-use change strategies. Moreover, the PLUS model can effectively reveal the evolutionary trends of land-use patches at the patch level and has advantages in large-scale, long-time-series simulations. As a result, it can better incorporate restrictive factors, such as the policies and measures of the study area, for refined scenario simulations (Yu et al., 2023). At this stage, the current situation analysis and evaluation of the trade-offs in the cooperative relationship of ecosystem service functions mainly focus on ecological zoning, while research on the driving mechanism based on the evolutionary differentiation of each function and multi-scenario prediction is still scarce. In this context, comprehensively understanding the complex interactions and dynamics among multiple ESs, especially under future scenarios, is of great significance.
To address the above limitations, this research opts for Henan Province as the focal study area. Henan Province is located in the middle zone of China’s economic development from east to west. Under the new development pattern, it has transformed from a traditional agricultural province to a new industrial province, a cultural province, a major economic province, and a major inland open province with a prominent strategic position. Therefore, coordinating the relationship between economic development and ecological protection in the future is the key to achieving high-quality development. To this end, considering the ecological and environmental attributes of the research area and the features of the InVEST model, five typical services, namely carbon storage (CS), soil conservation (SC), water conservation (WC), water yield (WY), and habitat quality (HQ), were selected for in-depth analysis. The ESs under future land use scenarios in Henan Province were assessed, and their trade-offs/synergies and bundling were discussed, providing scientific support for regional environmental management, decision-making, and sustainable development.
Henan Province (31°23’–36°22’ N, 110°21’–116°39’ E) is located in the middle and lower reaches of the Yellow River in China. It borders Anhui and Shandong to the east, Hebei and Shanxi to the north, Shaanxi to the west, and Hubei to the south (Figure 1). The terrain in the province is generally higher in the west and lower in the east. The Huanghuaihai Plain, with flat terrain in the east and middle, is surrounded by the Taihang Mountains, Funiu Mountain, Tongbai Mountain, and Dabie Mountain in the north, west, and south. The climate is a continental monsoon climate in the transition zone from subtropical to warm-temperate, with an average annual precipitation of 500–900 mm and an average annual temperature of 12°C–16°C. As of 2023, the province’s GDP was 5.913239 trillion yuan, ranking sixth in the country, and the total population at the end of the year was 98.15 million. Henan Province is an important birthplace of the Chinese nation, traditional Chinese culture, and Chinese civilization. It is a major producer of agricultural products, a province rich in mineral resources, a comprehensive transportation hub, a major agricultural province, and a major province for grain transformation and processing in China. In recent years, urbanization in Henan Province has entered a stage of rapid development, which requires a large amount of resources. At present, it is facing many ecological problems, such as ecological destruction and resource shortage. Therefore, coordinating urban development and ecological protection is an urgent issue.
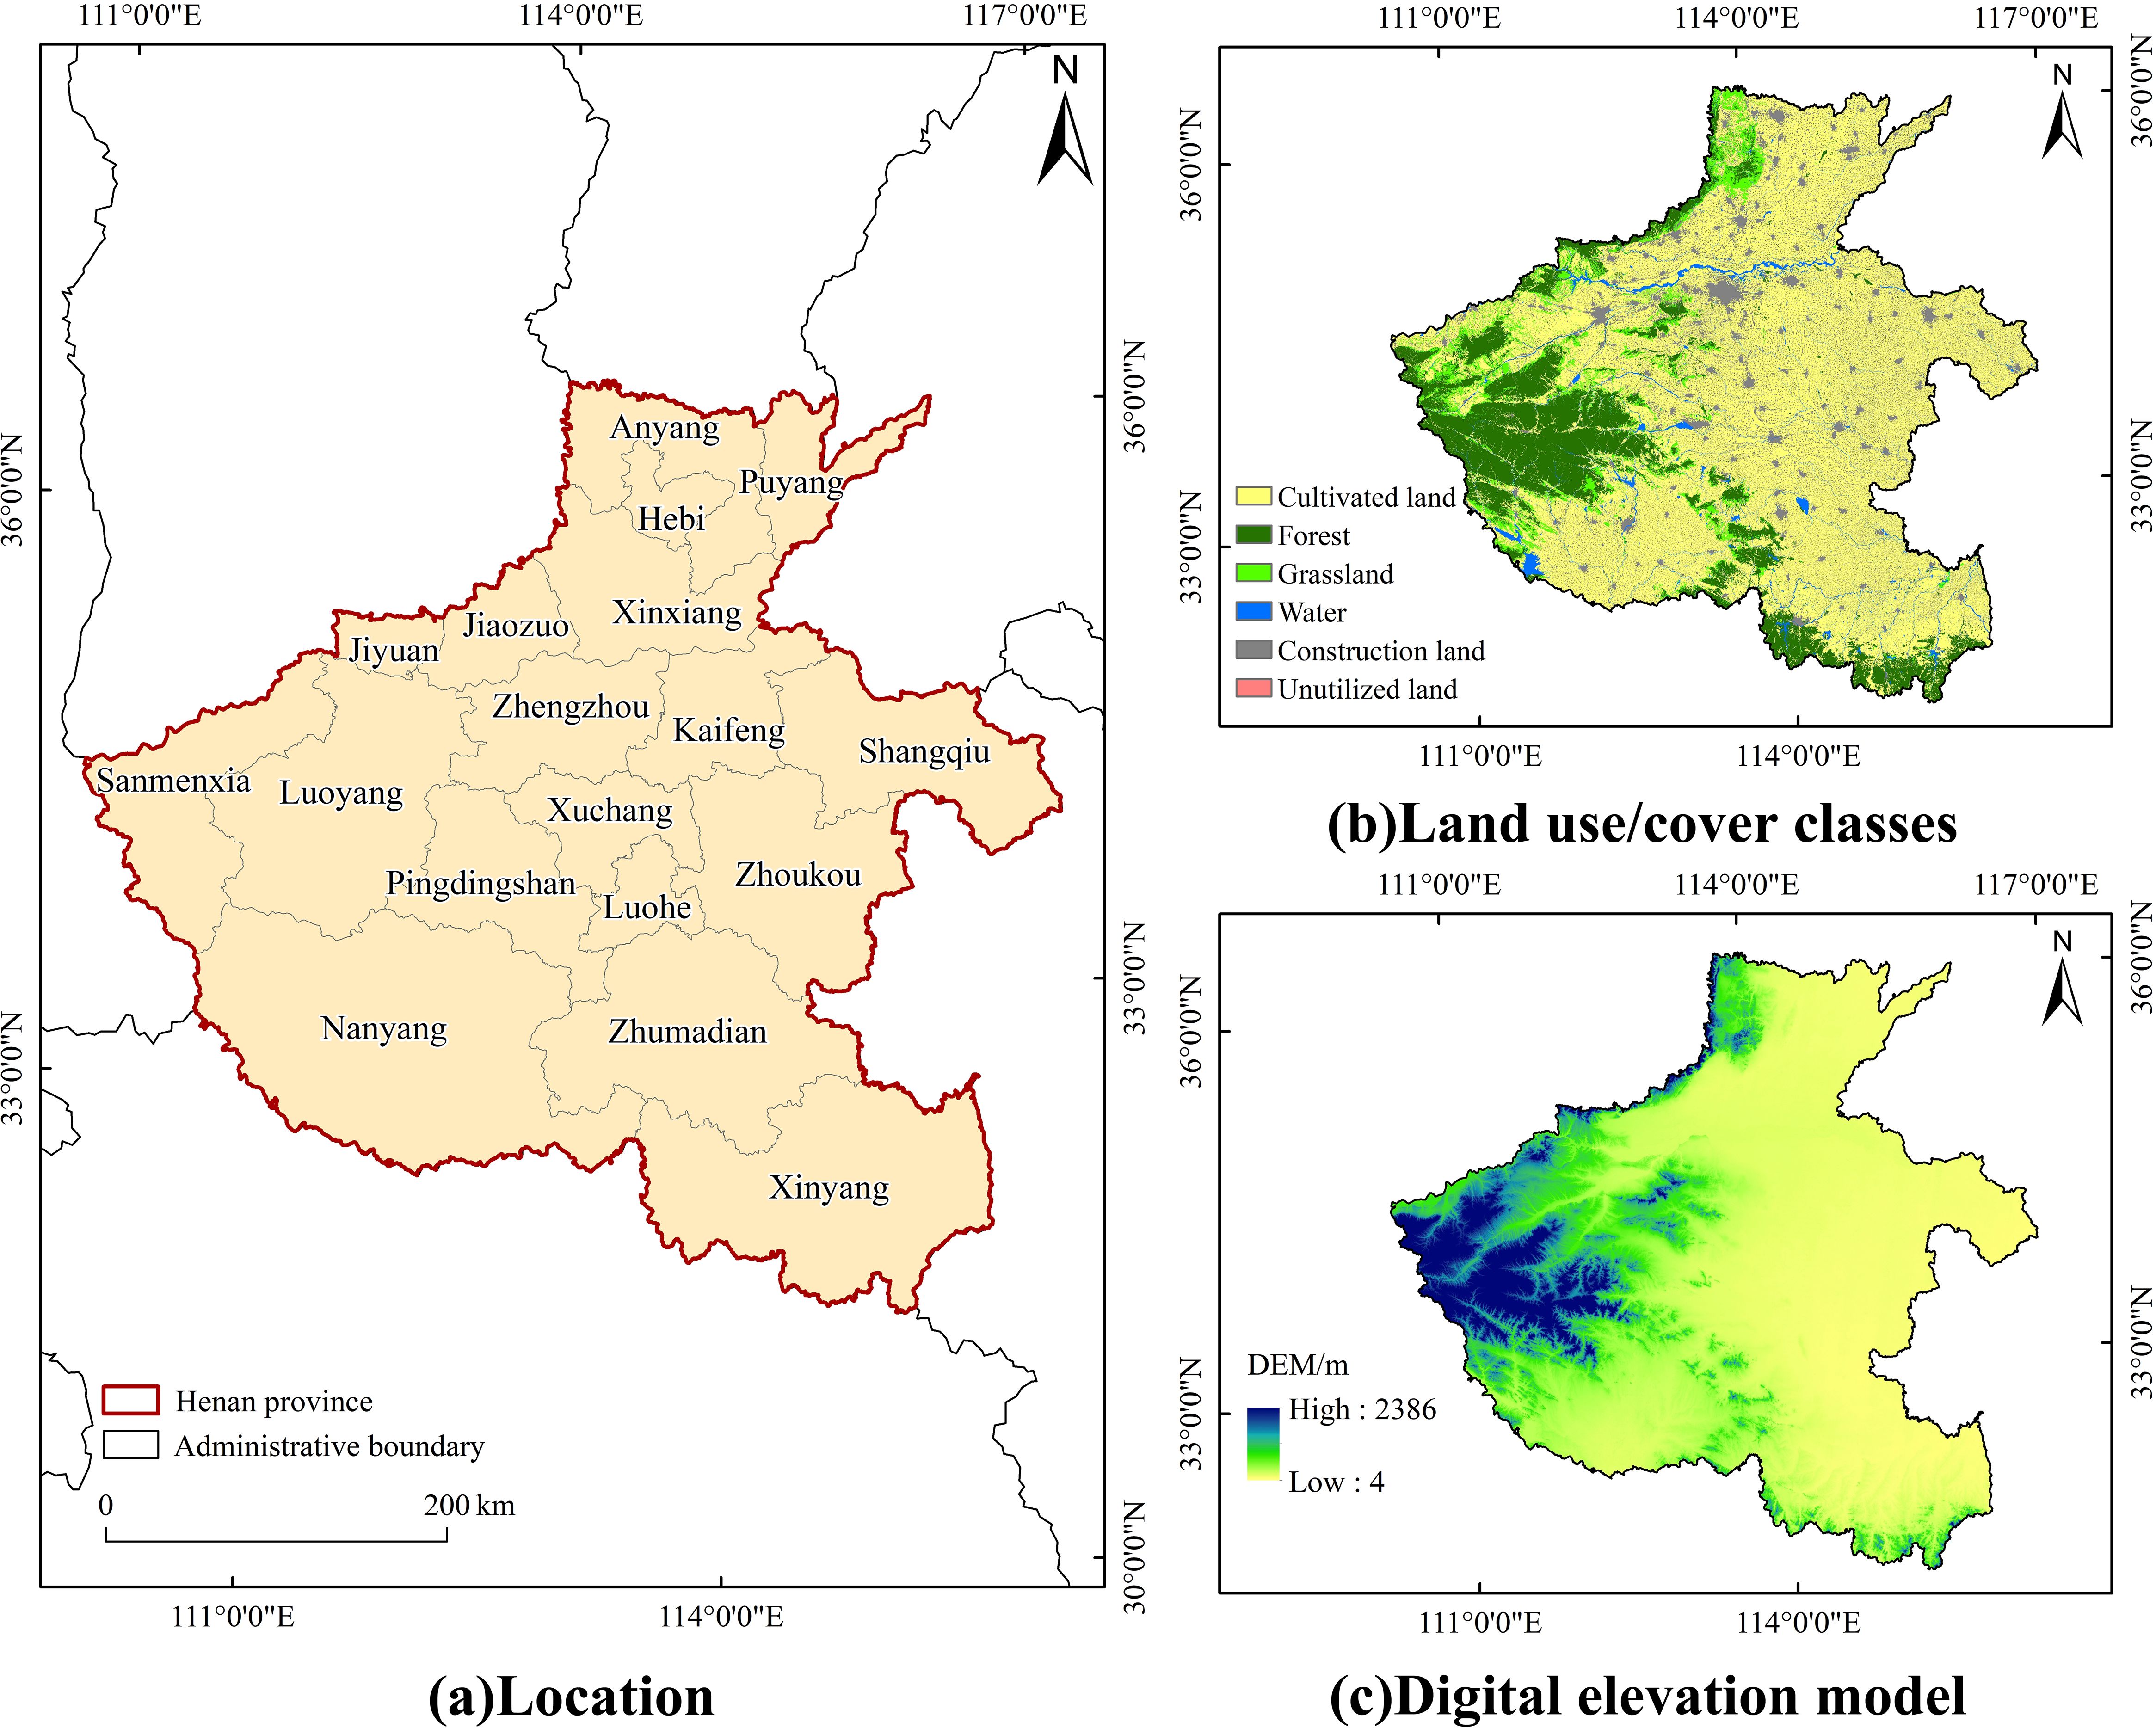
Figure 1. Location map of the Henan Province. (a) Geographical location of the Henan Province; (b) Land use/cover class of the Henan Province; (c) Digital Elevation Model of the Henan Province.
The research data mainly consist of spatial data, including land use, climate, DEM, and soil data, as well as attribute data such as population and economic data. The aforementioned data were pre-processed through steps including projection transformation, cropping, and resampling. The resampling resolution was standardized to an accuracy of 30m, and the coordinate system was standardized to Krasovsky_1940_Albers. Detailed information about these datasets is presented in Table 1.
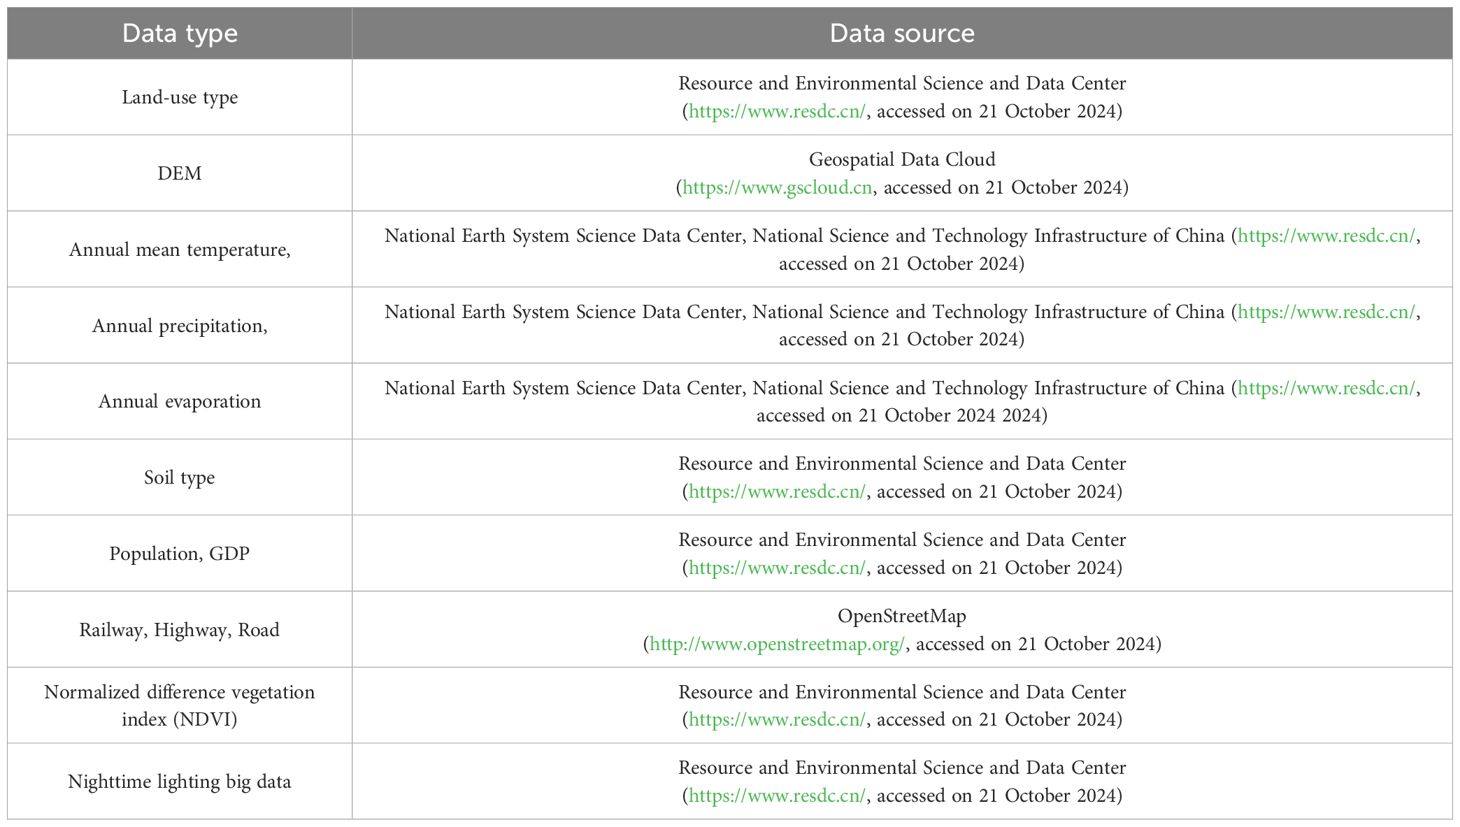
Table 1. Details of the research data.
Our research framework is as follows. Initially, based on the “Land and Space Planning of Henan Province (2021–2035)”, the PLUS model was used to predict land use for 2035. Next, the InVEST model was employed to calculate five types of ESs using land-use and climate data. Then, the spatiotemporal distribution characteristics of ES trade-offs/synergies from 2000 to 2020 and in 2035 were analyzed. Finally, the SOM and Geodetector methods were used to determine the ES bundles and key factors. The findings offer significant guidance for ecosystem management and the formulation of implementation plans.
We used the PLUS model to simulate land use in Henan Province. The PLUS model is a patch-based land-use change simulation model. The model integrates two modules: the Land Expansion Analysis Strategy (LEAS) and the CA mode based on multiple random seeds (CARS). By mining the potential mechanism of various land use changes, it can conduct refined dynamic prediction of patches at all levels (Cao et al., 2024; Wang et al., 2024a).
We set three development scenarios for 2035 based on the “Land and Space Planning of Henan Province (2021–2035)”, referring to existing studies (Fan et al., 2023) and combining the actual development situation of the region and future social and economic development plans, as shown in Table 2. Specifically, the natural development scenario (ND) forecasts the land-use demand in 2035 according to the Markov chain without adjusting or considering policy restrictions and other factors based on the current development situation. In the ecological protection scenario (NP), in accordance with the strengthened protection of ecological land such as forest land, grassland, and waters in Henan Province, while strictly restricting their conversion to other land types, the transfer probability of forest land, grassland, and waters to construction land is reduced to 50%. The transfer probability of cultivated land to forest land, grassland, and waters is increased to 40%, and the transfer probability to construction land is reduced by 50%. In the economic growth scenario (ED), on the basis of the natural development scenario, the transfer probability of various types of land to construction land is increased.
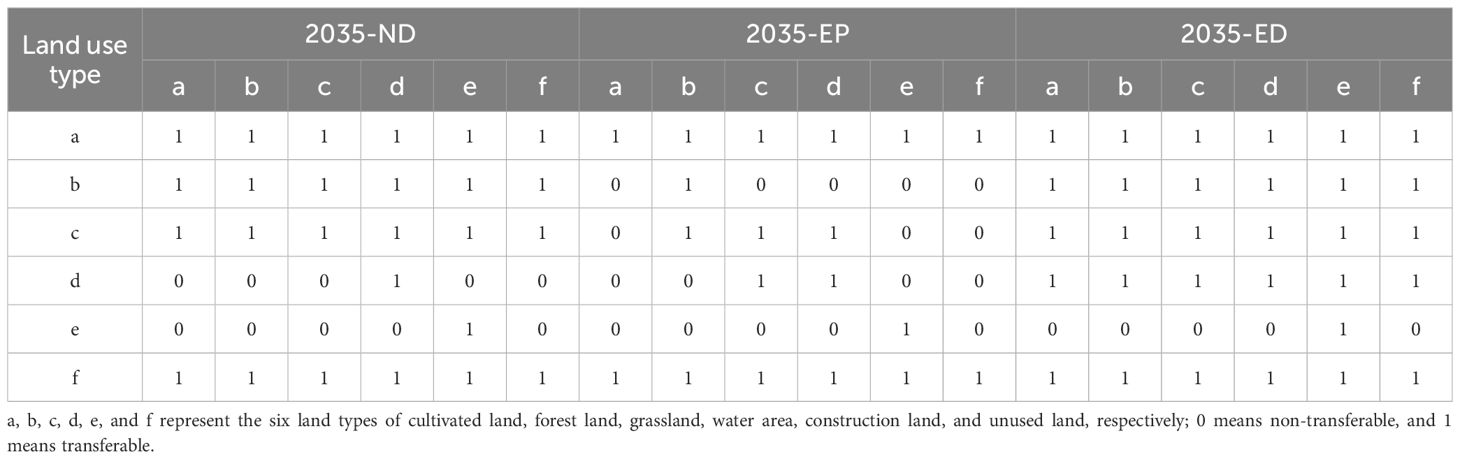
Table 2. Scenario transition matrix setting.
We simulated the land-use scenario in 2020 based on the land-use data in 2010. The Kappa coefficient was 0.89, which indicates that the model passed the test and met the accuracy requirements.
This study used the InVEST model to calculate CS (Li and Geng, 2023). The calculation formula is:
In the formula, denotes the aboveground biomass carbon storage in tons (t). represents the underground biomass carbon storage in tons (t). represents the soil organic carbon storage in tons (t). indicates the carbon storage from dead organic matter in tons (t). is regional total carbon storage (t). Carbon density in this paper mainly refers to the results of relevant research studies (Sun et al., 2023; Hua et al., 2024; Li et al., 2024b; Zhang et al., 2024).
The InVEST model assesses the status of biodiversity through the magnitude of HQ (Broquet et al., 2024). The calculation formula is:
In the formula, is the HQ (dimensionless) of grid unit x in land type j; denotes the habitat attribute or suitability of land type j; signifies the degree of habitat degradation for grid unit x in land type j; K is the half-saturation coefficient; and z is the default normalization constant of the model (z= 2.5) (Chen et al., 2021; Hu et al., 2022).
SC is calculated through the sediment delivery ratio module in the InVEST model (Xie et al., 2023). The specific calculation of the model is as follows:
In the formula, denotes the amount of soil conservation. represents the potential soil erosion amount in tons (t). indicates the actual soil erosion amount in tons (t). R and K represent the precipitation and soil erosion factors, respectively. denotes the slope length and slope factor. The magnitudes of the P and C factors are between 0 and 1, and the values are assigned by consulting the relevant literature in similar research areas and combining the special conditions of the research area (Li et al., 2024a; Cen et al., 2023).
We employed the InVEST model to calculate WY (Ren et al., 2024). The calculation formula within the model is presented below:
In the formula, denotes the water production of grid unit x in land type j (mm). represents the actual evapotranspiration. denotes the average precipitation (Ma et al., 2024; Wang et al., 2024b).
After calculating the annual water yield using the InVEST model (Huang et al., 2023), the WC is calculated as follows:
In the formula, indicates the water conservation supply (mm). is the velocity coefficient. is the topographic index. is the soil saturated hydraulic conductivity (mm/d). is WY (Li et al., 2023b; Wang et al., 2023).
We used the Spearman correlation analysis method to determine the trade-offs/synergies between ESs in Henan Province. The Spearman correlation analysis can effectively identify the mutual relationship and the strength of the trade-off and synergy among various functions (Lyu et al., 2024). When the correlation coefficient R is positive, it means that the two types of services have a cooperative relationship; conversely, it is a trade-off relationship (He et al., 2024; Kirby et al., 2024). Specifically, we conducted a Spearman correlation analysis using R 4.4.1 software for the periods from 2000 to 2020 and in 2035.
We used self-organizing maps (SOMs) to determine ES bundles in the area. Based on principal component analysis and bundle analysis, this method preserves the topological structure of the input space through the neighbor relationship function and incorporates spatial information into the analysis (Wei et al., 2024). It employs a competitive learning strategy to measure the similarity of various ESs in the grid by relying on the competition between nerve cells, and then identifies and classifies its service bundles (Chen W. et al., 2024; Gao et al., 2024).
As a new statistical method used to explore spatial differentiation, Geodetector consists of four parts: factor detector, risk detector, interaction detector, and ecological detector (Li et al., 2024c; Wang et al., 2010). In this study, we selected the factor detector and the interaction detector to analyze the driving factors of ESs in Henan Province.
In the formula, q indicates the degree of impact of various drivers on ES drivers, and the range of q is 0–1. h represents the ES in the entire region and donates the variance of the supply-demand ratio (Li et al., 2023a).
The main land-use types in Henan Province are cultivated land and forest land. Cultivated land covers roughly 64% of Henan Province, while forest land makes up approximately 16.32% (Figure 2). Over the last 20 years, the proportions of various land types in terms of area can be ranked in the following order: cultivated land > forest land > construction land > grassland > water area > unused land. Specifically, as an important contributor to other land-use changes, cultivated land significantly decreased by 4841.5 km² from 2000 to 2020. Forest land increased from 26,958.49 km² in 2000 to 27,043.71 km² in 2020, showing a fluctuating increasing trend during the study period. In contrast, construction land was the only land type to have expanded, increasing by 4615.76 km². Other land types showed minimal changes.
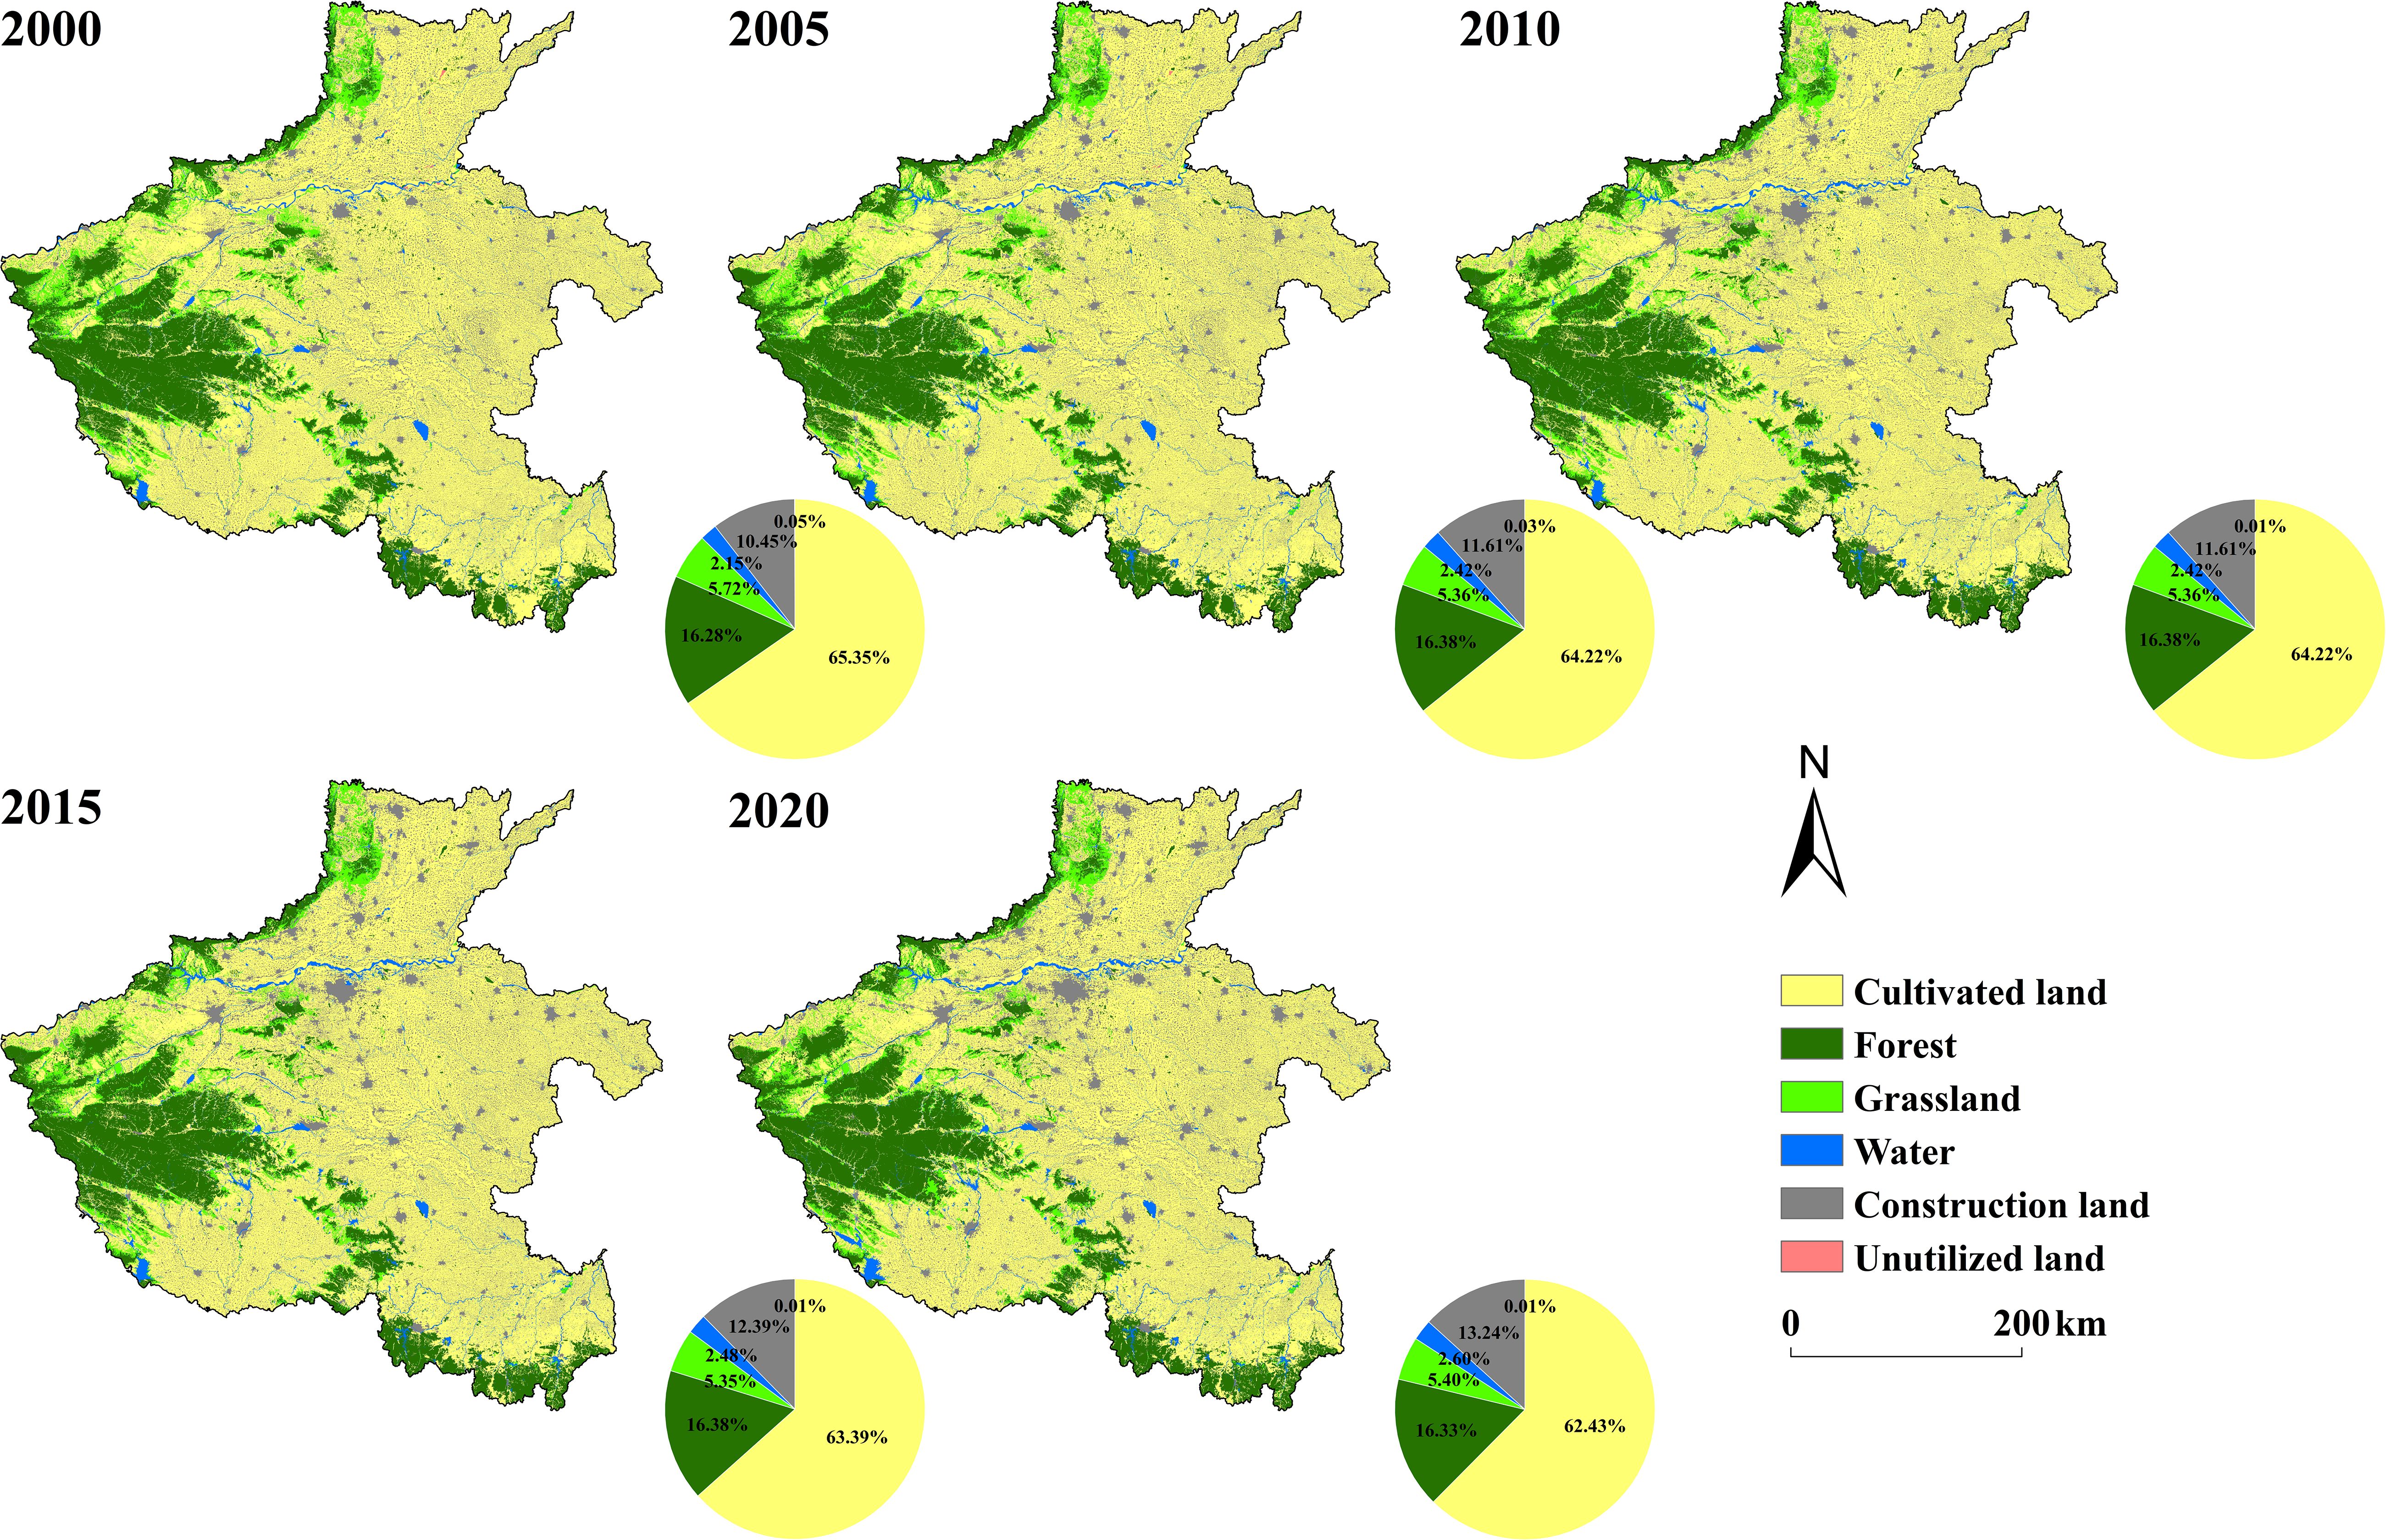
Figure 2. Spatial distribution of land use in Henan Province from 2000 to 2020.
In terms of spatial arrangement, due to differences in terrain, landforms, and climatic conditions, cultivated land is mainly distributed in the Huanghuaihai Plain in the central and eastern regions, with a small amount in the Nanyang Basin in the southwest. Forest land, as the second-largest land type, is more concentrated, mainly distributed in the mountainous and hilly areas such as the western and southern Taihang Mountains, Funiu Mountains, Tongbai Mountains, and Dabie Mountains. Construction land is mainly distributed in patches in the central and eastern urban areas. Grassland and water areas account for a small proportion. Among them, grassland is mainly distributed within forest areas, and water areas are affected by terrain and are concentrated in the eastern region.
To clearly describe the changes in land use and cover change (LUCC) in Henan Province, we quantitatively presented the conversion relationships between different LUCC types using a Sankey diagram (Figure 3). Over the last 20 years, cultivated land was an important outgoing land type in the study area, experiencing an annual decrease. Specifically, it mainly changed into construction land and forest land, accounting for 74.08% and 13.29%, respectively. These two land types are important incoming components for cultivated land transfer. The transferred-out area of forest land was about 1,669.00 km², mainly transferring into cultivated land and grassland, accounting for 59.10% and 20.04%, respectively. This indicates that the loss of forest land is an important way to supplement the decrease in cultivated land area. Moreover, the degradation of forest land quality was also manifested as it gradually turned into grassland and wasteland. It is worth noting that the area of construction land increased each year, with a total increase of 3,764.69 km² during this period, and cultivated land was an important incoming source for its expansion. The areas of grassland and unused land changed little, and their conversions mainly occurred among forest land, construction land, and water areas.
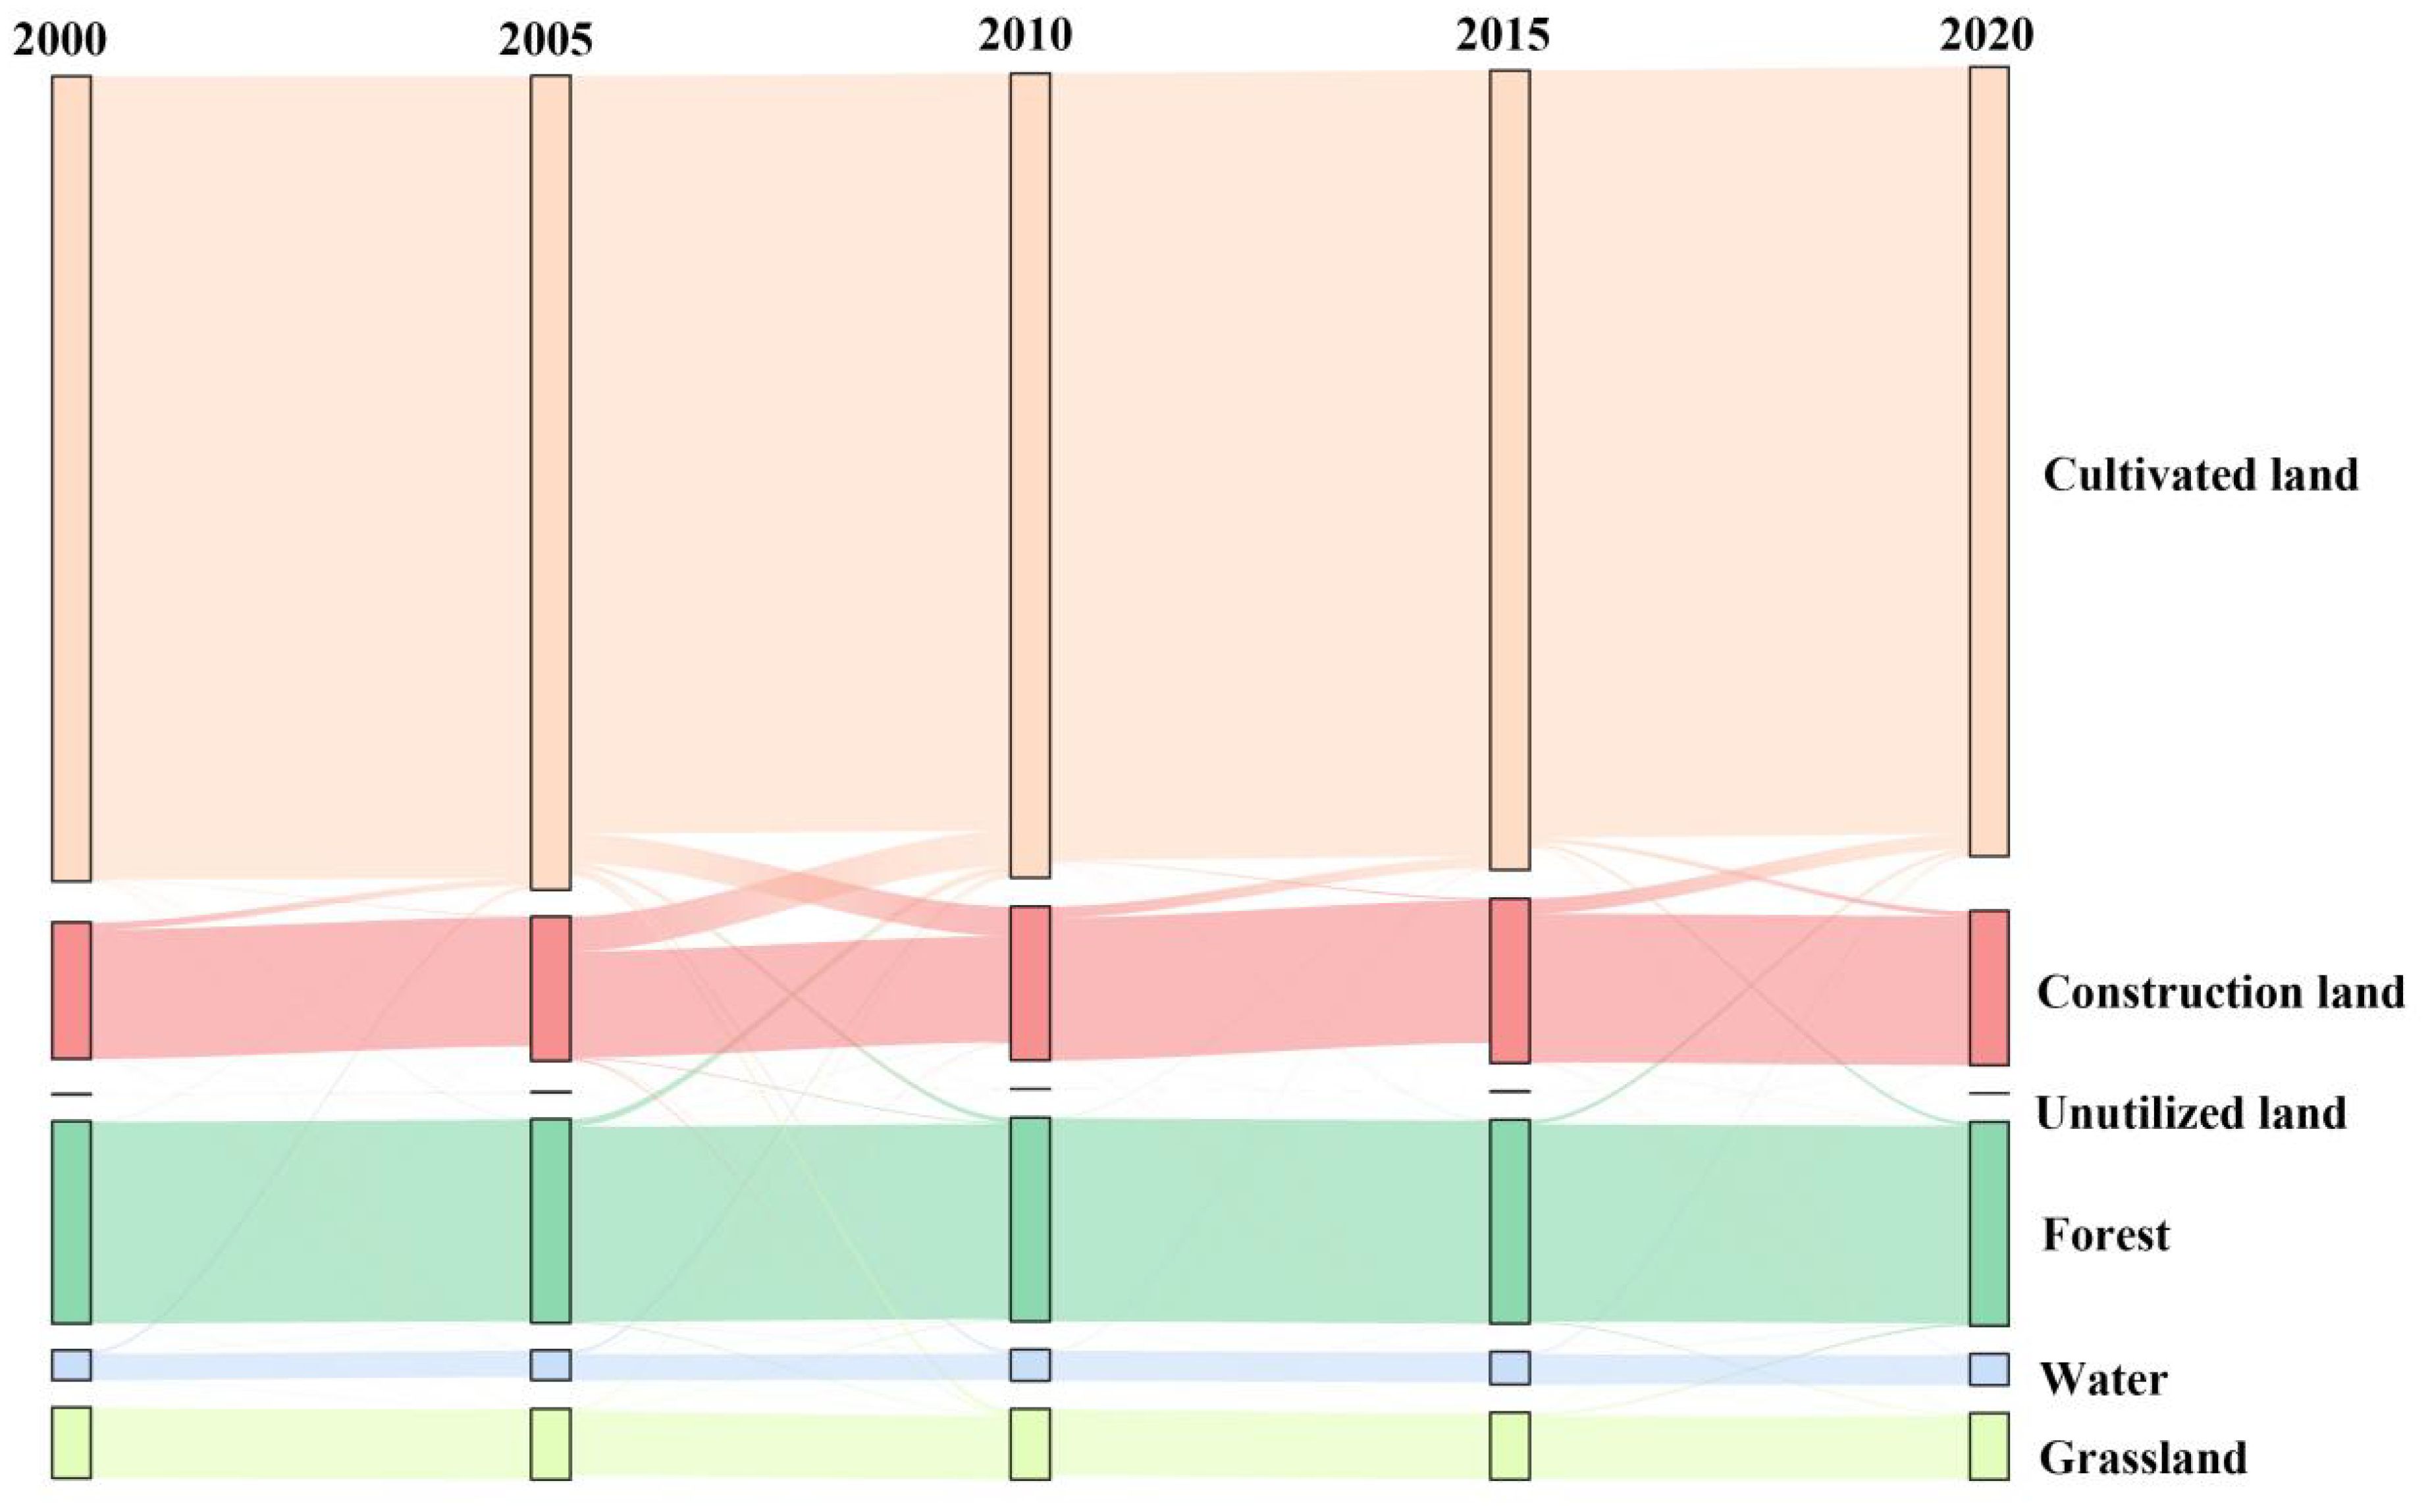
Figure 3. Land use conversion in Henan Province from 2000 to 2020.
In short, the land-use evolution pattern in Henan Province over the past 20 years is that construction land has continued to grow, the loss of cultivated land has been serious, and the change in other land types has been relatively stable. It can be concluded that the reserve resources suitable for reclamation in Henan Province will not meet the needs of rapidly expanding urban areas. Therefore, the occupation of ecological land cannot be avoided in the process of urbanization. Coordinating ecological protection and economic construction development has become a major challenge for Henan Province to achieve high-quality development in the future.
Based on the LUCC data for the study area in 2020, the validated PLUS model was employed to forecast the spatial distribution of LUCC change in 2035 under various scenarios (Figures 4, 5). Specifically, compared with 2020, under the ND scenario in 2035, cultivated land, forest land, and unused land decreased by 2751.84 km², 97.26 km², and 4.87 km², respectively, while grassland, water area, and construction land increased by 65.53 km², 262.56 km², and 2539.35 km², respectively. This indicates that under this scenario, cultivated land and forest land, as the major land types, mainly change to construction land and water area, and there is a relatively large loss of regional ecological land. Under the EP scenario, the areas of cultivated land and unused land decrease by 3,029.04 km² and 3.67 km², respectively, while the areas of forest land, grassland, water area, and construction land increase by 524.74 km², 148.53 km², 273.56 km², and 2099.35 km², respectively. Although construction land expands significantly, its expansion is slow compared with the ND scenario. This indicates that under this scenario, due to the implementation of strict ecological protection and management policies, the expansion of artificial surfaces such as construction land is restricted to a certain extent so that ecological land is effectively protected. In the ED scenario, cultivated land, forest land, grassland, and water areas all decline to varying degrees, with losses of 2905.05 km², 200.12 km², 164.44 km², and 258.16 km², respectively. Meanwhile, construction land and unused land expand by 3276.35 km² and 7.20 km². This indicates that under this scenario, construction land expands rapidly, and ecological land is severely damaged.
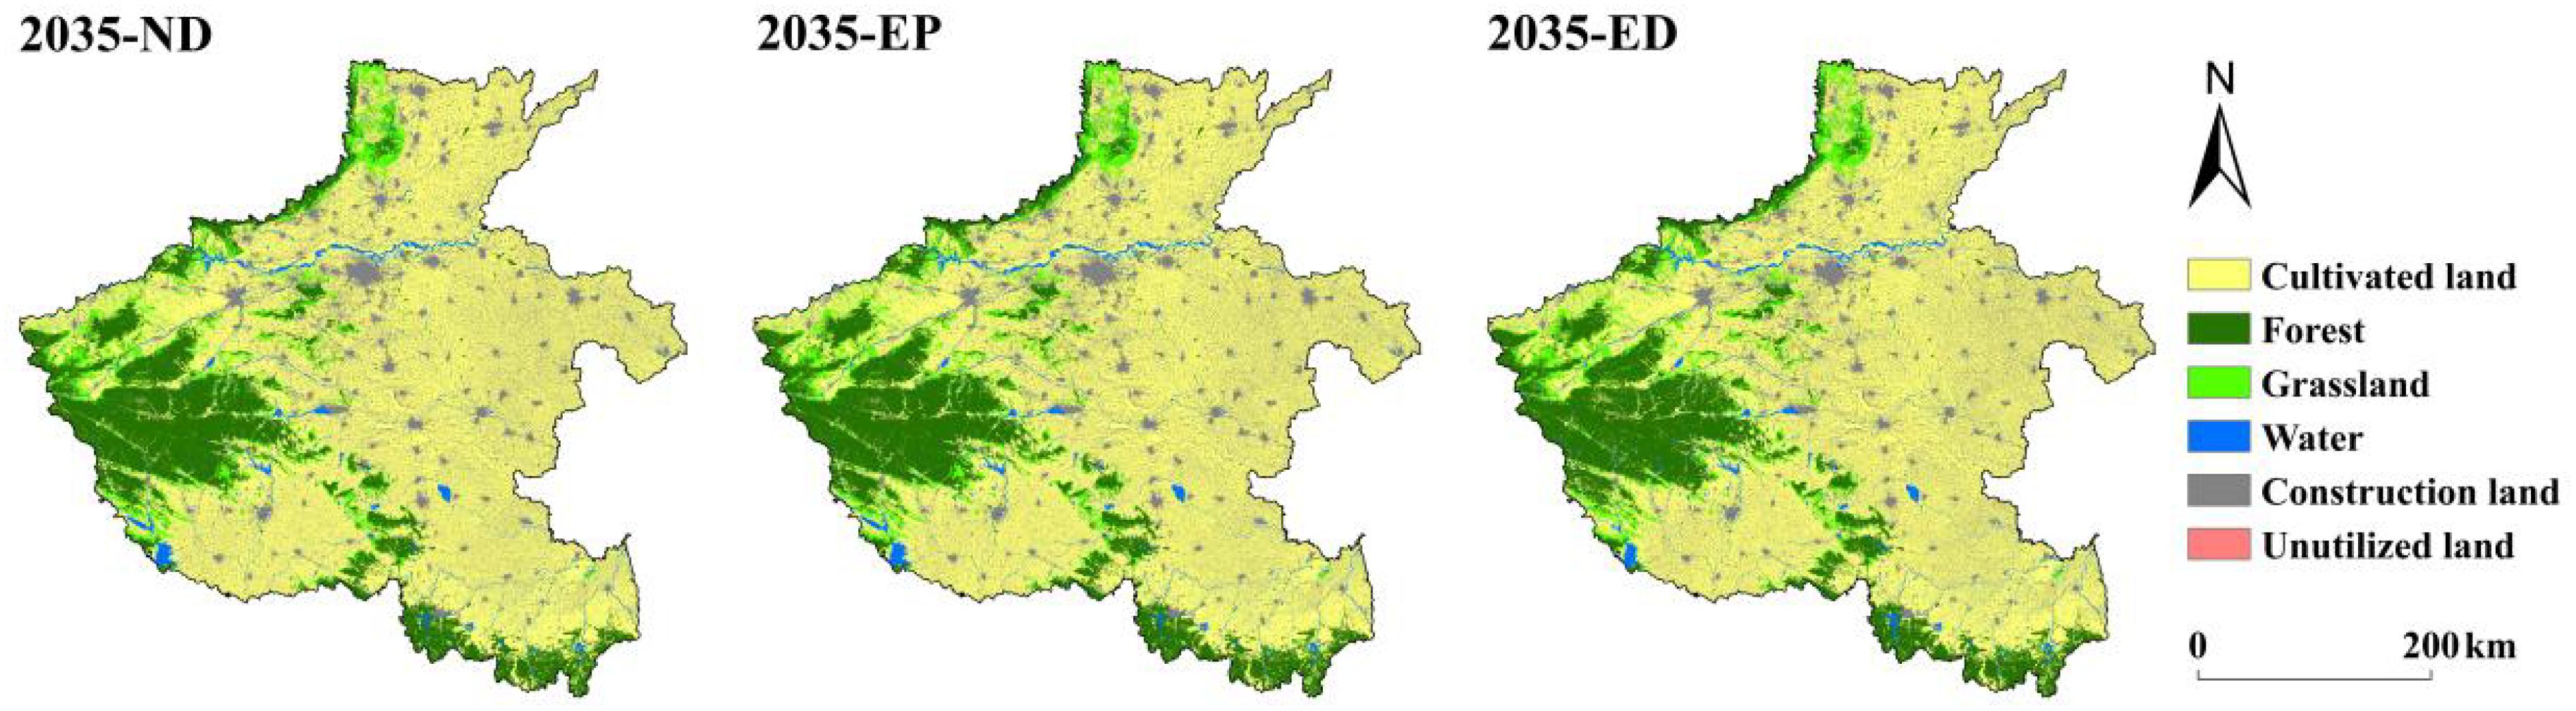
Figure 4. Land use conversion in Henan Province from 2000 to 2020.
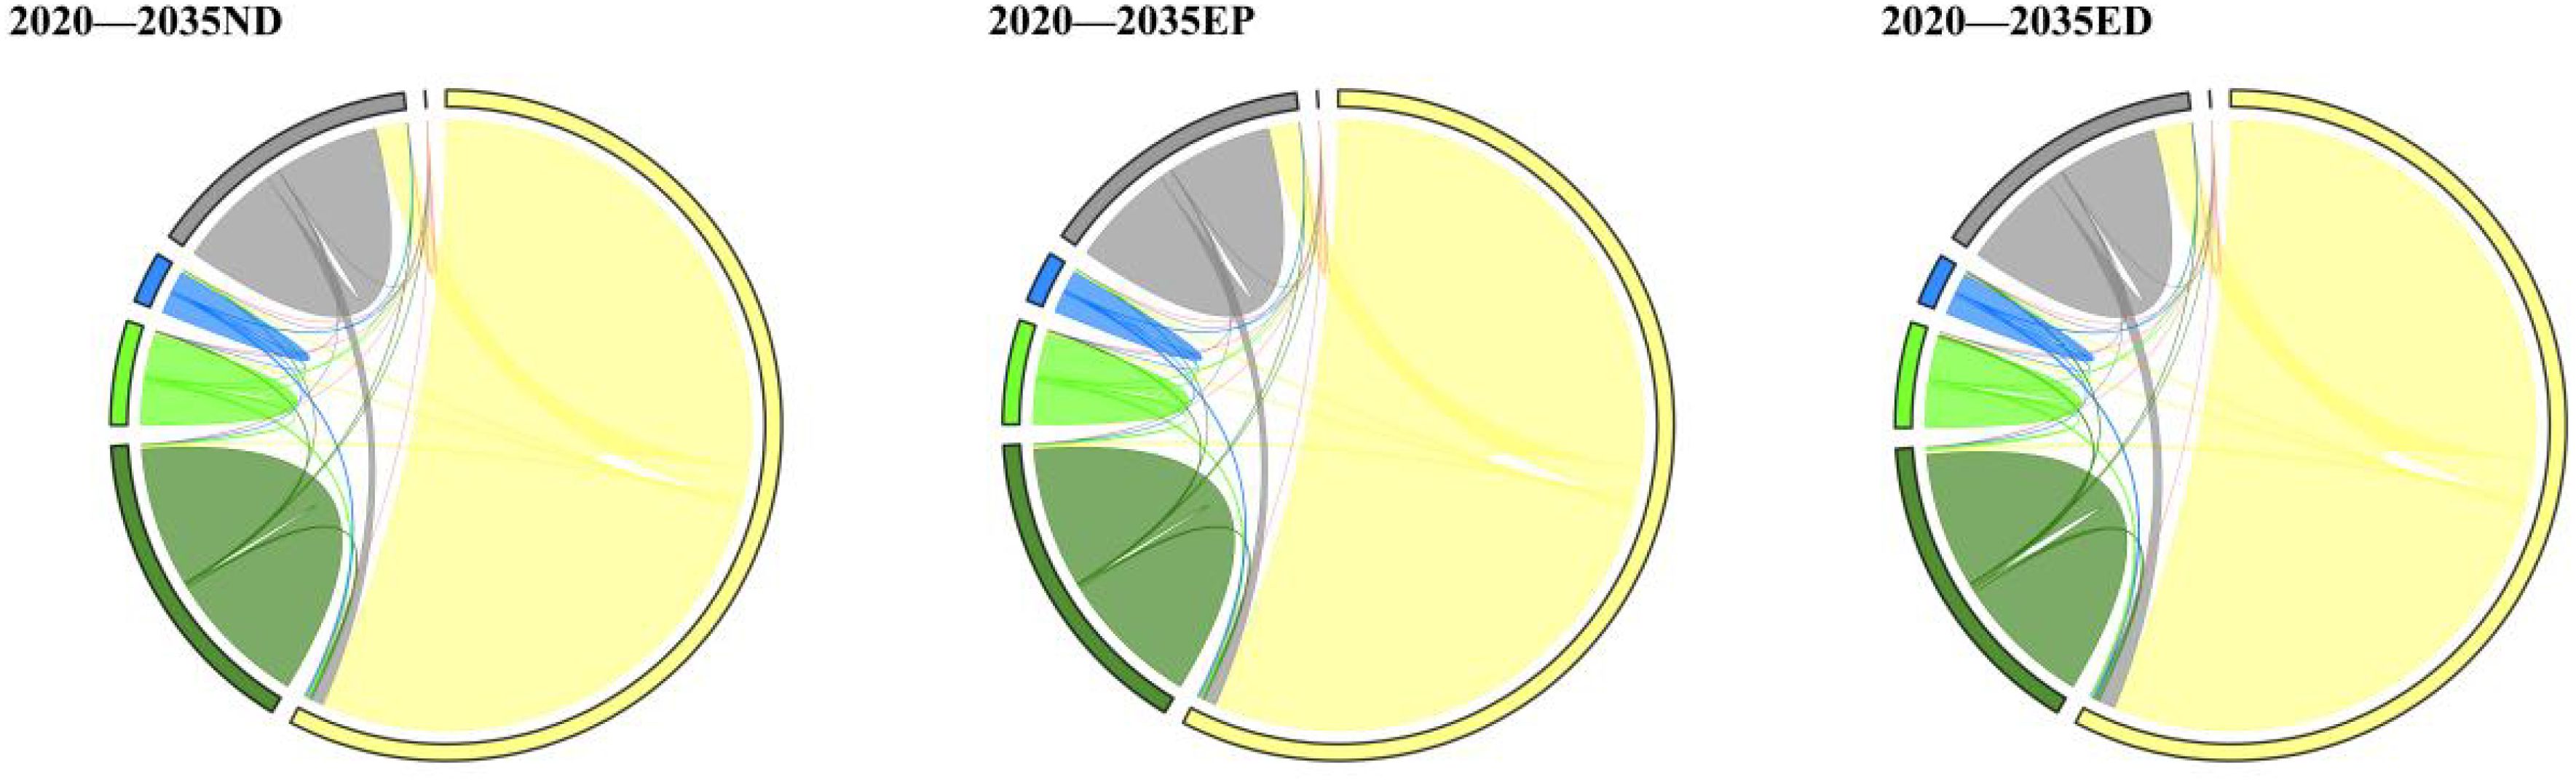
Figure 5. Dynamic changes in LUCC types in the Henan Province in 2035 under different scenarios.
In the above three scenarios, the land-use distribution characteristics are basically the same as the distribution pattern in 2020. Among them, in the EP scenario, the cultivated land area experiences the most loss. This is mainly due to the impact of ecological protection policies such as returning farmland to forests, grasslands, and lakes, which leads to a certain increase in forest land in this scenario. At the same time, the expansion scale of construction land in this scenario also slows down. In the ED and ND scenarios, the expansion speed of construction land significantly increases. At the same time, various types of ecological land and cultivated land are lost to varying degrees. Among them, the ED scenario is particularly severe. This indicates that the expansion of urban scale caused by population concentration and economic growth will inevitably pose a threat to cultivated land and ecological land in Henan Province in the future.
The distribution of the five types of ESs in Henan Province shows significant spatial differences (Figure 6). Specifically, the western and southern parts of Henan Province are mostly low mountains and hills, with the land types mainly being woodlands and grasslands. These natural conditions are favorable for CS, HQ, SC, WC, and WY, resulting in this spatial feature. Due to relatively less intensive human activities in these areas, the overall ecosystem stability was relatively high during the study period. The good vegetation coverage led to high-density CS and high HQ in this area, thereby enhancing the performance of WC and SC. These factors contributed to the overall spatial characteristics of ESs, which are high in the west and south and low in the middle and northeast (Table 3).
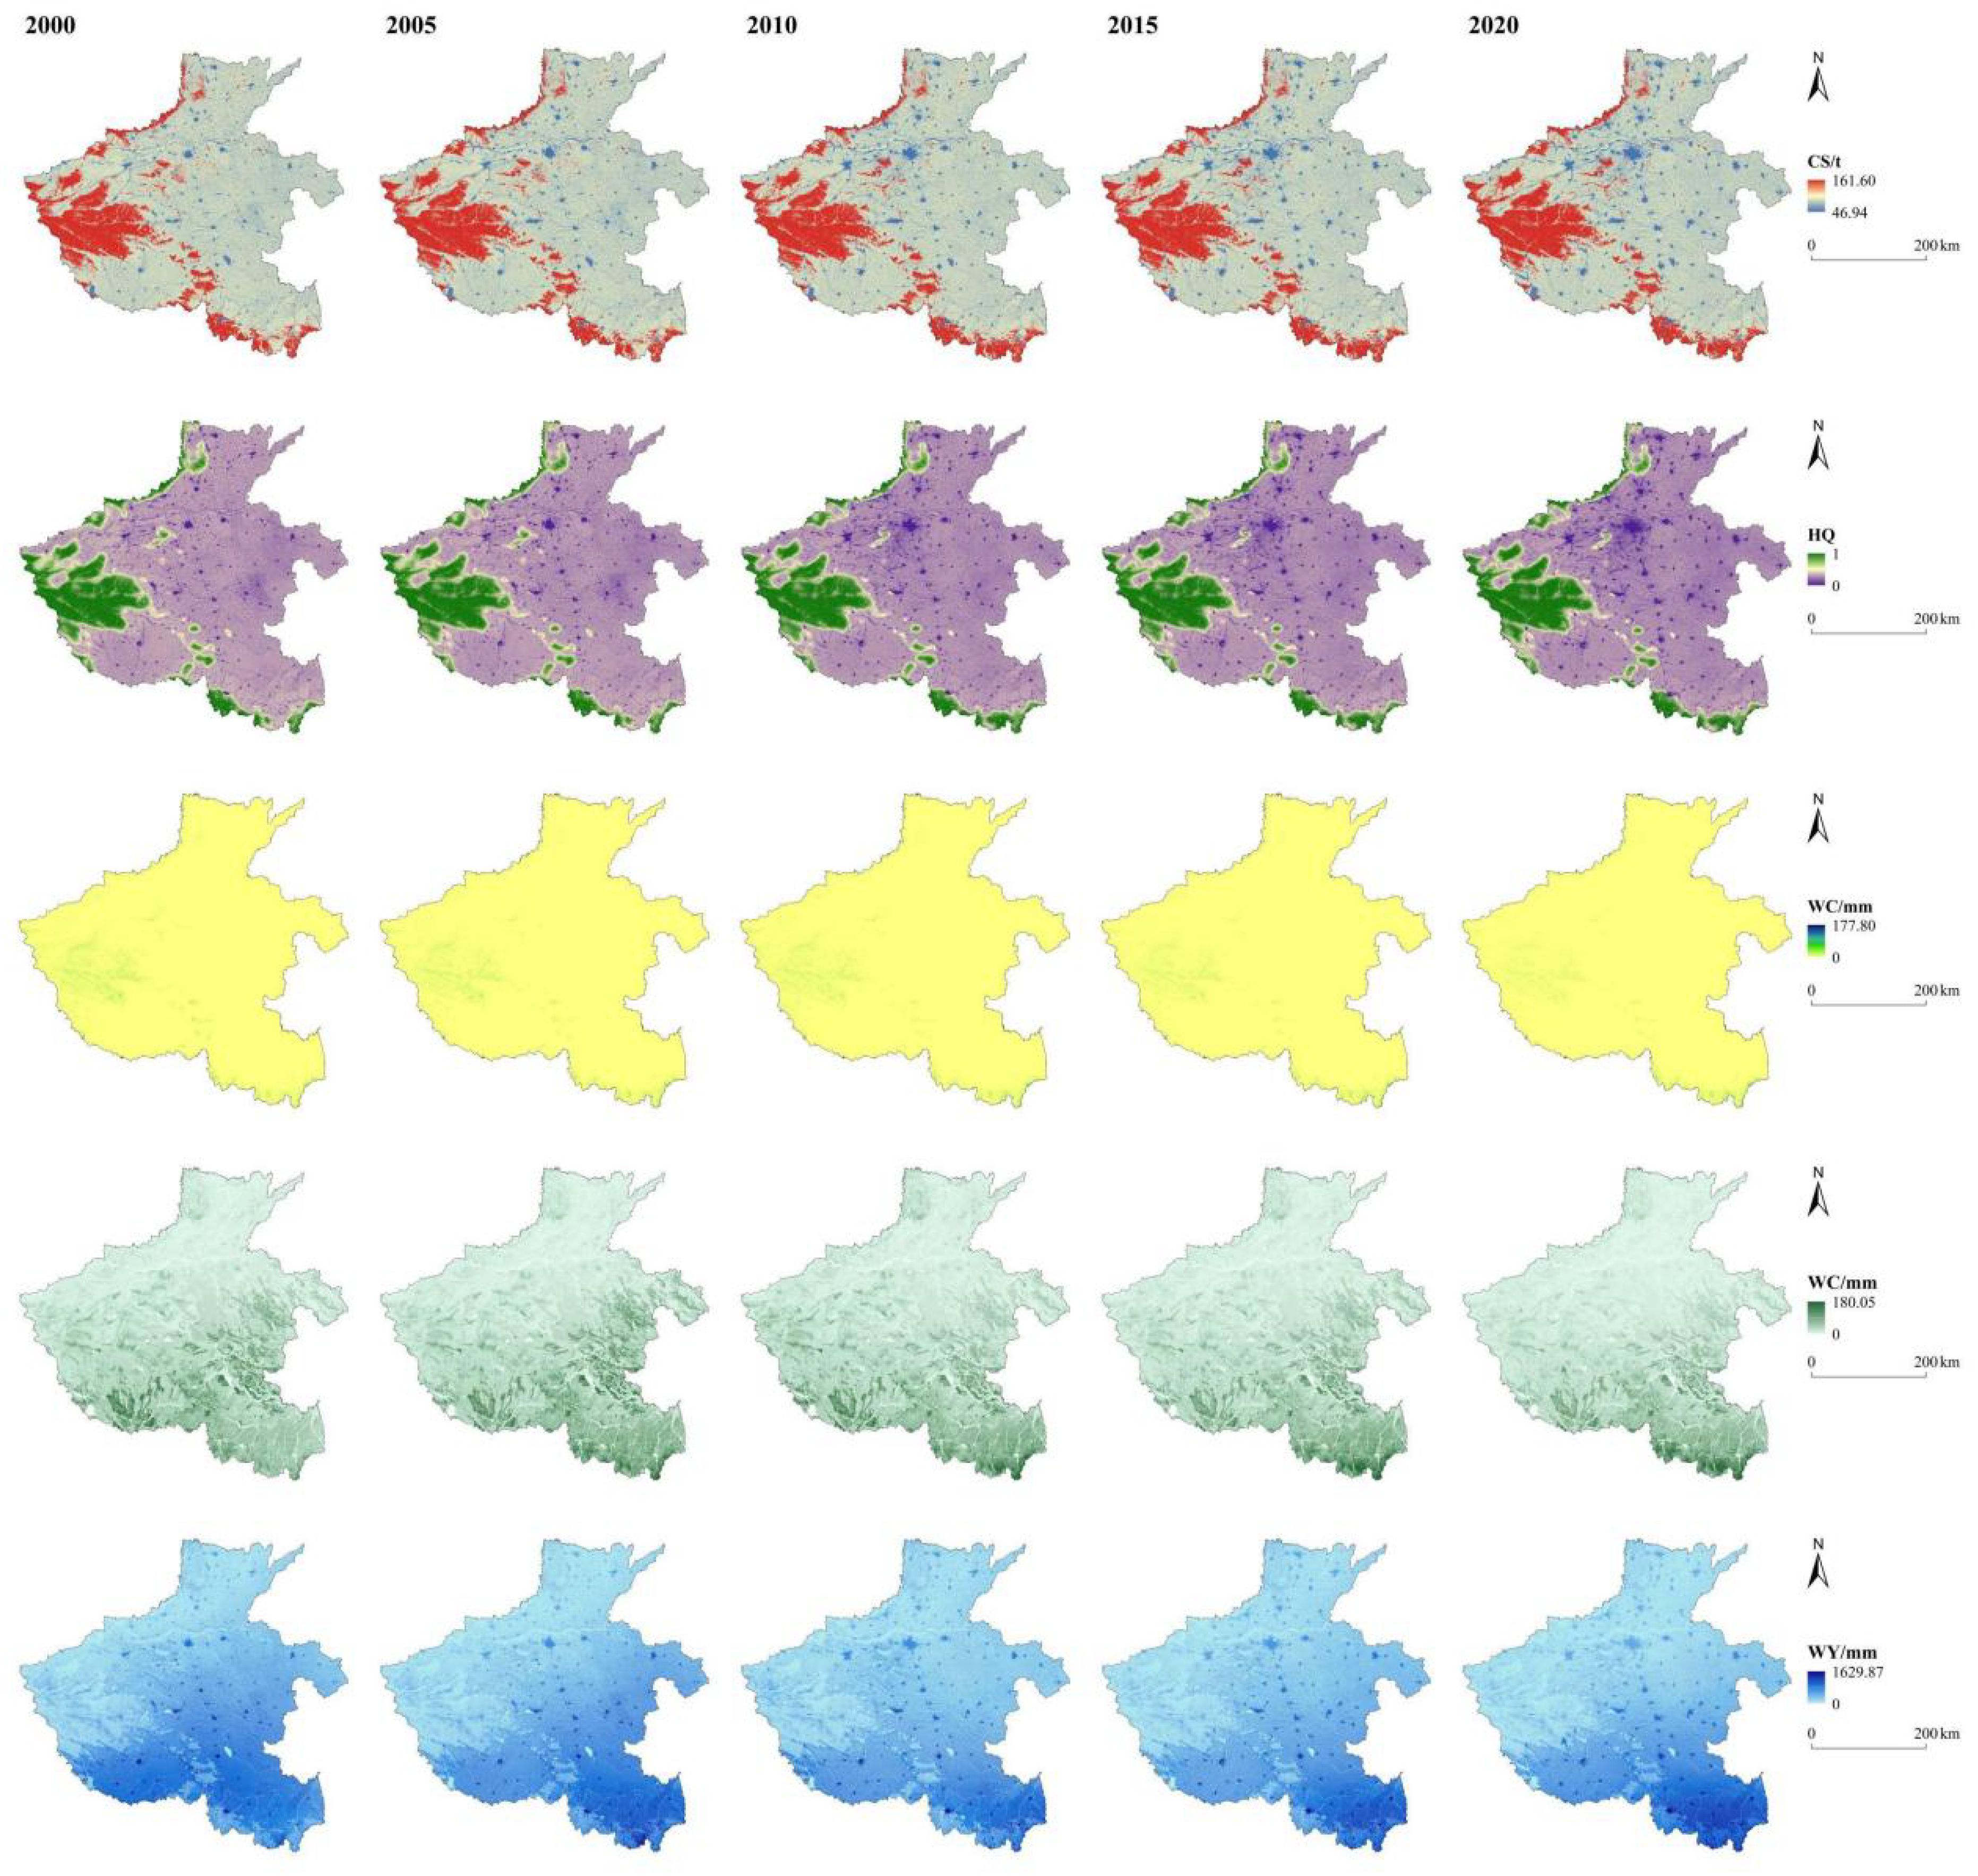
Figure 6. The spatiotemporal distribution of ESs in Henan Province from 2000 to 2020.
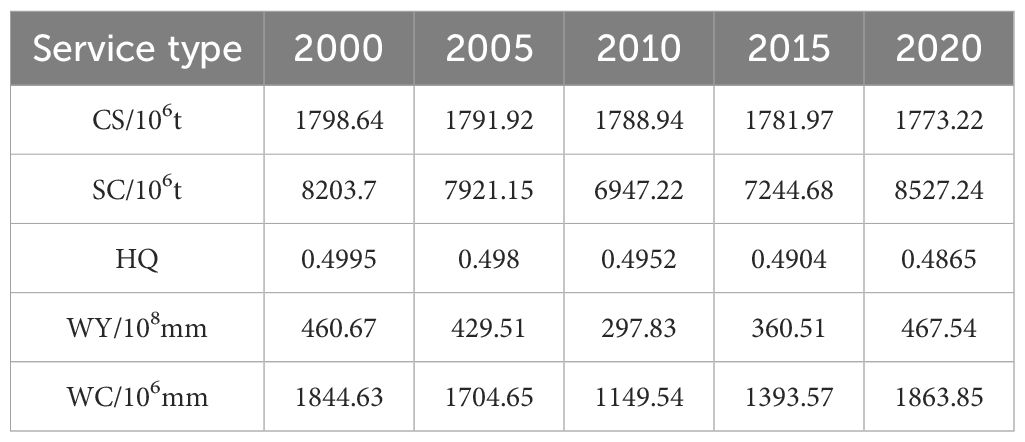
Table 3. Time change of ecosystem service functions in Henan Province from 2000 to 2020.
However, significant trends were observed in the ESs of Henan Province. CS and HQ declined, while SC, WC, and WY showed a fluctuating trend of first decreasing and then increasing. Specifically, CS decreased from 1798.64×106t in 2000 to 1773.22×106t in 2020, with a total loss of 25.42×10⁶t over 20 years. Furthermore, the level of HQ was generally low, dropping from 0.4995 in 2000 to 0.4865 in 2020. The main reason for the decline is that, in the past 20 years, the rapid expansion of construction land has led to the loss and degradation of a large amount of ecological land. Since Henan Province is located in the inland of the Central Plains, its water-regulating ability is weak due to factors such as geographical location and natural environment. Moreover, the poor water-retention function is caused by low vegetation coverage. Therefore, SC, WY, and WC in the research area showed a fluctuating trend of first decreasing and then increasing. Specifically, from 2000 to 2010, they showed a downward trend. SC decreased from 8203.70×106t in 2000 to 6947.22×106t in 2010. WY and WC decreased from 460.67×108mm and 1844.63×106mm in 2000 to 297.83×108mm and 1149.54×106mm in 2010, respectively. Then, from 2010 to 2020, they showed an upward trend. SC increased from 6947.22×106t in 2010 to 8527.24×106t in 2020. WY and WC increased from 297.83×108mm and 1149.54×106mm to 467.54×108mm and 1863.85×106mm in 2020, respectively.
Overall, the five types of ESs in Henan Province from 2000 to 2020 exhibited strong spatial heterogeneity, yet the spatial pattern was basically the same. Spatially, CS, SC, and HQ were high in the western and southern hilly mountains and low in the central and northeastern plains. WY and WC were high in the southeast and low in the northwest.
Based on the multi-scenario land use types in 2035 predicted by the PLUS model, we calculated the ecosystem services under multiple scenarios in 2035 (Figure 7). In terms of spatial distribution, compared with the ND scenario, the large-scale expansion of construction land and the loss of ecological land area in the ED scenario cause the spatial differentiation of CS and HQ in the high-value areas of the study area to tend to be fragmented. This phenomenon is prominent in cities such as Zhengzhou and Kaifeng in the central region. Compared with the ND and ED scenarios, the effective protection of ecological land, such as woodland in the EP scenario, slows down the degradation of CS, HQ, and WC functions in the study area to a certain extent. This phenomenon is remarkable in the mountainous and hilly areas of the west and south.
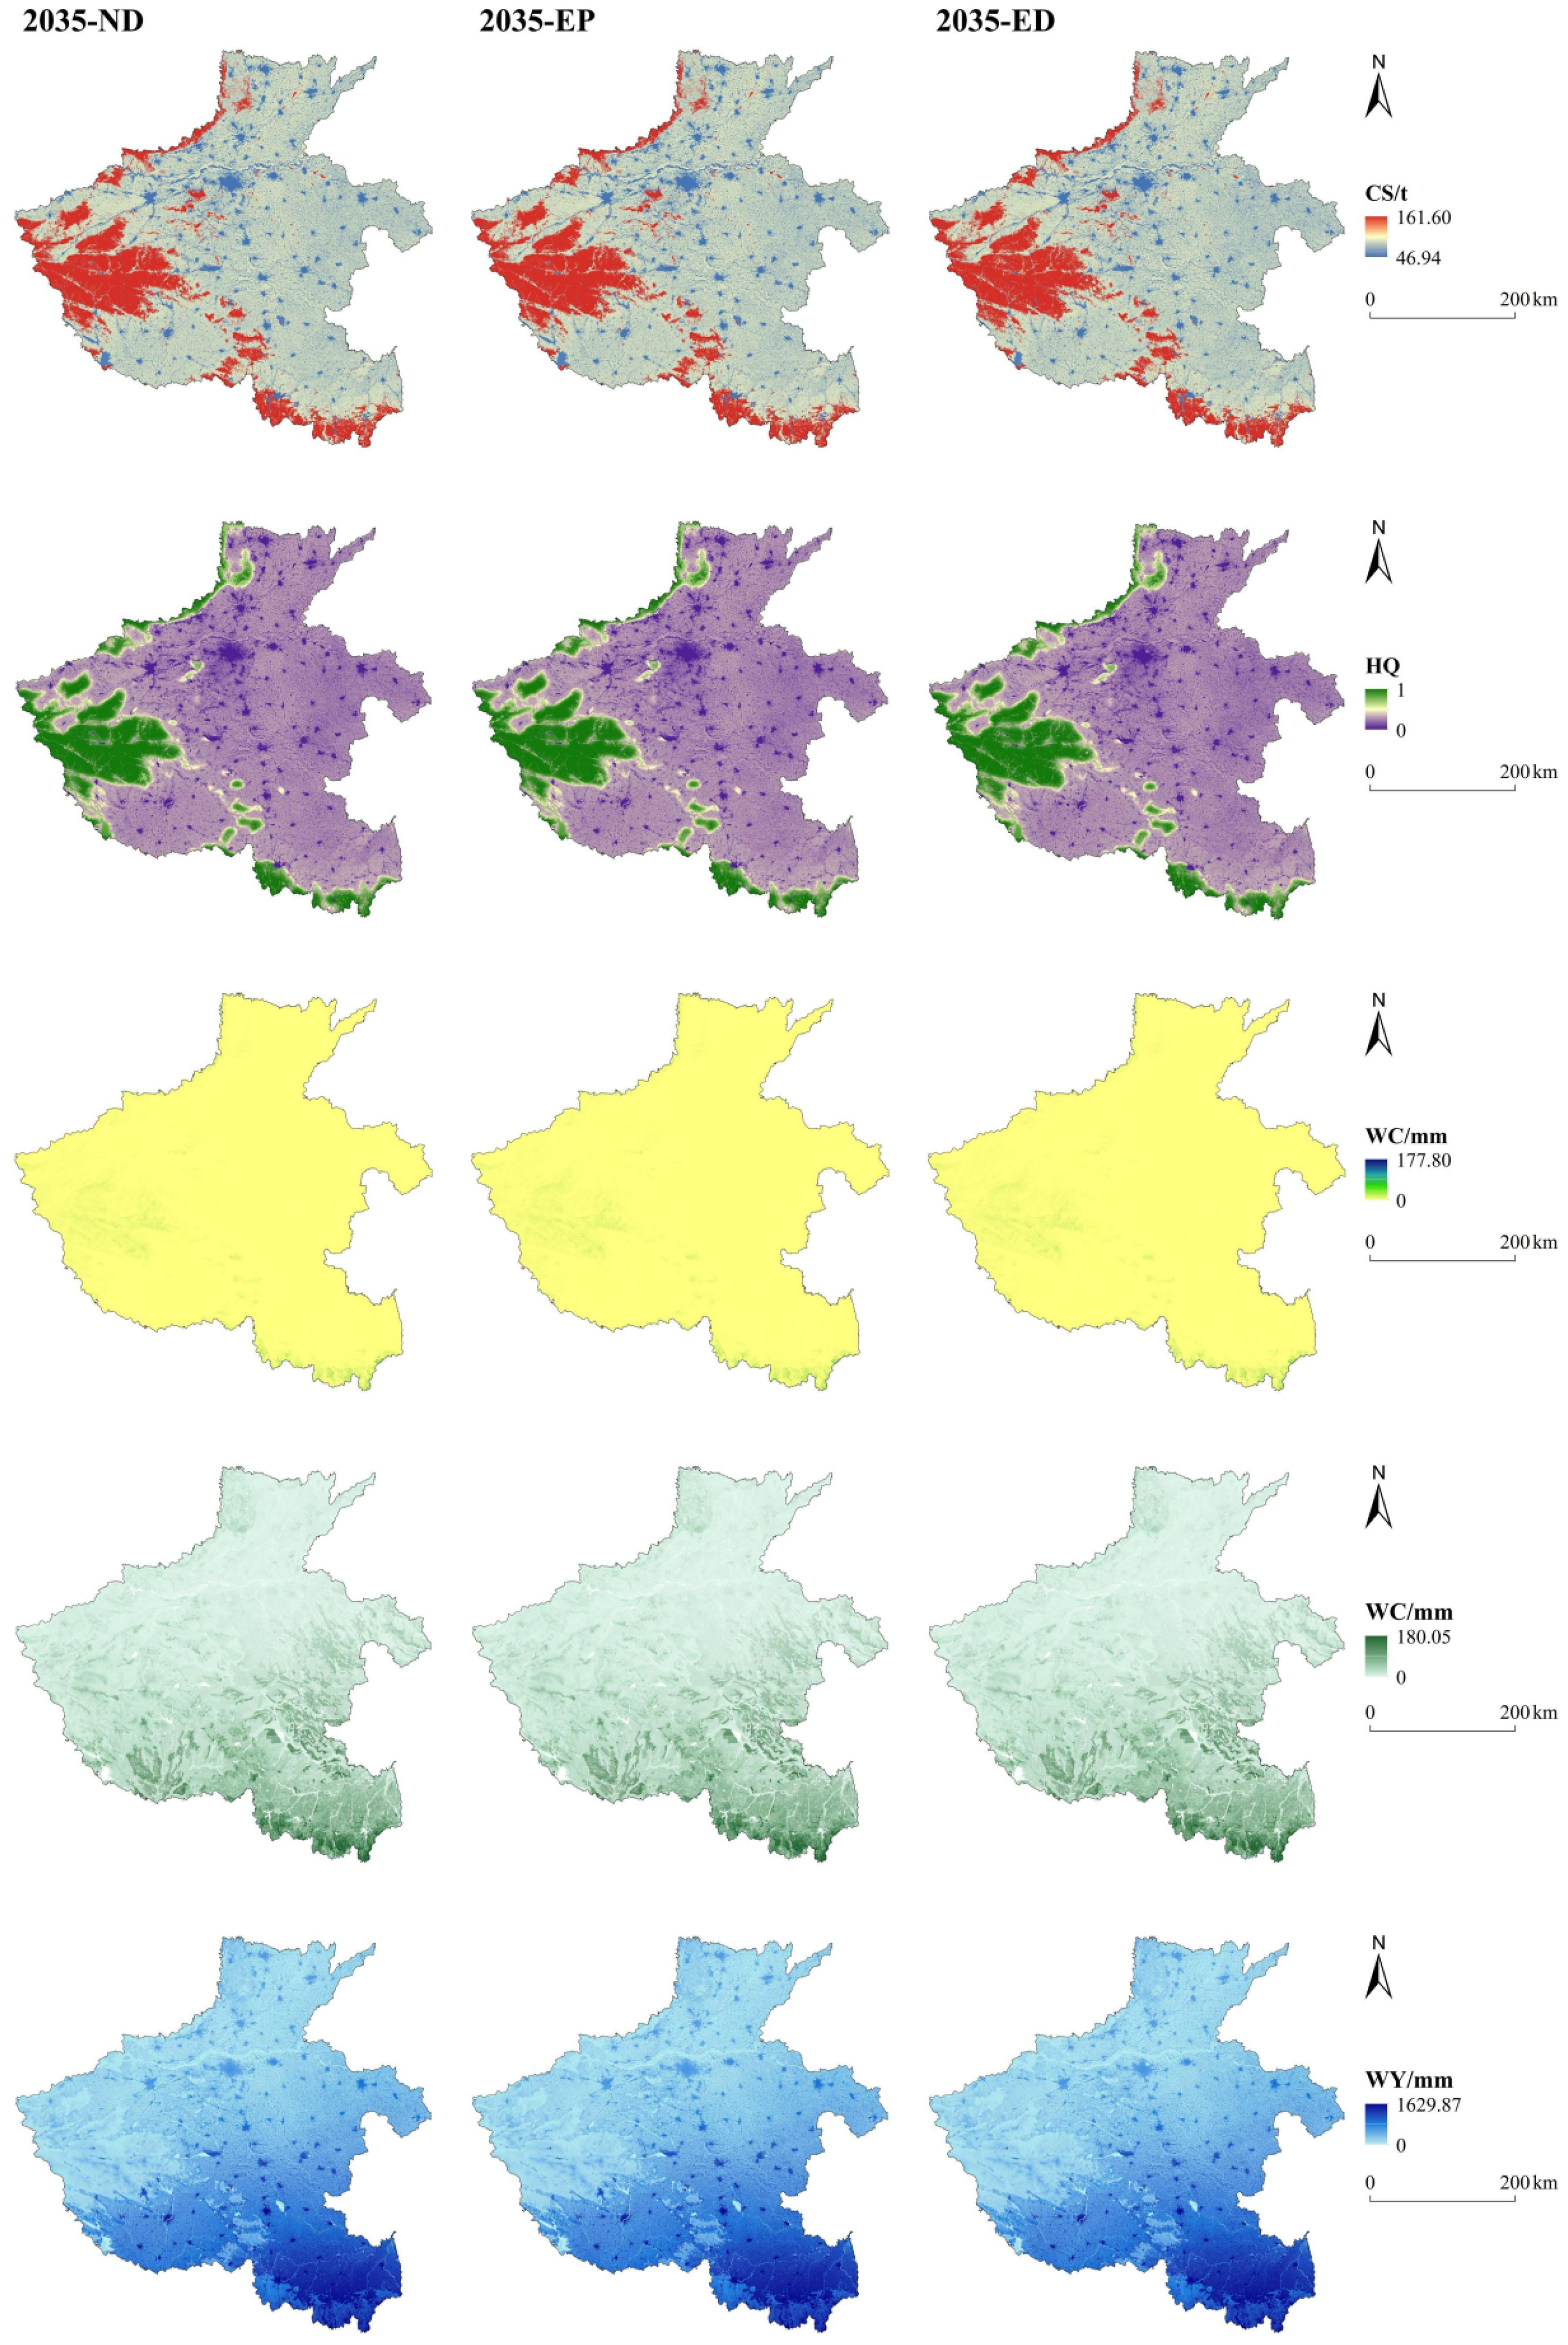
Figure 7. Spatial distribution of ESs under different scenarios in 2035.
Specifically, CS will decrease by 18.89×10⁶t, 16.5×10⁶t, and 22.74×10⁶t under the three scenarios in 2035, respectively (Table 4). This is related to the continuous expansion of construction land in the region, which results in the loss of large areas of high-value CS areas, such as cultivated land and ecological land, to varying degrees. The change characteristics of HQ are the same as those of CS, with degradations of 0.0123, 0.0116, and 0.0136 in the three scenarios in 2035, respectively. Thanks to the slower loss of ecological land such as forest land, habitat quality is minimally degraded in the ecological protection scenario. SC increases by 31.73×10⁶t, 35.09×10⁶t, and 47.29×10⁶t in each scenario, respectively. Its distribution pattern is generally consistent with that from 2000 to 2020, while it expands significantly in the ED scenario. This is mainly because the expansion of construction land leads to an increase in soil erosion, thereby causing an increase in SC. Compared with the EP scenario, there is a relatively large reduction in ecological land in the ND scenario. The SC contributed by high-vegetation-cover land, such as forest land, results in the SC in the ND scenario being lower than that in the EP and ED scenarios. WY increases by 18.44×108mm, 17.57×108mm, and 20.51×108mm in each scenario in 2035. The EP scenario shows the least increase, which may be related to the increase in forest land in the region, resulting in increased transpiration. In contrast, in the ED scenario, due to the expansion of construction land, the substratum has a higher capacity for runoff generation, and WY increases significantly. WC increases by 17.92×106mm, 19.79×106mm, and 17.28×106mm in each scenario in 2035, respectively. The EP scenario benefits from the improvement of vegetation coverage, making the output value of the WC function in this scenario higher than in other scenarios. Therefore, in the future, the protection of ESs in Henan Province should combine the evolution characteristics of each scenario and take corresponding measures for regulation.
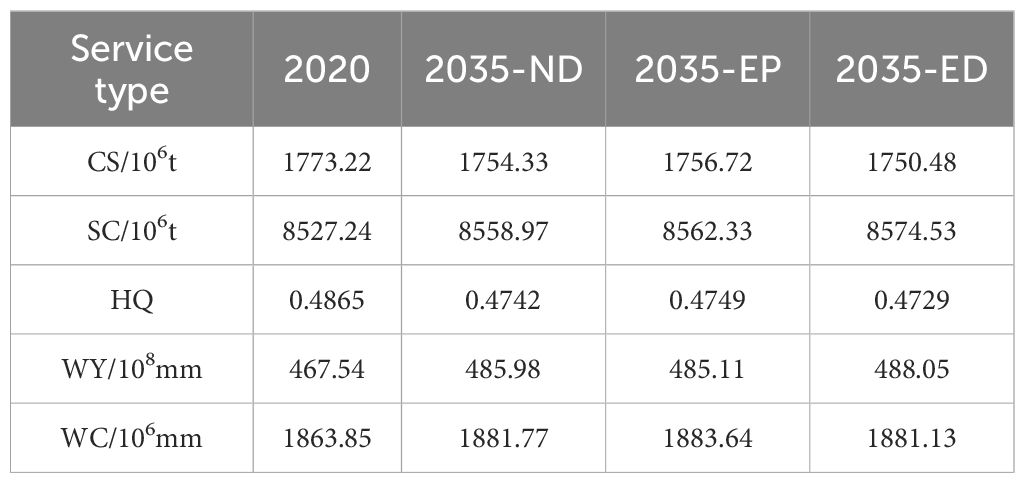
Table 4. Time change of multi-scenario ecosystem service functions in Henan Province in 2035.
Figure 8 illustrates that a total of 10 correlations were observed among these five ESs over the time scale, all of which were statistically significant (p < 0.05). The results showed that the five ESs were mainly in a synergistic relationship during the study period. The effects of each ecosystem service were relatively stable, and the variation range was small. Due to the influence of topography and climate conditions, the significant increase in construction land in the region enhanced the surface runoff effect. The increase in water production promoted the improvement of SC capacity, thus affecting the spatiotemporal distribution of HQ and CS. Specifically, from 2000 to 2020, the R values of WC-WY, CS-HQ, and HQ-SC fluctuated between 0.69 and 0.75, 0.65 and 0.68, and 0.41 and 0.44, respectively. The synergistic relationship showed an upward-fluctuating trend. Secondly, the R values of CS-SC and SC-WC fluctuated between 0.25 and 0.30 and 0.19 and 0.26, respectively, and the synergistic relationship also showed an upward-fluctuating trend. CS-WY and HQ-WY were dominated by a trade-off relationship. The R values fluctuated between -0.37 and -0.49 and -0.15 and -0.32, respectively. The fluctuations of the two decreased during the study period, tending towards a synergistic relationship. At the same time, CS-WC and HQ-WC still showed a shift from a trade-off to a synergistic relationship during the study period, but the R value was small, indicating a mild synergistic relationship. Therefore, the relationship between the five ESs in Henan Province is mainly synergistic, and the trade-off relationships during the study period tended to transform into synergistic effects.

Figure 8. Correlation between ESs in different scenarios. "*" generally indicates that, under a certain level of statistical significance (usually p < 0.05), the correlation between two variables is significant. While "***" usually represents a higher level of statistical significance, such as p < 0.001, indicating that the correlation between the two variables is extremely significant.
The evolutionary characteristics of the three scenarios in 2035 are the same as those from 2000 to 2020, and they are still dominated by synergistic relationships. Specifically, CS-WY and HQ-WY both show a trade-off relationship. The R values in each scenario are -0.41, -0.39, and -0.41 and -0.22, -0.20, and -0.22, respectively, indicating that under different future development scenarios, the spatiotemporal differentiation of WY has a significant trade-off association with CS and HQ. WC-WY is relatively stable in the three scenarios, and the R value is 0.75 in all scenarios, showing a significant synergistic relationship. The degree of the synergistic relationship of HQ-WC is in the order of EP scenario > ND scenario > ED scenario, indicating that under the EP scenario, the effective protection and improvement of vegetation coverage enhance the WC function of the study area. The degree of the synergistic relationship of CS-HQ is in the order of ED scenario > ND scenario > EP scenario, indicating that in the ED scenario, the synergistic effect is dispersed and fragmented in space, making the distribution range of CS-HQ more concentrated. The size of the synergistic relationship of HQ-SC is in the order of ND scenario > EP scenario > ED scenario. It can be concluded that in the ND scenario, development and protection maintain the high-value areas of HQ and SC and increase soil utilization efficiency. In general, in 2035, the synergistic relationships of various functions under different scenarios have been improved to a certain extent, and the ecological development potential has been consolidated.
We used SOM to identify four ESBs with the purpose of analyzing the spatial correlation characteristics between ESs in different regions of Henan Province (Figure 9). In terms of temporal change, the B1 ecological conservation transition bundle accounted for 34.62%, 29.30%, 25.01%, 22.93%, and 23.93% from 2000 to 2020, respectively, showing a fluctuating downward trend. This service bundle is mainly dominated by WY and SC. The B2 water conservation service bundle accounted for 6.89%, 17.80%, 2.25%, 1.87%, and 2.40% from 2000 to 2020, also showing a fluctuating downward trend. This service bundle is mainly dominated by WY and WC. The B3 forest land protection core bundle accounted for 15.67%, 15.30%, 13.98%, 14.33%, and 13.75% from 2000 to 2020, showing an overall downward trend. This service bundle is mainly dominated by CS and HQ. For the B4 human settlements urban development bundle, from 2000 to 2020, the proportions were 42.82%, 37.60%, 58.76%, 60.87%, and 59.91%, respectively, showing a fluctuating upward trend, and this service bundle provided weaker ESs.

Figure 9. Spatial distributions in Henan Province in different scenarios.
In terms of spatial distribution, B4 was the dominant type in Henan Province from 2000 to 2020, mainly distributed in the central and northern parts of Henan Province, with a wide distribution range. These areas were mainly covered by cultivated land and construction land with intense human activity and showed a trend of expansion towards the southwest during the study period. Secondly, B3 was mainly located in the southwest and a small part in the northwest of the study area. This area was mainly composed of woodland and grassland, and the ESs were mainly high-level CS and high-level HQ, showing a trend of continuous degradation during the study period. B1 and B2 were mainly located in the southeast of the study area. These areas mostly had high WC and high WY, which were restricted by climatic and geographical factors. They showed characteristics of decreasing fluctuation during the study period. Moreover, their distribution was the widest from 2000 to 2005, and then they mainly shrank to some areas in Xinyang City in the southeast of the study area. The evolution of ESBs in 2035 remained basically stable, and the differences in the spatial distribution of various scenarios were basically the same as those from 2000 to 2020. In short, the spatial distribution of ESBs in Henan Province was closely related to land types during the study period, with the core ESBs and transitional ESBs being the main ones.
We constructed a driving factor index system with the help of a geographic detector to analyze the contribution of each driving factor to the spatial characteristics of ESs in the region. From the single-factor detection results (Figure 10), among the natural factors, topographic factors such as elevation and slope explain the spatial differentiation of CS, HQ, and SC in the region to the highest degree, while climatic factors such as temperature and precipitation explain the spatial differentiation of WY and WC in the region to the highest degree. In the human dimension, population density and distance from railways play an important role in restricting the formation of CS, HQ, and SC in Henan Province. Secondly, for the functions of WY and WC, it can be concluded that human factors contribute less to the formation of spatiotemporal differentiation in the region.
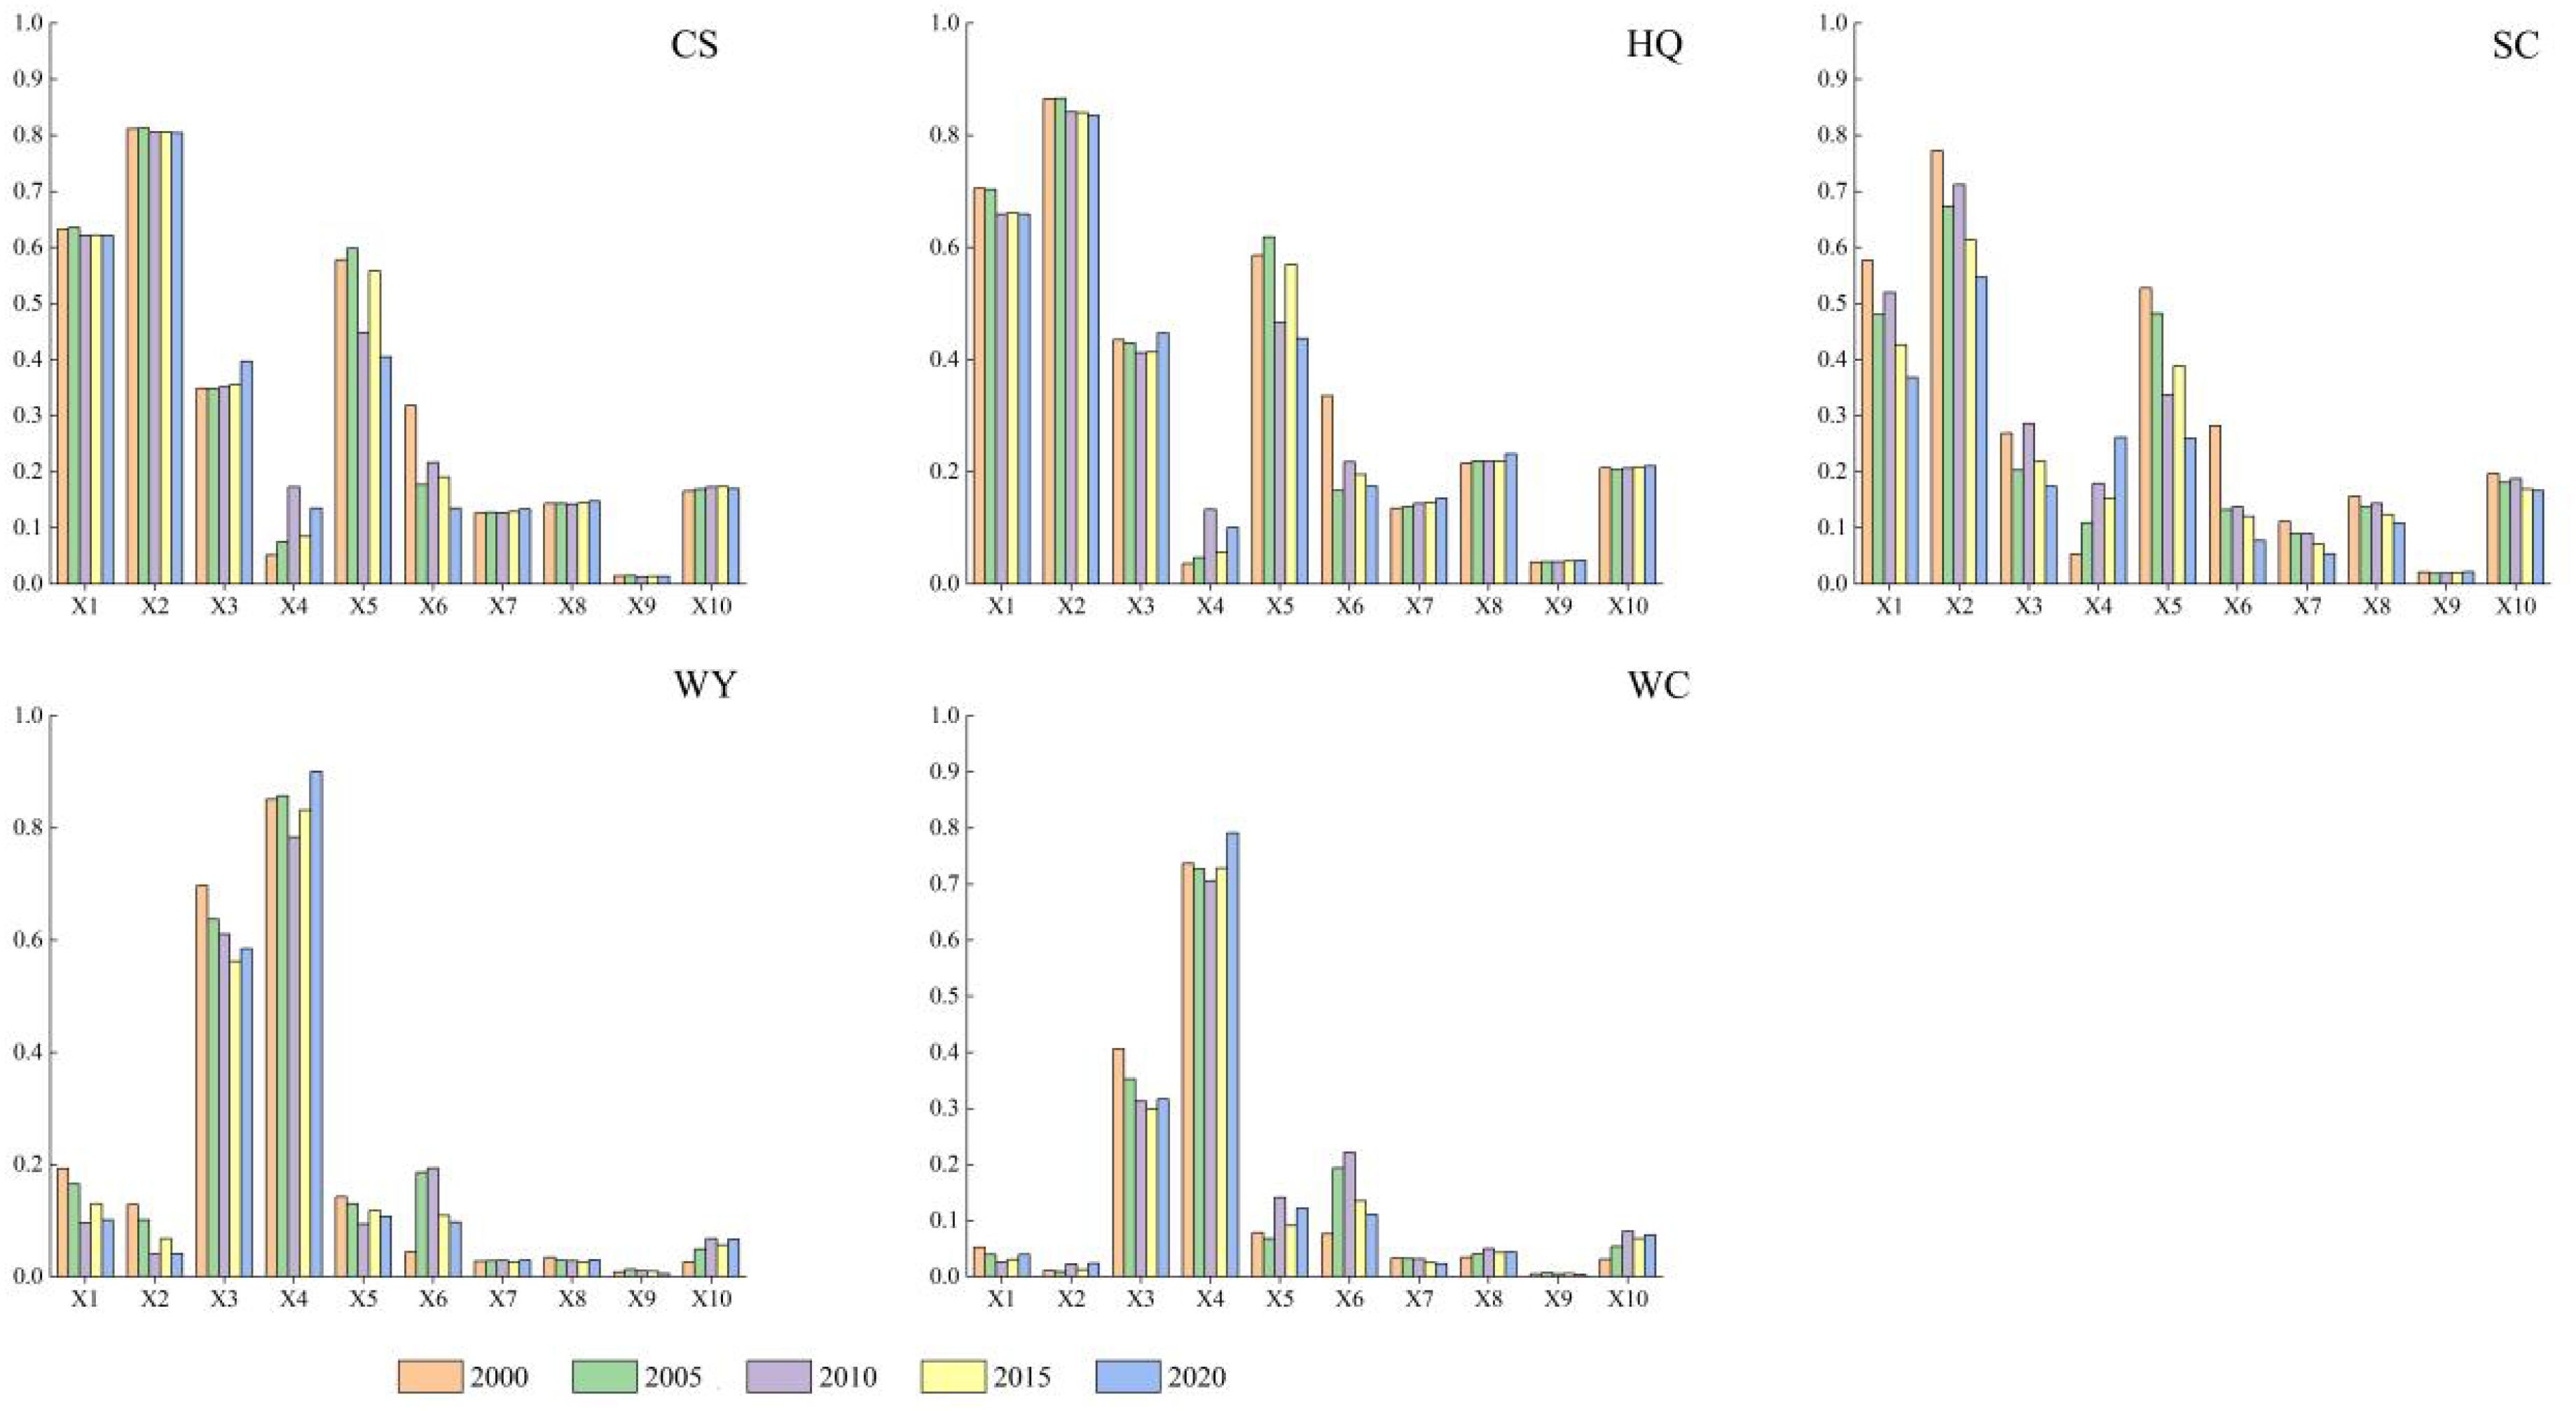
Figure 10. Single-factor detection results of ecosystem service functions in Henan Province from 2000 to 2020.
From the two-factor detection results (Figure 11), the interaction between any two factors in the region has a greater impact on the spatiotemporal differentiation of its ESs than a single factor, and the detection results are mainly non-linear enhancement and two-factor enhancement. The largest contribution value for each function is from the interaction of X2 (slope) ∩ X4 (precipitation), and its contribution value is above 0.8928, indicating that the interaction between topographic factors and climatic conditions in the natural dimension plays a leading role in the formation of CS, HQ, and SC in the region. At the same time, the study also found that the explanatory power produced by the interaction and combination of other factors with X5 exceeds its own contribution ability, which is significantly manifested in the spatiotemporal differentiation characteristics of CS, HQ, and SC. In the detection of WY and WC, the combination of driving factors represented by X3 and X4 with other factors has a greater impact than the individual factors themselves, which indicates that the spatial differentiation characteristics of each function in the region are the result of the combined effect of natural factors and socioeconomic factors.
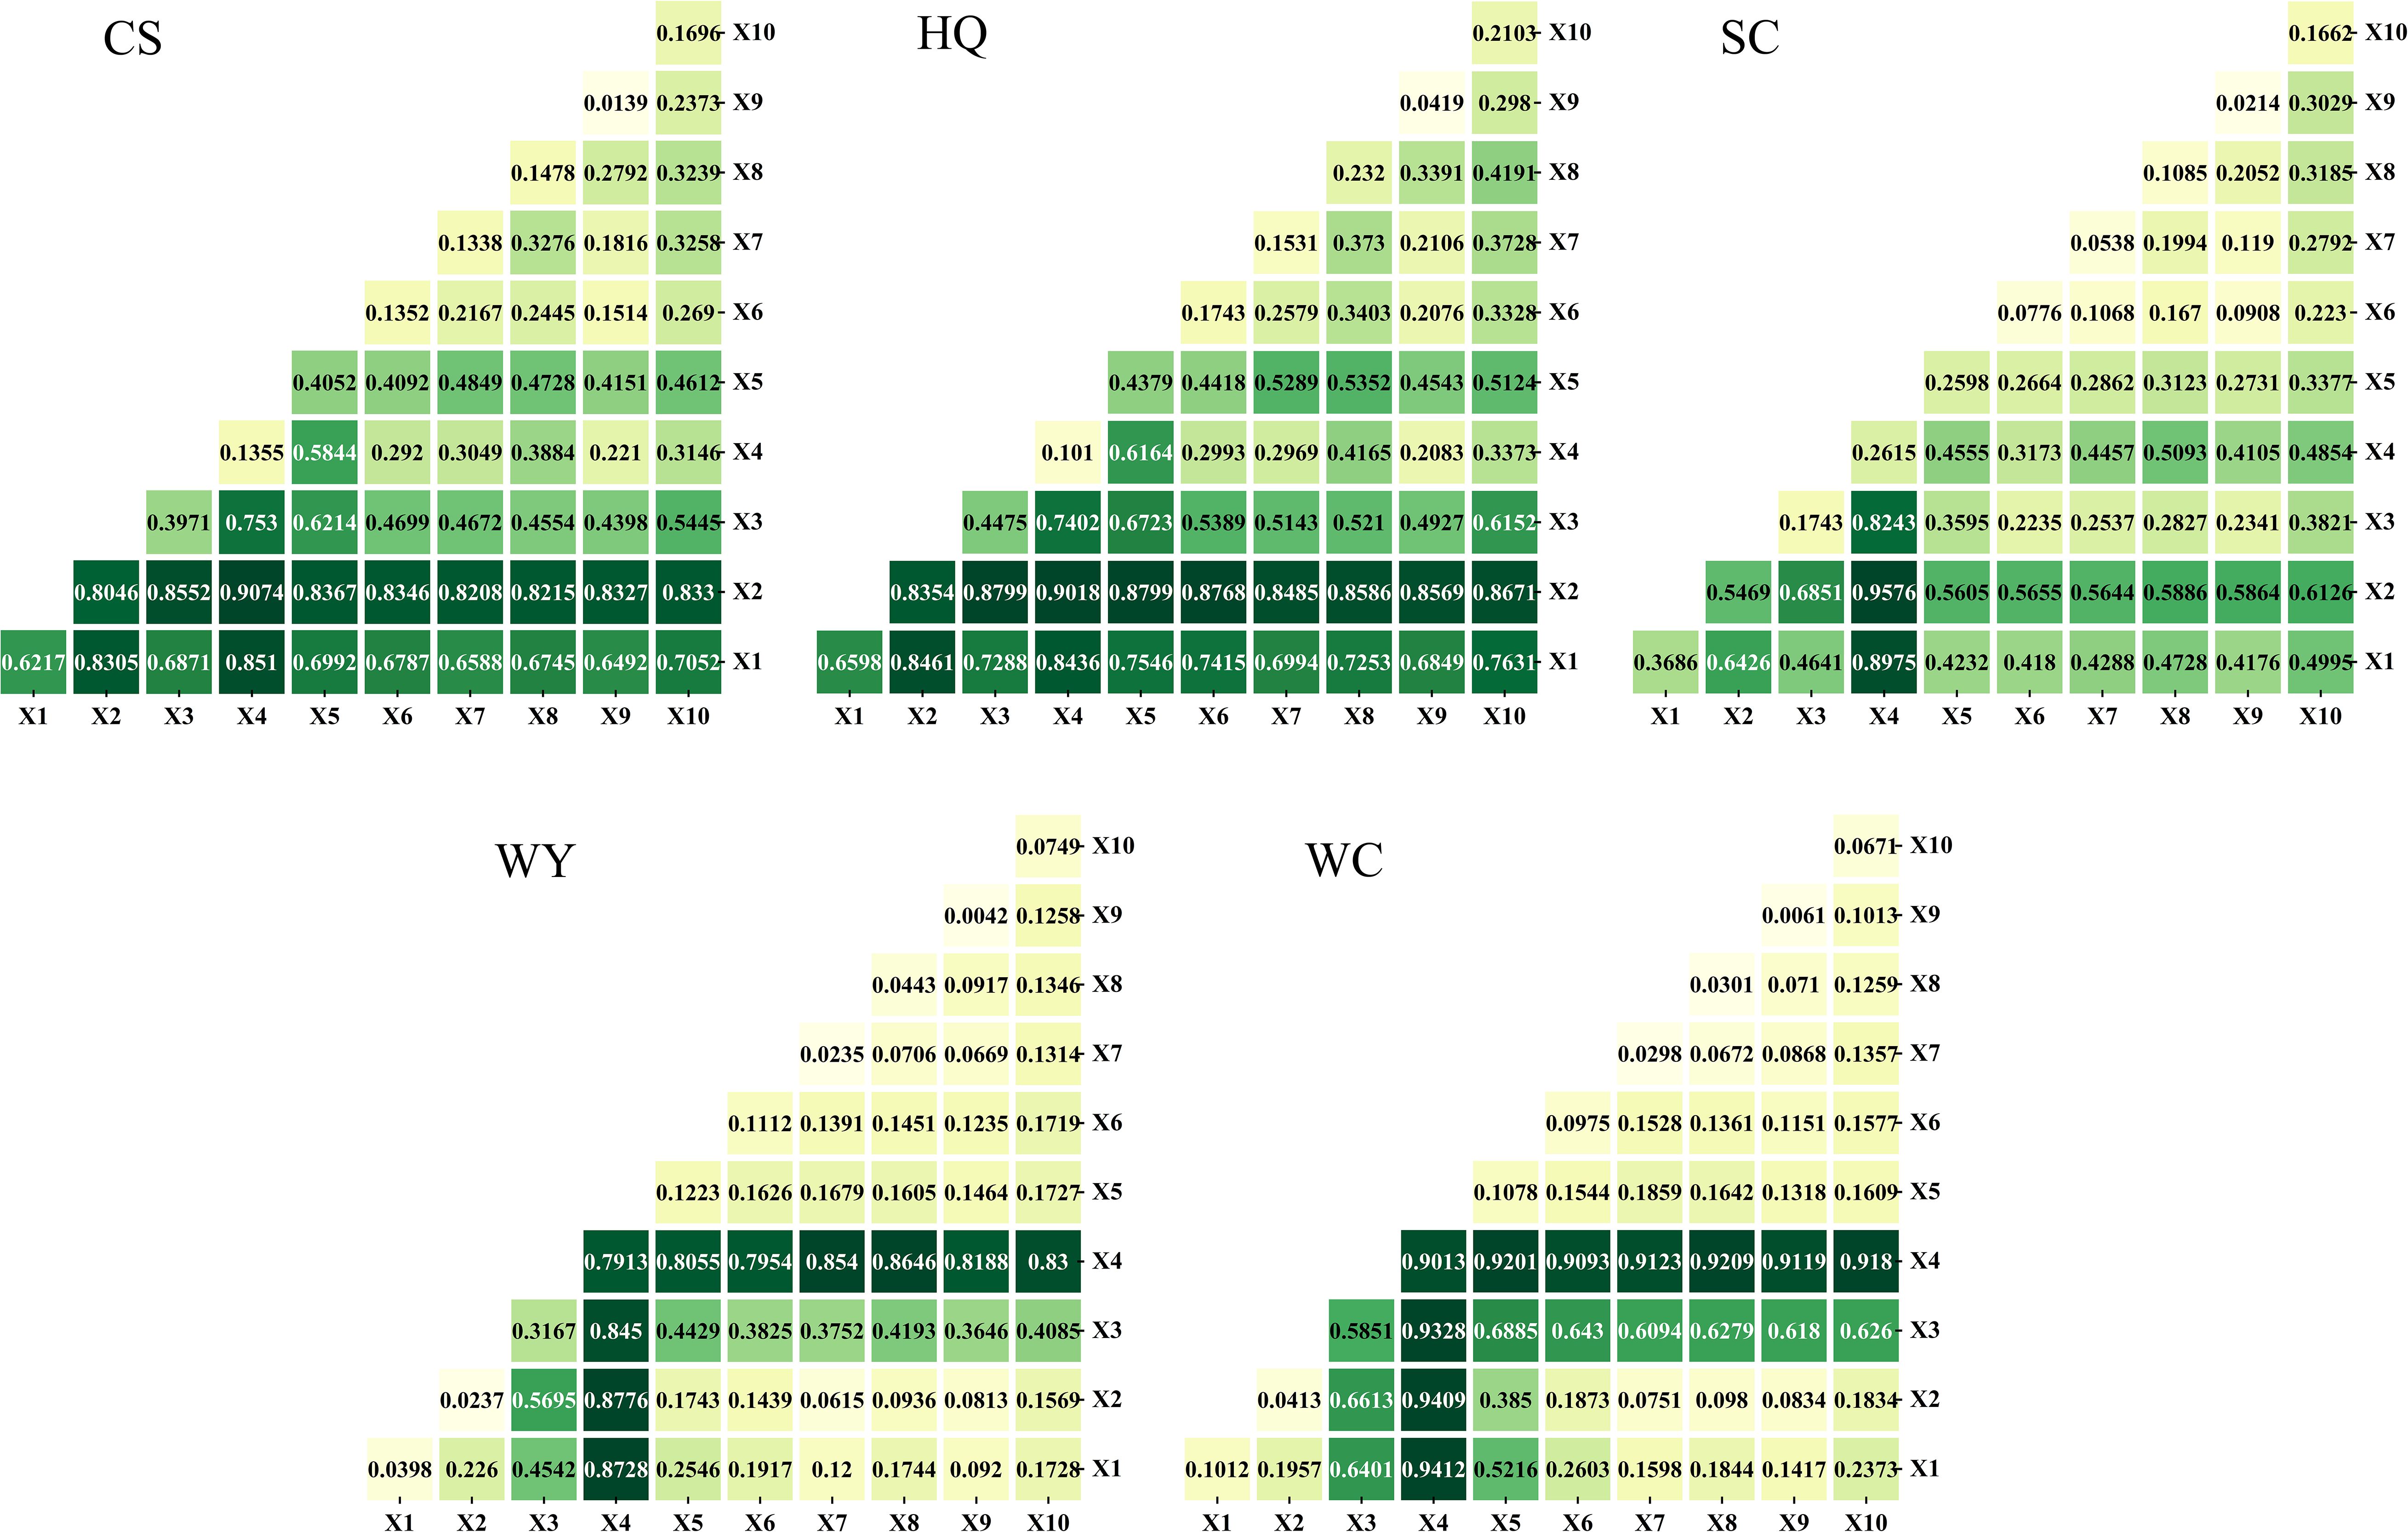
Figure 11. Dual-factor detection results of ecosystem service functions in Henan Province in 2020.
Generally speaking, the spatiotemporal differentiation and evolution of ESs are affected by both natural and socioeconomic development factors. Among them, urban expansion is the main driving factor in the socioeconomic sphere, but natural factors have a more decisive influence.
There was significant spatiotemporal heterogeneity in various ESs in Henan Province during the study period, which was closely related to the changes in land-use types within the region. Huang and Wu, 2023 and Xiong et al. (2023) quantified the ESs in the Yangtze River Delta urban agglomeration and the Loess Plateau in China and found that relatively flat terrain and extensive human intervention pose a threat to HQ, SC, and CS, which is consistent with the results of this study. In Henan Province, forests and grasslands are mainly located in the western and southern regions, while cultivated land is mainly concentrated around construction land in the central and northeastern regions. Construction land is mainly distributed sporadically in patches in urban areas such as the central and eastern parts. This distribution characteristic results in higher levels of CS, SC, and HQ in the western and southern parts of the study area and lower levels in the central and northeastern parts. Yang Y. et al. (2024) and Qiao et al. (2024) evaluated the ESs in the Shaanxi Province and Huang-Huai-Hai Plain region of China and found that an increase in precipitation contributes to vegetation growth and the enhancement of SC capacity. However, excessive precipitation and frequent human activity will inevitably exacerbate soil erosion, which is consistent with the conclusion of this study. WY and WC generally show higher values in the southeast and lower values in the northwest, which is related to the distribution of precipitation, vegetation coverage, and elevation within the study area. It is worth noting that the scale of urban areas in Henan Province continued to expand from 2000 to 2020, leading to a continuous decline in CS and HQ during the study period. This is consistent with the research results of scholars such as Dai et al. (2024) and Shen et al. (2024). Thanks to the implementation of forestry ecological and other engineering projects, the continuous decline of SC, WY, and WC was mitigated, and there was a slight increase from 2010 to 2020. In conclusion, land-use change in Henan has a significant impact on the distribution of various ESs. Therefore, it is necessary to rationally balance the development and protection of land resources in the region.
The spatiotemporal differentiation of ESs results from the combined effects of various natural and social factors. Specifically, in Henan Province, CS, HQ, and SC display a spatial distribution pattern where values are higher in the western and southern regions and lower in the central and northeastern regions. These areas are mostly mountainous and hilly with significant topographic variations. As a result, the predominant land types are forest and grassland. Additionally, there is ample precipitation and a dense river network, which offer favorable natural conditions for vegetation growth. In contrast, the central and northeastern regions are flat, with a high intensity of human activities that pose a greater threat to ESs. WC and WY generally feature higher values in the southeastern part and lower values in the northwestern part, which is associated with the terrain and climate factors of Henan Province. The southeastern part of Henan Province mainly has a subtropical climate, characterized by abundant annual precipitation, high vegetation coverage, and relatively low evaporation. In contrast, the northwestern region is inland, with a warm-temperate continental climate, less annual rainfall, low surface vegetation coverage, and intense evapotranspiration. Consequently, the WC and WY capacities there are lower than those in the southeastern region. It is worth noting that the two-factor detection indicates that the interactive contribution of natural and social factors is greater than the individual contribution of either natural or social factors. This implies that in the future, when coordinating the governance of the ecological environment in Henan Province, it is necessary to consider both natural and social perspectives and comprehensively analyze the ESs of different regions.
Our study explores the trade-offs/synergies of various ESs in Henan Province from a dynamic perspective. We used the PLUS model to reveal the spatiotemporal evolution and trade-offs/synergies of ESs under multiple scenarios in 2035, which is a novel research idea. By comparing the current research results on the spatiotemporal evolution of ESs in Henan Province, we conclude that there is a trade-off relationship between CS and WY in the study area. This is consistent with the research results of Wang et al. (2022) in the Huaihe River Basin. In the southeastern part of Henan Province, the population is concentrated, and the land types are mostly cultivated land and construction land. The carbon sequestration capacity is poor, and at the same time, the surface runoff capacity is strong, resulting in low soil water storage in this area. Thus, CS-WY shows a trade-off effect. SC-CS and WY-SC show a synergistic relationship, which is consistent with the research conclusion of Niu et al. (2022) in the Yellow River Basin (Henan section). The hilly and mountainous areas in the southwestern part of Henan Province provide good natural conditions and a favorable growth environment for vegetation coverage in this area, making the CS function relatively high. It also enhances the erosion effect of surface runoff, thereby improving the SC function of this area.
Combined with the planning objectives of the “14th Five-Year Plan for Land and Space Ecological Restoration and Forest Construction in Henan Province”, the ESBs in Henan Province are divided into four categories based on the SOM algorithm, and the following suggestions are put forward. (1) For the ecological conservation transition bundle, water resources should be coordinated. River and lake ecological buffer zones should be delineated, and the construction of plain river and canal protective forests, farmland forest networks, etc., should be carried out. Agricultural ecological conservation areas should be delineated to improve the quality and stability of the water ecosystem in the Huaihe River Basin. The retreat and return of beaches, water expansion and humidification, and ecological replenishment should be carried out to maintain the integrity and stability of the wetland system. (2) Regarding the water conservation service bundle, the transformation of water conservation forests and soil and water conservation forests should be enhanced, and their restoration efforts should be increased. River and canal ecosystems and conservation belts should be built. Relying on small and medium-sized river systems, the ecological network should be further intertwined. Protection and conservation should be strengthened to give full play to the ecological node role of various types of natural protected areas and other important ecological patches, forming an ecological network intertwined vertically and horizontally with ecological barriers and ecological corridors. (3) For forest land protection core bundles, the construction of ecological security barriers, such as forest parks, geoparks, wetland parks, and other natural ecosystems with important protection value, should be promoted. A biodiversity protection network should be constructed, focusing on biodiversity-rich areas such as Funiu Mountain, Taihang Mountain, and Dabie Mountain, relying on three ecological barriers, and then building ecological corridors. Destructive construction activities should be strictly limited, human disturbance should be reduced, and the fragmentation of regional forests, grasslands, and other natural surfaces should be decreased. The service capabilities, such as soil conservation, should be further improved, and the synergistic relationship between HQ, CS, and other ESs should be continuously maintained and improved. (4) For the development cluster of human settlements and towns, the structure and layout of urban land use should be optimized. The layout of ecological space inside and outside the urban development boundary should be coordinated. By combining with the regional ecological network, urban natural mountains, rivers, lakes, and ditches should be protected and utilized to improve the urban blue-green open space system. The control range of structural green spaces such as urban greenways and municipal parks, as well as important water bodies, should be determined. The green and blue lines in urban areas should be defined, and the construction of forest cities should be continuously promoted.
Our research, from the perspective of land-use change, delved into the evolution characteristics, trade-offs, and synergy relationships of five types of ESs in Henan Province from 2000 to 2020 and classified ESs bundles accordingly. The study found that over the 20-year period, CS and HQ declined, while SC, WC, and WY first decreased and then increased. Meanwhile, correlation analysis indicated that the ESs represented by WC-WY, CS-HQ, and HQ-SC mainly exhibited a significant synergistic relationship. Through the classification of ESs bundles, it was further found that B4 dominated in Henan Province, and it showed a characteristic of expanding southwestward, posing a threat to B1 and B2. In addition, to explore other driving factors influencing the level of ESs, we utilized geographical detector and found that multi-dimensional factors, including natural and social factors, had a substantial impact on each ES. This can provide insights for optimizing Henan Province’s ecological protection barrier and coordinating various ESs.
Although our research can effectively analyze the trade-offs and synergy relationships of various ESs in Henan Province from 2000 to 2020, as well as other potential driving factors, due to limitations in technical methods and data, this study has certain limitations. For instance, the research period was mainly from 2000 to 2020. Determining the research period solely from a static perspective might make it difficult to reflect the characteristics of the interaction relationships among various ESs over consecutive periods. Moreover, exploring only five ESs cannot fully represent the complexity and diversity of the regional ecosystem. The model parameters were mainly derived from similar research areas. Due to differences in data sources and regional variations, there are certain biases and uncertainties in the result estimation. Furthermore, some parameters in the land-use model were set based on experience (such as the setting of the transfer cost matrix). Due to limited data availability, in this study, water areas were mainly designated as restricted development zones, which might lead to incomplete prediction results. Given the difficulty in obtaining data on nature reserves, using only water bodies as restricted development areas for land-use prediction is also insufficient. The classification of service bundles was mainly based on the results obtained from the SOM algorithm, and the zoning regulation according to characteristics has a certain degree of subjectivity. Therefore, in subsequent research, it is necessary to consider the changing scenarios of the trade-offs and synergy relationships of ESs under different scales and long-time-series backgrounds, and explore the integration of socioeconomic factors and climate change for predicting future ESs, so as to further improve the exploration of the evolution of ESs.
In the current study, we analyzed the trade-offs, synergies, and the driving factors of the temporal evolution of ESs in Henan Province from 2000 to 2020 and projected to 2035. Based on the relevant results, we divided the ESs into bundles. The main findings of this research can be summarized as follows:
1. During 1990–2020, the dominant land-use landscape types in Henan Province were cultivated land and forest land, and the cultivated land area continuously decreased. By 2020, the loss of cultivated land area reached 4841.50 km², while the newly added area of construction land was 4615.76 km². The change ranges of other land types were relatively small. The spatiotemporal evolution pattern of land under multiple scenarios in 2035 was basically the same as that from 2000 to 2020. Construction land increased in all scenarios, reaching 25492.28 km², 25,368.99 km², and 25,782.01 km², respectively. Under the EP scenario, the loss of cultivated land area was the largest, with a reduction of 3,029.04 km². Forest land and grassland were effectively protected, increasing by 524.74 km² and 148.53 km², respectively.
2. From 2000 to 2020, ES, CS, and HQ showed a continuous degradation trend, while SC, WY, and WC showed a fluctuating trend of first decreasing and then increasing. Specifically, they showed a degradation trend from 2000 to 2010 and an increasing trend from 2010 to 2020. Spatially, CS, SC, and HQ generally exhibited the distribution characteristics of being high in the hilly mountains of the west and south and low in the plains of the central and northeastern regions. WY and WC generally showed the distribution characteristics of being high in the southeast and low in the northwest.
3. The synergistic relationship among various functions in Henan Province is predominant, and the effects of various ESs are relatively stable, with small ranges. The ESs represented by WC-WY, CS-HQ, and HQ-SC are mainly characterized by significant synergy. CS-SC and SC-WC show moderate synergy. During the study period, CS-WC and HQ-WC are characterized by a transition from a trade-off to a synergistic relationship, but the R value is small, indicating a mild synergistic relationship. At the same time, CS-WY and HQ-WY are dominated by a trade-off relationship.
4. Using the SOM algorithm, we divided the ESs into four types of bundles. In terms of spatial distribution, B4 dominates in Henan Province, and it showed a southwestward expansion characteristic during the study period. Secondly, B3 is mainly located in the southwest and a small part of the northwest of the study area, and it shows a trend of continuous degradation during the study period. B1 and B2 are mainly located in the southeast of the study area. Most of these areas have high WC and high WY, and they showed a decreasing fluctuation characteristic during the study period. Their distribution was the broadest from 2000 to 2005, and then they mainly shrank to parts of Xinyang City in the southeast of the study area.
5. Elevation and slope are important factors in the spatiotemporal differentiation of CS, HQ, and SC in the study area, while temperature and precipitation play a leading role in the formation of WY and WC. Among the five ESs, the combination of X2 (slope) and X4 (precipitation) has the largest contribution value. At the same time, the study also found that the interaction between X5 and other factors produced an explanatory power beyond its own contribution ability. In the detection of WY and WC, the combination of driving factors represented by X3 and X4 has a greater impact than the individual factors themselves.
The original contributions presented in the study are included in the article/supplementary material. Further inquiries can be directed to the corresponding author.
YS: Conceptualization, Methodology, Writing – original draft, Writing – review & editing. MQ: Project administration, Writing – original draft, Writing – review & editing. WW: Formal analysis, Writing – original draft, Writing – review & editing. JC: Supervision, Validation, Writing – original draft, Writing – review & editing. FT: Supervision, Conceptualization, Investigation, Writing – original draft, Writing – review & editing.
The author(s) declare that financial support was received for the research and/or publication of this article. This work was supported by the National Natural Science Foundation of China (No. 71203054), Anhui Province Housing and Urban-Rur`al Construction Science and Technology Planning Project (No. 2023-RK035), and the Hebei Academy of Sciences Science and Technology Plan Project “Research on the control of non-grain cultivation of cultivated land from a multi-functional perspective”. (No. 23A14).
The authors declare that the research was conducted in the absence of any commercial or financial relationships that could be construed as a potential conflict of interest.
The author(s) declare that no Generative AI was used in the creation of this manuscript.
All claims expressed in this article are solely those of the authors and do not necessarily represent those of their affiliated organizations, or those of the publisher, the editors and the reviewers. Any product that may be evaluated in this article, or claim that may be made by its manufacturer, is not guaranteed or endorsed by the publisher.
Bennett E. M., Peterson G. D., Gordon L. J. (2009). Understanding relationships among multiple ecosystem services. Ecol. Lett. 12, 1394–1404. doi: 10.1111/j.1461-0248.2009.01387.x
Bi S., Li Z., Chen Y., Zhang Q., Ye T. (2024). IIdentification of priority conservation areas in Beijing-Tianjin-Hebei using multi-scenario trade-offs based on different spatial scales and their drivers. Ecol. Indic. 116, 112508. doi: 10.1016/j.ecolind.2024.112508
Broquet M., Campos F. S., Cabral P., David J. (2024). Habitat quality on the edge of anthropogenic pressures: Predicting the impact of land use changes in the Brazilian Upper Paraguay river Basin. J. Clean. Prod. 459, 142546. doi: 10.1016/j.jclepro.2024.142546
Cademus R., Escobedo F., McLaughlin D., Abd-Elrahman A. (2014). Analyzing Trade-Offs, Synergies, and Drivers among Timber Production, Carbon Sequestration, and Water Yield in Pinus elliotii Forests in Southeastern USA. Forests 5, 1409–1431. doi: 10.3390/f5061409
Cao J., Cao W., Cao Y., Wang X., Zhang Y., Ma J. (2024). Multi-scenario land use prediction and layout optimization in Nanjing Metropolitan Area based on the PLUS model. J. Geogr. Sci. 34, 1415–1436. doi: 10.1007/s11442-024-2254-7
Cen Y., Gao Z., Sun G., Lou Y., Zhang S., Li Y., et al. (2023). Effects of soil conservation on the spatial heterogeneity of vegetation carbon sequestration in the Yellow River Basin, China. Land. Degrad. Dev. 34, 4607–4622. doi: 10.1002/ldr.4796
Chen M., Bai Z., Wang Q., Shi Z. (2021). Habitat quality effect and driving mechanism of land use transitions: A case study of henan water source area of the middle route of the south-to-north water transfer project. Land 10, 796. doi: 10.3390/land10080796
Chen W., Chi G., Li J. (2020). Ecosystem services and their driving forces in the middle reaches of the yangtze river urban agglomerations, China. Int. J. Environ. Res. Public Health 17, 3717. doi: 10.3390/ijerph17103717
Chen W., Wang R., Liu X., Lin T., Hao Z., Zhang Y., et al. (2024). The interrelationships and driving factors of ecosystem service functions in the tianshan mountains. Forests 15, 1678. doi: 10.3390/f15091678
Chen Z., Zhu Z., Zhang X., Jiao Y., Cheng Y., Wang S., et al. (2024). Study on spatio-temporal evolution of ecosystem services, spatiotemporal pattern of tradeoff/synergy relationship and its driving factors in Shendong mining area. Front. Environ. Sci. 12. doi: 10.3389/fenvs.2024.1445833
Costanza R., De Groot R., Braat L., Kubiszewski I., Fioramonti L., Sutton P., et al. (2017). Twenty years of ecosystem services: How far have we come and how far do we still need to go? Ecosyst. Serv. 28, 1–16. doi: 10.1016/j.ecoser.2017.09.008
Costanza R., De Groot R., Farber S., Grasso M., Hannon B., Limburg K., et al. (1998). The value of the world’s ecosystem services and natural capital. Ecol. Econ. 25, 3–15. doi: 10.1016/S0921-8009(98)00020-2
Dai Y., Qiao X., Yang Y., Liu L., Chen Y., Zhang J., et al. (2024). Optimizing land use to mitigate ecosystem service trade-offs using multi-scenario simulation in the luo river basin. Land 13, 1243. doi: 10.3390/land13081243
Duan P., Xu Y., Guo X., Luo Z., Zhao X. (2023). Study on multi-scale characteristics and influencing factors of trade-offs and synergies between ecosystem services in jiangxi province. Forests 14, 598. doi: 10.3390/f14030598
Fan L., Cai T., Wen Q., Han J., Wang S., Wang J., et al. (2023). Scenario simulation of land use change and carbon storage response in Henan Province, China: 1990–2050. Ecol. Indic. 154, 110660. doi: 10.1016/j.ecolind.2023.110660
Gao Y., Wang Z., Li C. (2024). Assessing spatio-temporal heterogeneity and drivers of ecosystem services to support zonal management in mountainous cities. Sci. Total. Environ. 954, 176328. doi: 10.1016/j.scitotenv.2024.176328
He L., Xie Z., Wu H., Liu Z., Zheng B., Wan W. (2024). Exploring the interrelations and driving factors among typical ecosystem services in the Yangtze river economic Belt, China. J. Environ. Manage. 351, 119794. doi: 10.1016/j.jenvman.2023.119794
He X., Li W., Xu X., Zhao X. (2023). Spatial-temporal evolution, trade-offs and synergies of ecosystem services in the qinba mountains. Sustainability 15, 10352. doi: 10.3390/su151310352
Hicks C. C., Cinner J. E., Stoeckl N., McClanahan T. R. (2015). Linking ecosystem services and human-values theory: Ecosystem Services and Human Values. Conserv. Biol. 29, 1471–1480. doi: 10.1111/cobi.12550
Hu Y., Xu E., Dong N., Tian G., Kim G., Song P., et al. (2022). Driving mechanism of habitat quality at different grid-scales in a metropolitan city. Forests 13, 248. doi: 10.3390/f13020248
Hua H., Zhang X., Zhou Y., Sun J., Chen X. (2024). Multi-scenario prediction and attribution analysis of carbon storage of ecological system in the Huaihe River Basin, China. Environ. Monit. Assess. 196, 814. doi: 10.1007/s10661-024-12957-9
Huang X., Liu J., Peng S., Huang B. (2023). The impact of multi-scenario land use change on the water conservation in central Yunnan urban agglomeration, China. Ecol. Indic. 147, 109922. doi: 10.1016/j.ecolind.2023.109922
Huang Y., Wu J. (2023). Spatial and temporal driving mechanisms of ecosystem service trade-off/synergy in national key urban agglomerations: A case study of the Yangtze River Delta urban agglomeration in China. Ecol. Indic. 154, 110800. doi: 10.1016/j.ecolind.2023.110800
Jia Y., Tang X., Liu W. (2020). Spatial–temporal evolution and correlation analysis of ecosystem service value and landscape ecological risk in wuhu city. Sustainability 12, 2803. doi: 10.3390/su12072803
Jiang W., Wu T., Fu B. (2021). The value of ecosystem services in China: A systematic review for twenty years. Ecosyst. Serv. 52, 101365. doi: 10.1016/j.ecoser.2021.101365
Kirby M. G., Zawadzka J., Scott A. J. (2024). Ecosystem service multifunctionality and trade-offs in English Green Belt peri-urban planning. Ecosyst. Serv. 67, 101620. doi: 10.1016/j.ecoser.2024.101620
Li Y., Geng H. (2023). Spatiotemporal trends in ecosystem carbon stock evolution and quantitative attribution in a karst watershed in southwest China. Ecol. Indic. 153, 110429. doi: 10.1016/j.ecolind.2023.110429
Li W., Kang J., Wang Y. (2024c). Integrating ecosystem services supply-demand balance into landscape ecological risk and its driving forces assessment in Southwest China. J. Clean. Prod. 475, 143671. doi: 10.1016/j.jclepro.2024.143671
Li Y., Kong M., Zang C., Deng J. (2023b). Spatial and temporal evolution and driving mechanisms of water conservation amount of major ecosystems in typical watersheds in subtropical China. Forests 14, 93. doi: 10.3390/f14010093
Li J., Tian Y., Wang D., Zhang Q., Tao J., Zhang Y., et al. (2024a). Matching and driving mechanism analysis of the supply and demand relationships of soil conservation services in karst peak-cluster depression basin in Southwest Guangxi, China. CATENA 246, 108438. doi: 10.1016/j.catena.2024.108438
Li J., Xie B., Dong H., Zhou K., Zhang X. (2023a). The impact of urbanization on ecosystem services: Both time and space are important to identify driving forces. J. Environ. Manage. 347, 119161. doi: 10.1016/j.jenvman.2023.119161
Li M., Zhang J., Gao H., Ji G., Li G., Li L., et al. (2024b). Spatiotemporal variation characteristics of ecosystem carbon storage in henan province and future multi-scenario simulation prediction. Land 13, 185. doi: 10.3390/land13020185
Liang X., Guan Q., Clarke K. C., Liu S., Wang B., Yao Y. (2021). Understanding the drivers of sustainable land expansion using a patch-generating land use simulation (PLUS) model: A case study in Wuhan, China. Comput. Environ. Urban. Syst. 85, 101569. doi: 10.1016/j.compenvurbsys.2020.101569
Liu X., Li Y., Lu J., Song T., Zhang Z. (2024). Urban growth simulation guided by ecosystem service trade-offs in Wuhan metropolitan area: Methods and implications for spatial planning. Ecol. Indic. 167, 1126877. doi: 10.1016/j.ecolind.2024.112687
Loiselle A., Proulx R., Larocque M., Pellerin S. (2023). Synergies and trade-offs among ecosystems functions and services for three types of lake-edge wetlands. Ecol. Indic. 154, 110547. doi: 10.1016/j.ecolind.2023.110547
Lyu F., Tang J., Olhnuud A., Hao F., Gong C. (2024). The impact of large-scale ecological restoration projects on trade-offs/synergies and clusters of ecosystem services. J. Environ. Manage. 365, 121591. doi: 10.1016/j.jenvman.2024.121591
Ma X., Liu S., Guo L., Zhang J., Feng C., Feng M., et al. (2024). Evolution and analysis of water yield under the change of land use and climate change based on the PLUS-inVEST model: A case study of the yellow river basin in Henan Province. Water 16, 2551. doi: 10.3390/w16172551
Masood M., He C., Shah S. A., Rehman S. A. U. (2023). Land use change impacts over the indus delta: A case study of sindh province, Pakistan. Land 2024 13, 1080. doi: 10.3390/land13071080
Nie W., Xu B., Yang F., Shi Y., Liu B., Wu R., et al. (2023). Simulating future land use by coupling ecological security patterns and multiple scenarios. Sci. Total. Environ. 859, 160262. doi: 10.1016/j.scitotenv.2022.160262
Niu H., Liu M., Xiao D., Zhao X., An R., Fan L. (2022). Spatio-temporal characteristics of trade-offs and synergies in ecosystem services at watershed and landscape scales: A case analysis of the yellow river basin (Henan section). Int. J. Environ. Res. Public Health 19, 15772. doi: 10.3390/ijerph192315772
Qiao J., Deng L., Liu H., Wang Z. (2024). Spatiotemporal heterogeneity in ecosystem service trade-ofs and their drivers in the Huang-Huai-Hai Plain, China. Landsc. Ecol. 39, 19. doi: 10.1007/s10980-024-01827-x
Rao Y., Zhou M., Ou G., Dai D., Zhang L., Zhang Z., et al. (2018). Integrating ecosystem services value for sustainable land-use management in semi-arid region. J. Clean. Prod. 186, 662–672. doi: 10.1016/j.jclepro.2018.03.119
Ren H., Tan K., Zhang G., Wang Z., Shi H., Wen Z., et al. (2024). Diverse responses of the changes in evapotranspiration and water yield to vegetation and climate change in the Yanhe River watershed. Ecol. Indic. 168, 112750. doi: 10.1016/j.ecolind.2024.112750
Shen J., Zhao M., Tan Z., Zhu L., Guo Y., Li Y., et al. (2024). Ecosystem service trade-offs and synergies relationships and their driving factor analysis based on the Bayesian belief Network: A case study of the Yellow River Basin. Ecol. Indic. 163, 112070. doi: 10.1016/j.ecolind.2024.112070
Sun B., Du J., Chong F., Li L., Zhu X., Zhai G., et al. (2023). Spatio-temporal variation and prediction of carbon storage in terrestrial ecosystems in the yellow river basin. Remote Sens. 15, 3866. doi: 10.3390/rs15153866
Wang S., Cai T., Wen Q., Yin C., Han J., Zhang Z. (2024b). Spatiotemporal dynamics of ecosystem water yield services and responses to future land use scenarios in henan province, China. Water 16, 2544. doi: 10.3390/w16172544
Wang J., Li X., Christakos G., Liao Y., Zhang T., Gu X., et al. (2010). Geographical detectors-based health risk assessment and its application in the neural tube defects study of the heshun region, China. Int. J. Geogr. Inf. Sci. 24, 107–127. doi: 10.1080/13658810802443457
Wang C., Wang Y., Wang R., Zheng P. (2018). Modeling and evaluating land-use/land-cover change for urban planning and sustainability: A case study of Dongying city, China. J. Clean. Prod. 172, 1529–1534. doi: 10.1016/j.jclepro.2017.10.294
Wang H., Zhang M., Wang C., Wang K., Wang C., Li Y., et al. (2022). Spatial and temporal changes of landscape patterns and their effects on ecosystem services in the huaihe river basin, China. Land 11, 513. doi: 10.3390/land11040513
Wang Q., Zhao G., Zhao R. (2024a). Resilient urban expansion: Identifying critical conflict patches by integrating flood risk and land use predictions: A case study of Min Delta Urban Agglomerations in China. Int. J. Disaster. Risk Reduct. 100, 104192. doi: 10.1016/j.ijdrr.2023.104192
Wang J., Zhou J., Ma D., Zhao X., Wei W., Liu C., et al. (2023). Impact of ecological restoration project on water conservation function of qilian mountains based on inVEST model—A case study of the upper reaches of shiyang river basin. Land 12, 1850. doi: 10.3390/land12101850
Wei X., Wu X., Wang D., Wu T., Li R., Hu G., et al. (2024). Spatiotemporal changes and management measure to enhance ecosystem services in the Mongolian Plateau. Environ. Dev. 52, 101103. doi: 10.1016/j.envdev.2024.101103
Xie H., He Y., Choi Y., Chen Q., Cheng H. (2020). Warning of negative effects of land-use changes on ecological security based on GIS. Sci. Total. Environ. 704, 135427. doi: 10.1016/j.scitotenv.2019.135427
Xie X., Wang X., Wang Z., Lin H., Xie H., Shi Z., et al. (2023). Influence of landscape pattern evolution on soil conservation in a red soil hilly watershed of southern China. Sustainability 15, 1612. doi: 10.3390/su15021612
Xiong M., Li F., Liu X., Liu J., Luo X., Xing L., et al. (2023). Characterization of ecosystem services and their trade-off and synergistic relationships under different land-use scenarios on the loess plateau. Land 12, 2087. doi: 10.3390/land12122087
Xu L., Liu X., Tong D., Liu Z., Yin L., Zheng W. (2022). Forecasting urban land use change based on cellular automata and the PLUS model. Land 11, 652. doi: 10.3390/land11050652
Xu Y., Yang D., Tang L., Qiao Z., Ma L., Chen M. (2023). Exploring the impact of grain-for-green program on trade-offs and synergies among ecosystem services in west liao river basin, China. Remote Sens. 15, 2490. doi: 10.3390/rs15102490
Yang R., Mu Z., Gao R., Huang M., Zhao S. (2024). Interactions between ecosystem services and their causal relationships with driving factors: A case study of the Tarim River Basin, China. Ecol. Indic. 169, 112810. doi: 10.1016/j.ecolind.2024.112810
Yang Y., Yuan X., An J., Su Q., Chen B. (2024). Drivers of ecosystem services and their trade-offs and synergies in different land use policy zones of Shaanxi Province, China. J. Clean. Prod. 452, 142077. doi: 10.1016/j.jclepro.2024.142077
Yu Y., Guo B., Wang C., Zang W., Huang X., Wu Z., et al. (2023). Carbon storage simulation and analysis in Beijing-Tianjin-Hebei region based on CA-plus model under dual-carbon background. Geomat. Nat. Hazards. Risk. 14, 217 3661. doi: 10.1080/19475705.2023.2173661
Keywords: land use type, ecosystem services, multi-scenario prediction, spatiotemporal correlations, geographic detector, Henan Province
Citation: Sun Y, Qi M, Wang W, Cai J and Tian F (2025) Exploration of the multi-scenario spatiotemporal evolution, trade-off and synergy relationships, and driving factors of ecosystem services in Henan Province, China, under the background of land use change. Front. Ecol. Evol. 13:1565632. doi: 10.3389/fevo.2025.1565632
Received: 23 January 2025; Accepted: 11 March 2025;
Published: 07 April 2025.
Edited by:
Athanasios Kallimanis, Aristotle University of Thessaloniki, GreeceReviewed by:
Peng Du, Liaoning Normal University, ChinaCopyright © 2025 Sun, Qi, Wang, Cai and Tian. This is an open-access article distributed under the terms of the Creative Commons Attribution License (CC BY). The use, distribution or reproduction in other forums is permitted, provided the original author(s) and the copyright owner(s) are credited and that the original publication in this journal is cited, in accordance with accepted academic practice. No use, distribution or reproduction is permitted which does not comply with these terms.
*Correspondence: Jun Cai, Y2FpanVuQGFoYXVsLmVkdS5jbg==
Disclaimer: All claims expressed in this article are solely those of the authors and do not necessarily represent those of their affiliated organizations, or those of the publisher, the editors and the reviewers. Any product that may be evaluated in this article or claim that may be made by its manufacturer is not guaranteed or endorsed by the publisher.
Research integrity at Frontiers
Learn more about the work of our research integrity team to safeguard the quality of each article we publish.