 Xu Sang
 Caili Sun2
 Zongzheng Chai
- 1College of Forestry, Guizhou University, Guiyang, Guizhou, China
- 2College of Eco-Environmental Engineering, Guizhou Minzu University, Guiyang, Guizhou, China
Introduction: Rocky desertification poses a significant ecological challenge globally, leading to ecosystem degradation and diminished land resources. Consequently, it causes substantial changes in land-use patterns, hindering regional sustainable development.
Methods: This research focuses on Bijie City, Guizhou Province, China, a region severely affected by rocky desertification. Using land use/cover data and relevant driving-factor data from 1990 to 2022, and employing methods such as spatial pattern analysis, we comprehensively analyze land-use/cover change (LUCC) characteristics over time and predict land-use patterns under three scenarios for 2030.
Results: The key findings are: (1) Bijie City has diverse land types. Cropland and forest together comprise nearly 90% of the total land area, exhibiting distinct regional spatial distributions. (2) During the rocky desertification control period (1990–2020), cropland, shrubland, and grassland areas decreased, while forest area increased. Conversion of these three land types to forest was the primary driver of LUCC. Landscape fragmentation decreased, and the ecological environment significantly improved. (3) Projections indicate that focusing solely on ecological governance (Scenario 1) or cultivated-land protection (Scenario 2) is insufficient. Scenario 3, integrating ecological governance and cultivated-land protection, is optimal. By 2030, cropland area is projected to increase rationally by 307.51 km2, with some forest, shrubland, and grassland converting to cropland. This land-use change will be the main feature of future LUCC, safeguarding food security and enhancing ecological quality.
Discussion: In conclusion, rocky desertification control efforts from 1990 to 2020 have profoundly impacted Bijie City’s land-use patterns. Future efforts must prioritize coordinated ecological and cultivated land protection. This study provides crucial theoretical support for regional ecosystem management and spatial planning, promoting harmonious ecological and economic development.
1 Introduction
Rocky desertification, a significant global ecological challenge, threatens ecosystem stability and sustainable human development, becoming a focal point in global environmental governance (Feng et al., 2022; Salunkhe et al., 2018). Numerous regions worldwide are affected (Ren et al., 2023). Karst regions of southwest China experience severe rocky desertification due to unique carbonate geology and long-term unsustainable practices like over-reclamation and deforestation (Zhang et al., 2010). In Africa’s Sahel region, prolonged droughts and overgrazing-induced vegetation damage are expanding desertified areas (Herrmann and Hutchinson, 2005). Mediterranean coastal areas face increasing rocky desertification due to climate change and excessive human development.
The impacts are primarily ecological and economic. Ecologically, rocky desertification drastically reduces vegetation cover, intensifies soil erosion, weakens ecosystem water and soil conservation functions, and triggers problems like biodiversity loss (Jiang et al., 2014). Economically, it decreases land productivity, reduces available land, and hinders agricultural production and economic development, exacerbating regional poverty and challenging sustainable development (Li et al., 2018). These ecological and resource degradations cause significant spatiotemporal land-use pattern variations, profoundly affecting regional sustainability. Therefore, researching spatiotemporal land-use change in key rocky desertification control regions and accurately predicting future trends is crucial for developing sound control strategies and achieving sustainable development.
Land Use/Cover Change (LUCC), a key driver and outcome of global environmental change, is pivotal in terrestrial ecosystems (Tian et al., 2016), directly or indirectly altering original terrestrial ecosystem surface characteristics (Song et al., 2018; Sterling et al., 2013). Land-use change drives many environmental processes, including climate change (Verburg et al., 2011), carbon dioxide emissions (Ahmad and Nizami, 2015), and the carbon cycle (Castillo-Figueroa, 2021), and significantly impacts food security, ecological security, and social stability (Foley et al., 2005; Sani et al., 2016). Since the International Human Dimensions Programme on Global Environmental Change and the International Geosphere–Biosphere Programme established LUCC as core global change research (Turner et al., 1995), extensive research has been conducted. For example, Song et al. (2018) used high-resolution satellite data to quantify and analyze global land-use change from 1982 to 2016, revealing long-term trends and regional differences, informing our understanding of human-environment interaction. Robert et al. (2013) explored land-use change impacts on ecosystem services in diverse mountainous regions, which are important for global ecosystem services but face intense land-use pressure. Du et al. (2023) found net decreases in forest and cultivated land and a net increase in grassland in the Eurasian steppe, offering insights into land-use change in Asian steppe regions. Mao (2022) studied dynamic land-use changes in Bijie City, Guizhou, China, using multi-temporal remote sensing data, and explored their spatiotemporal evolution and correlations with ecosystem service functions, providing practical evidence for local ecological security pattern planning. Notably, long-term rocky desertification control significantly impacts land-use change (Guo et al., 2023; Yang et al., 2011). However, systematic research on regional land-use evolution under rocky desertification control remains limited and requires further development.
Guizhou Province has some of the most severe rocky desertification in China and globally, possessing the country’s largest area of such land. According to China’s first rocky desertification monitoring data, Bijie City’s desertified area reached 6540.65 km², representing both the largest area and the most severe degree of desertification in Guizhou Province, making it a key area for ecological and environmental governance (Mao, 2022; Zuo et al., 2014). In the last century, economic development pressures, under implementation of ecological projects, and the impacts of rocky desertification severely damaged Bijie City’s forests and cultivated land, hindering local economic development. The poverty rate was approximately 65.4%, and the regional GDP was only 663 million yuan (Tang, 2011; Zuo et al., 2014). With national poverty alleviation policies and ecological projects, Bijie City has achieved remarkable results in both poverty alleviation and ecological governance. By November 23, 2020, Bijie City achieved full poverty alleviation, with a GDP exceeding 190 billion yuan—a 287.22-fold increase. Rocky desertification control efforts have yielded significant phased results, with 1878.64 km² of desertified land under control and a greatly improved ecological environment. This has led to substantial land-use/cover changes, including a significant increase in forest land and conversion of cultivated land to forest. However, combined factors like human activities have created a complex land-use change situation. Therefore, this study focuses on Bijie City, a key national rocky desertification control region, using 30-meter resolution Chinese land-use data from 1990 to 2022. It aims to analyze spatiotemporal land-use pattern evolution and explore the causes of spatiotemporal differentiation in land-use change. By integrating the Markov model with the FLUS model, the study predicts land-use change trends under different development scenarios in 2030, providing strong theoretical support for rocky desertification monitoring and control, sustainable ecological management, and regional spatial planning.
2 Materials and methods
2.1 Study area
The study area is in Bijie City, Guizhou Province, China (105°36′~106°43′ E, 26°21′55~27°46′ N), encompassing a total area of 26,848.5 km2, and accounting for 15.25% of Guizhou’s total land area. The study area is located within the Wumeng Mountain region, on the eastern slope of the Yungui Plateau, specifically inside the ridge zone of the Yungui Plateau. Figure 1 illustrates its precise geographic location. This area is mountainous and exhibits typical karst landforms, with higher elevations to the west and lower elevations to the east (ranging from 470m to 2217m, with an average of 1511m). The region has a subtropical warm and humid monsoon climate, with average temperatures ranging from 10–15°C and average annual rainfall between 849mm and 1399mm. Social, economic, and population data for Bijie City are shown in Table 1.
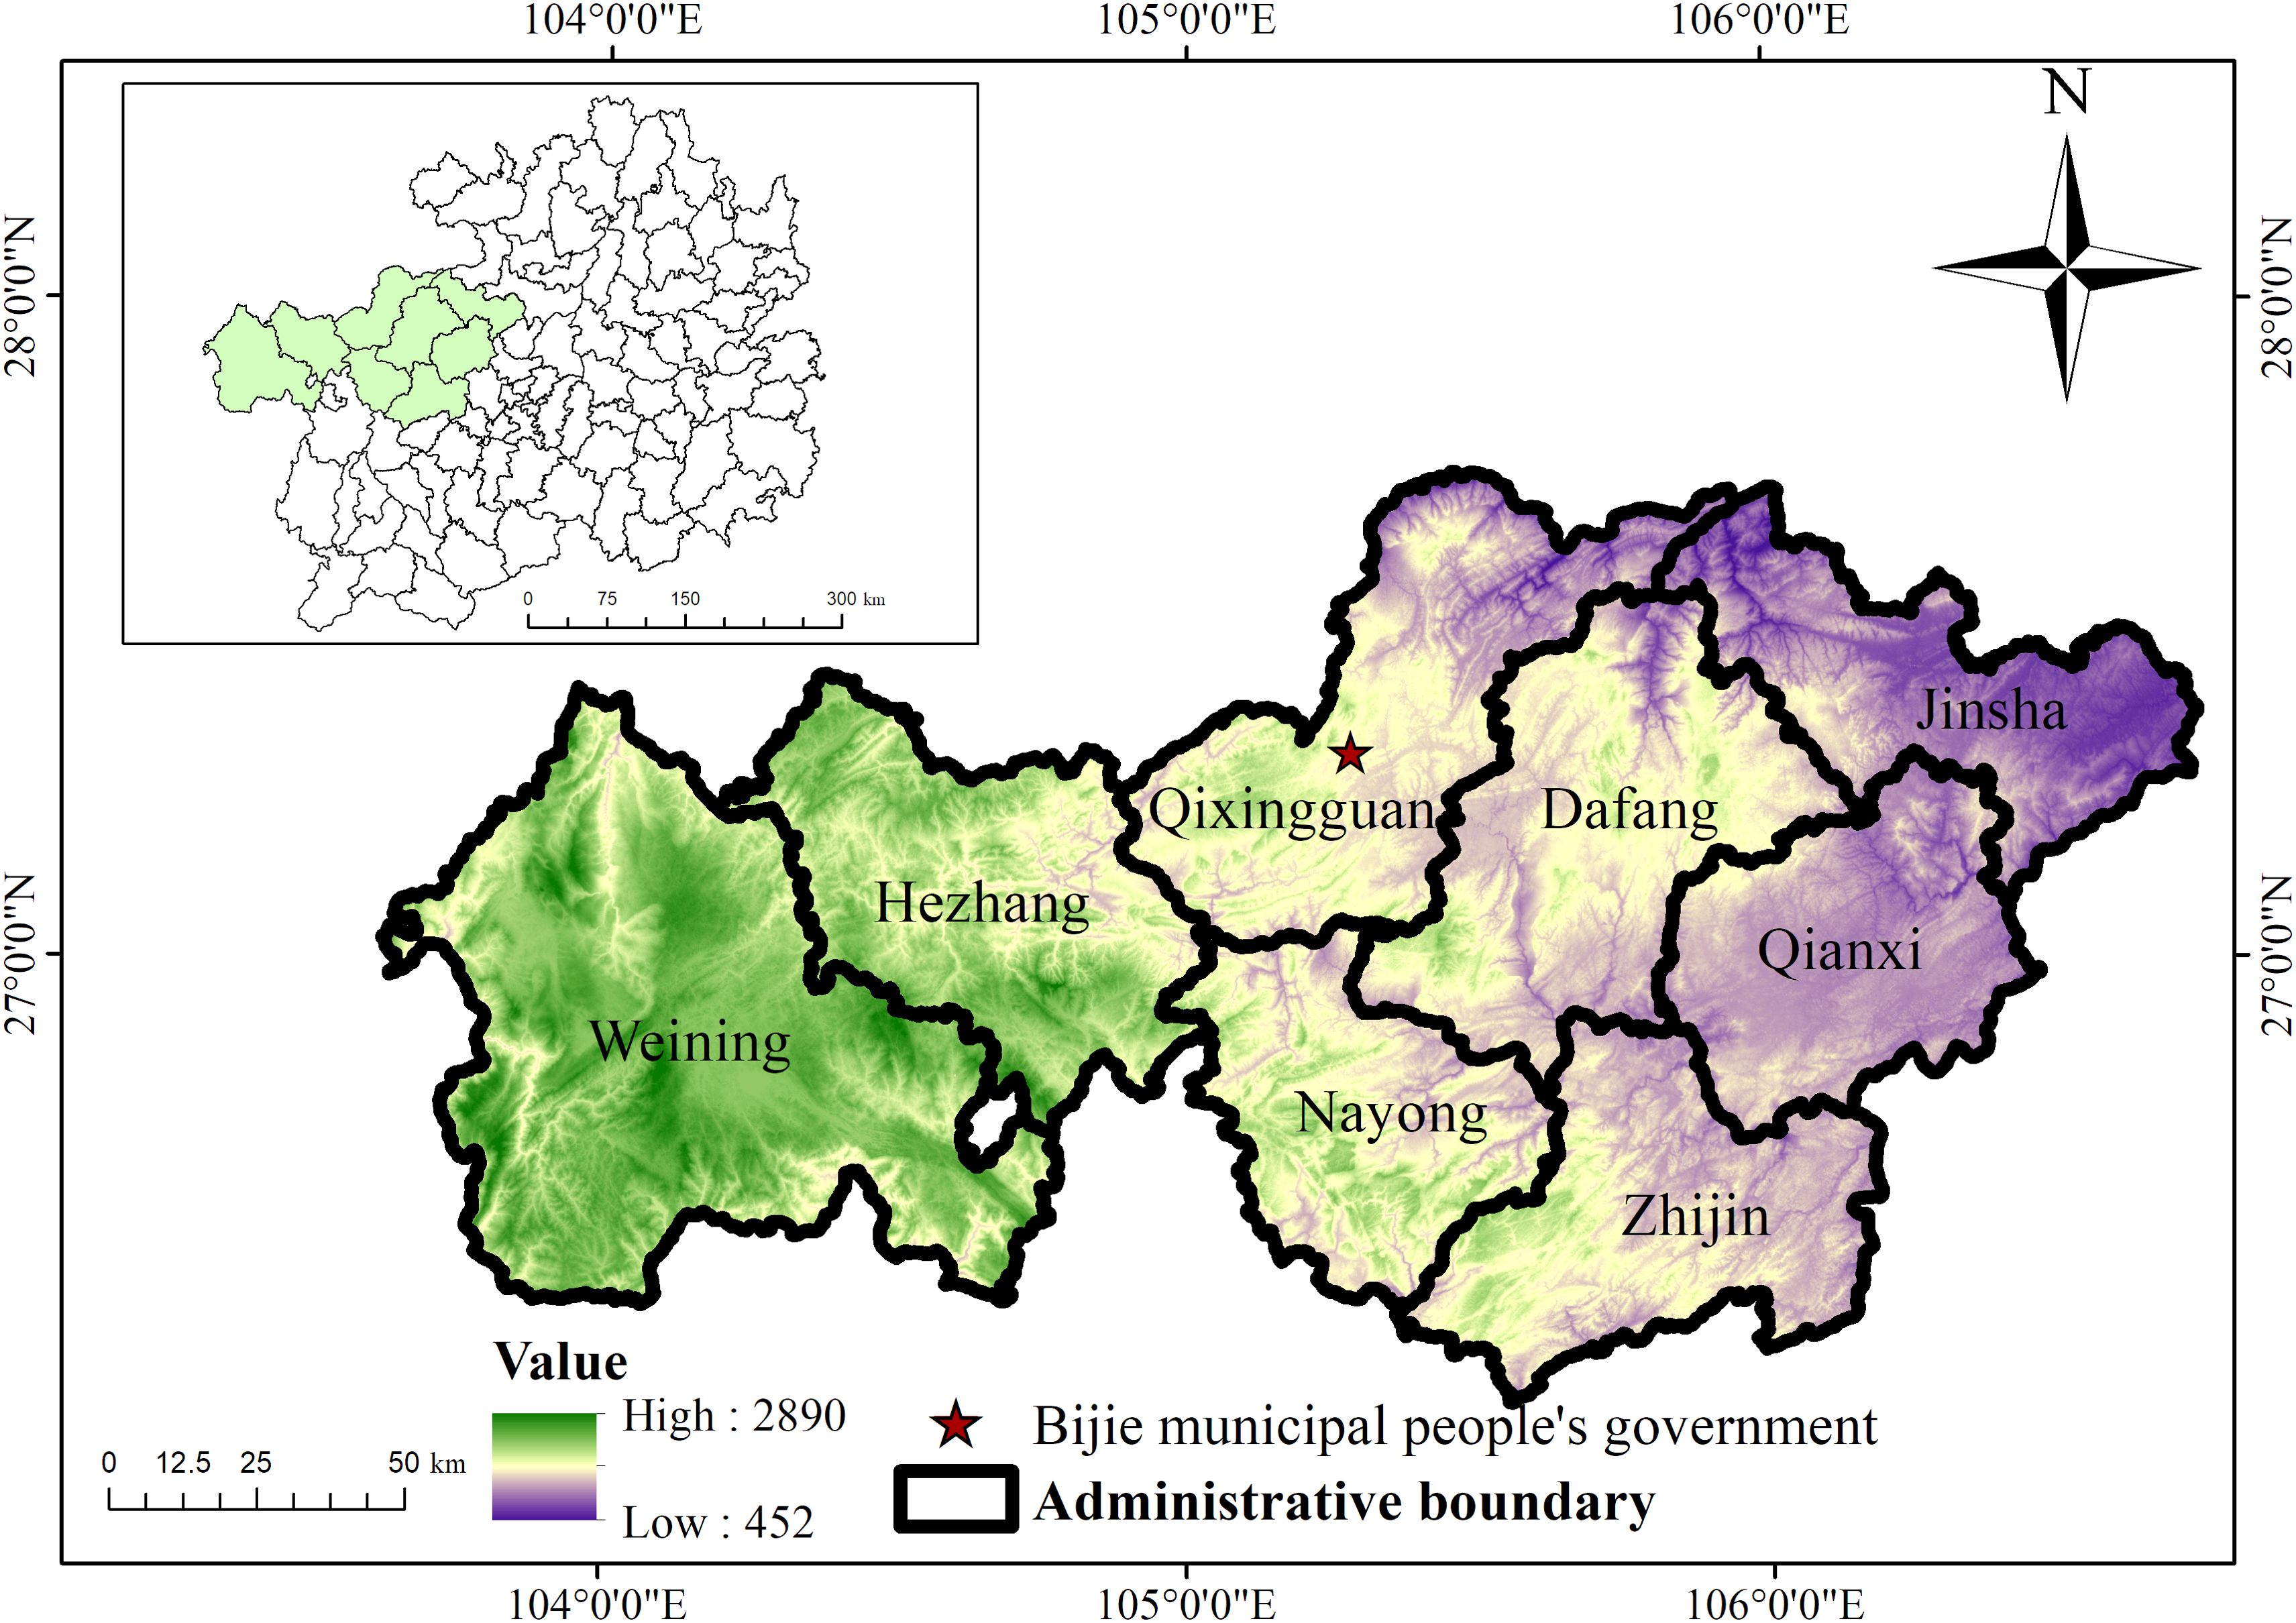
Figure 1. Location map of the study area, Value stands for altitude.
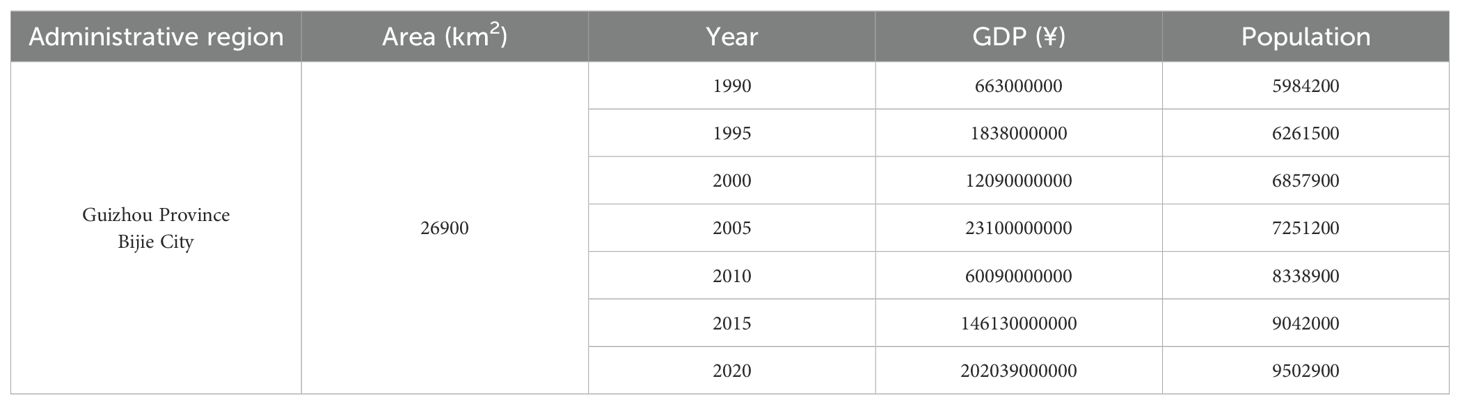
Table 1. The socio-economic and demographic situation of Bijie City from 1990 to 2020.
2.2 Data source and processing
This study uses land-use, driving-factor, and socioeconomic data. The land-use dataset, “30m annual land-use data of China from 1990 to 2022” (Yang and Huang, 2021), with an 80% overall classification accuracy, includes data points for 1990, 1995, 2000, 2005, 2010, 2015, 2020, and 2022. For this research, Bijie City’s land-use data was reclassified into seven categories (cropland, forest, shrubland, grassland, water, other, and built-up land) according to the national standard “Classification of Land Use Status: GB/T21010-2007.” This dataset is from the National Cryosphere Desert Data Center (http://www.ncdc.ac.cn). Socioeconomic data comes from the Economic Accounting System of the Guizhou Provincial Bureau of Statistics (http://stjj.guy.gov.cn/), the Bijie Yearbook, and the Bijie Municipal Bureau of Statistics (http://www.bijie.gov.cn/bm/bjstjj/). Following existing research (Zhang, 2022; Belayneh et al., 2020), selected model driving factors include biophysical and anthropogenic factors. The preprocessed driving-factor data for 2020 is shown in Figure 2, and the dataset is detailed in Table 2.

Figure 2. The driving factor data for Bijie City in 2020. (a) DEM (Digital Elevation Model), (b) Slope, (c) Exposure, (d) Temperature, (e) Precipitation, (f) Density of Population, (g) GDP (Gross Domestic Product), (h) Distance to Railway and (i) Distance to Road.
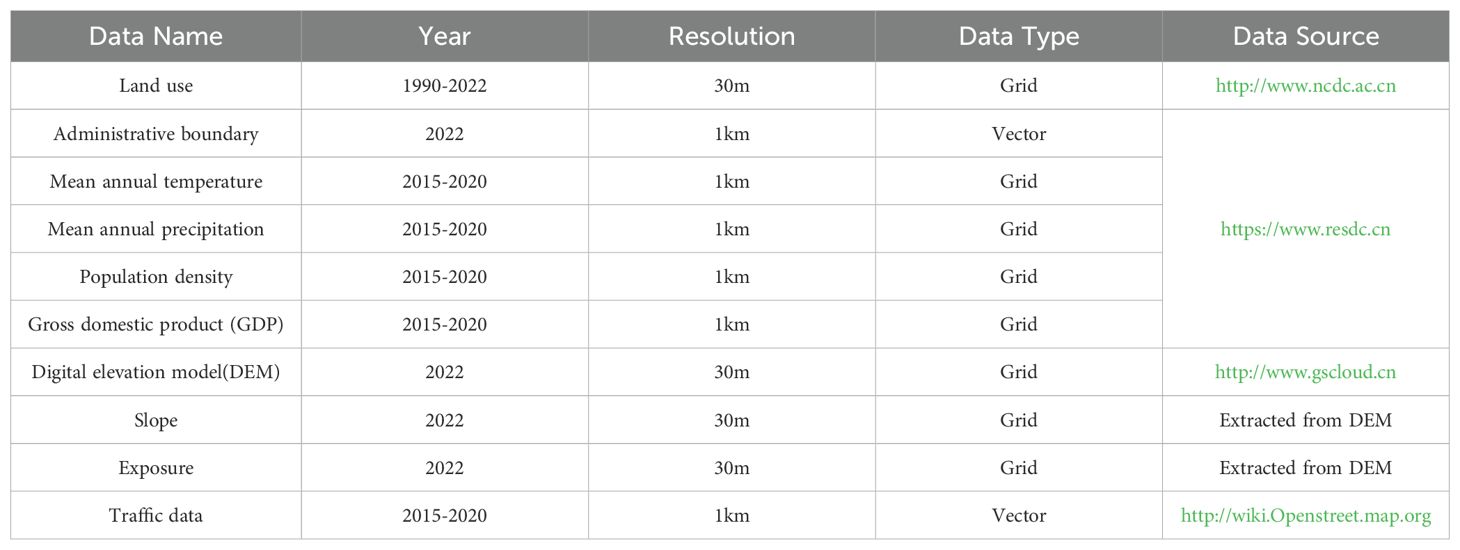
Table 2. Source and accuracy of driving force factors.
Data availability for the same year is essential. Some datasets are unavailable for download in certain years. Dataset selection considered temporal and spatial resolution and accessibility. Given the availability of comprehensive human and biophysical factor datasets from various sources, 2015 and 2020 were selected as model years, with 2022 data used for comparison with predictions.
2.3 Methods
2.3.1 Research methods for dynamic changes in land use
We conducted an in-depth analysis of land-use pattern variations from two dimensions: space and time. Specifically, we employed methods such as spatial pattern analysis of land use and transfer matrix analysis of land use as outlined by Yan et al. (2017) and Zhou (2024). The land-use transfer matrix is an effective research method for studying the dynamic changes in land use. It can reflect the structural characteristics of land-use types in a region over a specific period and express in detail the direction and quantity of land-use type transitions. Its mathematical expression is represented by Wang et al. (2008):
Where Sij represents the area of land-use type “i” that has been converted into land-use type “”, while the variable “” indicates the specific category of land use.
2.3.2 Analysis of land-use patterns
Land-use patterns in different years were analyzed using Fragstats 4.2. The selected landscape pattern indices effectively capture and synthesize landscape pattern information, reflecting the structural characteristics of land-use types and facilitating a comprehensive understanding of spatiotemporal landscape changes (Gong et al., 2017; Wang and Yin, 2011; Tang et al., 2019; Yang et al., 2019). Based on the study area’s specific conditions and research objectives, six ecologically significant landscape-level indices were chosen (Shu et al., 2022) to analyze spatiotemporal land-use landscape pattern changes and reveal information about various land-use/cover change patterns. Table 3 explains these indices.
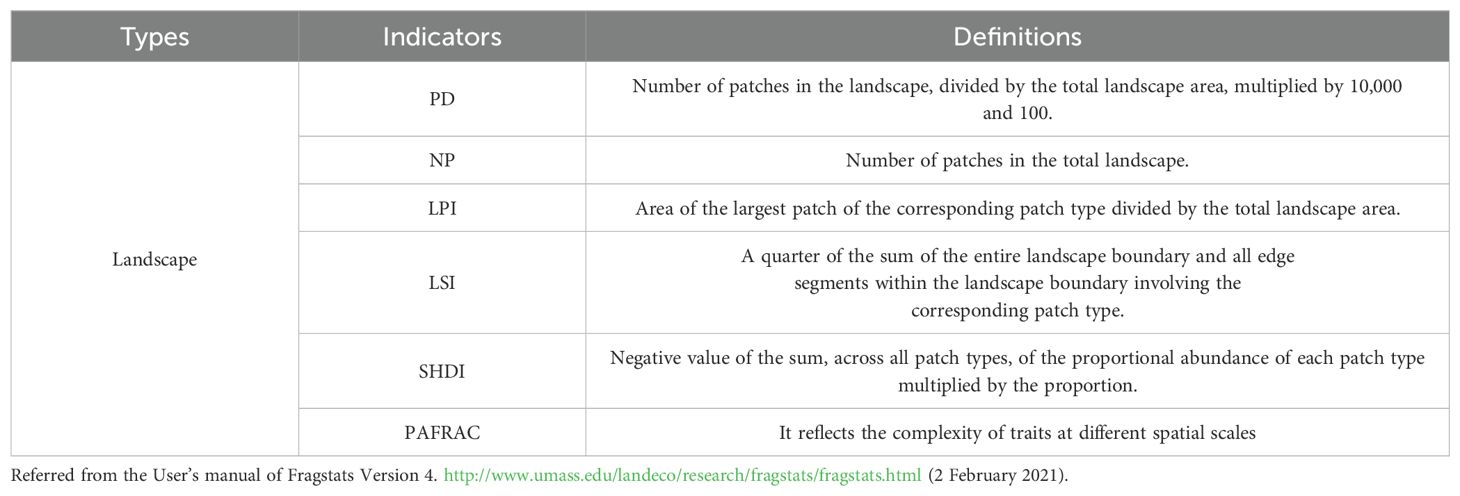
Table 3. Definitions of the indicators.
2.3.3 Predictive model for land-use change
The FLUS (Future Land Use Simulation) and Markov models were chosen for this study due to their advantages over models like CLUE-S (Conversion of Land Use and its Effects at Small regional extent) and CA (Cellular Automata). FLUS and Markov offer a balance between quantity and spatial accuracy, support multi-scenario analysis, provide high precision and flexibility, and are broadly applicable and adaptable to complex requirements. These features meet the study’s needs for predicting land-use changes under various future development scenarios (Qian et al., 2022; Li and Yeh, 2004; Zhang et al., 2021; Feng et al., 2021).
The FLUS model uses the Markov module to calculate target year land-use demand and an artificial neural network (ANN) to compute each pixel’s occurrence probability. Based on multiple driving factors, the model simulates complex spatial land-use changes, generating suitability maps. A cellular automata module with an adaptive inertia mechanism then predicts future land use. The modeling process has two phases: (1) a validation phase using 2015 as the base year to predict 2020 land-use for accuracy assessment, and (2) an application phase using 2020 as the base year to predict 2030 land use. Predicted results are then compared with actual 2022 land-use data.
2.3.3.1 Module for calculating suitability probability based on neural network
The FLUS model is implemented in the GeoSOS-FLUS software, as described by Lin et al. (2021) and Tian et al. (2020). The software’s neural network module for calculating the probability of land-use suitability uses 2020 land-use data as the baseline and incorporates biophysical and human factors from 2020 to generate a land-use suitability atlas for that year. The main principle formula is:
Where represents the weight connecting the hidden layer and the output layer, analogous to . The suitability probability, denoted as , represents the likelihood of land-use type “” being suitable at pixel “” and time “”. For the output suitability probability obtained from the neural network, denoted at , the sum of probabilities for different land-use types at iteration time “” and pixel “” always equals 1.
2.3.3.2 Cellular automata module incorporating an adaptive inertia mechanism
In the FLUS model, the final probability of conversion is determined not only by the adaptive distribution probability of land-use types but also by factors such as neighborhood density, resistance coefficient, conversion cost, and competition among lands. The self-adaptive inertia coefficient plays a crucial role in the FLUS model by governing the discrepancy between the land demand as predicted by the Markov model and the actual land-use area for each land-use type. This coefficient automatically adjusts during subsequent iterations, as described by Zhou (2024).
Where represents the inertia coefficient of the type “” of land at the iteration time “”, represent the difference between the number of pixels of the type “” of land use and the number of land-use demands at the and iterations, respectively.
2.3.3.3 Markov model principle
As a quantitative model, the Markov model is frequently employed to predict changes in land-use types over time series. This model is prized for its stability and lack of after-effects. The stochastic nature of its development process ensures that the state of any future moment depends solely on the current state, with no influence from previous iterations. Consequently, the Markov model tends toward stability. Therefore, this paper utilizes the Markov model to forecast future land-use demand in Bijie City. Its mathematical expression is depicted below, following Yang et al. (2012):
Where represents the state of the land-use type at a future time, represents the status of land-use/cover type at the current time “”, and represents the probability matrix of state transfer of the land-use type.
2.3.3.4 Land-use simulation setting and simulation accuracy
The FLUS model allows adjustment of land-use transition directions and neighborhood weights to simulate future land-use scenarios. A neighborhood weight near 1 indicates high expansion potential for a land-use type, while a weight near 0 indicates limited potential. Different land-use types are assigned varying neighborhood weights. Based on national cultivated land protection policies and the study area’s conditions, three scenarios were developed to predict 2030 land use; Scenario 1 (Ecological Management): Forest conversion to other land uses is prohibited, and conversion to built-up land is strictly controlled. Neighborhood weights: cropland (0.055), forest (0.84), shrubland (0.036), grassland (0.055), water (0.006), other (0.001), built-up land (0.005). Scenario 2 (Cultivated Land Protection): Cropland conversion to other land uses is strictly controlled, while other land-use types can transition freely. Neighborhood weights: cropland (0.5), forest (0.2), shrubland (0.03), grassland (0.003), water (0.01), other (0.005), built-up land (0.4). Scenario 3 (Coordinated Development): Cropland conversion is prohibited. Forest, shrubland, and grassland can partially convert to cropland. Built-up land conversion is strictly controlled. Neighborhood weights: cropland (0.3), forest (0.26), shrubland (0.056), grassland (0.006), water (0.01), other (0.005), built-up land (0.3).
The Kappa coefficient serves as an indicator of the model’s consistency between simulated land-use outcomes and actual land-use distribution, as discussed by Vliet et al. (2013) and Vliet et al. (2011). The formula is as follows:
Where and are observed actual values and predicted values of land use, respectively.
3 Results
3.1 Land-use structure and spatial pattern in Bijie City from 1990 to 2020
Figure 3 shows the spatial distribution of land use in Bijie City from 1990 to 2020, revealing clear disparities in land-use structure and spatial patterns. Cropland is concentrated in the east and west, forest in the north and south, shrubland, grassland, and water in the west, built-up land in the center, and other land uses are scattered. Table 4 shows the area of each land-use type from 1990 to 2020, demonstrating significant changes during the rocky desertification control period (1990–2020). Forest, built-up land, water, and other land uses generally increased, while cropland, shrubland, and grassland decreased. Forest, cropland, shrubland, and grassland experienced the largest changes. Forest area increased substantially (5.57%), primarily in the east. Conversely, cropland, shrubland, and grassland areas decreased by 1.1%, 2.04%, and 2.9%, respectively, decreasing from 12365.97 km² to 12070.59 km², 1132.82 km² to 584.88 km², and 1805.56 km² to 1029.19 km², primarily in the east. Built-up land increased by 0.26%, expanding outward from county-level urban centers.

Figure 3. Land-use structure and spatial pattern in Bijie City from 1990 to 2020. (a) 1990, (b) 1995, (c) 2000, (d) 2005, (e) 2010, (f) 2015 and (g) 2020.
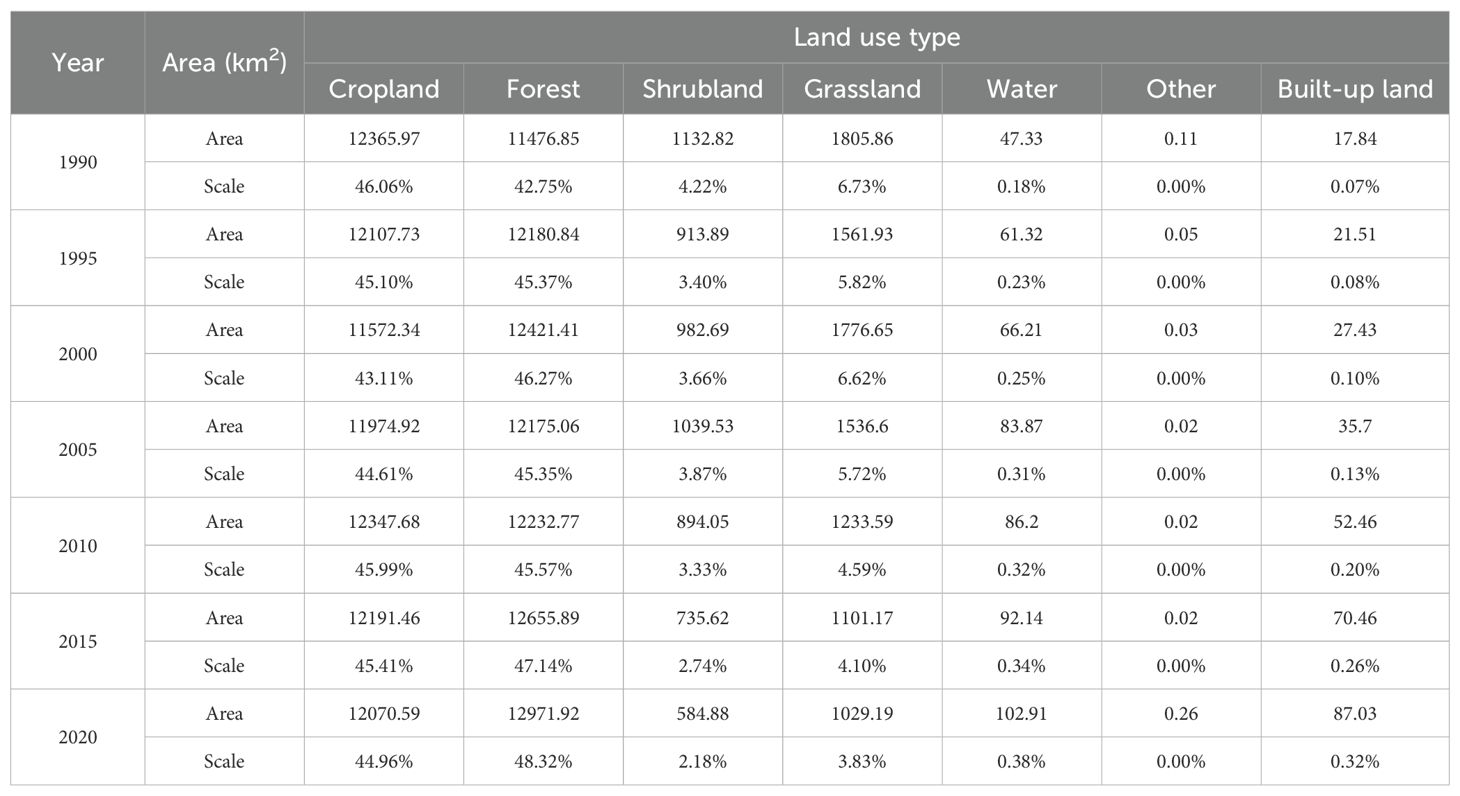
Table 4. Area by land-use type in Bijie from 1990 to 2020.
From 2000 to 2010, cropland area increased by 775.34 km², likely due to increased human activity and farming intensity. The overall forest area increase is directly related to government rocky desertification control measures, such as the “Grain for Green” program and reforestation efforts.
3.2 Characteristics of the land-use landscape pattern in Bijie City from 1990 to 2020
Figure 4 depicts landscape-level pattern changes in Bijie City. During the rocky desertification control period (1990–2020), the number of patches (NP), patch density (PD), and perimeter-area fractal dimension (PAFRAC) all decreased (by 214,129, 7.98, and 0.044, respectively), indicating intensifying patch interference and increasing aggregation. The landscape shape index (LSI) first decreased (from 441.80 to 348.90) and then increased (to 361.02), suggesting irregular landscape patches. Shannon’s diversity index (SHDI) and the largest-patch index (LPI) fluctuated, first decreasing, then increasing, and then decreasing again. SHDI decreased from 0.91 to 0.89, increased to 0.91, and then decreased to 0.87. LPI decreased from 21.30 to 18.71, increased to 22.04, and then decreased to 20.50. These changes indicate that recent rocky desertification control efforts have been successful, reducing landscape fragmentation and enhancing landscape pattern stability.

Figure 4. Change of landscape level land-use pattern in Bijie City from 1990 to 2020. (a) NP, (b) PD, (c) SHDI, (d) PAFRAC, (e) LPI and (f) LSI, Patch refers to a relatively homogeneous nonlinear region different from the surrounding background. NP index represents the number of patches, PD index represents the density of patches, LSI index represents the intensity of patch changes, LPI represents the change degree of maximum patches, PAFRAC index represents the complexity of patches, and SHDI index represents the diversity of patches.
3.3 Transfer characteristics of land use in Bijie City from 1990 to 2020
Figure 5 shows the land-use transfer matrix for Bijie City from 1990 to 2020, revealing varying transfer directions and scales across periods (Equation 1). Conversion of cropland, shrubland, and grassland to forest was the primary land-use change. Due to policies like comprehensive rocky desertification control and the “Grain for Green” program, the study area showed distinct transfer characteristics in three stages: 1990–2000, 2000–2010, and 2010–2020.

Figure 5. The ratio of land-use transfer in different periods in Bijie City from 1990 to 2020. Light green represents forest, yellow represents cropland, dark green represents shrubland, cyan represents grassland, blue represents water, red represents built-up land, brown represents other, and the cross of different colors between the inner and outer circles represents the transfer of the former to the latter, (a) 1990–1995, (b) 1995–2000, (c) 2000–2005, (d) 2005–2010, (e) 2010–2015 and (f) 2015–2020.
From 1990 to 2000, cropland, shrubland, and grassland converted to forest, with transfer areas of 351.66 km², 220.08 km², and 372.21 km², respectively. From 2000 to 2010, forest, shrubland, and grassland converted to cropland, with transfer areas of 380.28 km², 44.26 km², and 394.06 km², respectively, indicating increased human activity and agricultural land demand. After 2010, the effects of rocky desertification control and “Grain for Green” became apparent. Cropland, shrubland, and grassland converted to forest, increasing forest area, with transfer areas of 392.79 km², 173.29 km², and 172.93 km², respectively. In general, ecological governance has a profound impact on the dynamics of land-use change.
3.4 Simulation and prediction of land-use/cover change in Bijie City in 2030
Table 5 presents the FLUS model accuracies. The Kappa coefficient is 0.852603, and both producers’ and users’ accuracies for all land uses exceed 0.7 (Equations 2–6). These indicators confirm that the study’s parameters and driving factors meet the accuracy standards for simulating land-use changes.
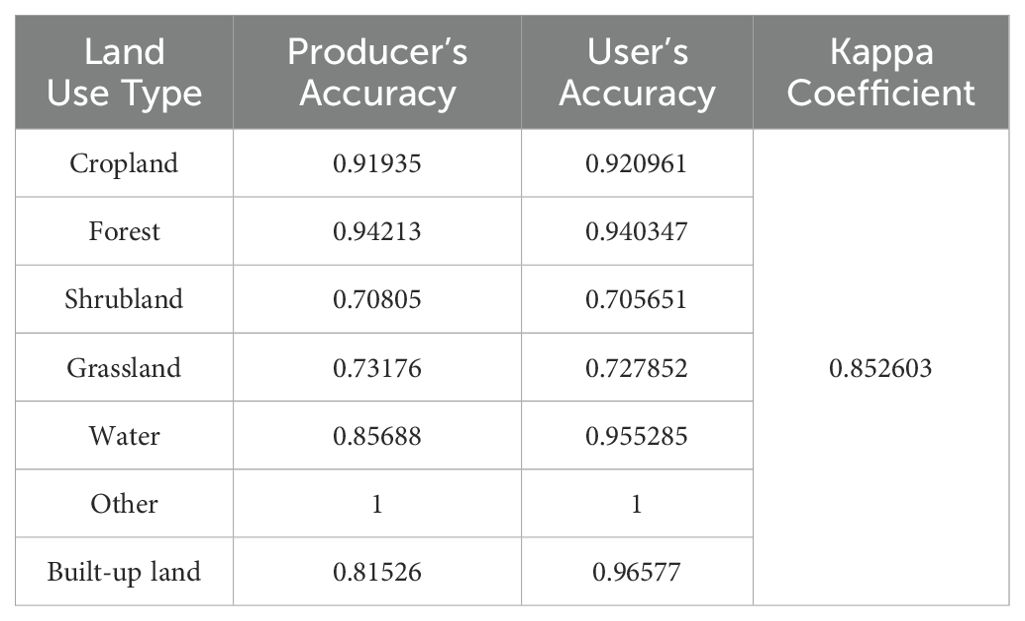
Table 5. Simulation accuracy of land-use change.
Using 2020 data as a baseline, the study predicted 2030 land-use patterns under three scenarios and validated them against 2022 actual land-use data (Figure 6; Table 6). Future spatial distribution of land-use types will change slightly, with cropland and forest remaining dominant.

Figure 6. Prediction of land-use spatial distribution in Bijie City in 2030 under three development scenarios. (a) Actual land-use distribution in 2022, (b) Ecological governance development scenario, (c) Cultivated land protection and development scenarios, (d) Scenario of coordinated development of ecological management and cultivated land protection.
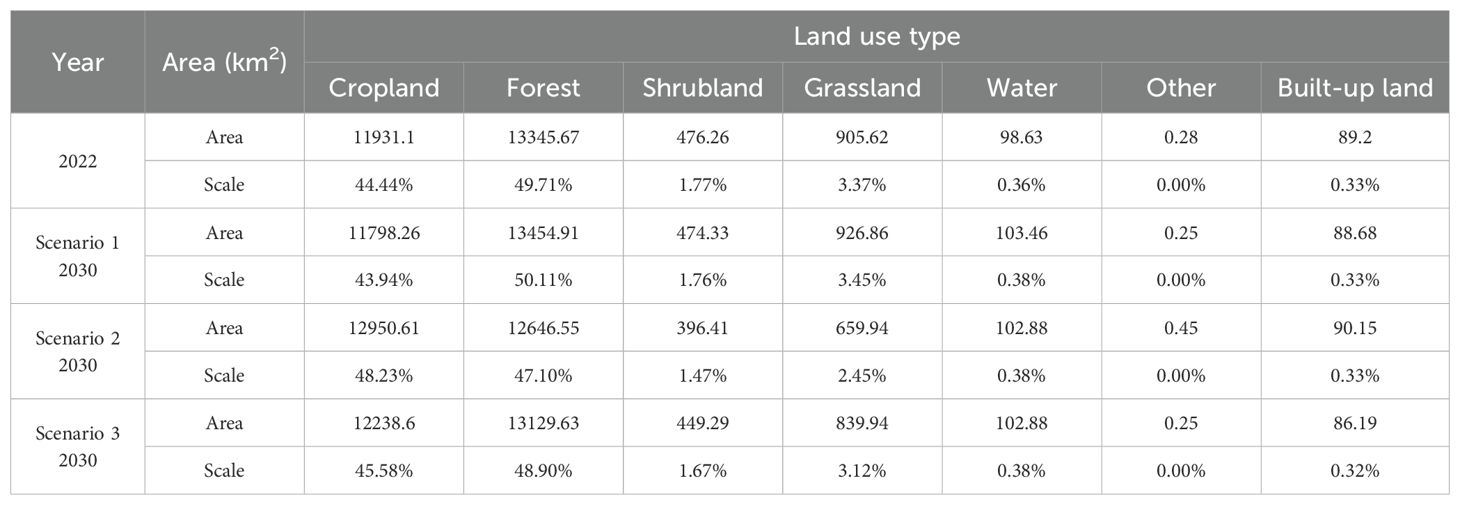
Table 6. Simulation and prediction of land cover in Bijie City in 2030 under three scenarios.
Scenario 1 (Ecological Governance) predicts increased ecological land (forest, grassland, shrubland) by 2030, demonstrating progress in ecological governance. However, cropland area decreases by 132.84 km², potentially impacting regional food security.
Scenario 2 (Cultivated Land Protection) predicts a significant cropland increase (1019.51 km²) by 2030. While effectively protecting cropland, increased human activity expands built-up land, reducing ecological quality. Forest, shrubland, and grassland areas decrease substantially, with some areas even showing aggravated rocky desertification, potentially threatening regional ecological security.
Scenario 3 (Coordinated Development) predicts effective cropland protection and a reasonable increase of 307.51 km² by 2030. This scenario promotes coordinated ecological governance and cultivated land protection, primarily through converting suitable forest, shrubland, and grassland areas to cropland. This land-use pattern evolution will be the main characteristic of future changes. Built-up land expansion is controlled, and land-use type proportions tend toward balance, reflecting sustainable land use.
Analysis of the three scenarios reveals that Scenario 3 (Coordinated Development) best aligns with the study area’s future sustainable development needs. It effectively protects cultivated land while improving the ecological environment, achieving a favorable balance in optimizing land-use structure and enhancing ecosystem service functions.
4 Discussion
In-depth analysis of land-use changes in the study area from 1990 to 2020 clearly demonstrates that rocky desertification control measures have significantly influenced land-use alterations. During this period, landscape indices such as patch number and patch density exhibited a declining trend, indicating that the continuous expansion of forested areas has significantly reduced the degree of landscape fragmentation. Consequently, the stability of the landscape pattern has been enhanced, reflecting a marked improvement in the ecological environment. These results underscore the success of rocky desertification control efforts, a conclusion that aligns with findings from most studies in rocky desertification regions, such as those in Southwest China (Wu et al., 2022), Yunnan Province (Tian et al., 2022), and Guizhou Province (Liu and Shi, 2021; Ran et al., 2018). Temporally, forest area steadily increased due to large-scale afforestation and expansion of ecological public welfare forests. Spatially, forest cover gradually increased in previously severely desertified regions, such as certain mountainous areas. The “Grain for Green” program facilitated substantial cropland conversion to forest in severely desertified areas (Mao, 2022; Zhang, 2022). This changed land-use type structure, decreasing cropland and expanding forest. Cropland-to-forest conversion primarily occurred in ecologically fragile regions, effectively curbing further desertification and significantly improving the regional ecological environment. This land-use change increased vegetation cover and biodiversity, and, through developing characteristic ecological tourism and agriculture, boosted local residents’ incomes. Consequently, regional ecological, social, and economic benefits significantly increased (Zuo, 2014).
Land-use patterns exhibit notable spatial differentiation between rocky desertification control areas and environmentally friendly areas. Regarding forest land, rocky desertification control areas have relatively low forest cover, and newly planted vegetation is still developing, limiting ecosystem service functions (Jiang et al., 2014). Conversely, environmentally friendly areas have stable forest ecosystems with a high proportion of ecological land, efficiently performing services like soil and water conservation and climate regulation. Concerning cultivated land, rocky desertification control areas implemented “Grain for Green” to curb soil erosion, but converted cropland faces issues like low soil fertility, affecting agricultural production stability (Zuo et al., 2014). Environmentally friendly areas have rational, concentrated, contiguous, and high-quality cultivated land, achieving high-yield agriculture through modern technology and management. Regarding grassland, rocky desertification control areas have improved, but vegetation cover and grass quality still lag behind environmentally friendly areas, limiting livestock carrying capacity. The latter have established complete grassland ecosystems with superior quality. For construction land, rocky desertification control areas face project constraints due to ecological restoration, slow infrastructure development, and a non-compact, irrational layout (Mao, 2022). Environmentally friendly areas have integrated construction land with ecological and agricultural land, featuring a compact, orderly layout and complete infrastructure, supporting regional economic development. These disparities highlight the critical need for scientific and rational land-use strategies for regional sustainable development.
In key rocky desertification control regions, coordinated ecological governance and cultivated land protection are crucial for sustainable development. Ecological governance, through measures like afforestation, effectively curbs desertification and improves the environment. However, cropland-to-forest conversion poses challenges to food security and farmers’ livelihoods. Cropland, fundamental for food security and a crucial income source, requires careful protection (Chen et al., 2016; Zou et al., 2025). Land-use planning must balance ecological governance and cultivated land protection, finding an optimal equilibrium to avoid problems caused by excessive intervention (Godfray et al., 2010; Cao et al., 2011). In accordance with the “No. 1 Central Document” issued by the Central Committee of the Communist Party of China, which emphasizes the necessity of firmly maintaining the “red line” of 1.8 billion mu of cropland (Central Committee of the Communist Party of China and the State Council, 2022), and the “Overall Territorial Spatial Plan of Bijie City from 2021 to 2035” issued by the Bijie Municipal Government in Guizhou Province, which explicitly prioritizes the protection of cultivated land area (Bijie Municipal Government, 2024), the future land-use change trends will exhibit significant dynamic adjustments under this policy backdrop. Reasonably predicting future land-use scenarios is vital for coordinated development of cultivated land protection and ecological governance.
This study analyzed land use under three scenarios for 2030. While Scenarios 1 (Ecological Governance) and 2 (Cultivated Land Protection) emphasize their respective focuses, both have limitations. Scenario 1’s cropland reduction may force agricultural production onto limited land, leading to overutilization and soil degradation, negatively impacting the environment. Scenario 2’s overemphasis on cultivated land protection, while neglecting ecological governance, may ensure short-term food production, but long-term ecological deterioration will undermine agricultural capacity, creating a vicious cycle and hindering sustainable development. Scenario 3 (Coordinated Development) effectively balances cultivated land protection and ecological governance, ensuring both food and ecological security, making it the most suitable direction for future land-use planning. This scenario increases cropland primarily by (1) converting suitable forest, shrubland, and grassland areas to cropland (while maintaining rocky desertification control progress) and (2) reclaiming construction land that illegally occupies cropland, replenishing cultivated land sustainably while ensuring ecological security. Because cropland is highly susceptible to rocky desertification, strengthening its monitoring and control is essential for future coordinated natural ecology and social economy development—crucial for ecological, economic, and social well-being and the only path to regional sustainable development.
This research, focusing specifically on the impact of rocky desertification on land use and incorporating the study area’s future spatial planning, offers more precise insights than previous studies. It provides valuable theoretical support for effective governance and rational planning in rocky desertification areas. By exploring the connection between rocky desertification and land use, and integrating future spatial development, this study offers crucial guidance for related practical work and promotes sustainable development in these areas. However, some limitations should be acknowledged. Regarding model selection, to clearly reflect future cultivated land protection policies, the study primarily used the traditional FLUS model. While this model can simulate and predict land-use changes, more advanced models like Patch-based Cellular Automata (LP-CA) and Land-Use Scenario Dynamics (LUSD) have emerged (Zhao and Peng, 2012; Lin et al., 2023). These newer models have been extensively validated and recognized for spatiotemporal dynamic simulation, nonlinear relationship processing, and prediction accuracy. Future research could integrate these advanced models to analyze the coupling relationships between land-use evolution and key driving factors like urban expansion, population migration, and industrial upgrading (Song et al., 2020). Combining the strengths of different models and leveraging their specialized problem-solving capabilities will allow future research to more systematically and accurately represent the dynamic land-use change process, uncover underlying mechanisms, provide more reliable and scientific decision-making for land-use planning and ecological governance in rocky desertification areas, and contribute to regional sustainable development.
5 Conclusions
Rocky desertification, a significant global ecological problem, degrades ecosystems and reduces land resources, causing substantial spatiotemporal land-use changes that impact regional sustainable development. This study focuses on Bijie City, Guizhou, China, a region severely affected by rocky desertification. Using land-use/cover data from 1990 to 2022 and relevant analytical methods, we analyzed historical LUCC and predicted 2030 land use under three scenarios. Key findings include:
1. The study area has diverse land types, dominated by cropland and forest, which together constitute approximately 90% of the total area. Their spatial distribution varies across regions.
2. During the rocky desertification control period (1990–2020), cropland, shrubland, and grassland areas decreased, while forest area increased. Conversion to forest land was the primary change. Landscape fragmentation decreased, and ecological stability improved, laying a foundation for long-term ecological restoration.
3. Future predictions show that Scenario 1 (Ecological Governance) risks food security by overemphasizing ecological restoration, while Scenario 2 (Cultivated Land Protection) may neglect long-term ecological health. Scenario 3 (Coordinated Development) balances cultivated land protection and ecological governance. By 2030, the cropland area will increase by 307.51 km² through conversion, ensuring sustainable land use and harmonious coexistence of ecological protection and agriculture.
In conclusion, rocky desertification control from 1990 to 2020 significantly influenced land-use patterns. Future efforts should prioritize coordinated ecological governance and cultivated land protection, considering multiple factors. This study provides a theoretical basis for local ecosystem management and spatial planning and can serve as a reference for other regions facing similar challenges, contributing to global anti-rocky-desertification and sustainable development efforts.
Data availability statement
The datasets presented in this study can be found in online repositories. The names of the repository/repositories and accession number(s) can be found in the article/supplementary material.
Author contributions
XS: Data curation, Formal analysis, Methodology, Visualization, Writing – original draft. CLS: Data curation, Funding acquisition, Writing – review & editing. ZZC: Conceptualization, Funding acquisition, Project administration, Writing – review & editing.
Funding
The author(s) declare that financial support was received for the research and/or publication of this article. The study was funded by the following grants: Guizhou Province Forestry Science Project, Grant Number: QLKH[2023]10 and Guizhou Provincial Basic Research General Program (Natural Science), Grant Number: zk [2025]639.
Acknowledgments
We are thankful for the valuable comments from the editor and the reviewers for the improvement of the early manuscript draft.
Conflict of interest
The authors declare that the research was conducted in the absence of any commercial or financial relationships that could be construed as a potential conflict of interest.
Generative AI statement
The author(s) declare that no Generative AI was used in the creation of this manuscript.
Publisher’s note
All claims expressed in this article are solely those of the authors and do not necessarily represent those of their affiliated organizations, or those of the publisher, the editors and the reviewers. Any product that may be evaluated in this article, or claim that may be made by its manufacturer, is not guaranteed or endorsed by the publisher.
References
Ahmad A., Nizami S. M. (2015). Carbon stocks of different land uses in the Kumrat valley, Hindu Kush Region of Pakistan. J. Forest. Res. 26, 57–64. doi: 10.1007/s11676-014-0008-6
Belayneh Y., Ru G., Guadie A., Teffera Z. L., Tsega M. (2020). Forest cover change and its driving forces in Fagita Lekoma District, Ethiopia. J. Forest. Res. 31, 1567–1582. doi: 10.1007/s11676-018-0838-8
Bijie Municipal Government (2024). The Overall Plan for Territorial Spatial Development of Bijie, (2021-2035). Bijie City, China: Bijie City Natural resources and planning Bureau.
Cao S., Chen L., Shankman D., Wang C., Wang X., Zhang H. (2011). Excessive reliance on afforestation in China’s arid and semi-arid regions: Lessons in ecological restoration. Earth-Sci. Rev. 104, 240–245. doi: 10.1016/j.earscirev.2010.11.002
Castillo-Figueroa D. (2021). Carbon cycle in tropical upland ecosystems: a global review. Web Ecol. 21, 109–136. doi: 10.5194/we-21-109-2021
Central Committee of the Communist Party of China, and the State Council (2022). No. 1 Central Document for 2022: Call for a Continuous “Comprehensive Promotion of Rural Vitalization”. Beijing, China: People's Publishing House.
Chen M. X., Liu W. D., Lu D. D. (2016). Challenges and the way forward in China’s new-type urbanization. Land Use Policy. 55, 334–339. doi: 10.1016/j.landusepol.2015.07.025
Du Z. R., Yu L., Chen X., Gao B. B., Yang J. Y., Fu H. H., et al. (2023). Land use/cover and land degradation across the Eurasian steppe: Dynamics, patterns and driving factors. Sci. Total Environ. 909. doi: 10.1016/j.scitotenv.2023.168
Feng D. R., Bao W. K., Fu M. C., Zhang M., Sun Y. Y. (2021). Current and future land use characters of a national central city in eco-fragile region-A case study in Xi’an city based on FLUS model. Land 10, 286. doi: 10.3390/land10030286
Feng Y. Y., Wang S. H., Zhao M. S., Zhou L. M. (2022). Monitoring of land desertification changes in urat front banner from 2010 to 2020 based on remote sensing data. Water 14, 11. doi: 10.3390/w14111777
Foley J. A., Defries R., Asner G. P., Barford C., Bonan G., Carpenter S. R., et al. (2005). Global consequences of land use. Science 309, 570–574. doi: 10.1126/science.1111772
Godfray H. C. J., Beddington J. R., Crute I. R., Haddad L., Lawrence D., Muir J. F., et al. (2010). Food security: the challenge of feeding 9 billion people. Science 327, 812–818. doi: 10.1126/science.1185383
Gong W. F., Wang H. B., Wang X. F., Fan W. Y., Stott P. (2017). Effect of terrain on landscape patterns and ecological effects by a gradient-based RS and GIS analysis. J. Forest. Res. 28, 1061–1072. doi: 10.1007/s11676-017-0385-8
Guo B., Yang F., Fan Y. W., Zang W. Q. (2023). The dominant driving factors of rocky desertification and their variations in typical mountainous karst areas of southwest China in the context of global change. Catena 220. doi: 10.1016/j.catena.2022.106674
Herrmann S. M., Hutchinson C. F. (2005). The changing contexts of the desertification debate. J. Arid Environ. 63, 538–555. doi: 10.1016/j.jaridenv.2005.03.003
Jiang Z. C., Lian Y. Q., Qin X. Q. (2014). Rocky desertification in Southwest China: Impacts, causes, and restoration. Earth Sci. Rev. 132, 1–12. doi: 10.1016/j.earscirev.2014.01
Li D. J., Xu D. Y., Wang Z. Y., Ding X., Song A. L. (2018). Ecological compensation for desertification control: A review. J. Geograph. Sci. 28, 367–384. doi: 10.1007/s11442-018-1478-9
Li X., Yeh A. G. O. (2004). Data mining of cellular automata’s transition rules. Int. J. Geograph. Inf. Sci. 18, 723–744. doi: 10.1080/13658810410001705325
Lin J., Li X., Wen Y., He P. (2023). Modeling urban land-use changes using a landscape-driven patch-based cellular automaton (LP-CA). Citie 132, 103906. doi: 10.1016/j.cities.2022.103906
Lin Y. L., Zhao J. S., Chen G. P., Zhang M. (2021). Regional territorial spatial pattern optimization based on MCR-FLUS-Markov model. T. Agricul. Machine. 52, 159–170 + 207.
Liu Q. S., Shi H. S. (2021). Spatiotemporal changes of landscape pattern and ecosystem service value in rocky desertification integrated management area. Land Resour. informat. 4, 53–59.
Mao X. (2022). Effects of ecological restoration project on ecosystem service characteristics and their spatio-temporal evolution in Bijie City. Changsha, China: Central South University of Forestry and Technology. doi: 10.27662/d.cnki.gznlc.2022.000631
Qian C. H., Qiang H. Q., Qin C. Y., Wang Z., Li M. Y. (2022). Spatiotemporal evolution analysis and future scenario prediction of rocky desertification in a subtropical karst region. Remote Sens. 14, 12. doi: 10.3390/rs14020292
Ran C., Bai X. Y., Tan Q., Luo X. L., Chen H., Xi H. P. (2018). Response of rocky desertification landscape pattern to land use change in typical karst areas. Acta Ecol. Sin. 38, 8901–8910.
Ren Y., Liu X. J., Zhang B., Chen X. D. (2023). Sensitivity assessment of land desertification in China based on multi-source remote sensing. Remote Sens. 15, 10. doi: 10.3390/rs15102674
Robert H., Andreas R., Peter B., Fridolin S. B., Simon B., Alexandre B., et al. (2013). Sustainable land use in mountain regions under global change: synthesis across scales and disciplines. Ecol. Soc. 18, 3–36.
Salunkhe S. S., Bera A. K., Rao S. S., Venkatataman V. R., Raj U., Murthy V. N. K. (2018). Evaluation of indicators for desertification risk assessment in part of Thar Desert Region of Rajasthan using geospatial techniques. J. Earth Sys. Sci. 127, 8. doi: 10.1007/s12040-018-1016-2
Sani N. A., Kafaky S. B., Pukkala T., Mataji A. (2016). Integrated use of GIS, remote sensing and multi-criteria decision analysis to assess ecological land suitability in multi-functional forestr. J. Forest. Res. 27, 1127–1135. doi: 10.1007/s11676-016-0242-1
Shu T., Xiong K. N., Chen L. (2022). Change of land use and landscape pattern under the control of rocky desertification. J. Southwest. Agricul. 35, 446–452. doi: 10.16213/j.cnki.scjas.2022.2.027
Song S., Liu Z., He C., Lu W. (2020). Evaluating the effects of urban expansion on natural habitat quality by coupling localized shared socioeconomic pathways and the land use scenario dynamics-urban model. Ecol. Indic. 112, 106071. doi: 10.1016/j.ecolind.2020.106071
Song X. P., Hansen M. C., Stehman S. V., Potapov P. V., Tyukavina A., Vermote E. F., et al. (2018). Global land change from 1982 to 2016. Nature 563, E26. doi: 10.1038/s41586-018-0573-5
Sterling S. M., Ducharne A., Polcher J. (2013). The impact of global land-cover change on the terrestrial water cycle. Nat. Clim. Change. 3, 385–390. doi: 10.1038/nclimate1690
Tang M. M. (2011). Study on rural poverty in Bijie City, Guizhou Province. Beijing, China: Chinese Academy of Agricultural Sciences.
Tang J. M., Di L. P., Rahman M. S., Yu Z. Q. (2019). Spatial-temporal landscape pattern change under rapid urbanization. J. Appl. Remote Sen. 13, 1. doi: 10.1117/1.JRS.13.024503
Tian J., Guo S. L., Liu D. D., Chen Q. H., Wang Q., Yi J. B., et al. (2020). Effects of climate and land use change on runoff in Hanjiang River Basin. Acta Geogr. Sin. 75, 2307–2318.
Tian H. Q., Lu C. Q., Ciais P., Michalak A. M., Canadell J. G., Saikawa E. (2016). The terrestrial biosphere as a net source of greenhouse gases to the atmosphere. Nature 531, 225. doi: 10.1038/nature16946
Tian X. Y., Zhang C., Chen Q. (2022). Effect of land use on landscape pattern evolution of rocky desertification in karst area of Yunnan Province. Forest. res. manage. 01, 61–69. doi: 10.13466/j.cnki.lyzygl.2022.01.008
Turner B. L. I., Skole D. L., Sanderson S., Fischer G., Fresco L., Leemans R. (1995). Land-use and land-cover change. Science/Research plan. Global Change Report (Sweden), Vol. 43. 669–679. Sweden: INTERNATIONAL GEOSPHERE-BIOSPHERE PROGRAMME (IGBP). doi: 10.1177/001872679104401105
Verburg P. H., Neumann K., Nol L. (2011). Challenges in using land use and land cover data for global change studies. Glob. Change Biol. 17, 974–989. doi: 10.1111/j.1365-2486.2010.02307.x
Vliet J., Bregt A. K., Hagen-Zanker A. (2011). Revisiting Kappa to account for change in the accuracy assessment of land-use change models. Ecol. Model. 222, 1367–1375. doi: 10.1016/j.ecolmodel.2011.01.017
Vliet J., Hagen-Zanker A., Hurkens J., Delden H. (2013). A fuzzy set approach to assess the predictive accuracy of land use simulations. Ecol. Model. 261, 32–42. doi: 10.1016/j.ecolmodel.2013.03.019
Wang G. Y., Lin L. S., Cai H. S., Liu M. S., Yan Y. (2008). Analysis of land use spatial pattern change in Dayu County. Jiangxi. J. Agricult. 5, 110–112. doi: 10.19386/j.cnki.jxnyxb.2008.05.039
Wang Z. H., Yin Q. (2011). “Land use and landscape pattern changes in Nanjing during 1988-2007. Vancouver, Canada: IEEE. IEEE International Symposium on Geoscience and Remote Sensing IGARSS, Vancouver, Canada, Jul 24-29, 2011. 680–683. doi: 10.1109/Igarss.2011.6049221
Wu Z. G., Zhu D. Y., Xiong K. N., Wang X. F. (2022). Dynamics of landscape ecological quality based on benefit evaluation coupled with the rocky desertification control in South China Karst. Ecol. Indic. 138. doi: 10.1016/j.ecolind.2022.108
Yan G. Z., Zhang Z., Liang K., Lou H. J. (2017). Characteristics and driving factors of land use change in the Bojiang Lake basin in Ordos Plateau. Chinese. J. Eco-Agricult. 25, 1693–1706. doi: 10.13930/j.cnki.cjea.170012
Yang J., Huang X. (2021). The 30 m annual land cover dataset and its dynamics in China from 1990 to 2019. Earth. Syst. Sci. Data 13, 3907–3925. doi: 10.5194/essd-13-3907-2021
Yang Q. Q., Wang K. L., Zhang C. H., Yue Y. M., Tian R. C., Fan F. D. (2011). Spatio-temporal evolution of rocky desertification and its driving forces in karst areas of Northwestern Guangxi, China. Environ. Earth. Sci. 64, 383–393. doi: 10.1007/s12665-010-0861-3
Yang C. Y., Zhao M., Zhou R. P. (2019). “Study on the Change of Land Use Landscape Pattern Based on GIS in the West Development Zone of Inner Mongolia. Springer. Lecture Notes in Electrical Engineering. Harbin, China: Tianjin Normal Univ. Jul 14-16, 2017, Vol. 463. 729–735. doi: 10.1007/978-981-10-6571-2_89
Yang X., Zheng X. Q., Lv L. N. (2012). A spatiotemporal model of land use change based on ant colony optimization, Markov chain and cellular automata. Ecol. Model. 233, 11–19. doi: 10.1016/j.ecolmodel.2012.03.011
Zhang M. M. (2022). Remote sensing monitoring of rocky desertification in Dafang County, Guizhou Province. Kunming, China: Kunming University of Science and Technology. doi: 10.27200/d.cnki.gkmlu.2022.001783
Zhang Y., Chang X., Liu Y. F., Lu Y. C., Wang Y. H., Liu Y. L. (2021). Urban expansion simulation under constraint of multiple ecosystem services (MESs) based on cellular automata (CA)-Markov model: Scenario analysis and policy implications. Land Use Policy 108. doi: 10.1016/j.landusepol.2021.105667
Zhang P. P., Hu Y. M., Xiao D. N., Li X. Z., Yin J., She H. (2010). Rocky desertification risk zone delineation in Karst plateau area: A case study in Puding County, Guizhou Province. Chin. Geograph. Sci. 20, 84–90. doi: 10.1007/s11769-010-0084-2
Zhao L., Peng Z. R. (2012). LandSys: an agent-based cellular automata model of land use change developed for transportation analysis. J. Transp. Geogr. 25, 35–49. doi: 10.1016/j.jtrangeo.2012.07.006
Zhou Q. (2024). Simulation and prediction of land use change based on FLUS model: A case study of Yongshou County. Xi 'an, China: Chang'an University. doi: 10.26976/d.cnki.gchau.2021.002268
Zou K., Tian J., Zhang Y. (2025). Impacts of cultivated land protection practices on farmers’ welfare: A dual quality and ecology perspective. Environ. Impact Assess. Rev. 110, 107690. doi: 10.1016/j.eiar.2024.107690
Zuo T. A. (2014). Study on poverty effect of rocky desertification in southwest karst mountainous area. Chongqing City, China: Southwest University.
Keywords: rocky desertification, spatial pattern, land-use change, prediction, cropland protection
Citation: Sang X, Sun C and Chai Z (2025) Dynamic changes and prediction of land-use patterns in a typical area for rocky desertification control. Front. Ecol. Evol. 13:1542799. doi: 10.3389/fevo.2025.1542799
Received: 10 December 2024; Accepted: 24 February 2025;
Published: 13 March 2025.
Edited by:
Mauro Fois, University of Cagliari, ItalyReviewed by:
Miguel Alfonso Ortega-Huerta, National Autonomous University of Mexico, MexicoKrzysztof Ostafin, Jagiellonian University, Poland
Huiqing Han, Guizhou Institute of Technology, China
Copyright © 2025 Sang, Sun and Chai. This is an open-access article distributed under the terms of the Creative Commons Attribution License (CC BY). The use, distribution or reproduction in other forums is permitted, provided the original author(s) and the copyright owner(s) are credited and that the original publication in this journal is cited, in accordance with accepted academic practice. No use, distribution or reproduction is permitted which does not comply with these terms.
*Correspondence: Zongzheng Chai, Y2hhaXp6QDEyNi5jb20=