 Shuang Zhao1
 Wei Liu
94% of researchers rate our articles as excellent or good
Learn more about the work of our research integrity team to safeguard the quality of each article we publish.
Find out more
ORIGINAL RESEARCH article
Front. Ecol. Evol., 27 March 2025
Sec. Urban Ecology
Volume 13 - 2025 | https://doi.org/10.3389/fevo.2025.1539909
This article is part of the Research TopicExtended Mind for the Design of Human EnvironmentView all 11 articles
In the context of the “dual-carbon” goal, studying the complex relationship between carbon emissions and ecosystem service values brought about by land-use change is of great significance in promoting regional low-carbon optimization, territorial spatial governance, and the achievement of the goal of carbon peaking and carbon neutrality. This study takes 286 cities in China as the research object, and based on the data of China’s land use and ecosystem service value (ESV) from 2012 to 2022, adopts geo-spatial analysis techniques such as spatial autocorrelation and geographically-weighted regression models to study the spatial and temporal characteristics, the degree of coupling coordination, and the influencing factors of China’s municipal total land use carbon emissions and ESV. The results show that (1) China’s total land-use carbon emissions have exhibited an overall increasing trend from 2012 to 2022. The total ESV has shown a downward trend characterized by an inverted “N” shape. (2) The coupling coordination effect between land-use carbon emissions and ESV in China generally shows a mirrored “L” growth shape. (3) There is a significant spatial negative correlation between land-use carbon emissions and ESV, primarily manifested as “high-high,” “high-low,” and “low-low” clustering characteristics. (4) Three socio-economic factors—local fiscal general budget expenditure, energy utilization efficiency, and total population—positively influence the coupling coordination of land-use carbon emissions and ESV. Strictly controlling the local fiscal general budget expenditure, energy utilization efficiency, and total population can effectively promote China's green, low-carbon development and ecological security.
Land serves as a carrier for various ecosystems, and human activities on land significantly impact surface land cover conditions, driving changes in the capacity of ecosystems to provide services (Xiong et al., 2018). Under global warming, carbon reduction has become a critical global issue (Chuai et al., 2015; Ding et al., 2022; Li et al., 2024; Liu B. et al., 2024). With the rapid development of industrialization and urbanization, land use changes have been drastic, and the problems of irrational land use, uncoordinated industrial structure, and low awareness of emission reduction have become increasingly prominent (Su et al., 2024). The carbon emission carrying capacity of urban construction land occupies an important position in China’s urban environment, and the carbon emission carrying capacity of China’s urban construction land exceeds 70% of total carbon emissions, making it the country with the highest carbon emissions in the world (He et al., 2018). To mitigate carbon emissions and global warming, China has developed various environmental policies and implemented effective measures (Ding et al., 2024; Wu et al., 2016, 2024). In particular, following the announcement of China’s “dual carbon” goals in September 2020, a series of climate change mitigation policies were introduced, emphasizing the need to continuously strengthen and enhance the carbon sink capacity of ecosystems. There is an essential correlation between ecosystems and carbon emissions. Therefore, in the dual context of carbon emission reduction policy and improvement of the ecological environment, it is of great significance to study the pattern of the spatial relationship between the two to solve the difficult problem of maintaining economic growth while taking into account the ecological environment in the process of social development.
China’s rapid economic development has resulted in radical changes in land use patterns in recent years. Changes in land use have contributed to the rapid growth of carbon emissions, including both direct carbon emissions, which are caused by the direct participation of arable land, forest land, grassland, watersheds, and unutilized land in social production, and indirect carbon emissions, which are caused by the action of human production activities on the land on which the land is constructed (Goldewijk and Ramankutty, 2004) (Figure 1). To more intuitively identify the differences in land type structure and development levels within the research areas, many scholars have also conducted studies on the efficiency (Feng et al., 2023) and intensity (Li et al., 2023) of land-use carbon emissions. In foundational research on land-use carbon emission accounting, methods such as the emission factor method (Peng et al., 2016), factor decomposition method (Zhang and Xu, 2017), and remote sensing estimation method (Mo and Wang, 2021) are commonly used. The various benefits and wellbeing that humans obtain from natural ecosystems during production and daily life are referred to as ecosystem services value (ESV), which include both tangible material product supply that can be directly perceived and intangible service provision (Li et al., 2022; Sun and Li, 2017). Economic value is typically used to evaluate ecosystem services to determine the benefits humans derive from nature, allowing for comparability across different regions. Research on ecosystem service values originated in the 1960s and gained momentum in the late 1990s with the publication of studies by scholars such as Costanza et al. (1997). Currently, the main methods used to calculate ESV under land use changes include the equivalence factor method, benefit transfer method, and ESV index method. Research primarily focuses on the temporal and spatial patterns of ESV (Chen et al., 2019; Yuan et al., 2019), simulation predictions (Akhtar et al., 2020), trade-offs and synergies between ESV (Liu et al., 2021), and temporal and spatial correlations of ESV (Zhao et al., 2023).
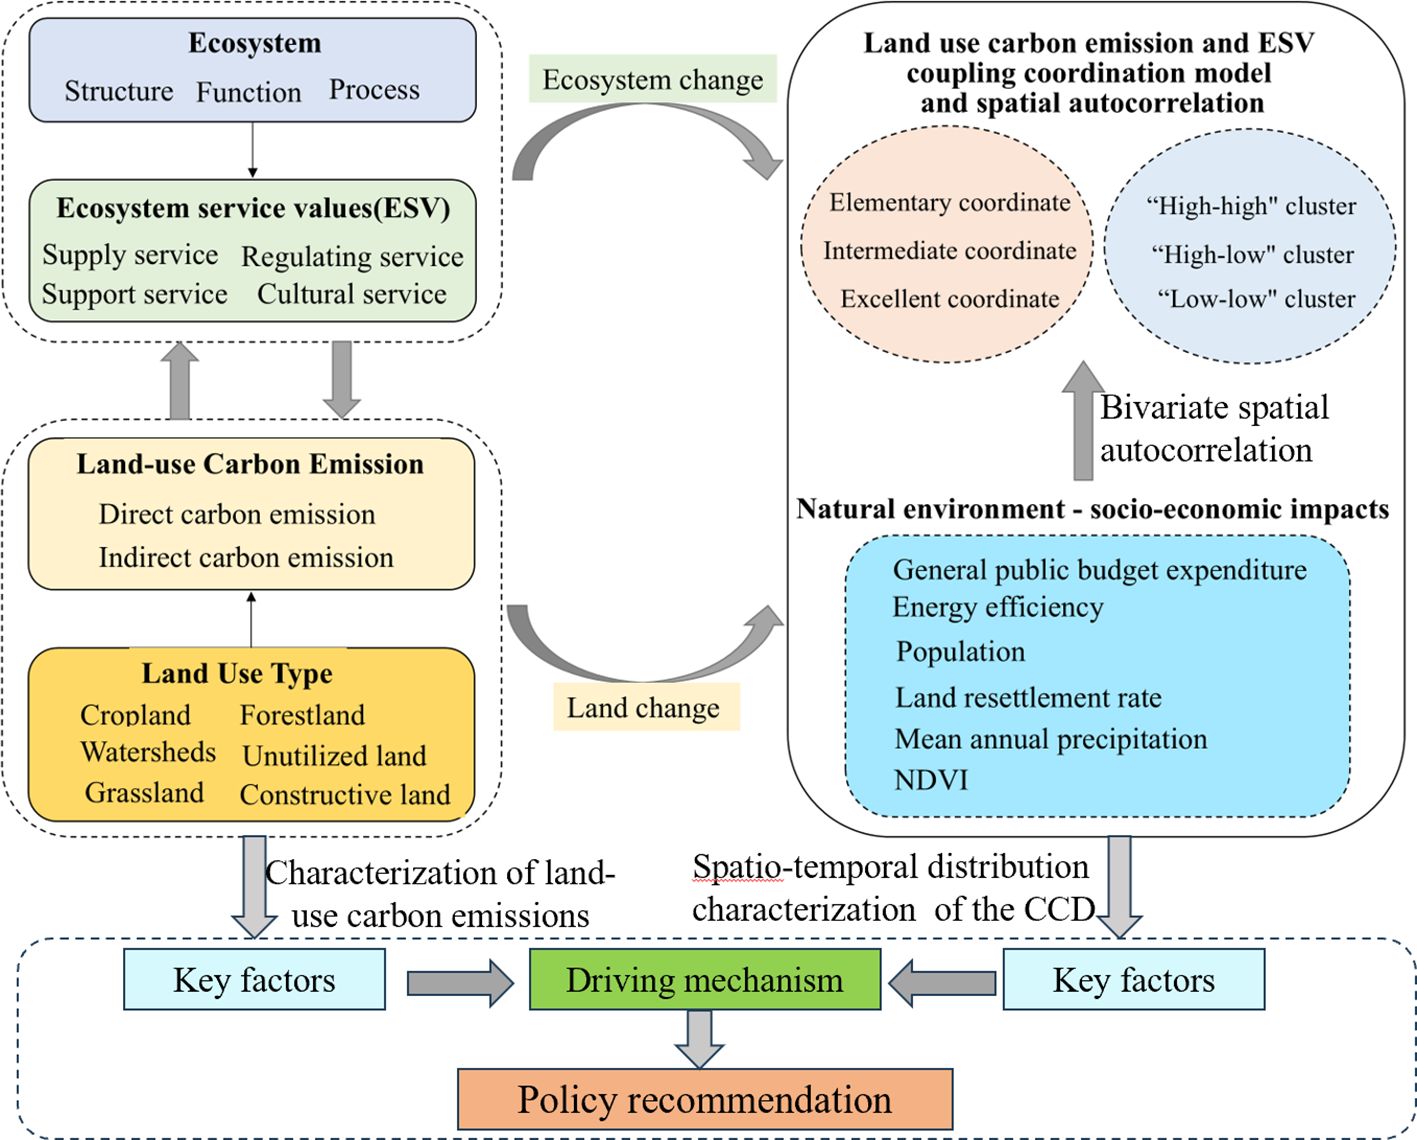
Figure 1. Theoretical framework diagram.
Since the 1990s, on the one hand, scholars at home and abroad have centered on the issue of land-use carbon emissions from different scales such as national, provincial, urban, and regional (Lin et al., 2021; Rong et al., 2022; Xu et al., 2018; Zhou et al., 2019) and analyses of the measurement of carbon emissions (Dai et al., 2024; Lin et al., 2024; Liu D. et al., 2024), the decoupling effect of carbon emissions and economic growth (Xiao et al., 2022), the mechanistic dissection of carbon emissions from single land classes (Ma et al., 2020), the influencing factors (Dong et al., 2018), the relationship between land class changes and carbon sources/sinks (Xi et al., 2016), and the spatial differences and correlations of carbon emissions (Yu et al., 2022), and other perspectives have been carried out in a large number of studies. On the other hand, scholars have also conducted many studies to assess the fluctuation of ESV due to land use changes (Chen et al., 2020; Zhao et al., 2023), such as the spatial and temporal characteristics of ESV and land use (Song and Deng, 2017), and the interaction relationship (Arowolo et al., 2018). In summary, it can be seen that previous studies have been carried out on the two individually from different perspectives and scales, but there are fewer studies on the spatial relationship between land-use carbon emissions and ESV (Zhang et al., 2024; Zhou et al., 2024). Understanding the homogeneity and heterogeneity of the spatial distributions of ecosystem services and land-use carbon emissions and examining the mechanisms influencing their spatial interactions can reveal the spatial effects of ecological and geographical processes at the county scale, which is crucial for formulating ecologically oriented land-use policies.
In summary, based on the relevant data at the municipal scale in China from 2012 to 2022, this study explores the coupled and coordinated relationship between land-use carbon emissions and ESV and their spatial and temporal evolution characteristics using the coupled coordination degree model based on the quantitative measurement of land-use carbon emissions and ESV. At the same time, the geographically weighted regression model is used to identify the main factors affecting the coupled and coordinated development of land-use carbon emissions and ESV to provide support for China to propose carbon emission reduction policies, establish a low-carbon land use structure, and strive to improve the overall quality of the ecological environment to move towards the path of green and low-carbon development. The innovativeness of this paper is mainly reflected in the following two aspects: first, it summarizes the spatio-temporal evolution characteristics and influence mechanism of inter-municipal land-use carbon emissions and ecosystem services in China; second, it introduces land-use carbon emissions and ecosystem services into the study of coordinated development of the ecological environment, which more scientifically and objectively measures the functional services provided by the ecological environment to human society and promotes empirical research on the coordinated development of the two. The theoretical framework diagram is shown in Figure 1.
The uniqueness of China as a research case is mainly reflected in the following aspects. First, China is located in the eastern part of the Asia-Europe continent, on the west coast of the Pacific Ocean. It has a vast territory with a total land area of approximately 9.6 million km2. The terrain is generally high in the west and low in the east, with three significant steps according to the difference in altitude, and the geomorphology is diversified, with mountains, highlands, basins, hills, and plains. China has a variety of landforms, including mountains, plateaus, basins, hills, and plains, and is rich in natural resources (Lv et al., 2017). Second, China has large-scale backbone enterprises such as petroleum, iron, steel, electric power, coal, and building materials. The energy-consuming industries that drive economic development have also led to a significant increase in China’s energy consumption from 3.62 billion tons of standard coal in 2012 to 5.41 billion tons of standard coal in 2022. China’s significant land use and energy consumption changes significantly impact the total regional CO2 emissions and patterns (Tang et al., 2022). Therefore, this study takes China as the study area and is conducted at the municipal level. Data from 286 prefecture-level cities were selected as the study sample because some cities had important missing data and were excluded. The study area is shown in Figure 2.
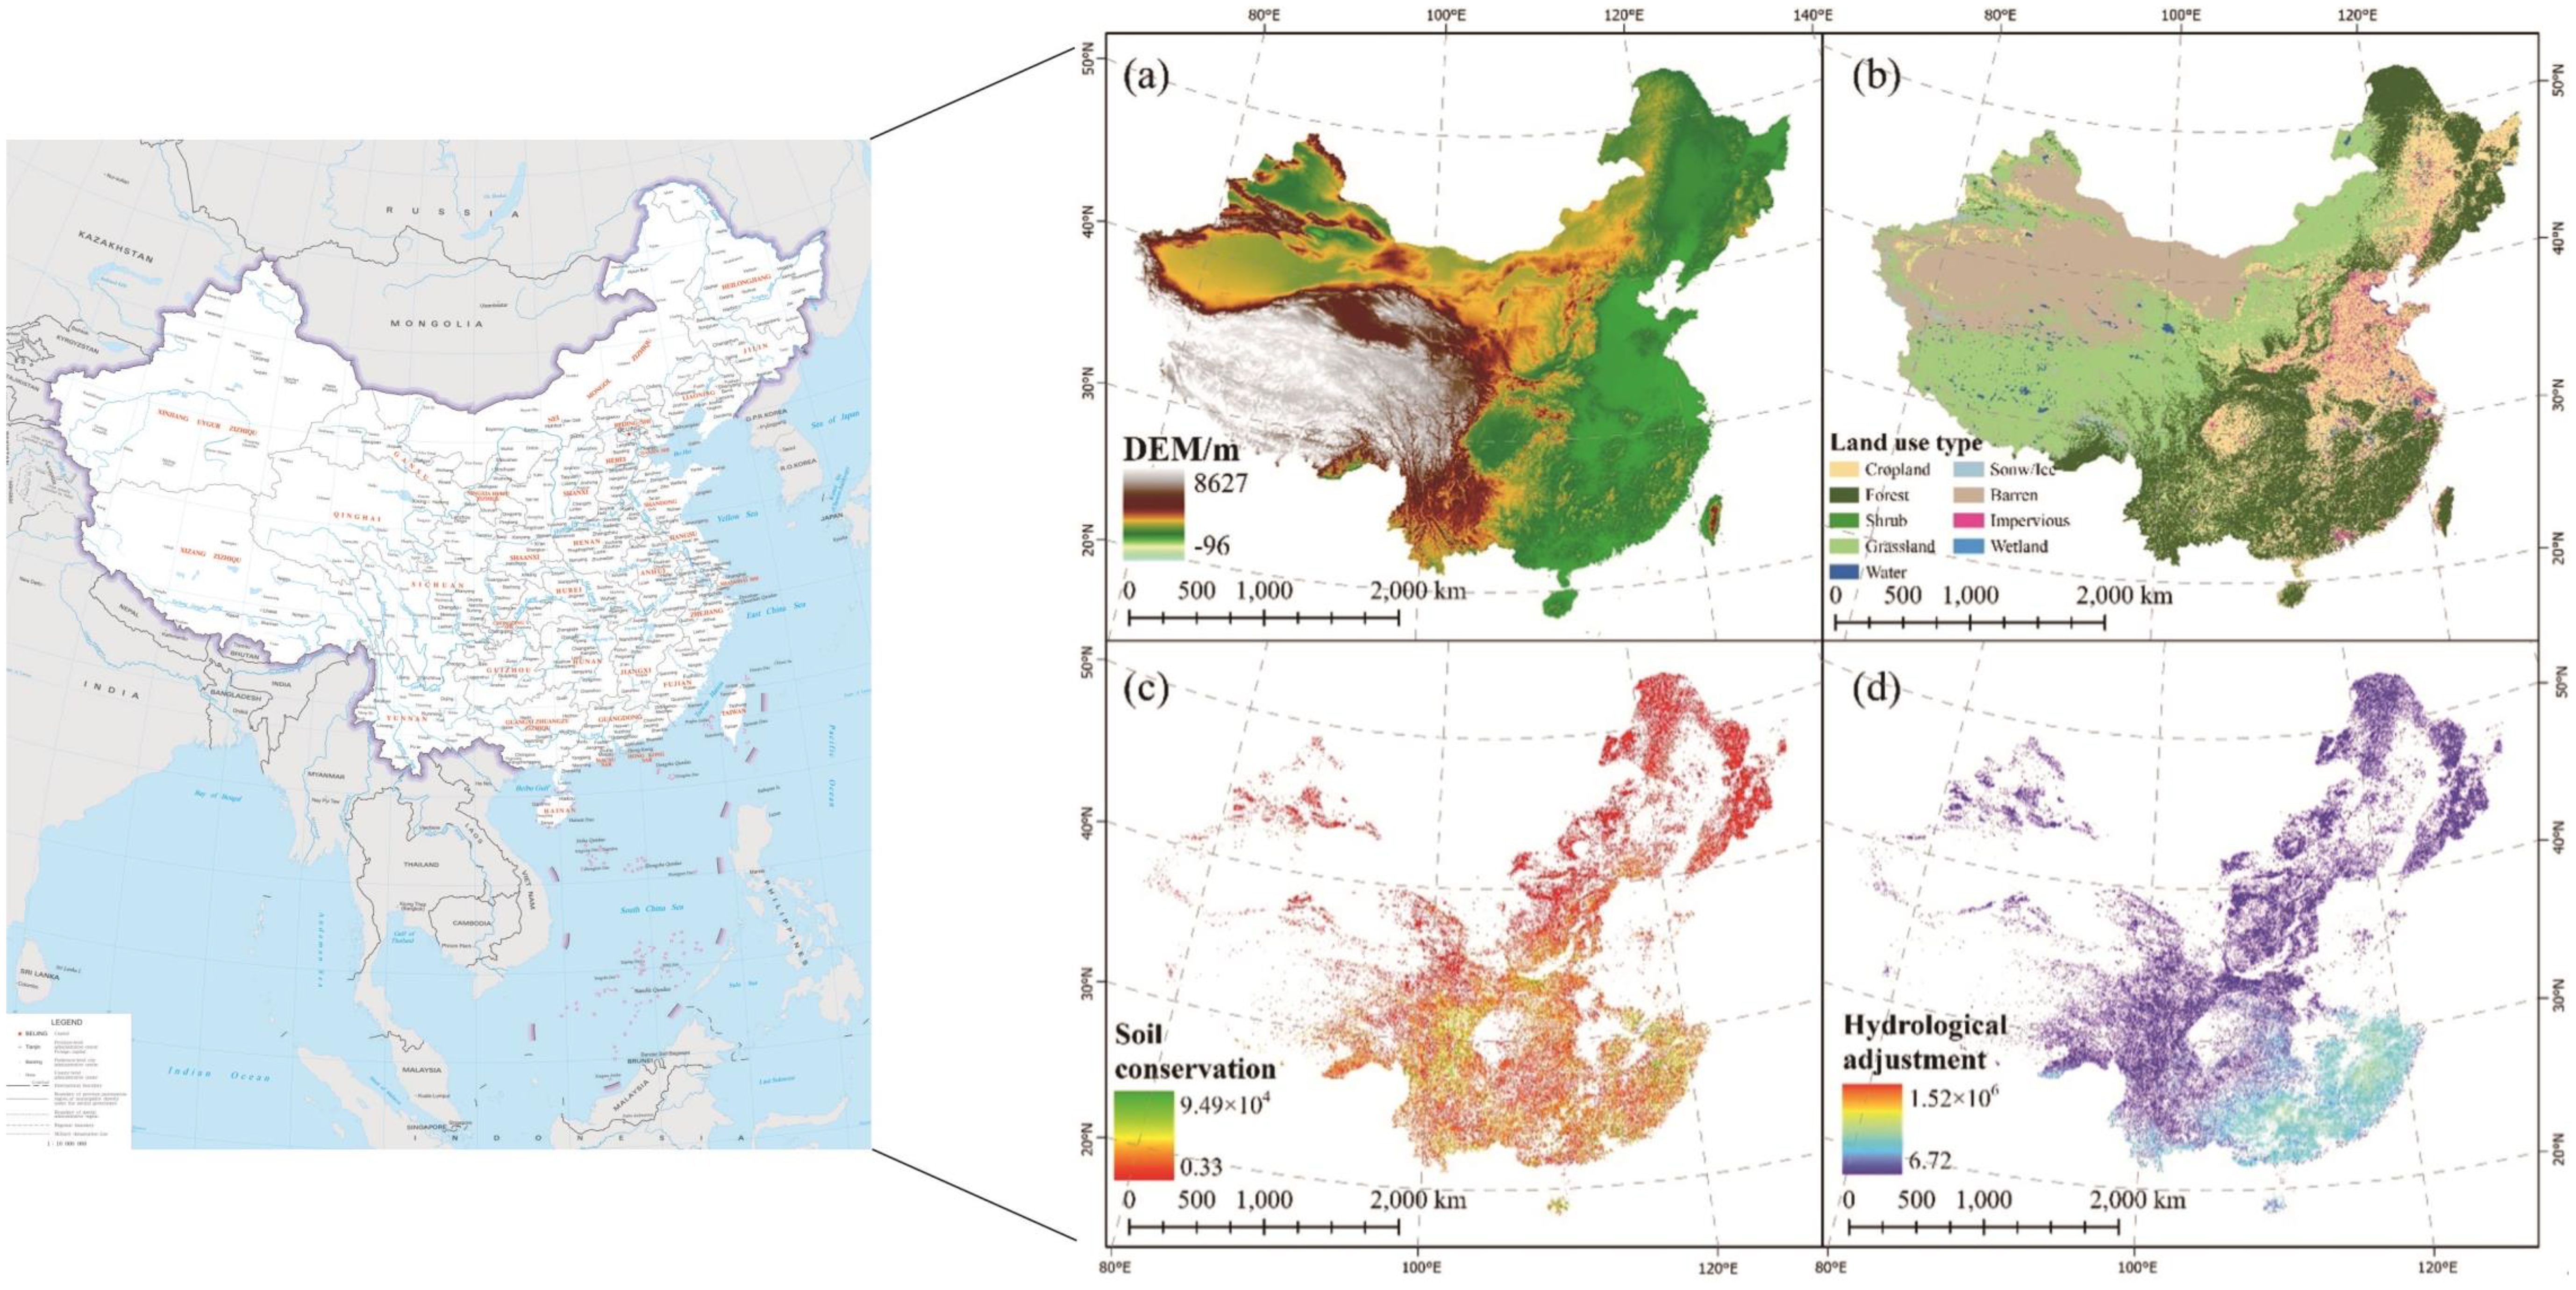
Figure 2. Location maps of the study area (Revision No. GS(2022)4316): (a) elevation map; (b) land use map in 2023; (c, d) ecosystem service value map.
The data for this study include land use, energy consumption, socio-economic, and driving factor data; the specific contents and sources are shown in Table 1. The land use data are obtained from the China Land Science Data Center (MNR), with a resolution of 30 m. Based on the land use classification standards of the Chinese Academy of Sciences (CAS), the land classes in the study area were classified into six first-level types, which are, in order, cropland, forest land, grassland, watersheds, construction land, and unutilized land. The average annual precipitation and Normalized Difference Vegetation Index (NDVI) were obtained from the Resource Environment Science and Data Centre of the Chinese Academy of Sciences. The energy consumption and socioeconomic data were obtained from the corresponding years of China Energy Statistical Yearbook, Statistical Yearbook, and National Compendium of Cost and Benefit Information of Agricultural Products, respectively. Linear interpolation was used to complete the missing values.
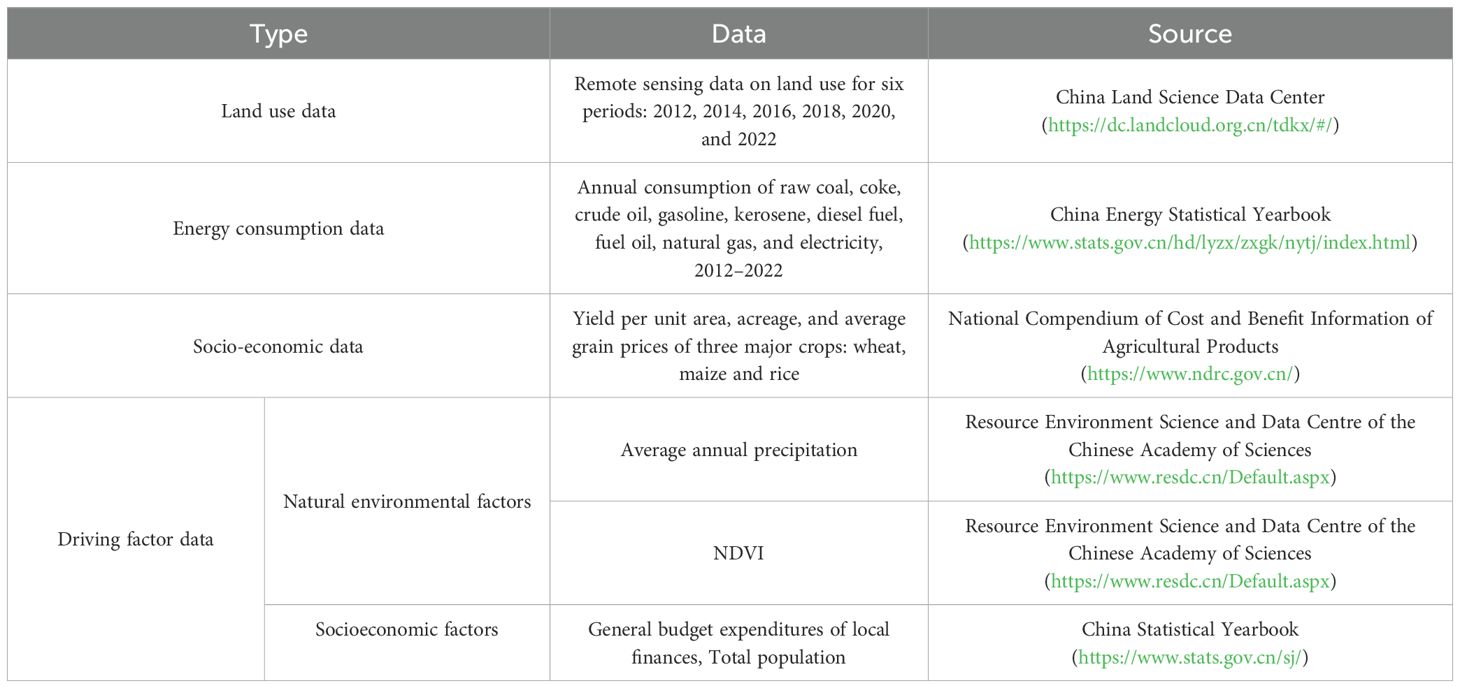
Table 1. List of data used, along with their main characteristics and sources.
In this study, we refer to relevant studies on ESV assessment (Yin et al., 2023; Yang et al., 2022). This study classifies ecosystem services into four categories: provisioning services, regulating services, supporting services, and cultural services. Among them, provisioning services refer to ecosystems that provide natural resources to meet the spatial and material needs for human survival and development, including food production, raw material production, and water supply; regulating services refer to ecosystems’ function of regulating the natural environment, including climate regulation and hydrological regulation; supporting services are the basis of other ecosystem service functions, including gas regulation, climate regulation, environment purification, and hydrological regulation; cultural services refer to the non-material benefits of ecosystems such as places, inspiration, and spiritual enjoyment from human cultural activities. These include soil conservation, maintenance of nutrient cycles, biodiversity, and aesthetic landscapes.
Based on the China Statistical Yearbook and the China Agricultural Product Price Survey Yearbook for 2012-2022 and other information and reference to relevant studies, this study uses the unit area production, planted area, and average grain prices of three major crops, namely wheat, corn, and rice, as basic data. The exchange rate of this study refers to the data released by the State Administration of Foreign Exchange (SAFE) (http://www.safe.gov.cn/), and the economic value of one standard unit equivalent factor in the study area was calculated as 161.59 US$·hm−1 a−1 by Equation 1, from which the ESV equivalent table per unit area was calculated. Then, the total ESV for 2012–2022 was calculated using Equation 2. Since the construction land has lost its basic ecosystem service function, this land type is not accounted for in this study.
where Ec is the economic value of the function of providing production services per unit area in the farmland ecosystem, i is the type of crop, Pi is the average price of food crop i over the period 2012–2022 ($/kg), qi is the yields of the ith food crop, M is the area planted with food crops, and n is the type of food crop.
where ESV represents the total ESV in the study area, Ak represents the area of the seeded land type, and VCk is the ESV of the kth land type.
In this study, the direct carbon emissions of different land use types are estimated based on the area of different land use types in each of China’s cities from 2012 to 2022. The calculation method is to multiply the area of different types of land use and the corresponding carbon emission factors and then sum them up with Equation 3:
where EK denotes the total direct carbon emissions, ei denotes the total carbon emissions of different site types i, and and denote the area and carbon emission coefficients of different site types i, respectively (Table 2).

Table 2. Carbon emission factors for various land use types.
Since the carbon emissions from construction land are the main carbon source, the carbon emissions from construction land were indirectly estimated based on the panel data of China’s fossil energy consumption from 2012 to 2022 using the carbon emission coefficient method (Cao et al., 2022; Fan et al., 2018). The nine types of energy consumption selected were raw coal, coke, crude oil, gasoline, kerosene, diesel fuel, fuel oil, natural gas, and electricity, which were estimated by combining the energy consumption data, standard coal conversion coefficients, and carbon emission coefficients (Table 3). Total carbon emissions are the sum of direct and indirect carbon emissions (Lin et al., 2024).
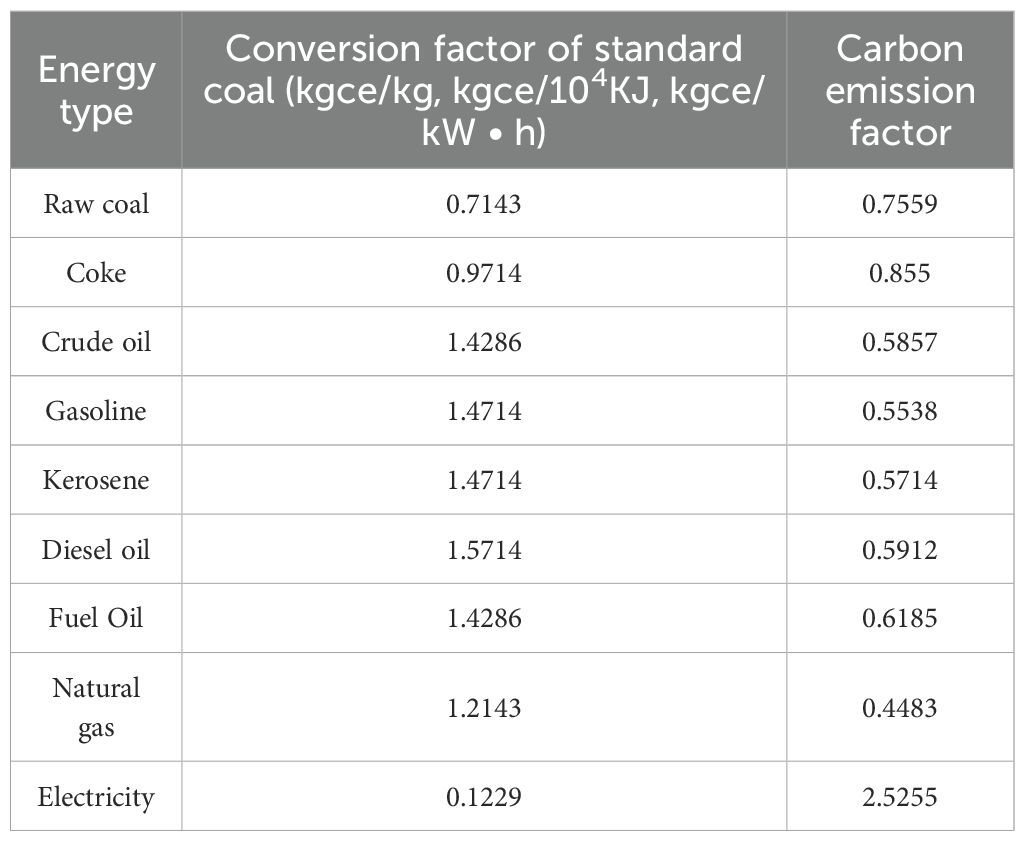
Table 3. Standard coal conversion factors and carbon emission factors for various energy sources.
The coupled coordination degree model of ESV and land-use carbon emissions in China was constructed to quantify the coordination between the two systems (Yu et al., 2024) using Equation 4:
where D is the degree of coupling coordination, the value range is 0–1, and a larger value indicates that the coordination effect between the systems is better. U2 is the standardized ESV index. and are the coefficients to be determined. Since this study considers ESV and land-use carbon emissions as two systems of equal importance, it is taken as . Combined with the existing research results, the coupling coordination degree is divided into the following types (Table 4).
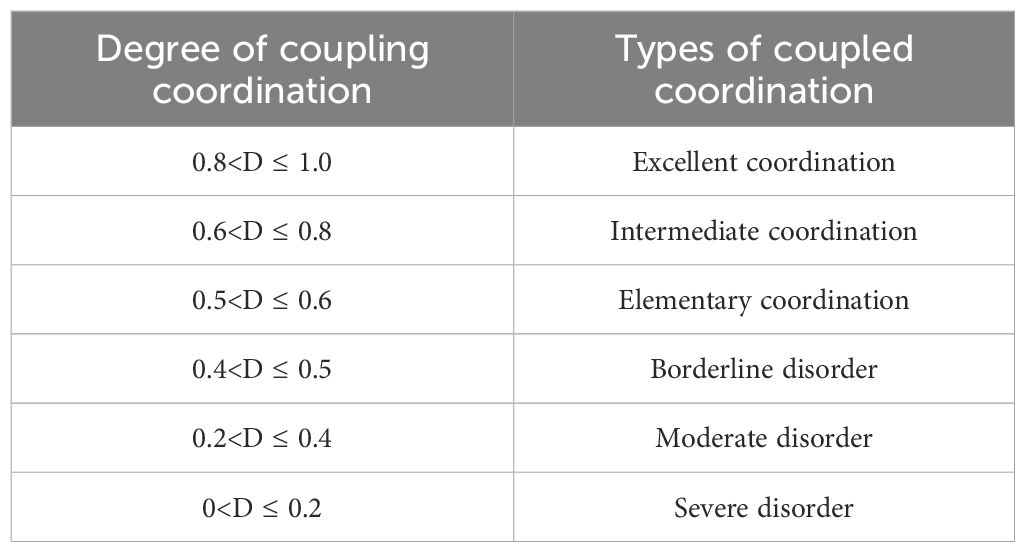
Table 4. Classification of coupling coordination types.
Spatial autocorrelation can be used to reveal the aggregation characteristics of spatial elements, which are divided into global spatial autocorrelation and local spatial autocorrelation, and the degree of its correlation is characterized by Moran’s I. In 1995, Anselin (1995) proposed bivariate spatial autocorrelation, which reveals the spatial correlation of spatial variables with domain variables. Among them, the global spatial autocorrelation is able to analyze the degree of aggregation between spatial parcels with Equation 5:
Local spatial autocorrelation can measure the correlation of individual spatial parcels, and the Z-score-based LISA map can clearly and unambiguously express the characteristics of local spatial changes with Equation 6:
where I and Ii denote the global bivariate Moran’s I and the local bivariate Moran’s Ii for land-use carbon emissions and ESV, respectively. Yi, Yj is the value of the ith, jth region; and S2 denote the mean and the variance, respectively; Wij is the element of the spatial-geographic distance weighting matrix; and n is the number of cells.
Ordinary least squares (OLS) is a parameter evaluation method commonly used in linear regression models for parameter estimation and fitting prediction. It is based on the assumption of linear regression relationships, thus generating unique regression equations matching all variables. Equation 7 is as follows:
where is the dependent variable; is the independent variable; is the coefficient to be estimated, reflecting the linear correlation between y and x, where denotes the intercept constant; is the correlation coefficient of each influencing factor of with the degree of coordination of the coupling of ESV and land-use carbon emissions; and is the error term.
The geographically weighted regression model can visualize the heterogeneous characteristics of the spatial relationship and clarify the driving mechanism of different factors on the coordination degree of the coupling of ESV and land-use carbon emissions in China. Equation 8 is as follows:
where is the dependent variable of variable i and is the coupled coordination degree of ESV and land use carbon emissions; is the observed value of the kth variable at the ith sample point; is the geospatial coordinate of sample point i; is the constant term of the regression; is the regression parameter of the kth variable at the ith sample point; and is the error term.
The change in land-use carbon emissions in the study area is influenced by land type and land use degree. In terms of the total amount, the carbon emission capacity from 2012 to 2022 shows a stable growth trend from 246,259.605×104t to 328,413.301×104t, with an average annual growth rate of 3.34%, and the growth rate of the total amount of land-use carbon emission is characterized as “slow and then fast” (Figure 3; Table 5). Specifically, carbon emissions from construction land use grow rapidly, from 250,982.136×104t in 2012 to 333,243.693×104t in 2022, with the growth rate characterized as “slow and then fast”, which is due to the substantial increase in the urbanization level in the study area, accompanied by a large amount of energy consumption and an increase in construction land use. This is due to the substantial increase in urbanization level in the study area, accompanied by a large amount of energy consumption and the increase of construction land; the carbon emission of cropland shows a slow decreasing trend due to the reduction of its own area, decreasing from 7,105.086 × 104t in 2012 to 7,048.593 × 104t in 2022, with an average annual decrease rate of 0.08%; the carbon absorption of grasslands and waters continues to decline after 2014, the unused land basically remains unchanged, and the forest land fluctuates more obviously, showing a decrease in carbon absorption.
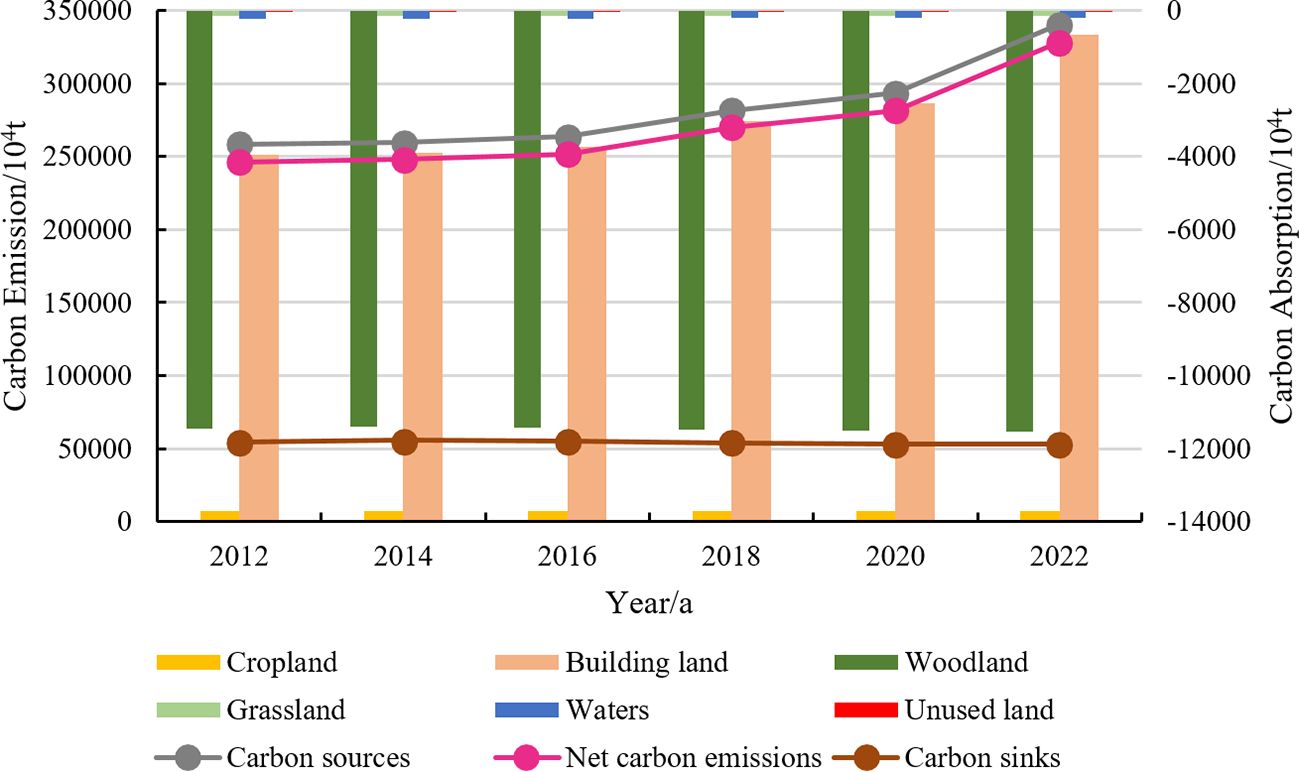
Figure 3. Trends in land-use carbon emissions in China, 2012–2022.

Table 5. Accounting results of land-use carbon emissions in China (Unit:104/t).
Analyzing the composition of carbon sources/sinks, in terms of carbon sources, carbon emissions from construction land is the most important source of carbon, accounting for 97.24% to 97.93% of the total amount of carbon sources and showing a trend of growth year by year. Meanwhile, cropland, as one of the carbon sources, has a low carbon emission contribution rate but a higher area share. As for carbon sinks, the contribution rates of watershed and grassland to carbon absorption are comparable, and the sum of the two accounts for 2.84%–3.08% of the total carbon sink; the contribution rate of forest land to carbon absorption is the largest, accounting for 96.82%–97.06% of the total carbon sink, which indicates that the forest land has a vital carbon sinking capacity; in addition, the unutilized land has the smallest amount of carbon absorption. Since there is a huge difference between the amount of carbon sources and carbon sinks, future work will focus on controlling carbon sources and increasing carbon sinks.
The natural breakpoint method was used to classify the land-use carbon emissions of each city in the study time series into five levels. Namely, a high-level zone, higher-level zone, medium-level zone, lower-level zone, and low-level zone, and six cross-sections in 2012, 2014, 2016, 2018, 2020, and 2022 were selected to draw a map of the distributional characteristics of land-use carbon emissions in China (Figure 4). The results show that the low values of inter-municipal land-use carbon emissions during the 10 years are stably distributed in the outer edge of the first step of China’s terrain and the middle and lower reaches of the Yangtze River, with a few located in the northeast. With the increasing level of urbanization and the continuous increase in energy development intensity, the high-value areas begin to gather in large areas in energy-rich regions of Shanxi and Inner Mongolia, such as Taiyuan, Yuncheng, and Hohhot. The percentage of cities with total carbon emissions higher than 1500 × 104t rises from 16.78% in 2012 to 23.43% in 2022, and the carbon emissions of the entire municipal area of Shanxi in 2022 reach 2180 ×104t or more. The number of cities with carbon emissions lower than 200×104t decreased from 32 to 23, mainly in Sichuan, Gansu, Yunnan, and other provinces with large forested and mountainous areas. The lowest value of carbon emissions during the 10 years is located in Yichun City, Heilongjiang Province, with an average annual carbon emission of 51.45×10⁴t.
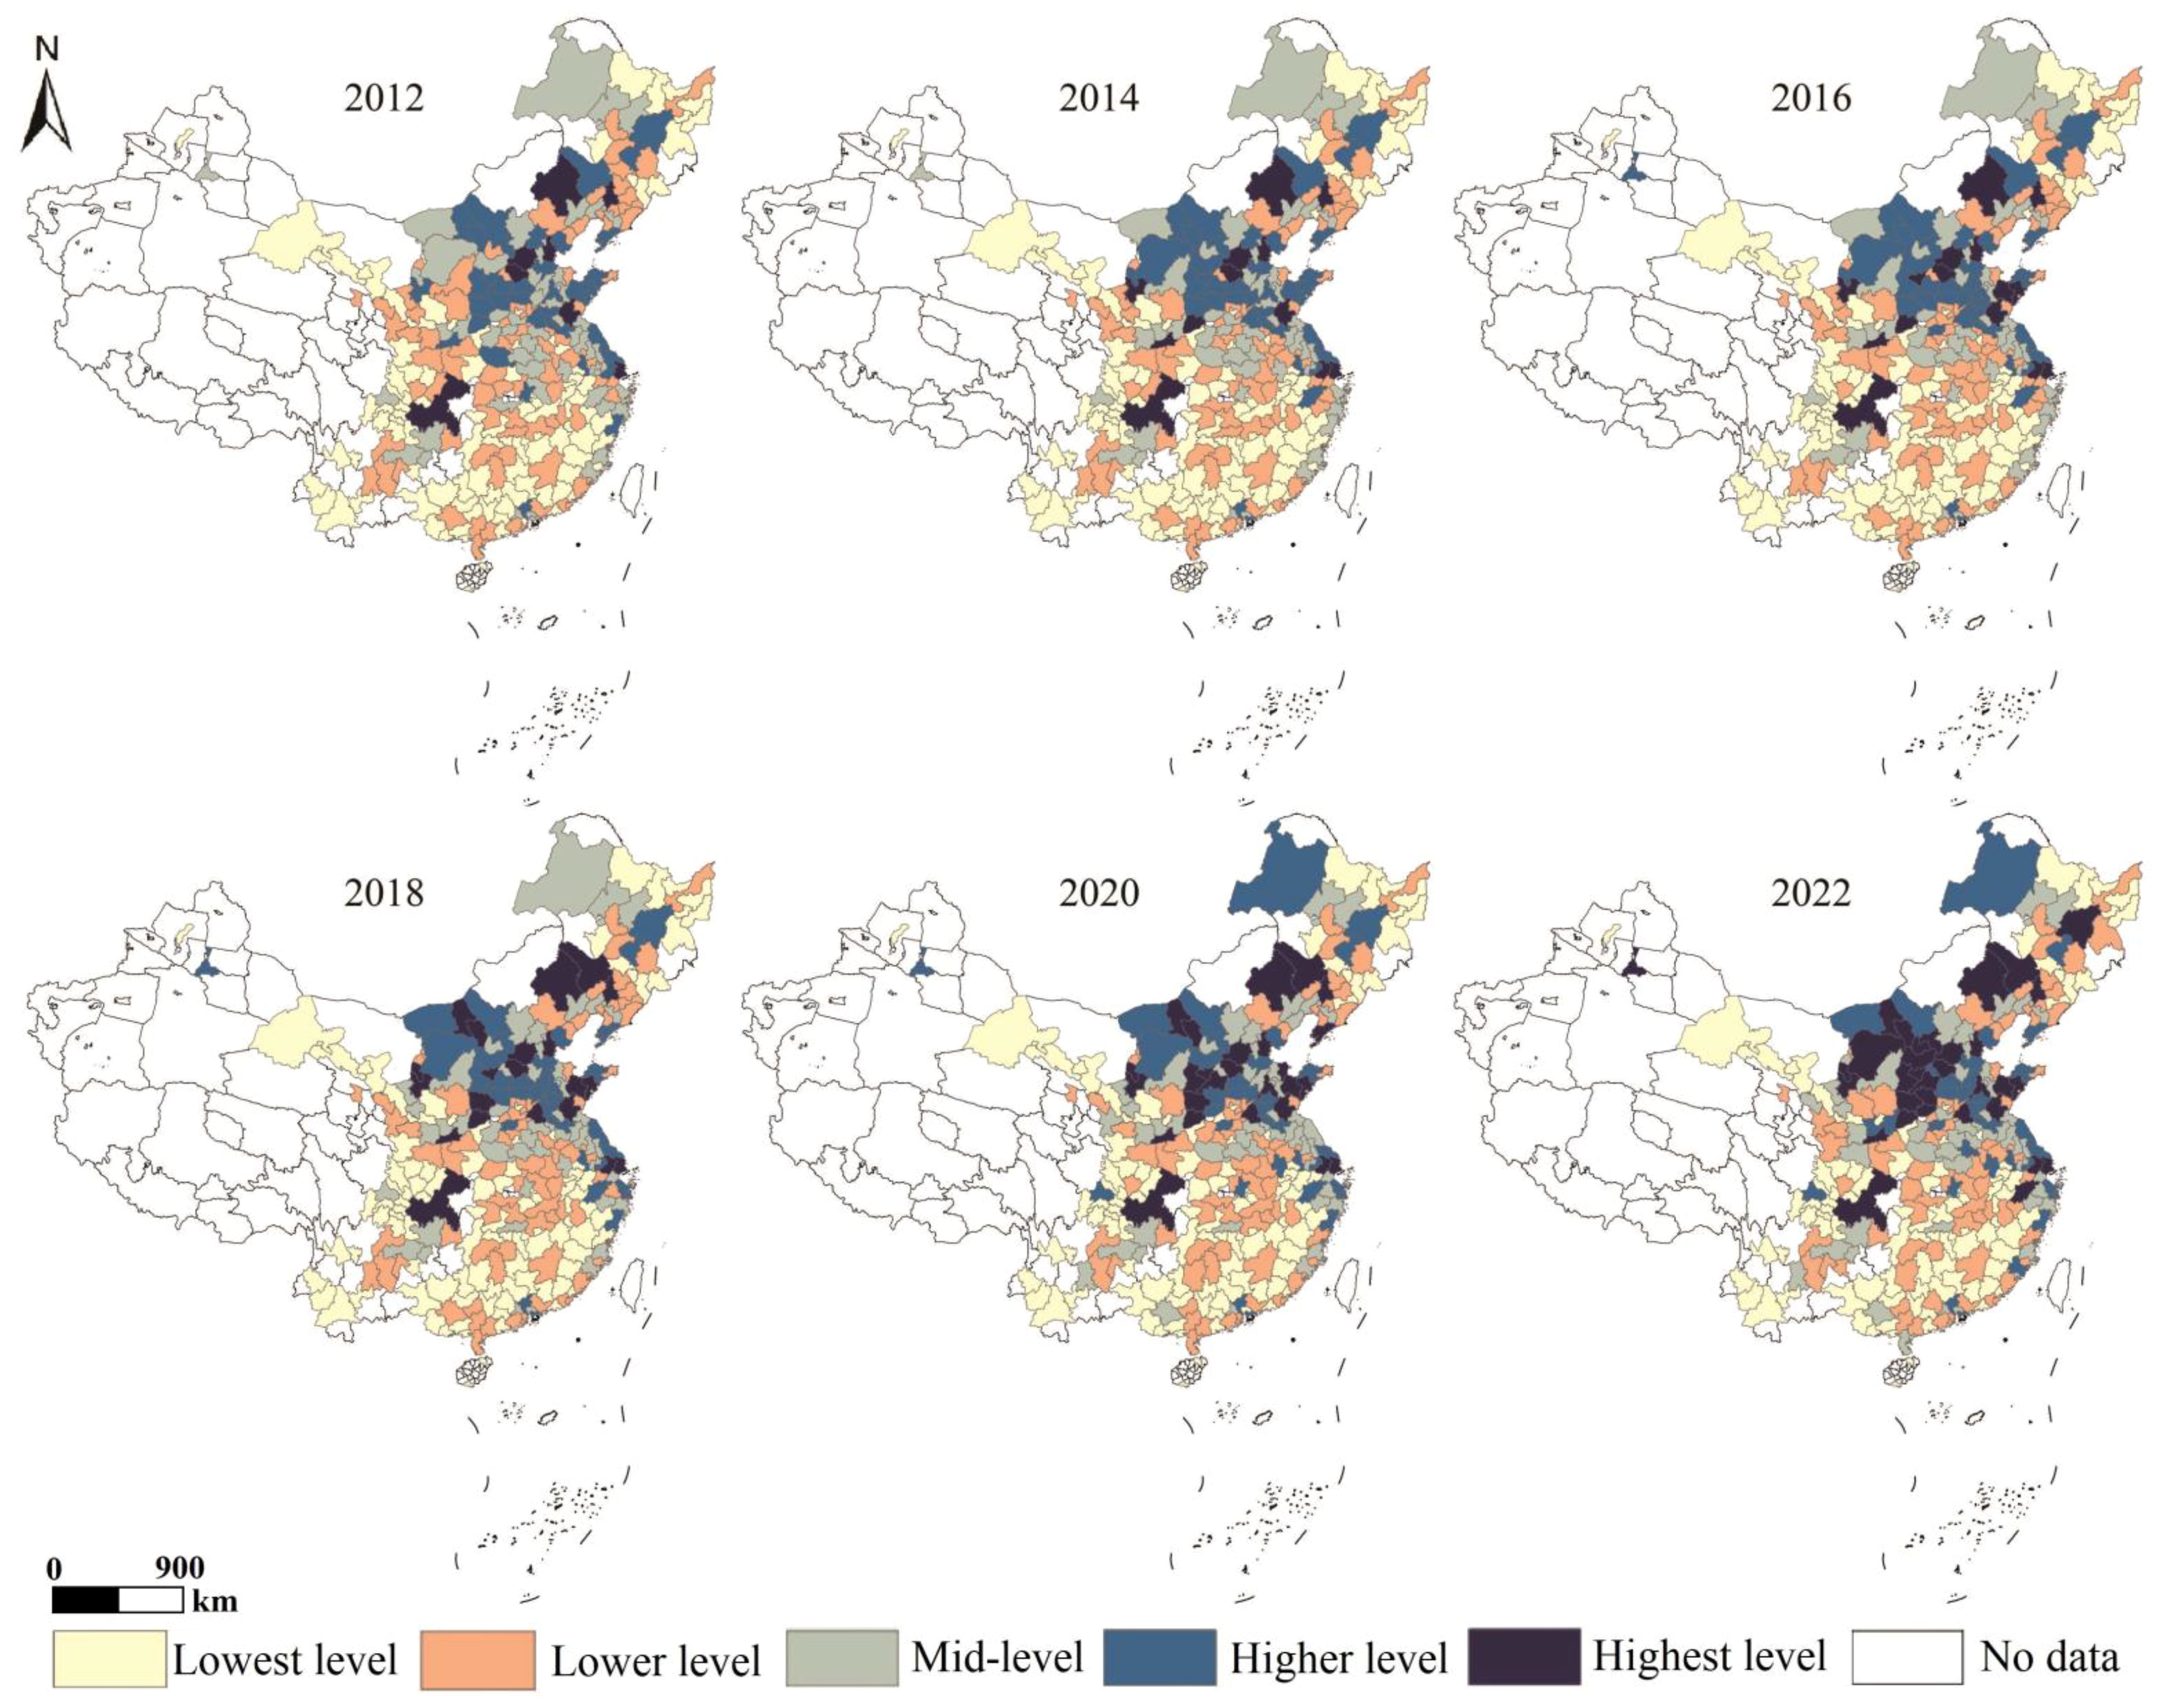
Figure 4. Spatial distribution of land-use carbon emission levels in China, 2012–2022.
This study measured ESV based on a table of ESV equivalents per unit area (Table 6). The results showed that from 2012 to 2022, China’s ESV exhibited a fluctuating downward trend, decreasing from 16538.28 billion dollars in 2012 to 16072.91 billion dollars in 2022, representing a total decrease of 465.37 billion dollars, with an average annual reduction of 46.54 billion dollars (Figure 5; Table 7). Specifically, from 2012 to 2022, ESV experienced an inverted “N”-shaped process of sudden decrease, followed by a slow increase and then a decrease. It plummeted from 16538.28 billion dollars in 2012 to 16143.32 billion dollars in 2014, a reduction rate of 2.39%, and then phased in a slow increase to 10856.919 billion dollars in 2018, a growth rate of 0.08%, but still well below the 2012 level. Subsequently, from 2018 to 2022, the ESV slowly decreases, with a cumulative decrease of 83.21 billion dollars.

Table 6. ESV equivalent per unit area (US$•hm−1 a−1).
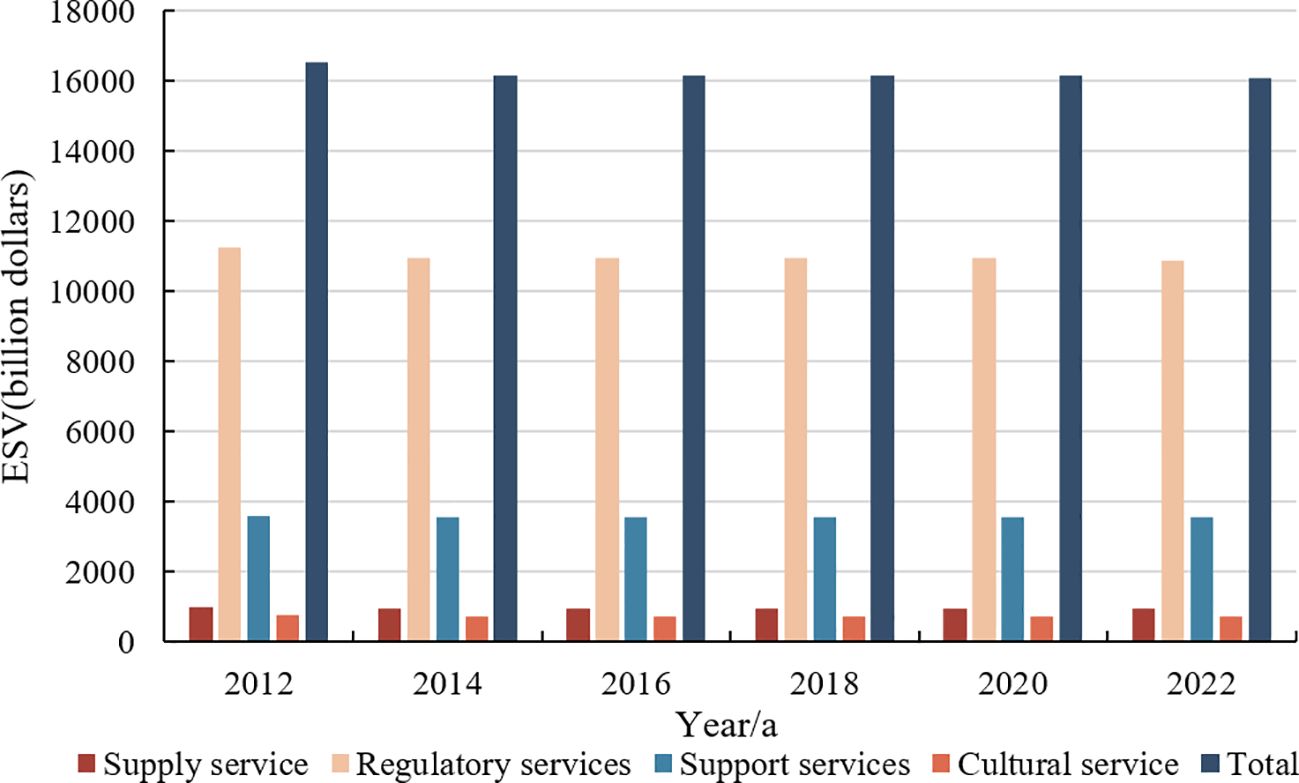
Figure 5. Trends in the ESV in China, 2012–2022.
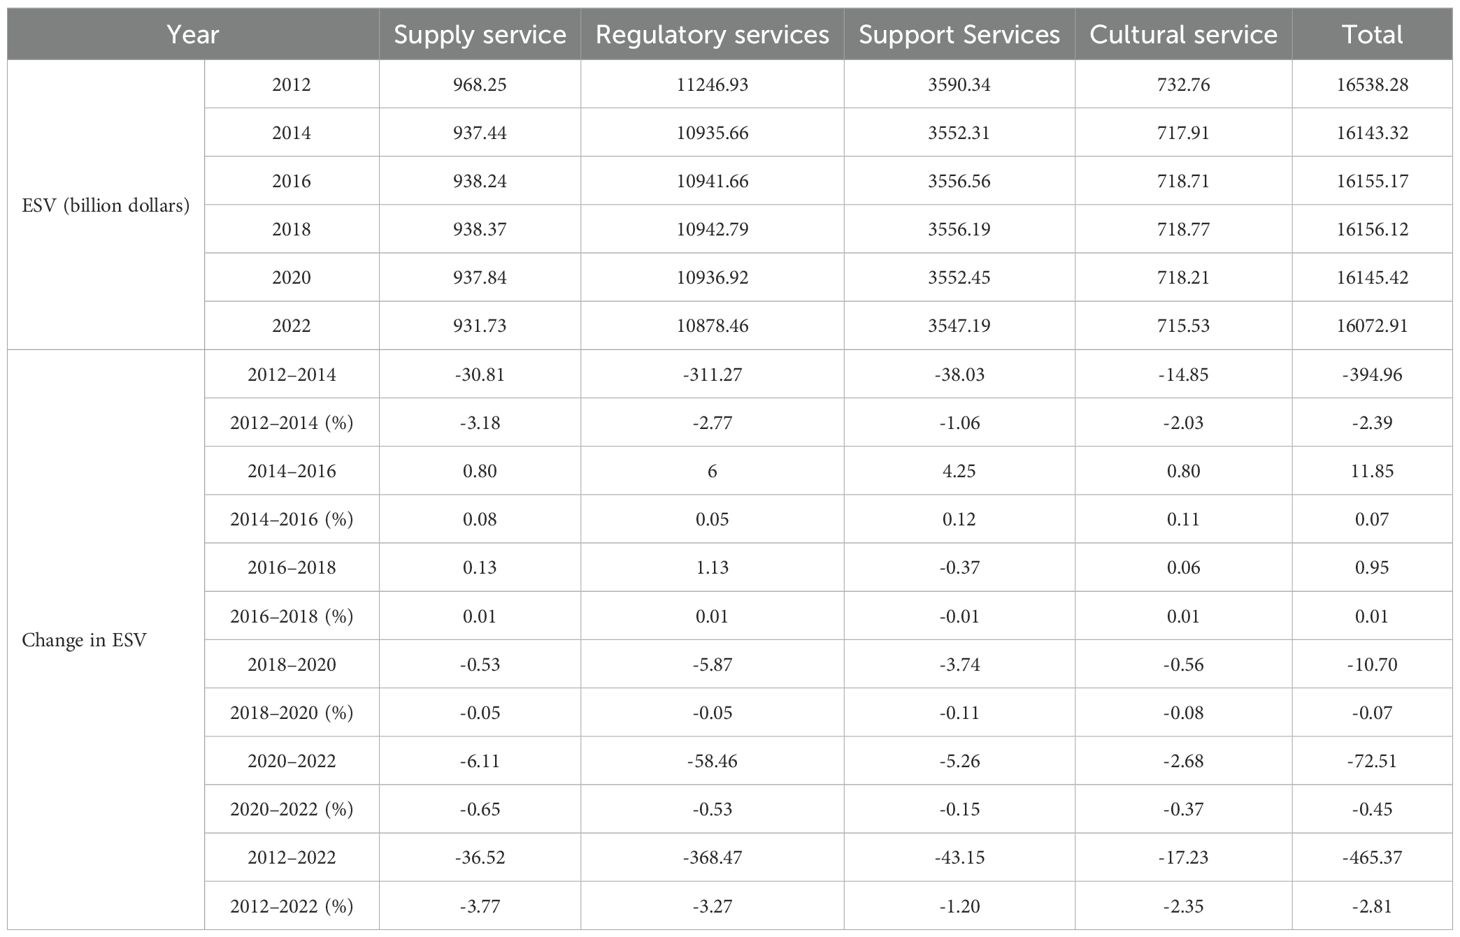
Table 7. ESV in China, 2012–2022.
Regarding ecosystem service types, the relative proportions of the four types of ecosystem services have not changed significantly over the past 10 years, and the structure of ESV is relatively stable. Among them, the value of regulating services accounted for the highest proportion (67.77%), followed by the value of supporting services (21.97%). In comparison, the value of provisioning services (5.81%) and cultural services (4.45%) accounted for the least. The above results indicate that China’s natural ecosystem mainly regulates human pollution, safeguards the ecosystem’s stability, and maintains the natural environment on which human beings depend for survival. Specifically, all four categories of ESV in China have decreased to different degrees from 2012 to 2022. The supply service has the largest reduction, totaling 3.77%. In the phased change, supply services, regulating services, support services, and cultural services have experienced the inverted “N” shape fluctuation change of a sudden decrease, followed by a rebound and then a decrease, which is consistent with the change process of the total value of ESV in this period.
In terms of spatial distribution, the overall spatial differentiation is high in the east and low in the west, decreasing from the southeast to the northwest (Figure 6). The reason for this is that, on the one hand, the equivalent ecological value (ESV) of forest land is higher than that of cropland, grassland, and waters. China’s northeastern and southwestern regions are mostly characterized by mountainous and hilly terrain with higher forest cover. For example, the Great and Small Hinggan Mountains are important ecological barriers in China, so the ESV is higher. On the other hand, with the increase in human activities such as population migration, land use change, and economic development, the ecosystem services have changed, and the spatial difference is significant. Overall, the spatial distribution pattern of high and low-level zones expanded from 2012 to 2022 with little change in the overall spatial distribution pattern. In 2012, high-level areas were mainly distributed in Hulunbeier City, Inner Mongolia, and Chongqing Municipality; higher-level areas were distributed in the middle and lower reaches of the Yangtze River; and low-level areas were mainly distributed in the areas along the Yellow River. The high-level areas were in a state of contraction in 2012–2018, which was manifested in the transformation of Chongqing Municipality from a high-level area to a lower-level area; in comparison, low-level areas were expanding, such as Yancheng City, Jiangsu Province, Lijiang City, Yunnan Province, and Yancheng City, Yunnan Province. Yancheng City in Jiangsu Province, Lijiang City in Yunnan Province, and Anshun City in Guizhou Province are identified as key locations. Between 2018 and 2022, both high-level and low-level zones experienced expansion, with Chongqing City transitioning from a higher-level zone to a high-level zone, while Guiyang City in Guizhou Province and Huai’an City in Jiangsu Province shifted from lower-level zones to low-level zones.
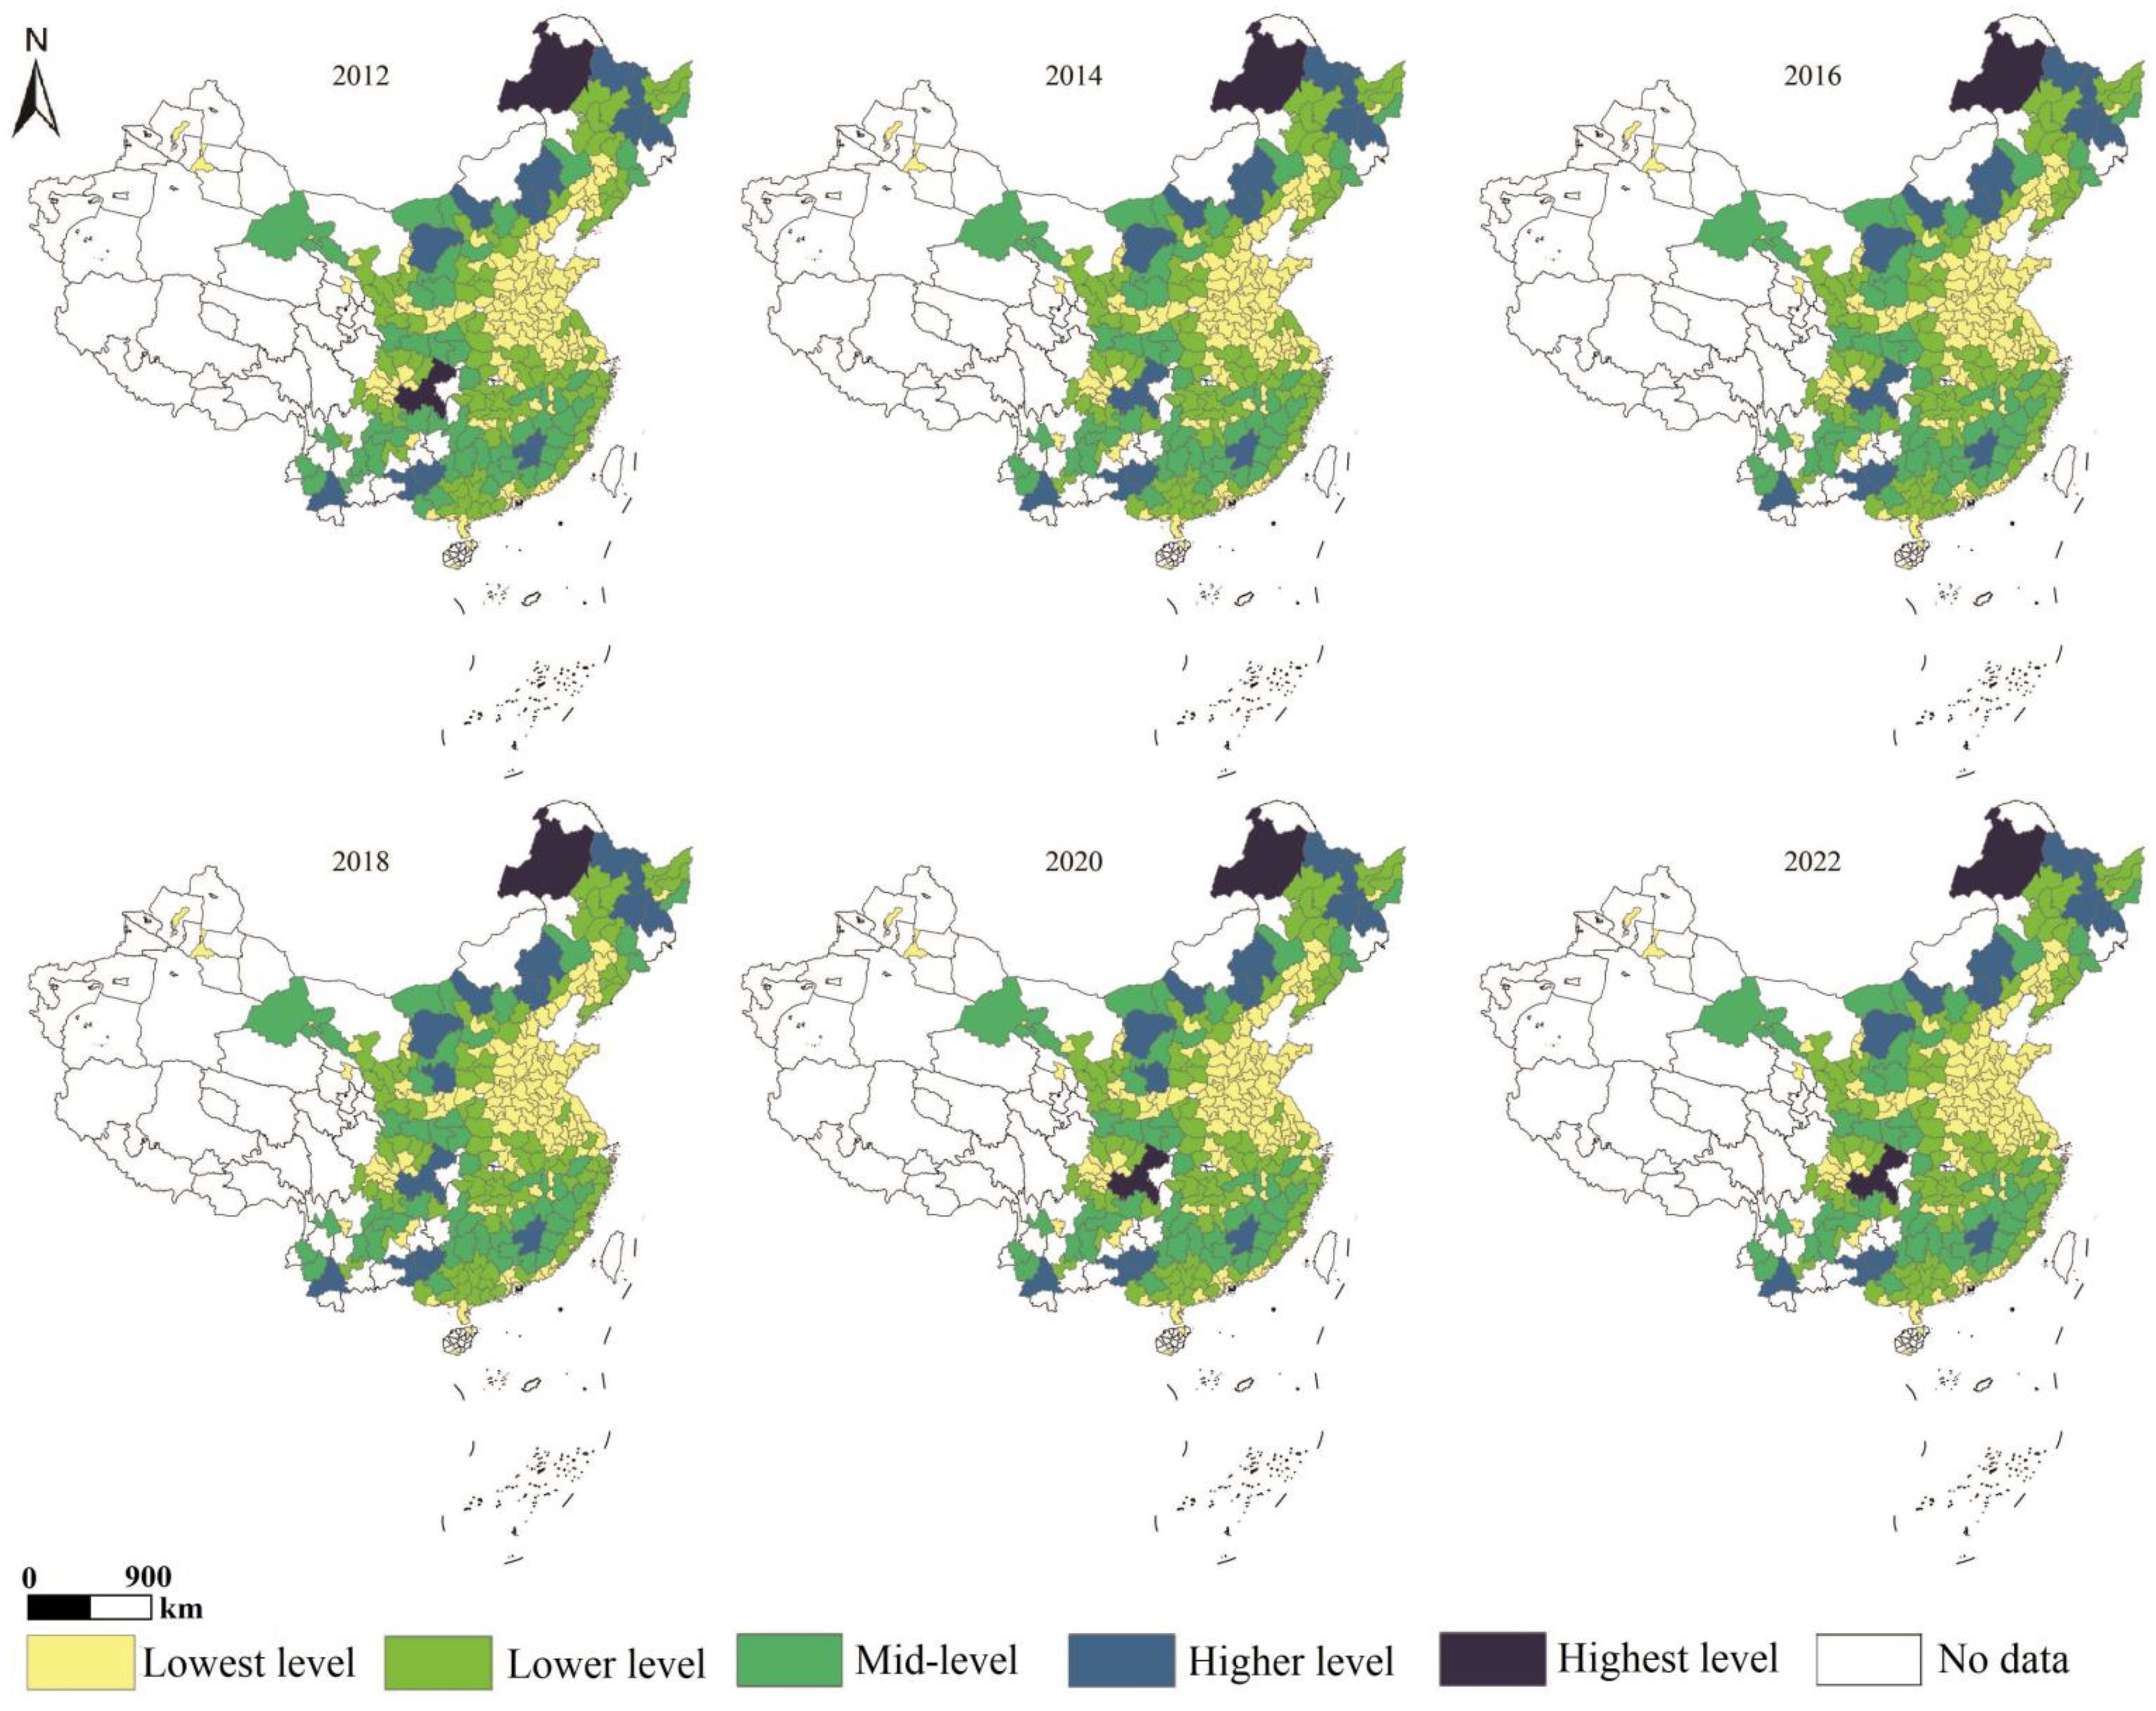
Figure 6. Spatial distribution of the value of ecosystem services in China, 2012–2022.
Based on the coupling degree model, the CCD between ESV and tourism economic resilience was measured from 2012 to 2022 in inter-city China and was divided into three regional sub-samples in the eastern, central, and western regions for further comparison (Figure 7; Table 8). The results show that the CCD of land-use carbon emissions and ESV in 2012-2022 shows a mirror-image “L”-shaped growth, and the average value of the CCD of the two systems increases from 0.613 in 2012 to 0.621 in 2022, reaching a peak in 2022. Most of the CCD are in the intermediate and elementary coordination stages, and the coordinated development between the systems still needs to be further enhanced.
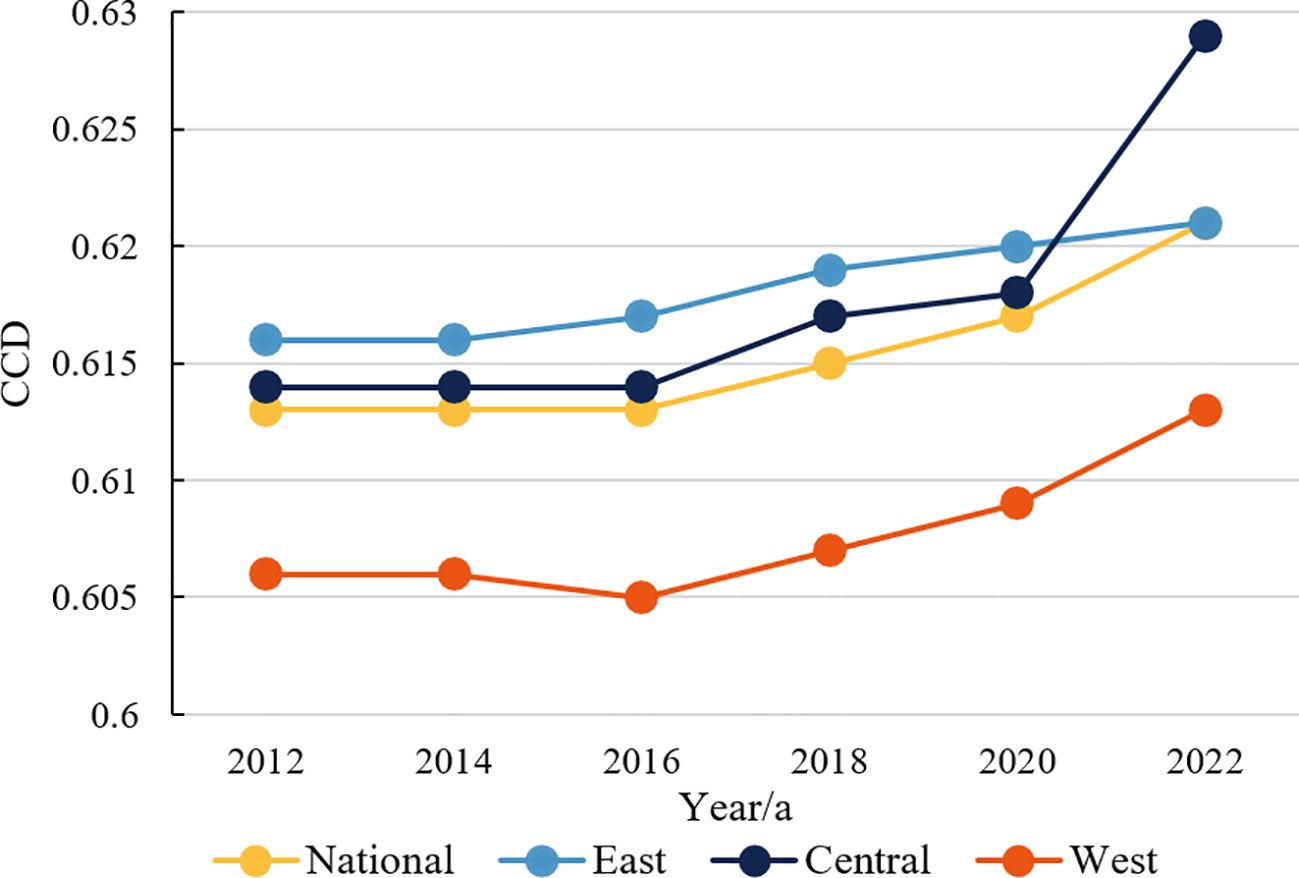
Figure 7. Trends in CCD between land-use carbon emissions and ecosystem services in the subregion, 2012–2022.
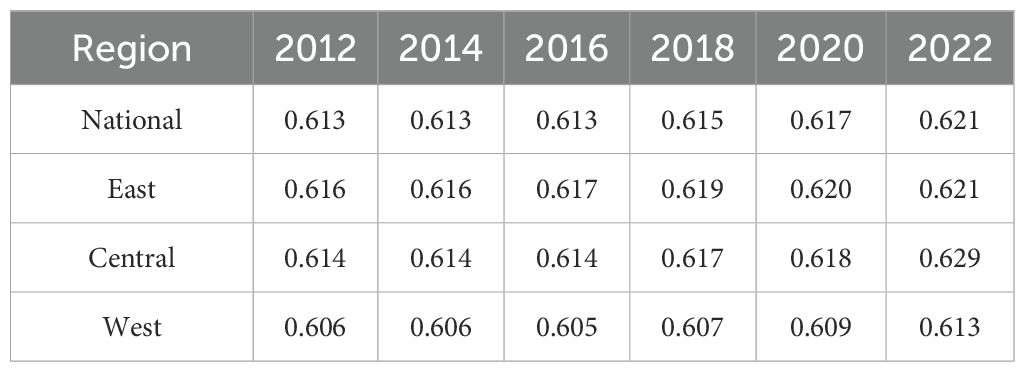
Table 8. CCD between land-use carbon emissions and ecosystem services in the subregion, 2012–2022.
From a subregional perspective, disparities exist in the coupling coordination levels across different regions; specifically, the coupling coordination levels in the central and eastern parts of the country exceed the national average. In contrast, the western part of the country still has a certain gap from the national average. On the city level, there is a big difference between cities in terms of economic development, political support, and resource endowment, resulting in a significant difference in the coupling coordination level. It is also found that Hulunbeier has the highest coupling coordination level, which grew from 0.861 in 2012 to 0.907 in 2022, all in the transition stage of excellent coordinated development. This is due to Hulunbeier’s higher elevation and wider distribution of grassland, which generates higher ecological service value, but its economic development still relies on high energy-consuming industries. In addition, Hulunbeier’s industrialization and urbanization are accelerating, with a consequent increase in energy consumption, further driving up carbon emissions. Chifeng and Taiyuan have the second highest CCD, with their coupling coordination evolving from intermediate to excellent coordination. In contrast, the coupling coordination degree of Jiayuguan, Neijiang, Ziyang, and some other cities in the western region is low (mean<0.561) but relatively stable (change<0.02).
The years 2012, 2014, 2016, 2018, 2020, and 2022 were chosen as cross-sectional time points to investigate the spatial differentiation and evolutionary characteristics of the coupling and coordination levels between land-use carbon emissions and ESV in China (Figure 8). The results show that the CCD of land-use carbon emission and ESV in China presents a distribution characteristic of “high in the north and low in the south,” especially in Hulunbeier and Chifeng in North China, where the polar nucleus is obvious. Overall, the CCD of the two systems fluctuates and rises from 2012 to 2022, with the high-value areas mainly concentrated in Inner Mongolia in North China and Chongqing in Southwest China, while the low-value areas are mostly distributed in Central China; the high-value area tends to expand, and the low-value area tends to contract, and the change of spatial distribution pattern is relatively small.
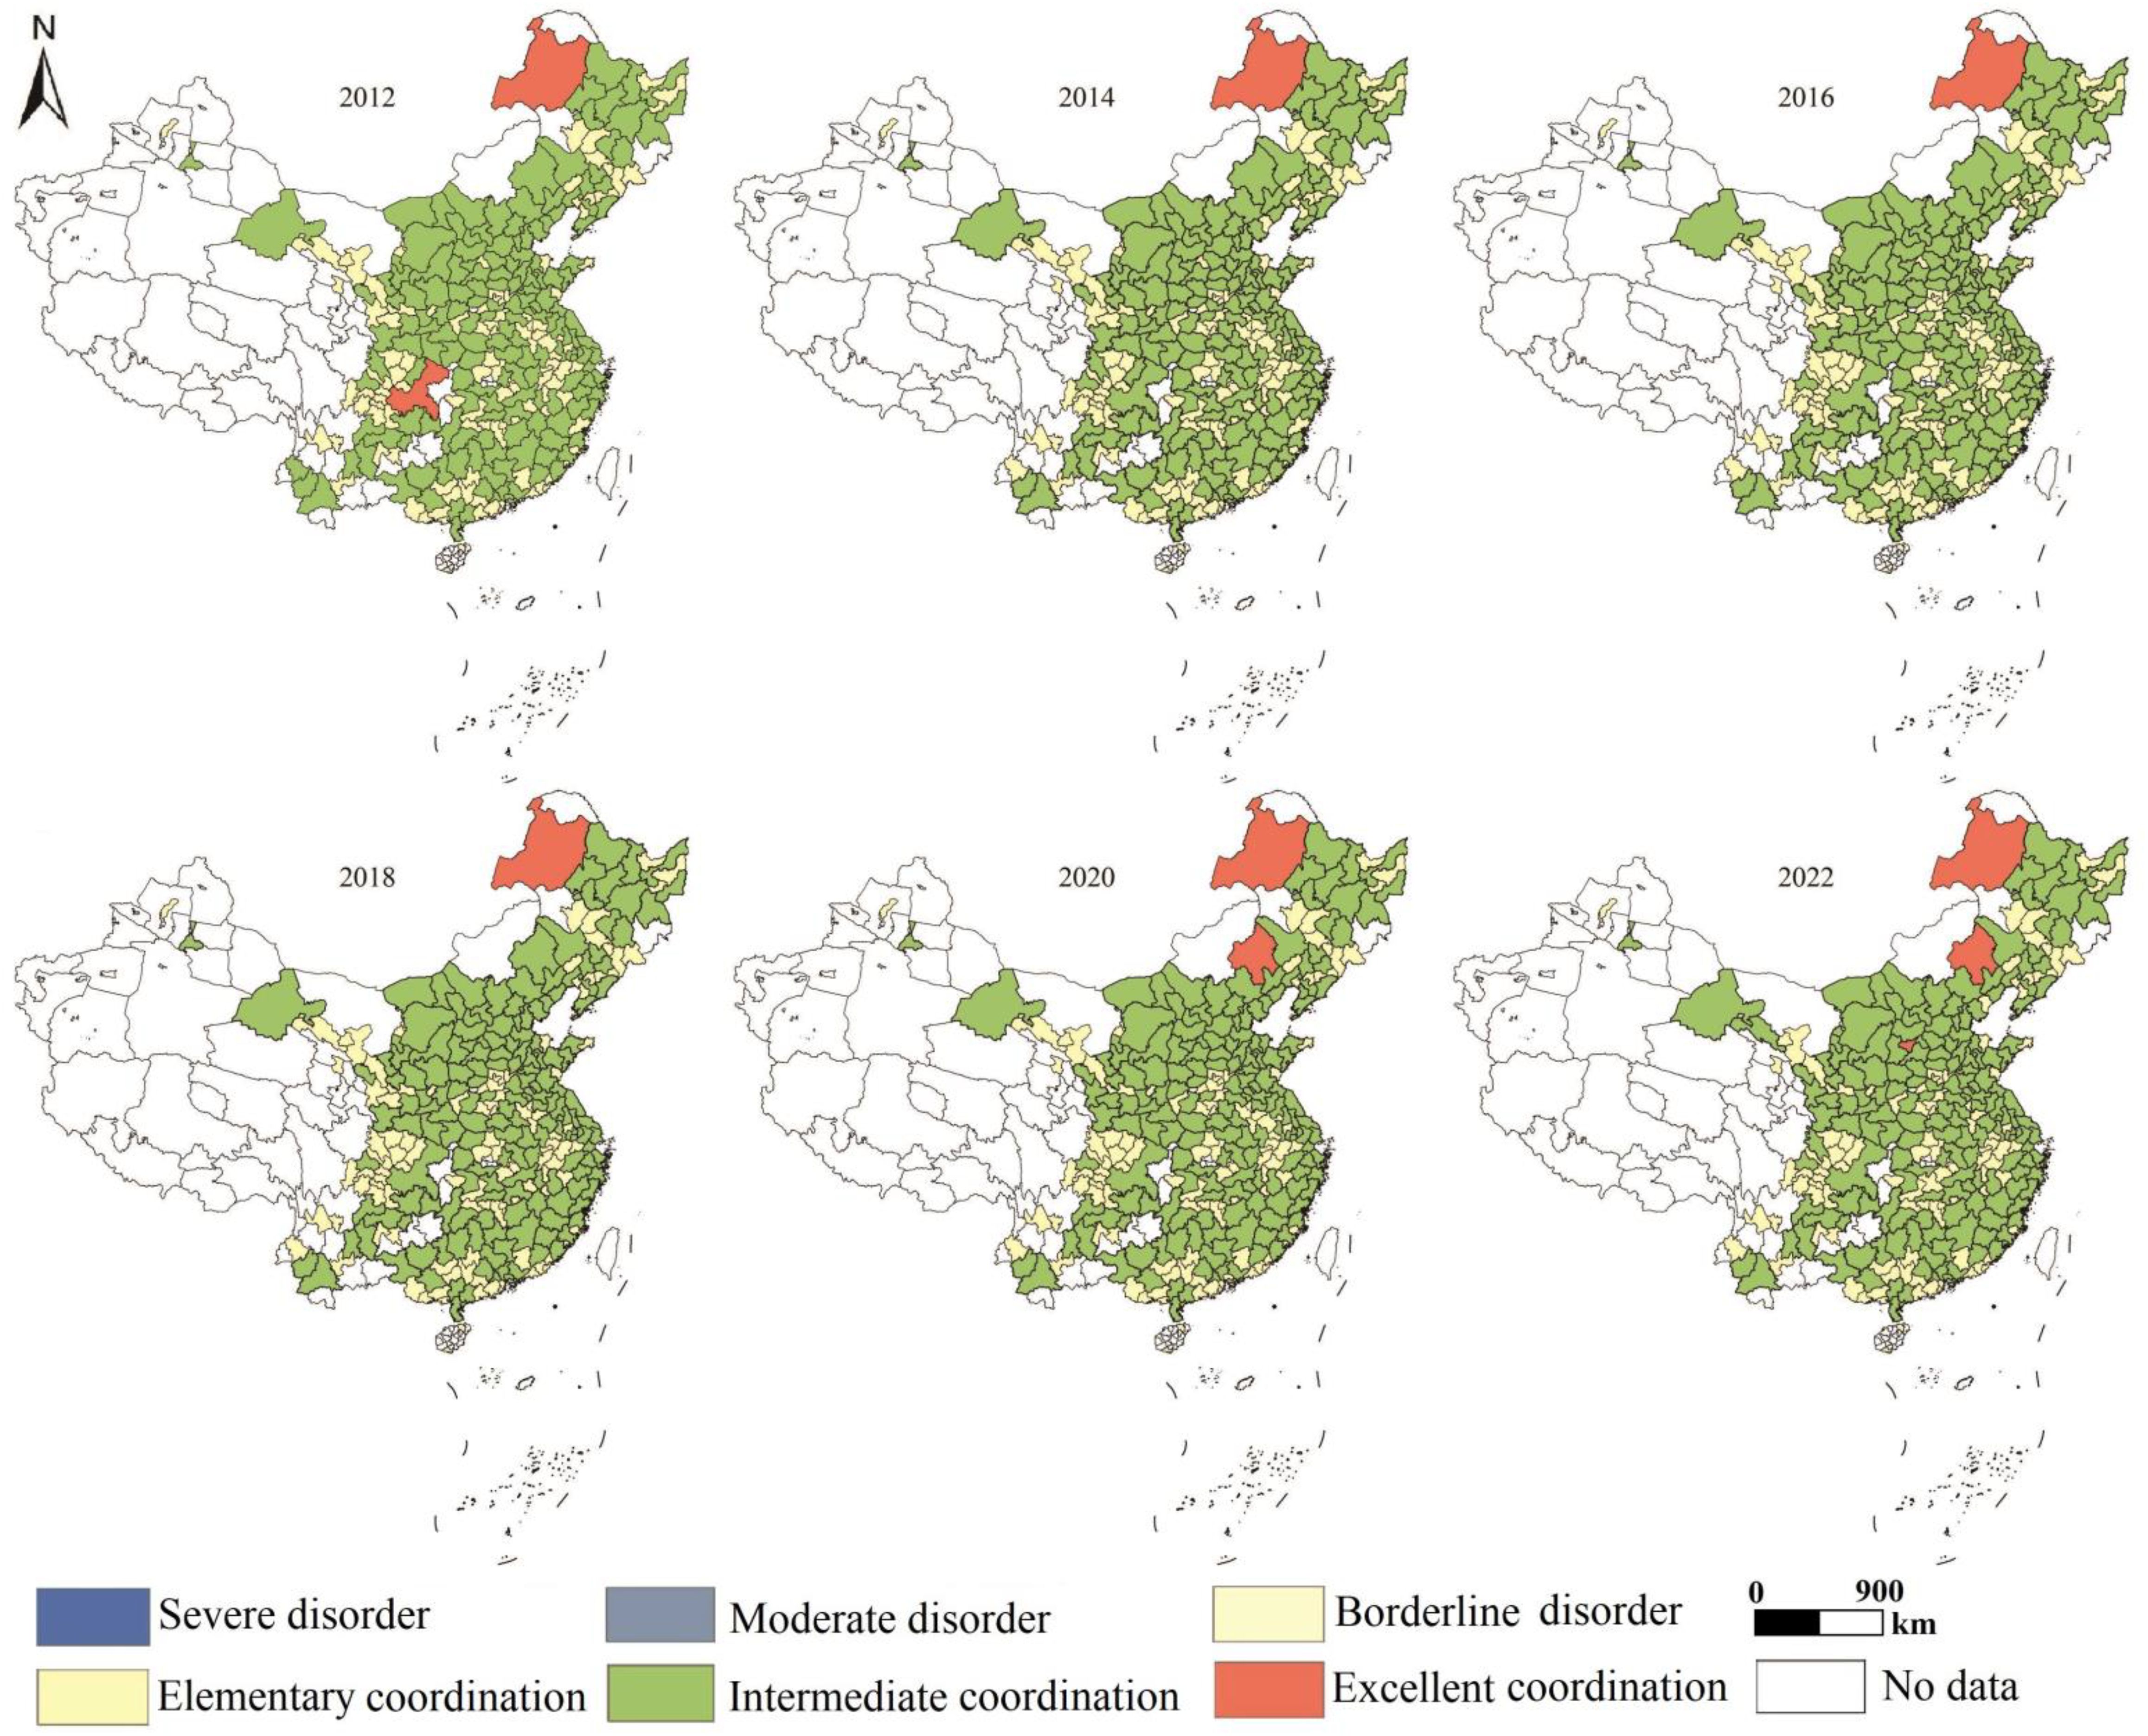
Figure 8. Spatial distribution of coupled coordination types of ecosystem services and land-use carbon emissions.
Specifically, in 2012, most regions in China were in elementary and intermediate coordination. Hulunbeier and Chongqing had the highest level of coupled coordination, which was excellent coordination; Jiayuguan, Sanya, Jingdezhen, and other 114 (39.86%) cities had the lowest level of coupled coordination, which was elementary coordination; Chifeng, Shanghai, Harbin, Tianjin, and other 170 (59.44%) cities had an intermediate level. From 2012 to 2014, excellent coordination and intermediate coordination regions tended to contract, while elementary coordination regions tended to expand, and the overall spatial evolution was smaller. Hulunbeier has excellent coordination; Chongqing falls back from the excellent coordination stage to the intermediate; Baoshan and Qinhuangdao turn from the intermediate to the elementary coordination stage. From 2014–2018, the cities in the excellent coordination area remain unchanged, with only one city, Hulunbeier; the intermediate coordination area expanded, with five cities, Chuzhou, Suzhou, Ningde, and Shaoguan, jumping up to the intermediate coordination stage from the elementary coordination stage to the intermediate coordination stage. The five cities of Chuzhou, Suzhou, Ningde, and Shaoguan jumped from the elementary to the intermediate coordination stage. From 2018 to 2022, the excellent and intermediate coordination zones expanded, while the elementary coordination zones contracted. Hulunbeier is in the excellent coordination stage, Chifeng and Taiyuan leap from the intermediate to the excellent coordination stage, and eight cities, including Shizuizu, Zhangye, Mianyang, and Xiamen, move from the elementary to the intermediate coordination stage.
In the analysis of carbon emissions and ESV related to land use in China, it is shown that the central area of the study region has a higher carbon emission but lower ESV, while the opposite is true for the peripheral areas. This suggests a potential correlation between the two. A spatial correlation analysis of carbon emissions and ESV within the study area was conducted to gain deeper insights into their interaction. A bivariate spatial autocorrelation model was employed to explore the spatial relationship between land-use carbon emissions and ESV. The results indicate a significant negative spatial correlation between the two; as carbon emissions increase, ESV tends to decline. Furthermore, Moran’s I values ranged from -0.364 to -0.237, indicating that the spatial dispersion effect of both persisted during the study period (Table 9).
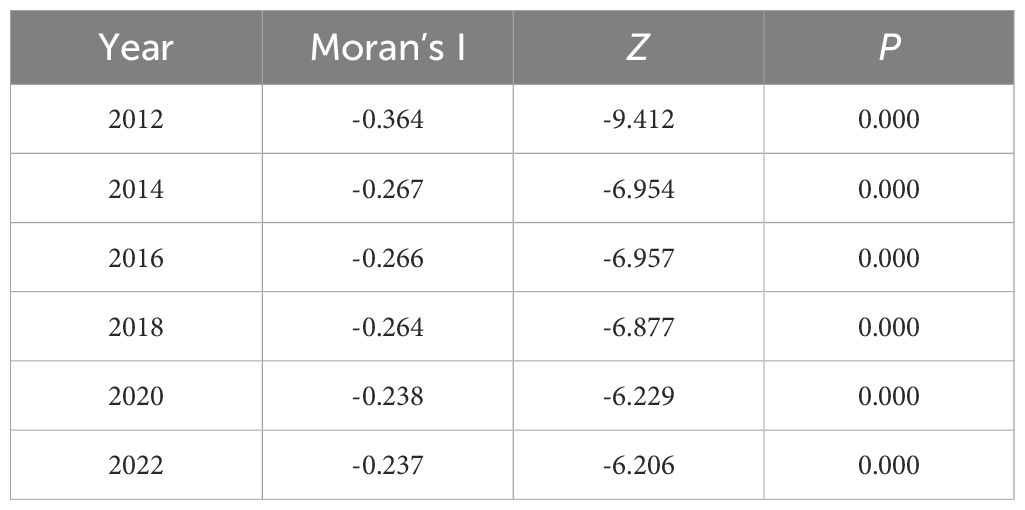
Table 9. Global Moran Index results.
Furthermore, the LISA agglomeration map of land-use carbon emissions and ESV was compared and analyzed (Figure 9). The results show that the following.
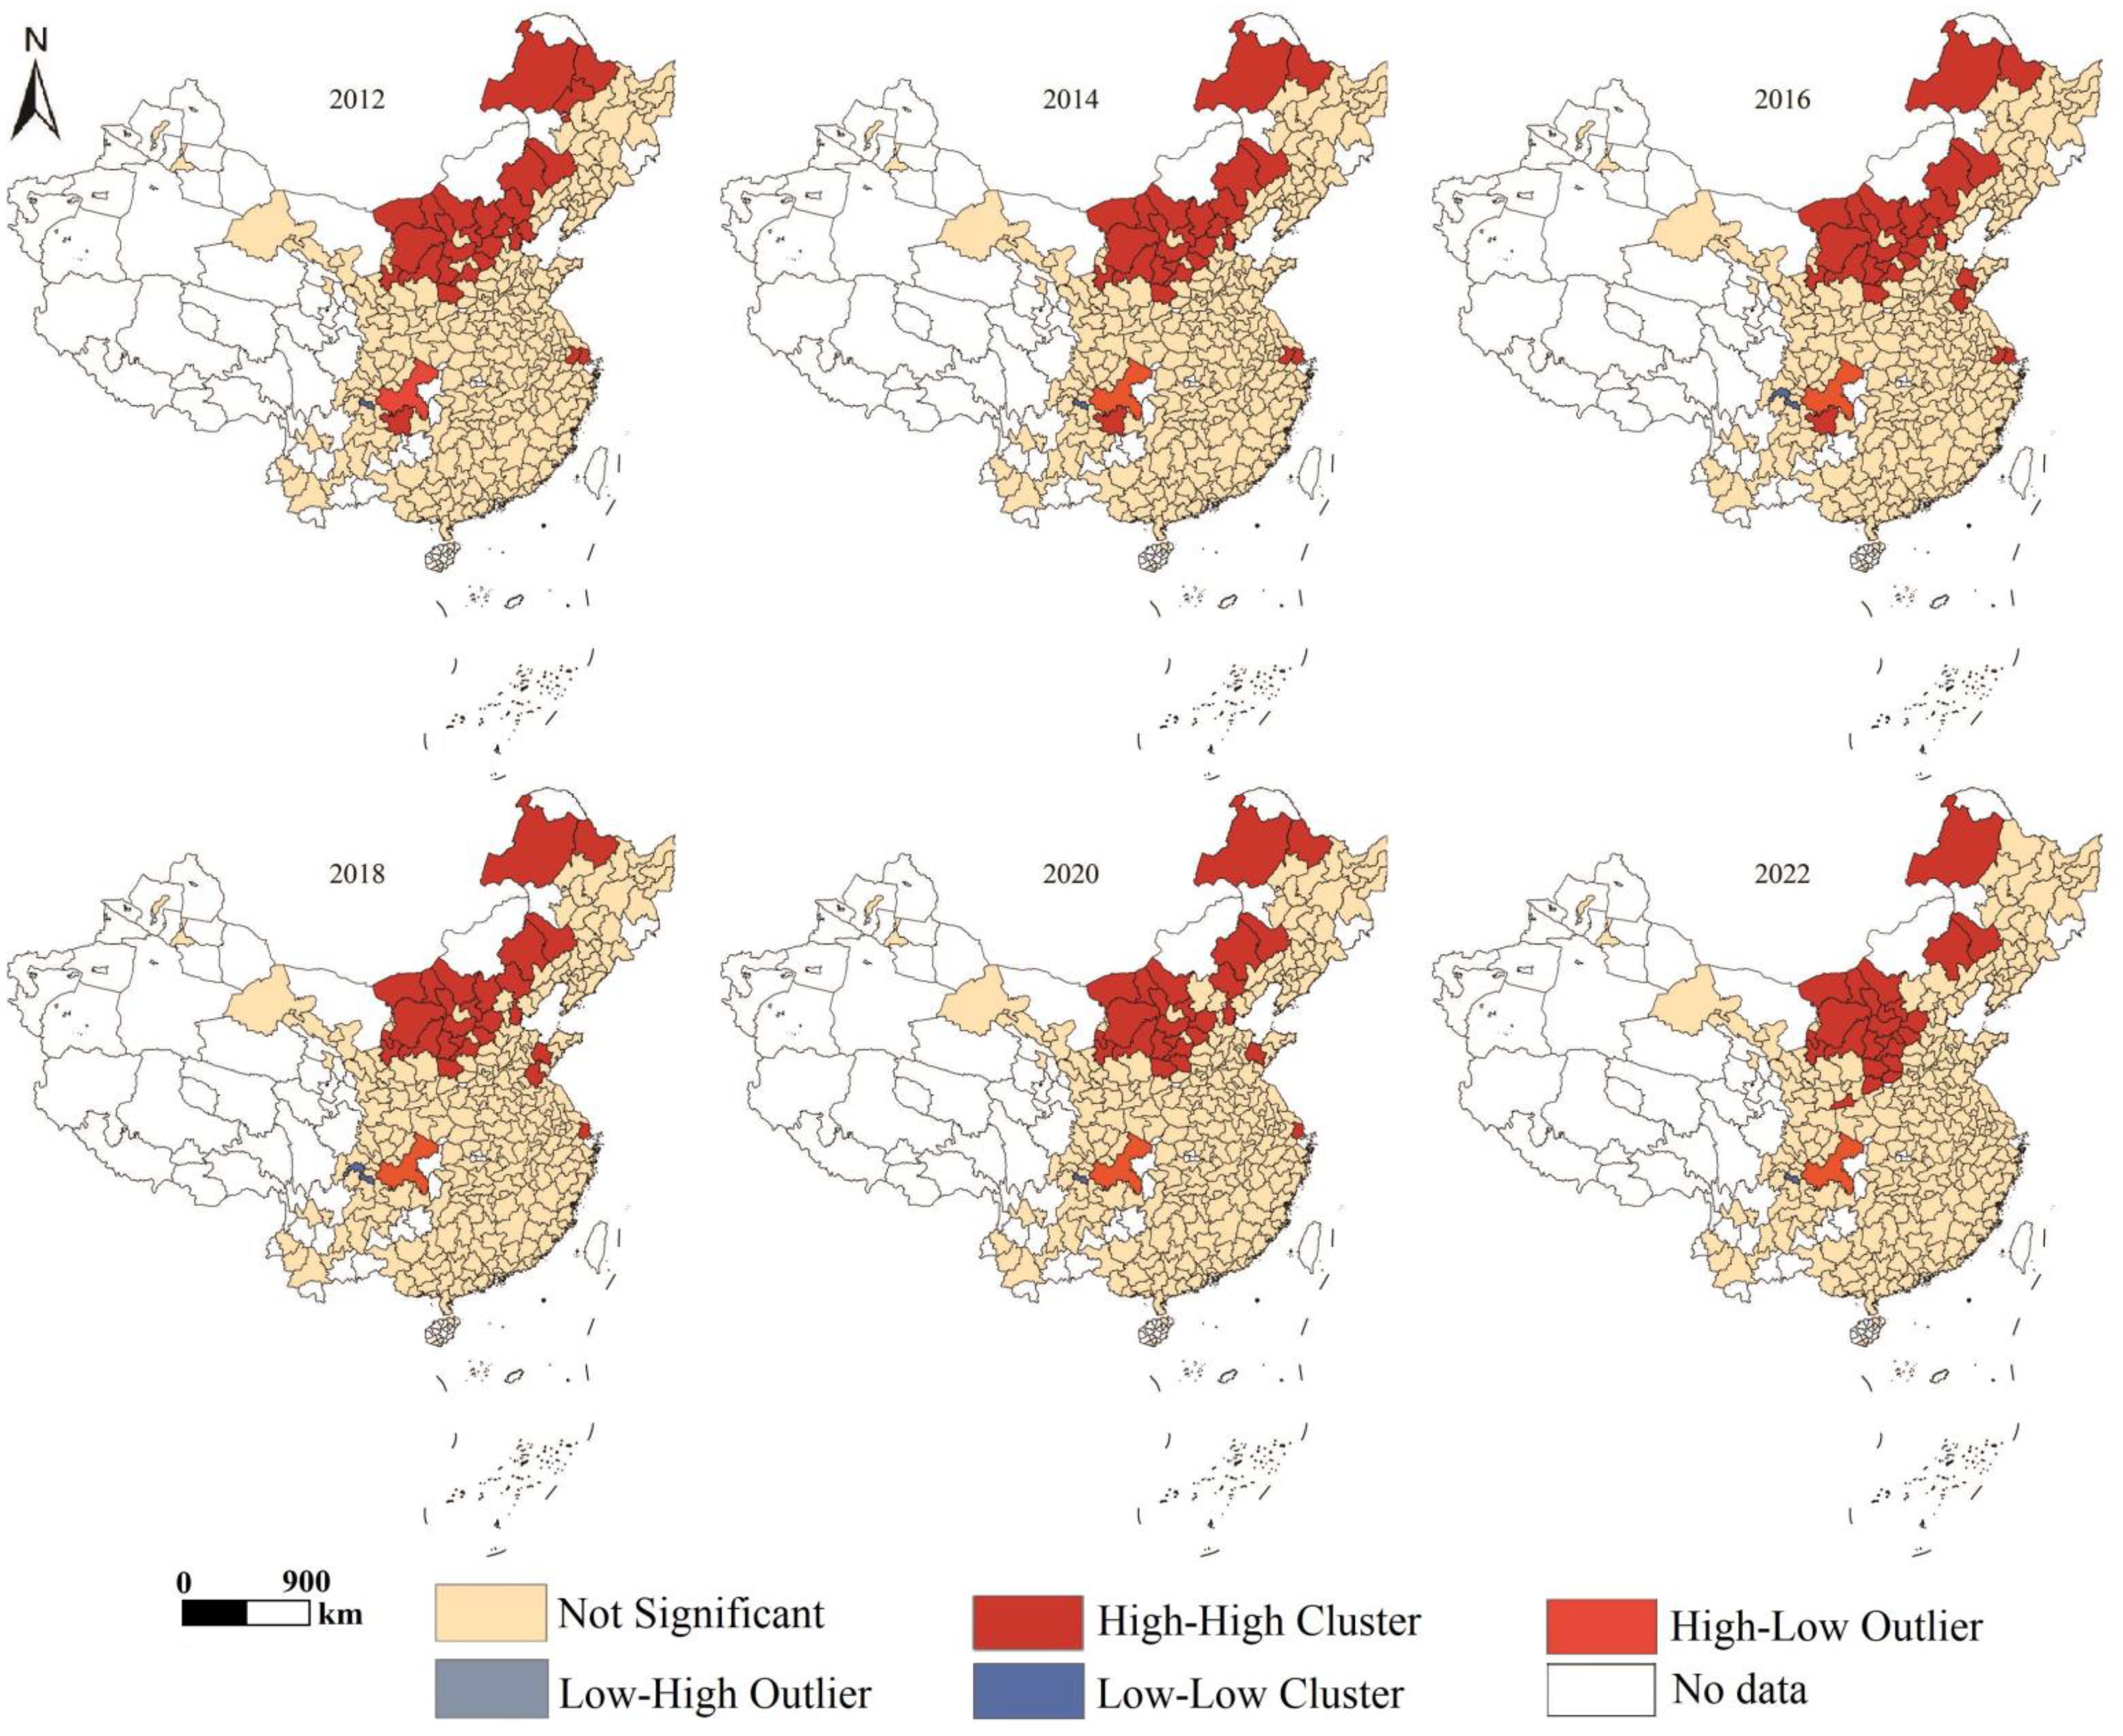
Figure 9. Coupling coordination LISA clustering map.
In 2012, the “high-high” agglomeration area was mainly concentrated in 27 cities in North China and Southwest China, such as Wuzhong, Chifeng, and Zunyi; the “high-low” agglomeration area is mainly concentrated in Chongqing; and the “low-low” agglomeration area is only in Zigong. The “high-low” agglomeration area is mainly concentrated in Chongqing; the “low-low” agglomeration area is only one city, Zigong.
In 2014, the overall number of “high-high” agglomerations increased by one, with Qiqihar and Taiyuan leaping from insignificant agglomerations to “high-high” agglomerations, and Tianjin leaping from a “high-high” agglomeration to a “high-high” agglomeration. The number of “high-high” agglomerations changed to insignificant agglomerations in Tianjin, while the number of “high-low” agglomerations remained unchanged.
In 2016, only two cities, Weifang and Linyi, were added to the “high-high” agglomeration area; only one city, Leshan, was added to the “low-low” agglomeration area.
In 2018, the number of “high-high” agglomerations decreased; Zunyi, Suzhou, and Beijing changed from “high-high” agglomerations to insignificant agglomerations; and only Yinchuan jumped from insignificant agglomerations to “high-high” agglomerations.
In 2020, the number of “high-high” agglomerations and “low-low” agglomerations were further reduced. Linyi and Zhangjiakou turn from “high-high” agglomerations to insignificant agglomerations, while Changzhi turns from an insignificant agglomeration to a “high-high” agglomeration; Leshan turns from “low - low” agglomeration to “high - low” agglomeration; and Changzhi turns from “high - high” agglomeration to “high - high” agglomeration. Low-low” agglomeration to non-significant agglomeration.
In 2022, the number of “high-high” agglomerations and “low-low” agglomerations will remain unchanged. Five cities, namely Shanghai, Tianjin, Weifang, Heihe, and Chengde, will change from “high - high” agglomeration to non-significant agglomeration, while five cities, namely Yuncheng, Jincheng, Xi’an, Shuozhou, and Yangquan, jumped from non-significant agglomerations to “high - high” agglomerations. In contrast, the five cities of Yuncheng, Jincheng, Xi’an, Shuozhou, and Yangquan jumped from insignificant to “high-high” agglomerations. Overall, through the analysis of the typical year agglomeration map, it can be found that the coupling and coordination of land-use carbon emission and ESV are mainly characterized by the spatial correlation of “low-low” agglomeration and “high-high” aggregation and that the”low-high” agglomerations and “high-high” agglomerations have the same spatial characteristics. It can be found that the coupling and coordination of land-use carbon emissions and ESV mainly show the spatial correlation characteristics of “low-low” agglomeration and “high-high” agglomeration, and “low-low” agglomerations are mainly concentrated in Zigong and Leshan in Southwest China, while “high-high” agglomerations are widely concentrated in North China. The high ESV in North China is due to the high value of ecosystem regulation services provided by the Yellow River Basin and the Haihe River Basin. Although the region has quantitative carbon sinks due to its proximity to water, land-use carbon emissions are relatively high due to the overexploitation of mineral resources and the irrational development of heavy industry.
There are many factors affecting the coupling and coordination of land-use carbon emissions and ESV, and this study fully draws on previous studies to explore the processes influencing the coupling and coordination of land-use carbon emissions and ESV from two dimensions, namely socioeconomic and natural environment, based on the availability of data. Thus, in this study, there were three socio-economic factors, including general budget expenditure of local finance, energy utilization efficiency, and total population, and three natural environment factors, including land resettlement rate, rainfall, and NDVI, and each independent variable was standardized to eliminate the effect of the scale (Table 10). Furthermore, two key time nodes, 2012 and 2022, were selected for comparative analysis, the six drivers were used as model explanatory variables, and the degree of coupling coordination was used as an explanatory variable. Since the coupling coordination degree of land-use carbon emissions and ESV has a significant positive correlation in spatial distribution, the regression analysis using the traditional OLS model may ignore the spatial factors, so the OLS model was performed before the GWR model test. The regression results showed that the variance inflation factor (VIF) of all explanatory variables for the two time points of 2012 and 2022 was less than 7.5, indicating no multicollinearity problem in the model. According to the R2 results of the adjusted goodness-of-fit for the two representative years measured by the GWR model, it can be seen that the explanatory strength of the GWR model is 57.25% and 41.86%, respectively. The goodness-of-fit is 8.62% and 5.93% higher than that of the OLS model, respectively, and its AICc value is also smaller, which fully indicates that the GWR is the model with a greater goodness-of-fit.

Table 10. Descriptive variables for factors affecting the coupling coordination degree between land-use carbon emissions and ecosystem services.
The regression analysis of the GWR model showed that three socioeconomic factors, namely, general budget expenditure of local finance, energy use efficiency, and total population, positively influenced the coupling and coordination of land-use carbon emissions and ESV. However, the effects of natural environmental factors show instability. Among them, land resettlement rate and average annual precipitation are the main factors leading to a decrease in coupling coordination, both of which show negative impacts in the study area, while NDVI has both positive and negative impacts on coupling coordination. According to the absolute value of the influence degree of each driving factor, the order is X4>X6>X5>X2>X3>X1. The spatial and temporal differentiation characteristics of the influence of each driving factor on the coupling coordination of land-use carbon emissions and ESV in China are as follows:
1. Local finance general budget expenditure: From 2012 to 2022, Shanghai, Beijing, Tianjin, Chongqing, Guangzhou, and Shenzhen east of the Hu Huanyong line have a higher intensity of local finance general budget expenditure, while Wuhai, Zhangye, Jiayuguan, and other areas located west of the Huanyong line have a lower intensity of local finance general budget expenditure. Regarding the fitting coefficient, the general budget expenditure of local finance contributes positively to the enhancement of regional land-use carbon emissions and ESV coupling coordination. Among them, the fitting coefficients of the western regions of China, such as Pu’er, Jiuquan, and Baoshan, are larger, while the fitting coefficients of the central and eastern regions are relatively smaller, and the overall trend gradually decreases from southwest to northeast (Figures 10-a1, 10-b1). The reason is that the economic scale of the eastern coastal region is larger, and the increase in public expenditure intensity leads to the intensification of regional land use changes and the consequent increase in carbon emissions, which in turn affects the coordination effect of the coupling of regional land-use carbon emissions and ESV.
2. Energy utilization efficiency: From 2012 to 2022, energy utilization efficiency is characterized as “high in the north and south, low in the center”; in 2012, the areas with energy utilization efficiency exceeding 2.0 t/thousand dollars includes 19 cities such as Dingxi, Baoshan, Jiamusi, etc., which are mainly located in the western and northeastern parts of China. In 2022, the number of regions with energy utilization efficiency exceeding 2.0 t/thousand dollars remained roughly the same, mainly clustered in Northeast China, with Heihe City having the highest level with 4.13 t/thousand dollars. Regarding the fitting coefficient, energy use efficiency contributes positively to the enhancement of the coupling and coordination effect of land-use carbon emissions and ESV in all regions. In 2012, energy use efficiency showed a significant positive effect on the coupling and coordination of the two, mainly in the northeastern part of China. By 2022, the positive impact of energy utilization efficiency continued to increase, expanding over time in the northeastern and southeastern regions (Figures 10-a2, 10-b2). The reason is that the eastern region prioritizes economic development. Its industrial and energy consumption structure is better than that of the central and western regions. The increase in energy dependence will increase land-use carbon emissions, so safeguarding the energy-use efficiency of the region has a more significant impact on the coupling and coordination of regional land-use carbon emissions and ESV.
3. Total population: From 2012 to 2022, cities with more than 10 million people were mainly located in the eastern coastal and central regions, such as Chongqing, Shanghai, Beijing, and Harbin. Regarding the fitting coefficients, the total population positively contributes to coupling land-use carbon emissions and ESV. The differences in the fitting coefficients of various regions are relatively small, with the regression coefficients displaying a ladder-like feature of “high in the northeast and low in the southwest” (Figures 10-a3, 10-b3). On the whole, the increase in total population increased the efficiency of the coupling of land-use carbon emissions and ESV in the northeast region in cities with a relatively small population, such as Heihe, Hulunbeier, and Shuangyashan, to a greater extent than in the central and western regions. The influence of human activity intensity on ecosystems and land-use carbon emissions should continue to be controlled in the future.
4. Land resettlement rate: From 2012 to 2022, the land resettlement rate of 22 cities in the eastern region, including Guyuan, Changchun, Zhoukou, and Jiamusi, exceeded 60%, with Guyuan and Changchun exceeding 80%. In contrast, the land resettlement rate in the central and western parts of the country is relatively low due to the land quality, the resettlement history, and the economic and technical strength. In terms of the fitting coefficient, the land resettlement rate contributes negatively to the enhancement of the coupling coordination between regional land-use carbon emissions and ESV, and the absolute value of the regression coefficient shows a “high in the south and low in the north” stepped characteristic, with a large difference in the fitting coefficient. The high negative impact area is distributed in the southeast region, while the low negative impact area is concentrated in the northeast region. It shows that the reduction of the land resettlement rate promotes the improvement of the coupling coordination efficiency of land-use carbon emission and ESV and also shows that the land resettlement rate enhances the coupling coordination efficiency of the two systems to a greater extent in each region (Figures 10-a4, 10-b4). The reason is that the higher the land resettlement rate and the lower the vegetation cover, the more fragile the ecological environment and the lower the land-use carbon emissions, negatively affecting the efficiency of the coupling and coordination between land-use carbon emissions and ESV.
5. Mean annual precipitation: From 2012 to 2022, areas with higher mean annual rainfall were mainly distributed in southeast China, such as Guangzhou, Dongguan, Sanming, Fuzhou, and other areas south of the Qinling–Huaihe River, while northwestern China had a relatively lower mean annual precipitation due to geographic location, climate type, and other factors. As far as the fitting coefficient is concerned, the absolute value of the fitting coefficient is relatively small in those regions with higher average annual precipitation. Overall, the average annual precipitation makes a consistently stronger negative contribution to the coupled coordination efficiency of land-use carbon emissions and ESV in each region, and the intensity of its influence is roughly opposite to the distribution of average annual precipitation in China. The high negative impact area is mainly located in north China, while the low negative impact area is mainly distributed in south China (Figures 10-a5, 10-b5). The reason is that the average annual precipitation in the southeast is higher than in the north. The strong precipitation directly affects the soil carbon storage and sequestration capacity by influencing land-use efficiency and the functions of the ecosystem to provide food and habitat. It then indirectly affects the efficiency of the coupling and coordination between the land-use carbon emissions and ESV.
6. NDVI: From 2012 to 2022, the NDVI of Hechi, Baise, Dandong, and other areas east of the Hu Huanyong Line in China was high, while the NDVI of Jiuquan, Ulanqab, Wuwei, and other areas west of the Hu Huanyong Line in China was low due to the impacts of factors such as climate change and human activities, showing an overall spatial pattern of “high in the southeast and low in the northwest.” In terms of fitting coefficients, in 2012, NDVI had a global positive effect on the improvement of the coordination efficiency of the coupling of regional land-use carbon emissions and ESV, showing a gradient pattern of gradual enhancement from the middle and lower reaches of the Yellow River. In 2022, the influence of NDVI was unstable, with the high positive influence area gradually shifting to the northwest. In addition, in the northeast, NDVI negatively enhances the coupling coordination efficiency of land-use carbon emissions and ESV (Figures 10-a6, 10-b6). The reason is that the northwest region has low vegetation cover and a fragile ecological environment, which is not conducive to the healthy development of the local economy, and the land-use carbon emissions are relatively low, so it has a stronger impact on the efficiency of coupling and coordination of land-use carbon emissions and ESV. In addition, due to the higher ESV in the northeast, the carbon emissions of the land in the northeast, in which the main land use type is cropland, are significantly higher than the same area of land in which the main land use type is non-cropland, i.e., the reduction of vegetation cover effectively promotes the coupling and coordination of ESV and land-use carbon emissions.
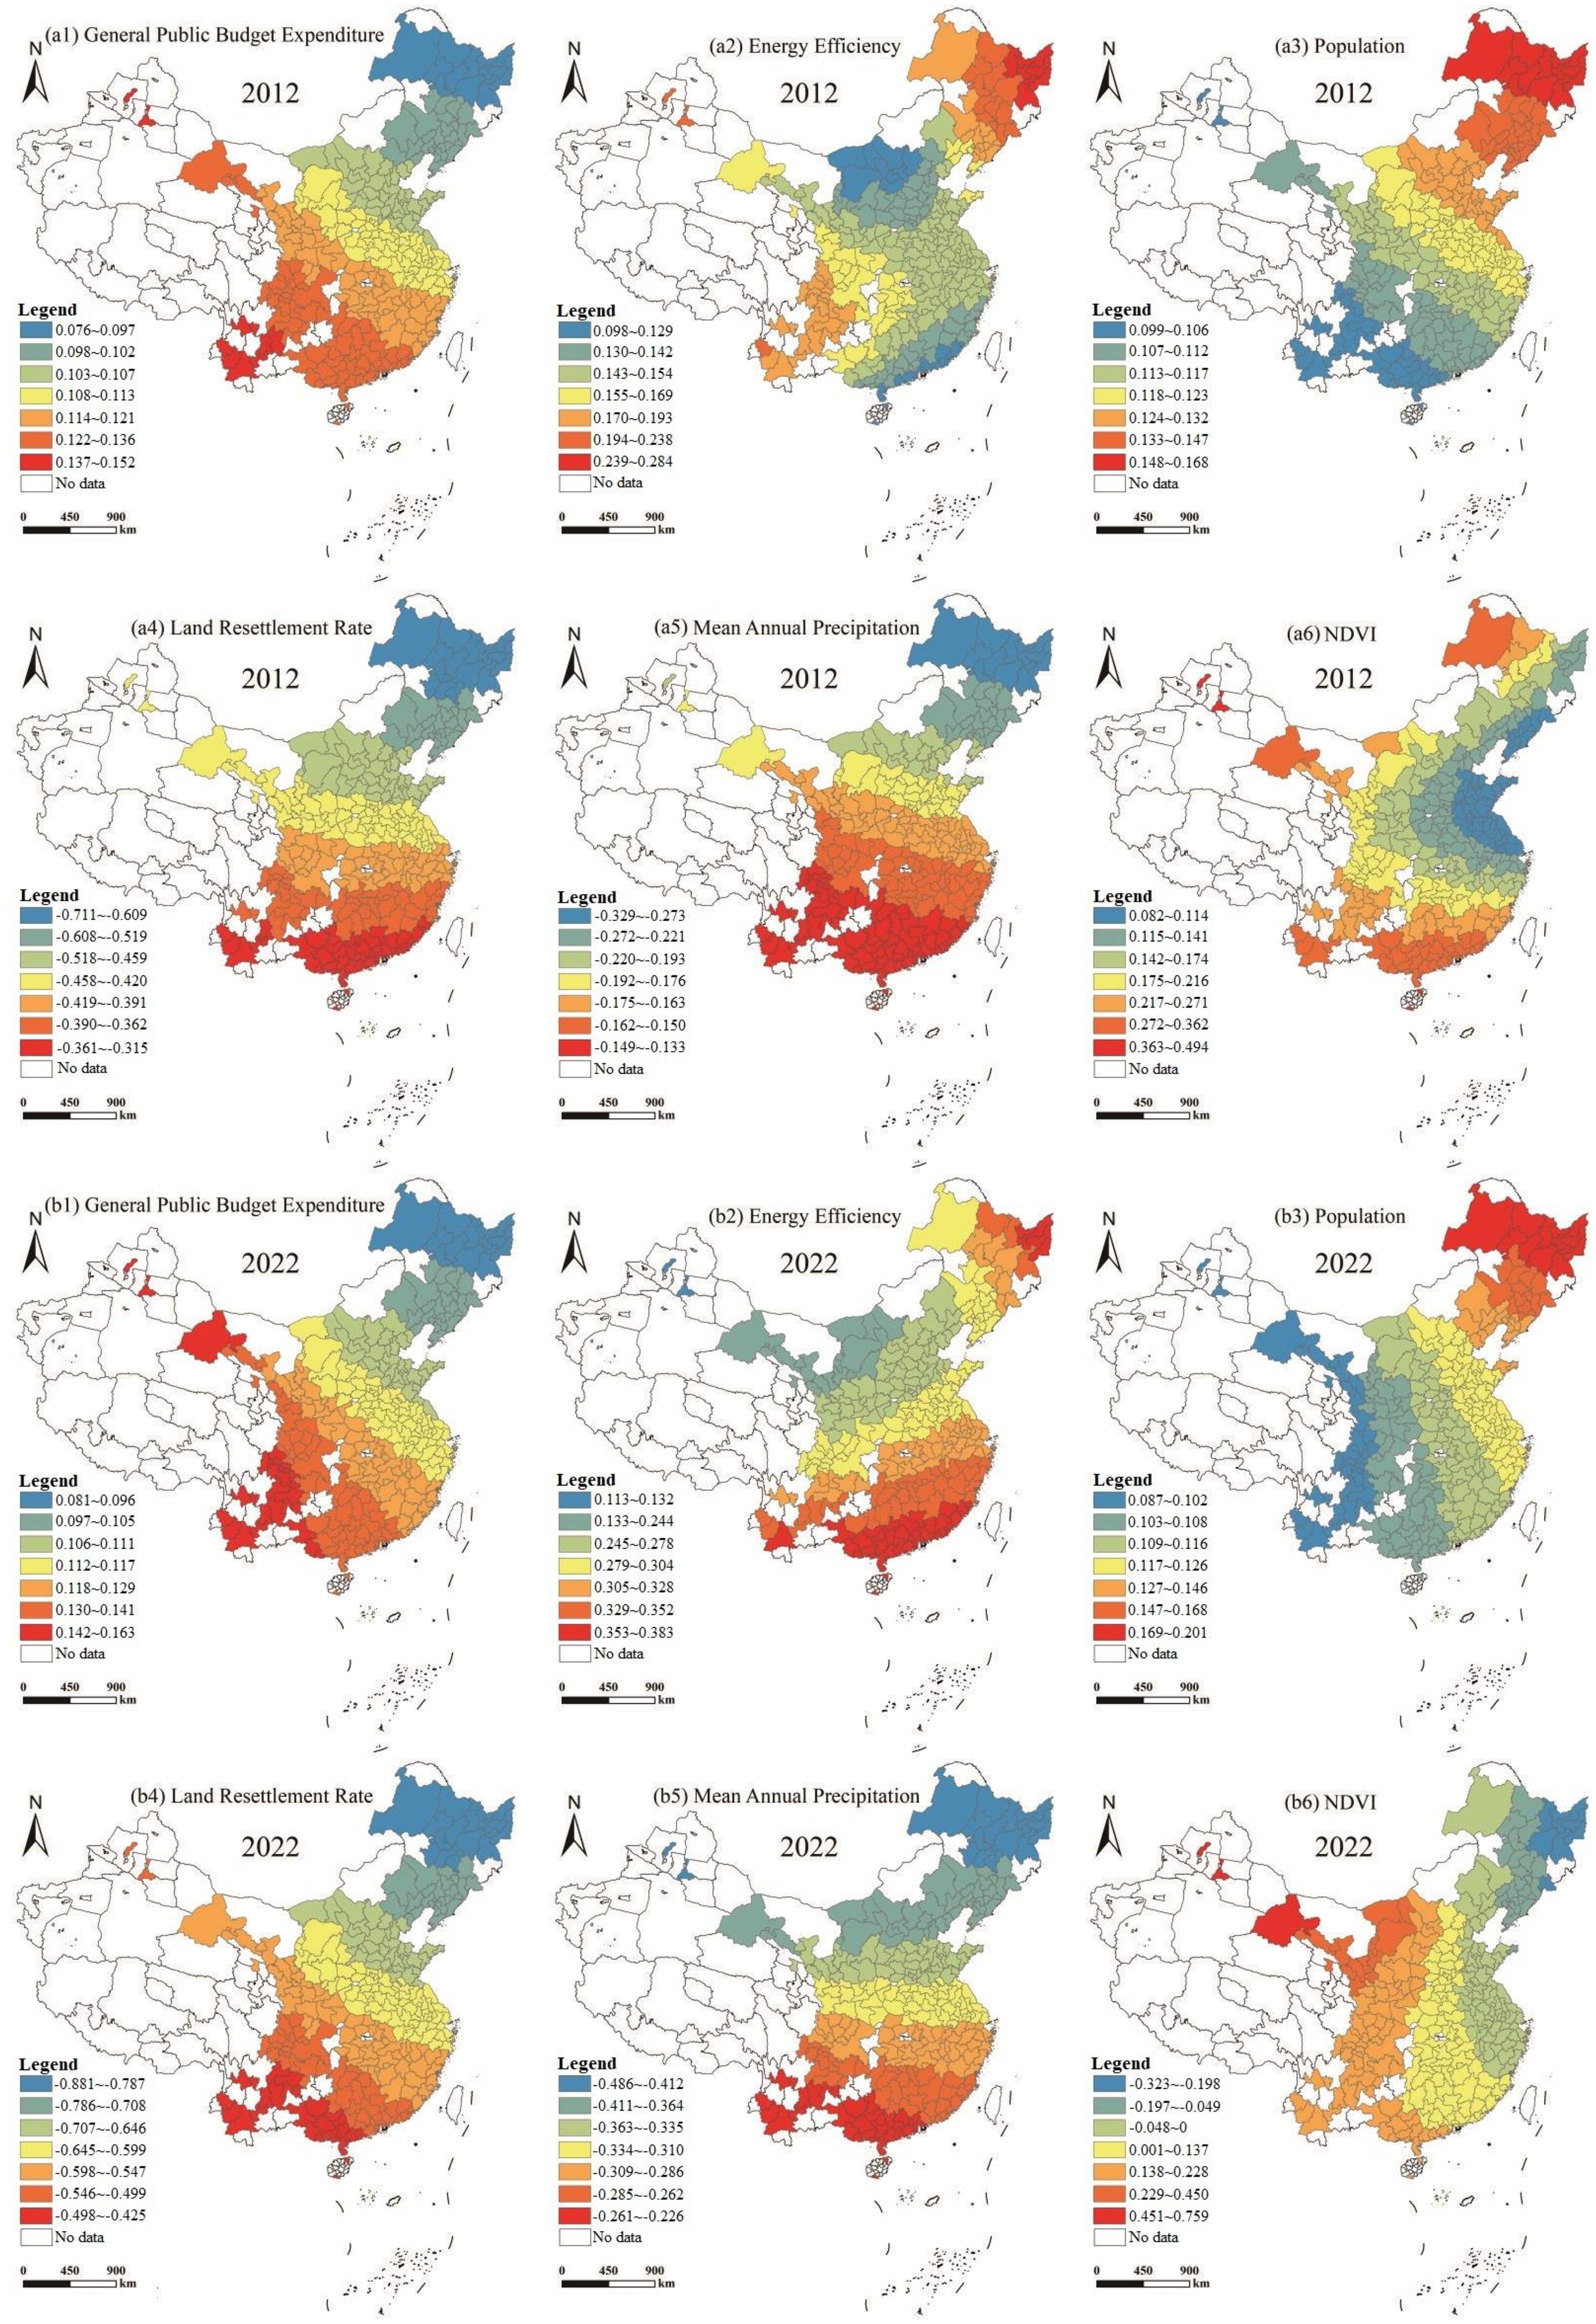
Figure 10. Estimated distribution of regression coefficients for the coordinated change in the level of coupling between land-use carbon emissions and ESV in 2012 and 2022.
Within the study period, the total land-use carbon emissions in China showed a stable growth trend, with a growth rate characterized as “slow and then fast”, and the carbon emissions from construction land use grew rapidly, with the growth amount characterized as “slow and then fast”. This conclusion is consistent with the results of Chen et al. (2019), who used the Chengdu-Chongqing urban agglomeration as the study area. Li et al. (2018) used Shaanxi Province as the study area, indicating that land use change is the key reason affecting carbon emissions and carbon source/sink patterns. Inappropriate land development will affect the carbon balance. China’s ESV experienced an inverted “N”-shaped change with a sudden decrease, followed by a slow increase and then a decrease, consistent with the findings of Liu et al. (2023), who used Southwest China as a study case. In addition, the fluctuation of the total value in the study area was related to the launch of the Western Development Strategy at the beginning of the study period, which resulted in the destruction of ecological vegetation and the decline of value due to the increase of land for construction and the occupation of cropland, woodland, and grassland (Niu et al., 2022).
The CCD of land-use carbon emissions and ESV typically exhibited a mirrored “L” shaped growth pattern. Most of the CCDs are in the intermediate and elementary coordination stage, which is consistent with the results of Shi et al.’s (2024) study on the integration and development of the “dual-carbon” goal and ecological and environmental governance in China’s provincial areas. In addition, the level of coupling coordination among the three regions is East > Central > West. The reason for this is that the cities located in the western regions of Shaanxi, Gansu, and Guizhou have higher elevations, wider distribution of grasslands, and are close to water sources such as the Yellow River and the Yangtze River, which can provide higher value of ecosystem regulation services for the local community. These regions have a stronger capacity for carbon sinks. Still, the economic contribution of carbon emissions is relatively low, i.e., the consumption and utilization rate of energy and other resources are low, and carbon emissions are relatively low. Therefore, the degree of coupling coordination of ESV and land-use carbon emissions is low (Liu et al., 2022; Fu et al., 2024; Wang et al., 2022). In contrast, the central regions of Inner Mongolia and Shanxi have a high proportion of industry, which increases energy consumption and carbon emissions. Still, due to the climatic and geographic conditions of the regions, the forested land area is widely distributed. It generates high ecological service value, so coupling land-use carbon emissions and ESV is highly coordinated (Pan et al., 2024). In addition, the eastern region, in which Beijing and Shandong are located, and the middle and lower reaches of the Yangtze River are mainly dominated by arable land. The ecological service value of this zone is generally low. Hence, the carbon absorption capacity is low. Still, the economic development is better, and there is a better industrial base to promote the transformation and upgrading of the industrial structure to a low-carbon transformation (Hu et al., 2022). At the same time, through its better scientific and technological foundation, it increases the utilization of clean energy such as natural gas, reduces the proportion of high-carbon and traditional energy, and strictly protects the ecological resources and plans to increase the ecological land to improve its carbon sink capacity, so the coupling and coordination of land-use carbon emissions and ESV is high.
There is a negative spatial correlation between land-use carbon emissions and ESV, which is consistent with the spatial relationship derived by Wang (2021) in different case study sites. In this study, we selected indicators from two dimensions, namely the socioeconomic and natural environment factors, and analyzed the influencing factors affecting the coupling and coordinating effect of land-use carbon emissions and ESV in China. The results show that the natural environment factor is the most important factor influencing the coupling and coordination degree of the two systems. Still, there are both positive and negative influences, which confirms the conclusion obtained by Wang et al. (2023) using the Yellow River Basin as a study case. The socioeconomic factor positively affects the degree of coordination of the coupling of the two systems, which is consistent with the conclusions of Wang et al. (2024) and Yuan et al. (2024), who used Ningxia and Huaihai Economic Zone as study cases, respectively.
This study investigates the spatial and temporal evolution of land-use carbon emissions and ESV in Chinese municipalities and their spatial correlation and agglomeration characteristics on a macro scale. However, there are still the following shortcomings. First, due to limited data availability, only the data of 286 cities in China were used, which fails to comprehensively reflect the levels of land-use carbon emissions and ESV in all regions of China. In addition, industrial production, living, and waste emissions were not added to the carbon emission accounting of construction land, so there are errors in the calculation results, but they do not affect the spatial and temporal analyses of the regional carbon emissions. Therefore, it is necessary to collect more comprehensive data to improve future carbon emission accounting accuracy.
First, China’s net land-use carbon emissions show steady growth in carbon emissions from 2012 to 2022. An increasing number of cities are located in energy-rich areas such as Shanxi and Inner Mongolia. In addition, the number of land-use carbon sources is much larger than that of carbon sinks. Among them, carbon emissions from construction land will grow from 250,982.136×104t in 2012 to 333,243.693×104t in 2022, an increase of 32.78% in 10 years, and the growth is characterized as “slow and then fast”, which is closely related to economic and social development. Forest land has an important carbon sink capacity, accounting for 96.82%–97.06% of the total carbon sink. During the study period, China’s ESV as a whole shows an inverted “N”-shaped fluctuating downward trend, with the total ESV decreasing from 16 538.28 billion dollars in 2012 to 16 072.91 billion dollars in 2022, with an average annual decrease of 46.54 billion dollars, and the stability of the ESV structure needs to be improved. Among them, the value of regulating services and supporting services are the main components of ESV, which together determine the overall trend of ESV. In terms of spatial distribution, ESV in the study area shows a spatial distribution pattern of high in the east and low in the west, decreasing from southeast to northwest.
Second, the coupling and coordination effect between land-use carbon emissions and ESV in China shows a mirror-image “L” shaped growth, with the average value of the coupling and coordination degree of the two systems increasing from 0.613 in 2012 to 0.621 in 2022 and most of the coupling and coordination grades are at the stage of intermediate and primary coordination. The coordinated development of the two systems still needs to be further strengthened. The coupling coordination level of the three regions is mostly in the intermediate and primary coordination stages, and the development of coordination among systems still needs to be further enhanced. The ranking of the coupling coordination level of the three regions is East>Central>West. From the perspective of spatial distribution, the coupling and coordination degree of land-use carbon emission and ESV shows a distribution characteristic of “high in the north and low in the south”, especially in Hulunbeier and Chifeng in North China, with obvious polar nucleus characteristics. Overall, the coupling and coordination degree of the two systems fluctuates and rises from 2012 to 2022, with the high-value areas mainly concentrated in Inner Mongolia in North China and Chongqing in Southwest China; the low-value areas are mainly distributed in the central region; the high-value areas tends to expand, the low-value areas tends to contract, and the change of spatial distribution pattern is relatively small.
Third, a significant negative spatial correlation exists between land-use carbon emissions and ESV, which passes the P-value test. The “high-high” category is mainly distributed in North China; the “high-low” category is mainly concentrated in Chongqing; the “low-low” category is mainly concentrated in Zigong and Leshan in Southwest China. The “high-low” category is mainly concentrated in Zigong and Leshan in Southwest China. The effects of each factor on the coupling coordination between land-use carbon emissions and ESV showed significant spatial heterogeneity. From the GWR model, the influence intensity of each factor was derived, and the ranking of the absolute values of the influence intensity of each factor on the coupled coordination degree of the two systems are as follows: land resettlement rate > NDVI > average annual precipitation > energy utilization efficiency > total population > general budget expenditure of local finance. Among them, the three socioeconomic factors, namely, general budget expenditure of local finance, energy utilization efficiency, and total population, positively influence the coupling and coordination of land-use carbon emission and ESV. Land resettlement rate and average annual precipitation are the main factors leading to a decrease of coupling coordination, and both of them show negative effects in the study area, while NDVI has both positive and negative effects on coupling coordination.
Based on the conclusions above, the following suggestions are made for related development practices:
1. Reduce the intensity of energy carbon emissions and enhance the capacity for ecosystem restoration. By promoting the energy consumption revolution, the proportion of green and low-carbon energy sources, such as coalbed methane, in the energy consumption structure should be greatly increased to achieve the purpose of carbon and emission reduction. This will continue to strengthen ecological protection and ecological restoration, enhance ESV, and continuously improve the carbon sink capacity of ecosystems by strengthening ecological resilience.
2. Actively buttress major national regional strategies, promote the organic integration of various policies and measures, comprehensively consider regional development differences, and formulate differentiated strategies to construct ecological functional zones and low-carbon development according to local conditions based on resource endowments and regional economic conditions.
3. Strengthen restrictions on the expansion of construction land area, enhance the intensive utilization of land resources, reasonably increase the area of watersheds and forests, increase carbon sinks, protect ecosystems, and improve ESV to promote high-quality regional development to achieve the goal of carbon neutrality.
The original contributions presented in the study are included in the article/supplementary material. Further inquiries can be directed to the corresponding authors.
SZ: Conceptualization, Methodology, Software, Visualization, Writing – original draft, Writing – review & editing. ZY: Conceptualization, Formal Analysis, Investigation, Visualization, Writing – review & editing. WL: Conceptualization, Formal Analysis, Investigation, Resources, Software, Supervision, Validation, Visualization, Writing – review & editing.
The author(s) declare that no financial support was received for the research and/or publication of this article.
The authors declare that the research was conducted in the absence of any commercial or financial relationships that could be construed as a potential conflict of interest.
The author(s) declare that no Generative AI was used in the creation of this manuscript.
All claims expressed in this article are solely those of the authors and do not necessarily represent those of their affiliated organizations, or those of the publisher, the editors and the reviewers. Any product that may be evaluated in this article, or claim that may be made by its manufacturer, is not guaranteed or endorsed by the publisher.
Akhtar M., Zhao Y., Gao G. L., Gulzar Q., Hussain A., Samie A. (2020). Assessment of ecosystem services value in response to prevailing and future land use/cover changes in Lahore, Pakistan. Reg. Sustainabil. 1, 37–47. doi: 10.1016/j.regsus.2020.06.001
Anselin L. (1995). Local indicators of spatial association-LISA. Geograph. Anal. 27, 93–115. doi: 10.1111/j.1538-4632.1995.tb00338.x
Arowolo A. O., Deng X. Z., Olatunji O. A., Obayelu A. E. (2018). Assessing changes in the value of ecosystem services in response to land-use/land-cover dynamics in Nigeria. Sci. Total Environ. 636, 597–609. doi: 10.1016/j.scitotenv.2018.04.277
Cao Z. L., Zhang X. R., Yuan X. F., Chen J. H. (2022). Spatio-temporal variation and influencing factors of CO2 emission at county scale in Shaanxi province based on land use change. Bull. Soil Water Conserv. 42, 376–385. doi: 10.13961/j.cnki.stbctb.2022.05.045
Chen W. X., Chi G. Q., Li J. F. (2019). The spatial association of ecosystem services with land use and land cover change at the County level in ChinChina 1995-2015. Sci. Total Environ. 669, 459–470. doi: 10.1016/j.scitotenv.2019.03.139
Chen Y., Lu H., Li J., Xia J. (2020). Effects of land use cover change on carbon emissions and ecosystem services in Chengyu urban agglomeration, China. Stochas. Environ. Res. Risk Assess. 34, 1–19. doi: 10.1007/s00477-020-01819-8
Chuai X. W., Huang X. J., Wang W. J., Zhao R. Q., Zhang M., Wu C. Y. (2015). Land use, total carbon emissions change and low carbon land management in Coastal Jiangsu, China. J. Clean. Product. 103, 77–86. doi: 10.1016/j.jclepro.2014.03.046
Costanza R., d'Arge R., De Groot R., Farber S., Grasso M., Hannon B., et al. (1997). The value of the world's ecosystem services and natural capital. Nature 387 (6630), 253–260. doi: 10.1038/387253a0
Dai Q., Liu X. Y., Sun F. Y., Reb F. R. (2024). Ensemble intelligence prediction algorithms and land use scenarios to measure carbon emissions of the Yangtze River Delta: A machine learning model based on Long Short-Term Memory. PloS One 19, 1–27. doi: 10.1371/journal.pone.0311441
Ding C. T. J., Chen H., Liu Y., Hu J., Hu M. J., Chen D., et al. (2024). Unleashing digital empowerment: Pioneering low-carbon development through the broadband China strategy. Energy 295, 131034. doi: 10.1016/j.energy.2024.131034
Ding J., Liu B. L., Shao X. F. (2022). Spatial effects of industrial synergistic agglomeration and regional green development efficiency: Evidence from China. Energy Econ. 112, 106156. doi: 10.1016/j.eneco.2022.106156
Dong F., Yu B. L., Hadachin T., Dai Y. J., Wang Y., Zhang S. N., et al. (2018). Drivers of carbon emission intensity change in China. Res. Conserv. Recycl. 129, 187–201. doi: 10.1016/j.resconrec.2017.10.035
Fan J. S., Yu X. F., Zhou L. (2018). Carbon emission efficiency growth of land use structure and its spatial correlation: A case study of Nanjing city. Geograph. Res. 37, 2177–2192. doi: 10.11821/dlyj201811005
Feng W., Zhao R. Q., Xie Z. X., Ding M. L., Xiao L. G., Sun J., et al. (2023). Land use carbon emission efficiency and its spatial-temporal pattern under carbon neutral target: a case study of 72 cities in the Yellow River Basin. China Land Sci. 37, 102–113. doi: 10.11994/zgtdkx.20230109.100514
Fu H. Y., Cai M. M., Jiang P. H., Fei D., Liao C. (2024). Spatial multi-objective optimization towards low-carbon transition in the Yangtze River Economic Belt of China. Landscape Ecol. 39, 1–26. doi: 10.1007/s10980-024-01941-w
Goldewijk K. K., Ramankutty N. (2004). Land cover change over the last three centuries due to human activities: the availability of new global data sets. GeoJournal 61, 335–344. doi: 10.1007/s10708-004-5050-z
He Q. S., Zeng C., Xie P., Liu Y. L., Zhang M. K. (2018). An assessment of forest biomass carbon storage and ecological compensation based on surface area: A case study of Hubei Province, China. Ecol. Indic. 90, 392–400. doi: 10.1016/j.ecolind.2018.03.030
Hu Y. C., Liu Y., Li C. Y. (2022). Multi-scenario simulation of land use change and ecosystem service value in the middle reaches of Yangtze river urban agglomeration. Sustainability 14, 1–13. doi: 10.3390/su142315738
Li Y. C., Liu W., Feng Q., Zhu M., Yang L. S., Zhang J. T., et al. (2022). The role of land use change in affecting ecosystem services and the ecological security pattern of the Hexi Regions, Northwest China. Sci. Total Environ. 855, 1–19. doi: 10.1016/j.scitotenv.2022.158940
Li X., Liu Z. S., Li S. J., Li Y. X., Wang W. Y. (2023). Urban land carbon emission and carbon emission intensity prediction based on patch-generating land use simulation model and grid with multiple scenarios in Tianjin. Land 12, 1–22. doi: 10.3390/land12122160
Li H. C., Su Y. Q., Ding C. J., Tian G. G., Wu Z. (2024). Unveiling the green innovation paradox: Exploring the impact of carbon emission reduction on corporate green technology innovation. Technol. Forecast. Soc. Change 207, 123562. doi: 10.1016/j.techfore.2024.123562
Lin F. Z., Shao Y., Guo H. B., Yan R. H., Wang C., Zhao B. L. (2024). Carbon emissions and intensity of land use: A rural setting analysis in Ningde city, China. Land 13, 767–795. doi: 10.3390/land13060767
Lin Q. W., Zhang L., Qiu B. K., Zhao Y., Wei C. (2021). Spatiotemporal analysis of land use patterns on carbon emissions in China. Land 10, 141–155. doi: 10.3390/land10020141
Liu B. L., Ding C. J., Ahmed A. D., Huang Y. J., Su Y. Q. (2024). Carbon emission allowances and green development efficiency. J. Clean. Product. 463, 142246. doi: 10.1016/j.jclepro.2024.142246
Liu D., Liu W., He Y. (2024). How does the intensive use of urban construction land improve carbon emission efficiency?—Evidence from the panel data of 30 provinces in China. Land 13, 2133. doi: 10.3390/land13122133
Liu H., Shu C., Zhou T., Peng L. (2021). Trade-off and synergy relationships of ecosystem services and driving force analysis based on land cover change in Altay prefecture. J. Resour. Ecol. 12, 777–790. doi: 10.5814/j.issn.1674-764x.2021.06.006
Liu J. H., Shi T. L., Huang L. C. (2022). A Study on the Impact of Industrial Restructuring on Carbon Dioxide Emissions and Scenario Simulation in the Yellow River Basin[J]. Water 14(23), 1–17.
Liu X. B., Wang Y. K., Liu Q., Li Z. Y. (2023). Tradeoffs-synergies analysis of ecosystem services along urbanization gradient in Southwest China. Acta Ecol. Sin. 43, 9416–9429. doi: 10.20103/j.stxb.202210032804
Lv G. N., Xiong L. Y., Chen M., Tang G. A., Sheng Y. H., Liu X. J., et al. (2017). Chinese progress in geomorphometry. J. Geograph. Sci. 27, 1389–1412. doi: 10.1007/s11442-017-1442-0
Ma H. L., Jing Y. Q., Pang Q. H. (2020). Utilization change of lake and its carbon emission in Wuhan city. Resour. Environ. Yangtze Basin 29, 369–375. doi: 10.11870/cjlyzyyhj202002009
Mo H. B., Wang S. J. (2021). Spatio-temporal evolution and spatial effect mechanism of carbon emission at county level in the Yellow River Basin. Scientia Geogr. Sin. 41, 1324–1335. doi: 10.13249/j.cnki.sgs.2021.08.003
Niu L. N., Shao Q. Q., Ning J., Huang H. B. (2022). Ecological changes and the trade-off and synergy of ecosystem services in western China. J. Geograph. Sci. 32, 1059–1075. doi: 10.1007/s11442-022-1985-6
Pan H. H., Du Z. Q., Wu Z. Q., Zhang H., Ma K. M. (2024). Building ecosystem services-based ecological networks in energy and chemical industry areas. Ecol. Model. 498, 1–11. doi: 10.1016/j.ecolmodel.2024.110897
Peng W. F., Zhou J. M., Xu X. L., Luo H. L., Zhao J. F., Yang C. J. (2016). Effect of land use changes on the temporal and spatial patterns of carbon emissions and carbon footprints in the Sichuan province of Western China, from 1990 to 2010. Acta Ecol. Sin. 36, 7244–7259. doi: 10.5846/STXB201506111188
Rong T. Q., Zhang P. Y., Li G. H., Wang Q. X., Zheng H. T., Chang Y. H., et al. (2022). Spatial correlation evolution and prediction scenario of land use carbon emissions in the Yellow River Basin. Ecol. Indic. 71, 1–14. doi: 10.1016/j.ecolind.2023.110701
Shi C. Y., Chen J. Y., Chi X. (2024). Integration and development of ‘Dual carbon’ Targets and ecological and environmental governance under coupling mechanisms. Stat Decis. 40, 74–79. doi: 10.13546/j.cnki.tjyjc.2024.13.013
Song W., Deng X. Z. (2017). Land-use/land-cover change and ecosystem service provision in China. Sci. Total Environ. 576, 705–719. doi: 10.1016/j.scitotenv.2016.07.078
Su Y. Q., Tian G. G., Li H. C., Ding C. J. (2024). Climate risk and corporate energy strategies: Unveiling the Inverted-N relationship. Energy 310, 132968. doi: 10.1016/j.energy.2024.132968
Sun X., Li F. (2017). Spatiotemporal assessment and trade-offs of multiple ecosystem services based on land use changes in Zengcheng, China. Sci. Total Environ. 609, 1569–1581. doi: 10.1016/j.scitotenv.2017.07.221
Tang W. W., Cui L. H., Zheng S., Hu W. (2022). Multi-scenario simulation of land use carbon emissions from energy consumption in Shenzhen, China. Land. 11, 3–20. doi: 10.3390/land11101673
Wang B. Y. (2021). Spatial relationship between land-use carbon emissions and ecosystem service values. China Water Transport 21, 77–78.
Wang J. F., Li L. F., Li Q., Wang S., Liu X. L., Li Y. (2022). The spatiotemporal evolution and prediction of carbon storage in the Yellow River basin based on the major function-oriented zone planning. Sustainability 14, 1–18. doi: 10.3390/su14137963
Wang X., Zhao X., Zhang S., Shi S., Zhang X. (2023). Decoupling effect and driving factors of land-use carbon emissions in the Yellow River Basin using remote sensing data. Remote Sensing 15 (18), 4446. doi: 10.3390/rs15184446
Wang Y. J., Zhai C. X., Liu C. Y., Chen Z. Y. (2024). Analysis of spatiotemporal differences and influencing factors of land use carbon emissions in Ningxia. Environ. Sci. 45, 5049–5059. doi: 10.13227/j.hjkx.202310111
Wu X., Liu H., Liu W. (2024). Exploring the spatiotemporal evolution dynamic and influencing factor of green ecology transition for megacities: A case study of Chengdu, China. Ecol. Indic. 158, 111285. doi: 10.1016/j.ecolind.2023.111285
Wu J. X., Wu Y. R., Guo X. M., Cheong T. S. (2016). Convergence of carbon dioxide emissions in Chinese cities: A continuous dynamic distribution approach. Energy Policy 91, 207–219. doi: 10.1016/j.enpol.2015.12.028
Xi F. M., Liang W. J., Niu M. F., Wang J. Y. (2016). Carbon emissions and low-carbon regulation countermeasures of land use change in the city and town concentrated area of central Liaoning Province, China. Chin. J. Appl. Ecol. 27, 577–584. doi: 10.13287/j.1001-9332.201602.002
Xiao P. N., Zhang Y., Qian P., Lu M. Y., Yu Z. P., Xu J. (2022). Spatiotemporal characteristics, decoupling effect and driving factors of carbon emission from cultivated land utilization in Hubei province. Int. J. Environ. Res. Public Health 19, 3–36. doi: 10.3390/ijerph19159326
Xiong Y., Zhang F. M., Gong C. A., Luo M. (2018). Spatial-temporal evolvement of ecosystem service value in Hunan province based on LUCC. Resour. Environ. Yangtze Basin 27, 1397–1408. doi: 10.11870/cjlyzyyhj201806024
Xu Q., Dong Y. X., Yang R. (2018). Urbanization impact on carbon emissions in the Pearl River Delta region: Kuznets curve relationships. J. Clean. Product. 180, 514–523. doi: 10.1016/j.jclepro.2018.01.194
Yang J., Xie B., Zhang D. (2022). Spatial–temporal evolution of ESV and its response to land use change in the Yellow River Basin, China. Sci. Rep. 12, 13103. doi: 10.1038/s41598-022-17464-w
Yin C., He Q., Xie P., Liu Y. F., Zhang Y., Chen W. Q., et al. (2023). Spatiotemporal variation of the ecosystem service value in China based on surface area. Ecol. Indic. 148, 110067. doi: 10.1016/j.ecolind.2023.110067
Yu Z. Q., Chen L. Q., Tong H. X., Chen L. G., Zhang T., Li L., et al. (2022). Spatial correlations of land-use carbon emissions in the Yangtze River Delta region: A perspective from social network analysis. Ecol. Indic. 142, 1–15. doi: 10.1016/j.ecolind.2022.109147
Yu Z., Liu W., Ren Q., et al. (2024). Analysis of the coordinated evolution and driving mechanism of the coupling of tourism economy and urbanization in Southwest China. Curr. Issues Tour. 28, 891–909. doi: 10.1080/13683500.2024.2309154
Yuan J. X., Fang B., Kan H. Y., Kan H. Y., He S. S. (2024). Multi-scenario simulation of carbon emission intensity and ecological profit and loss from the perspective of nature and economy in Huaihai Economic Zone. Acta Ecol. Sin. 44, 2199–2215. doi: 10.20103/j.stxb.202303240566
Yuan S. F., Zhu C. M., Yang L. X., Xie F. H. (2019). Responses of ecosystem services to urbanization-induced land use changes in ecologically sensitive suburban areas in Hangzhou, China. Int. J. Environ. Res. Public Health 16, 1124–1138. doi: 10.3390/ijerph16071124
Zhang W. J., Xu H. Z. (2017). Effects of land urbanization and land finance on carbon emissions: A panel data analysis for Chinese provinces. Land Use Policy 63, 493–500. doi: 10.1016/j.landusepol.2017.02.006
Zhang R. J., Yu K. H., Luo P. P., Chaplot V. (2024). Spatio-temporal relationship between land use carbon emissions and ecosystem service value in Guanzhong, China. Land 13, 118–130. doi: 10.3390/land13010118
Zhao X. C., Tian Y. D., Zhang X. X. (2023). Spatio-temporal relationship between land use carbon emissions and ecosystem service value in Changzhutan urban agglomeration. J. Soil Water Conserv. 37, 215–225. doi: 10.13870/j.cnki.stbcxb.2023.05.026
Zhou Q., Gui F., Zhao B., Liu J. Y., Cai H. W., Xu K. D., et al. (2024). Examining the social costs of carbon emissions and the ecosystem service value in island ecosystems: An analysis of the Zhoushan archipelago. Sustainability 16, 923–943. doi: 10.3390/su16020932
Keywords: land-use carbon emissions, ecosystem service value, coupling coordination degree, influencing mechanisms, geographically weighted regression models, spatial autocorrelation
Citation: Zhao S, Yu Z and Liu W (2025) Revealing the spatio-temporal coupling coordination characteristics and influencing factors of carbon emissions from urban use and ecosystem service values in China at the municipal scale. Front. Ecol. Evol. 13:1539909. doi: 10.3389/fevo.2025.1539909
Received: 05 December 2024; Accepted: 26 February 2025;
Published: 27 March 2025.
Edited by:
Pier Luigi Sacco, University of Studies G. d’Annunzio Chieti and Pescara, ItalyReviewed by:
Chante Jian Ding, University of Malaya, MalaysiaCopyright © 2025 Zhao, Yu and Liu. This is an open-access article distributed under the terms of the Creative Commons Attribution License (CC BY). The use, distribution or reproduction in other forums is permitted, provided the original author(s) and the copyright owner(s) are credited and that the original publication in this journal is cited, in accordance with accepted academic practice. No use, distribution or reproduction is permitted which does not comply with these terms.
*Correspondence: Zhengyong Yu, eXV6aGVuZ3lvbmdAc3R1LnludS5lZHUuY24=; Wei Liu, eHVlc2h1MjAxOWx3QDE2My5jb20=
Disclaimer: All claims expressed in this article are solely those of the authors and do not necessarily represent those of their affiliated organizations, or those of the publisher, the editors and the reviewers. Any product that may be evaluated in this article or claim that may be made by its manufacturer is not guaranteed or endorsed by the publisher.
Research integrity at Frontiers
Learn more about the work of our research integrity team to safeguard the quality of each article we publish.