 Aditya Gupta
 Matthew V. Bilskie
 C. Brock Woodson
- School of Environmental, Civil, Agricultural, and Mechanical Engineering, University of Georgia, Athens, GA, United States
A critical aspect of coastal protection is the role of barrier islands and wetlands in mitigating storm surges. However, the level of protection offered by these natural features can vary based on their geographical characteristics and the storms they face. This study focuses on quantifying the attenuation capacity of the Apalachicola Bay barrier island and coastal wetland system using a novel approach that delineates watersheds to calculate localized water elevation attenuation rates, incorporating spatially varying bed roughness and complex channel-marsh networks. We simulated storm surge dynamics using the ADvanced CIRCulation (ADCIRC) model under multiple configurations, including entire barrier island presence, selective island removal, the absence of all islands, and scenarios with and without marsh vegetation. The study introduces an attenuation rate function based on the prediction factor that improves surge attenuation modeling by integrating real-world scenarios with idealized theoretical functions. Additionally, we derive a theoretical maximum attenuation rate curve to calculate the highest achievable rate of storm surge reduction in Apalachicola Bay, providing a benchmark for the landscape’s full attenuation potential. The findings of this study underscore the importance of integrating wetlands and barrier islands into coastal protection strategies. Insights from this study can guide restoration efforts, particularly in the context of barrier islands and marshlands, to enhance resilience against increasing storm surge threats.
1 Introduction
Coastal flooding and storm surges, posing risks to coastal communities, are not just a future concern but a pressing issue of our time. The economic damages, estimated at billions of dollars annually, and the loss of life they cause (Bridges et al., 2015; Saleh and Weinstein, 2016) are a stark reminder of this urgency. In the United States alone, hurricanes and storm surges caused an average annual damage of $54 billion between 2000 and 2019 (Congressional Budget Office (CBO), 2019). In 2023, the U.S. experienced several major storms, including Hurricane Idalia, which caused $3.6 billion in damages (National Oceanic and Atmospheric Administration (NOAA), 2023). As these events become more frequent and severe due to climate change and rising sea levels, the need for effective coastal defense mechanisms becomes increasingly urgent (IPCC, 2019).
Natural and nature-based features (NNBF), such as barrier islands and marshes, have emerged as solutions for flood risk mitigation. These features, created and evolved through physical, geological, biological, and chemical processes, can be harnessed or enhanced to provide specific services such as coastal risk reduction, habitat provision, and ecosystem services. These services include storm surge protection and wave attenuation, making NNBF a versatile and practical solution (Bridges et al., 2015; Narayan et al., 2016; Temmerman et al., 2013). For instance, coastal wetlands in the northeastern USA are estimated to provide storm protection valued at $625 million annually (Narayan et al., 2017). Building on the concept of NNBF, nature-based solutions (NbS) refer to the sustainable management and use of natural features and processes to increase resilience to climatological and environmental stress and change while providing benefits for human well-being and biodiversity (Nelson et al., 2020). NbS also includes restoring ecosystems and enhancing natural processes in modified or man-made areas (Browder et al., 2019). These solutions often involve constructing dunes, marshes, barrier islands, and reefs that protect coastal communities against storms (Whelchel et al., 2018; Sutton-Grier et al., 2015). For example, marshes can reduce storm surge heights, dissipate wave energy, trap sediments, stabilize shorelines, and protect inland areas from flooding (Shepard et al., 2011; Barbier et al., 2013). Similarly, barrier islands, a key component of NNBF, play a critical role in coastal defense by acting as physical buffers that absorb wave energy and mitigate the impact of storm surges on coastal communities (Grzegorzewski et al., 2011). These natural defenses are often more cost-effective and sustainable than gray infrastructure solutions, such as seawalls and levees, which can be expensive to build and maintain and may have adverse environmental impacts if they fail (van Rees et al., 2023; Narayan et al., 2016; Gupta et al., 2022).
Integrating NNBF and NbS into coastal management practices represents a paradigm shift toward more sustainable and resilient approaches to addressing coastal hazards (Palinkas et al., 2022). However, despite the recognized theoretical benefits of natural features in storm surge attenuation, their real-world effectiveness across various storm scenarios and coastal configurations remains under-researched (Temmerman et al., 2013). The effectiveness of these features, such as salt marshes and barrier islands, varies significantly depending on their geographic and ecological characteristics and the nature of the storm surges they encounter. To accurately assess the protective benefits of natural coastal features, it is essential to quantify the attenuation rates of storm surges across different coastal ecosystems. This quantification allows researchers, policymakers, and practitioners to understand the effectiveness of these natural defenses in reducing storm surge heights to mitigate coastal hazards. Integrating coastal management strategies that effectively leverage these natural features can be developed by systematically measuring how ecosystems perform under various storm conditions.
Salt marshes, for instance, can reduce wave heights by up to 50% over short distances, though the effectiveness of this attenuation can vary based on factors such as vegetation density, type, elevation, and geomorphological structure (Shepard et al., 2011; Möller et al., 2014; Gupta and Behera, 2024). In northern Germany, salt marshes were shown to reduce wave heights by 18% over a distance of 40 meters, with 60% of this reduction attributed to marsh plants (Möller et al., 2014). Coastal wetlands can reduce storm surge levels from 1 meter per 50 kilometers to 1 meter per 6 kilometers of wetland, underscoring the importance of wetland restoration in coastal protection (Wamsley et al., 2010).
Attenuation rates during major hurricanes have been documented in various locations. For instance, during Hurricane Charley (2004) in Florida, attenuation rates were found to be between 9.4 and 15.8 cm/km, while rates during Hurricane Wilma (2005) varied from 4.0 to 6.9 cm/km (Krauss et al., 2009). Additionally, attenuation rates varying from -2 to 70 cm per kilometer have been observed under different tidal conditions, including marsh tides, over marsh tides, and storm tides during moderate and severe storms (Stark et al., 2015). During Hurricane Rita (2005), marsh attenuation rates in Louisiana varied substantially, with values ranging from 4.0 cm/km to 25.0 cm/km depending on local conditions (McGee et al., 2006; Wamsley et al., 2010). This variability of attenuation rates highlights the need for a comprehensive approach to coastal management by developing accurate models that can predict attenuation rates by integrating site-specific assessments.
Several studies have also quantified the impacts of restoring or degrading barrier islands and marshes on storm surge attenuation. Restoration of marshes and barrier islands can reduce storm surge by up to 0.5 meters, while degraded conditions might increase surge by as much as 1.5 meters (Wamsley et al., 2009). Loss of barrier islands has been shown to lead to increased storm surge in adjacent bays, with modeled results indicating a 24% increase in surge heights when barrier islands deteriorate (Stone et al., 2005). In Louisiana and Mississippi, restored barrier islands can reduce wave heights by up to 90% and peak storm surge by 12%, whereas degraded islands might increase wave heights by as much as 495% and peak storm surge by 12% (Grzegorzewski et al., 2009).
The sensitivity of storm surge responses to wetland characteristics underscores the importance of spatial scaling and mesh resolution in hydrodynamic modeling studies. High-resolution models accurately representing the complex topography and vegetation structure of coastal wetlands and adjacent landscapes are crucial for reliable predictions. Finer mesh resolutions improve the accuracy of surge attenuation predictions by accounting for the detailed interactions between storm surges and wetland features (Loder et al., 2009). Including high-resolution spatial data in hydrodynamic models can better capture the complex interactions between water flow and marsh vegetation, leading to more precise predictions of storm surge attenuation. Storm surge responses show high sensitivity to wetland characteristics, such as vegetation density and marsh topography, emphasizing the importance of spatial scaling in hydrodynamic modeling to accurately reflect the heterogeneous nature of wetland environments, which is crucial for reliable surge attenuation predictions (Lawler et al., 2016).
Theoretical models of idealized coastal landscapes have enhanced our understanding of water level attenuation across coastal wetlands. Despite these advances, research gaps remain. One major gap is the need for a prediction factor to estimate peak water level attenuation in real-world salt marsh systems, considering spatially varied bed roughness, branched channels, alongshore marsh extents, and marsh platform slope (Hewageegana et al., 2022) emphasized the necessity for such predictive tools. While theoretical models have provided valuable insights, they often simplify the complex dynamics of actual coastal landscapes. Many existing studies, along with what has been discussed here, have been limited to either wetlands or barrier islands in isolation, failing to capture the interactive and combined effects of these features in mitigating storm surges. Building on this research, our study aims to bridge the gap in understanding the interaction between barrier islands and wetland marshes in mitigating storm surge impacts, specifically total water levels. We focus on the Apalachicola Bay region in Florida, characterized by several barrier islands and an extensive coastal marsh. Using the Advanced Circulation (ADCIRC) model (Luettich et al., 1992), as described in Section 2: Numerical Experimental Setup, detailed numerical simulations were conducted to explore the impact of various storm surge scenarios on this ecosystem, integrating barrier island dynamics with wetland attenuation processes. This approach provides a more holistic understanding of storm surge dynamics in the region. It contributes to developing effective storm surge defense mechanisms, moving beyond the limitations of theoretical models of idealized coastal landscapes.
Our study improves upon the multivariate scaling relationship of (Hewageegana et al., 2022) by integrating high-resolution numerical simulations and theoretical models, as described in Section 3:Methods, offering a more accurate representation of storm surge attenuation within a real-world context. The proposed prediction factor, as discussed in Section 4:Results and Discussion, accounts for spatial variations and the geographical complexities of coastal features. It highlights the importance of maintaining, preserving, and restoring natural features such as barrier islands and coastal wetlands to exploit their protective benefits. Specifically, we aim to:
1. Quantify the attenuation of storm surges provided by barrier islands and marshlands to understand their protective role.
2. Propose an attenuation rate function due to storm surge based on the prediction feature and calculate the maximum attenuation capacity for the Apalachicola wetlands.
2 Numerical experiment setup
2.1 Study area and model domain
The study area is the Apalachicola Bay region within the Big Bend region of Florida (Figure 1A). Apalachicola Bay covers an area of 260 km2 with an average depth of 2.2 m (Mortazavi et al., 2000). The marshes surrounding Apalachicola Bay are predominantly big cordgrass (Spartina cynosuroides), smooth cordgrass (Spartina alterniflora), and black needle rush (Juncus roemerianus) (Livingston et al., 1974). The Apalachicola River’s lower marsh areas are mostly natural wetlands that have experienced minimal human impact (Tahsin et al., 2016). The elevation across the marsh surfaces ranges from 0.1 to 1.2 m NAVD88. Three barrier islands encapsulate Apalachicola Bay: St. George, St. Vincent, and Dog Island. This area experiences frequent impacts from tropical cyclones (Tahsin et al., 2016; Bilskie et al., 2016) and along with its barrier island and vast salt marsh habitat, provides an excellent study area to investigate these natural features as natural coastal defense systems. The unstructured mesh used in this study spans the western North Atlantic Ocean to the 60-degree W Meridian (Figure 1B).

Figure 1. Bathymetry and Topography (m, NAVD88) of unstructured finite element mesh for (A) Apalachicola Bay (Study area) and (B) Complete domain to capture hydrodynamic interactions.
The resolution of the mesh varies from several kilometers in the deep ocean to hundreds of meters on the continental shelf and down to tens of meters in the marshes, floodplains, and channels of our study region (Figure 2). Near the barrier islands, mesh sizes are as fine as 70 meters. In Apalachicola Bay, the element size in the marshes and floodplain is at most 200 meters and 50 meters, respectively, and they are further reduced to 10 meters in the small-scale channels, such as the tributaries of the Apalachicola River. The mesh consists of 713,000 nodes and 1,415,634 triangular elements.
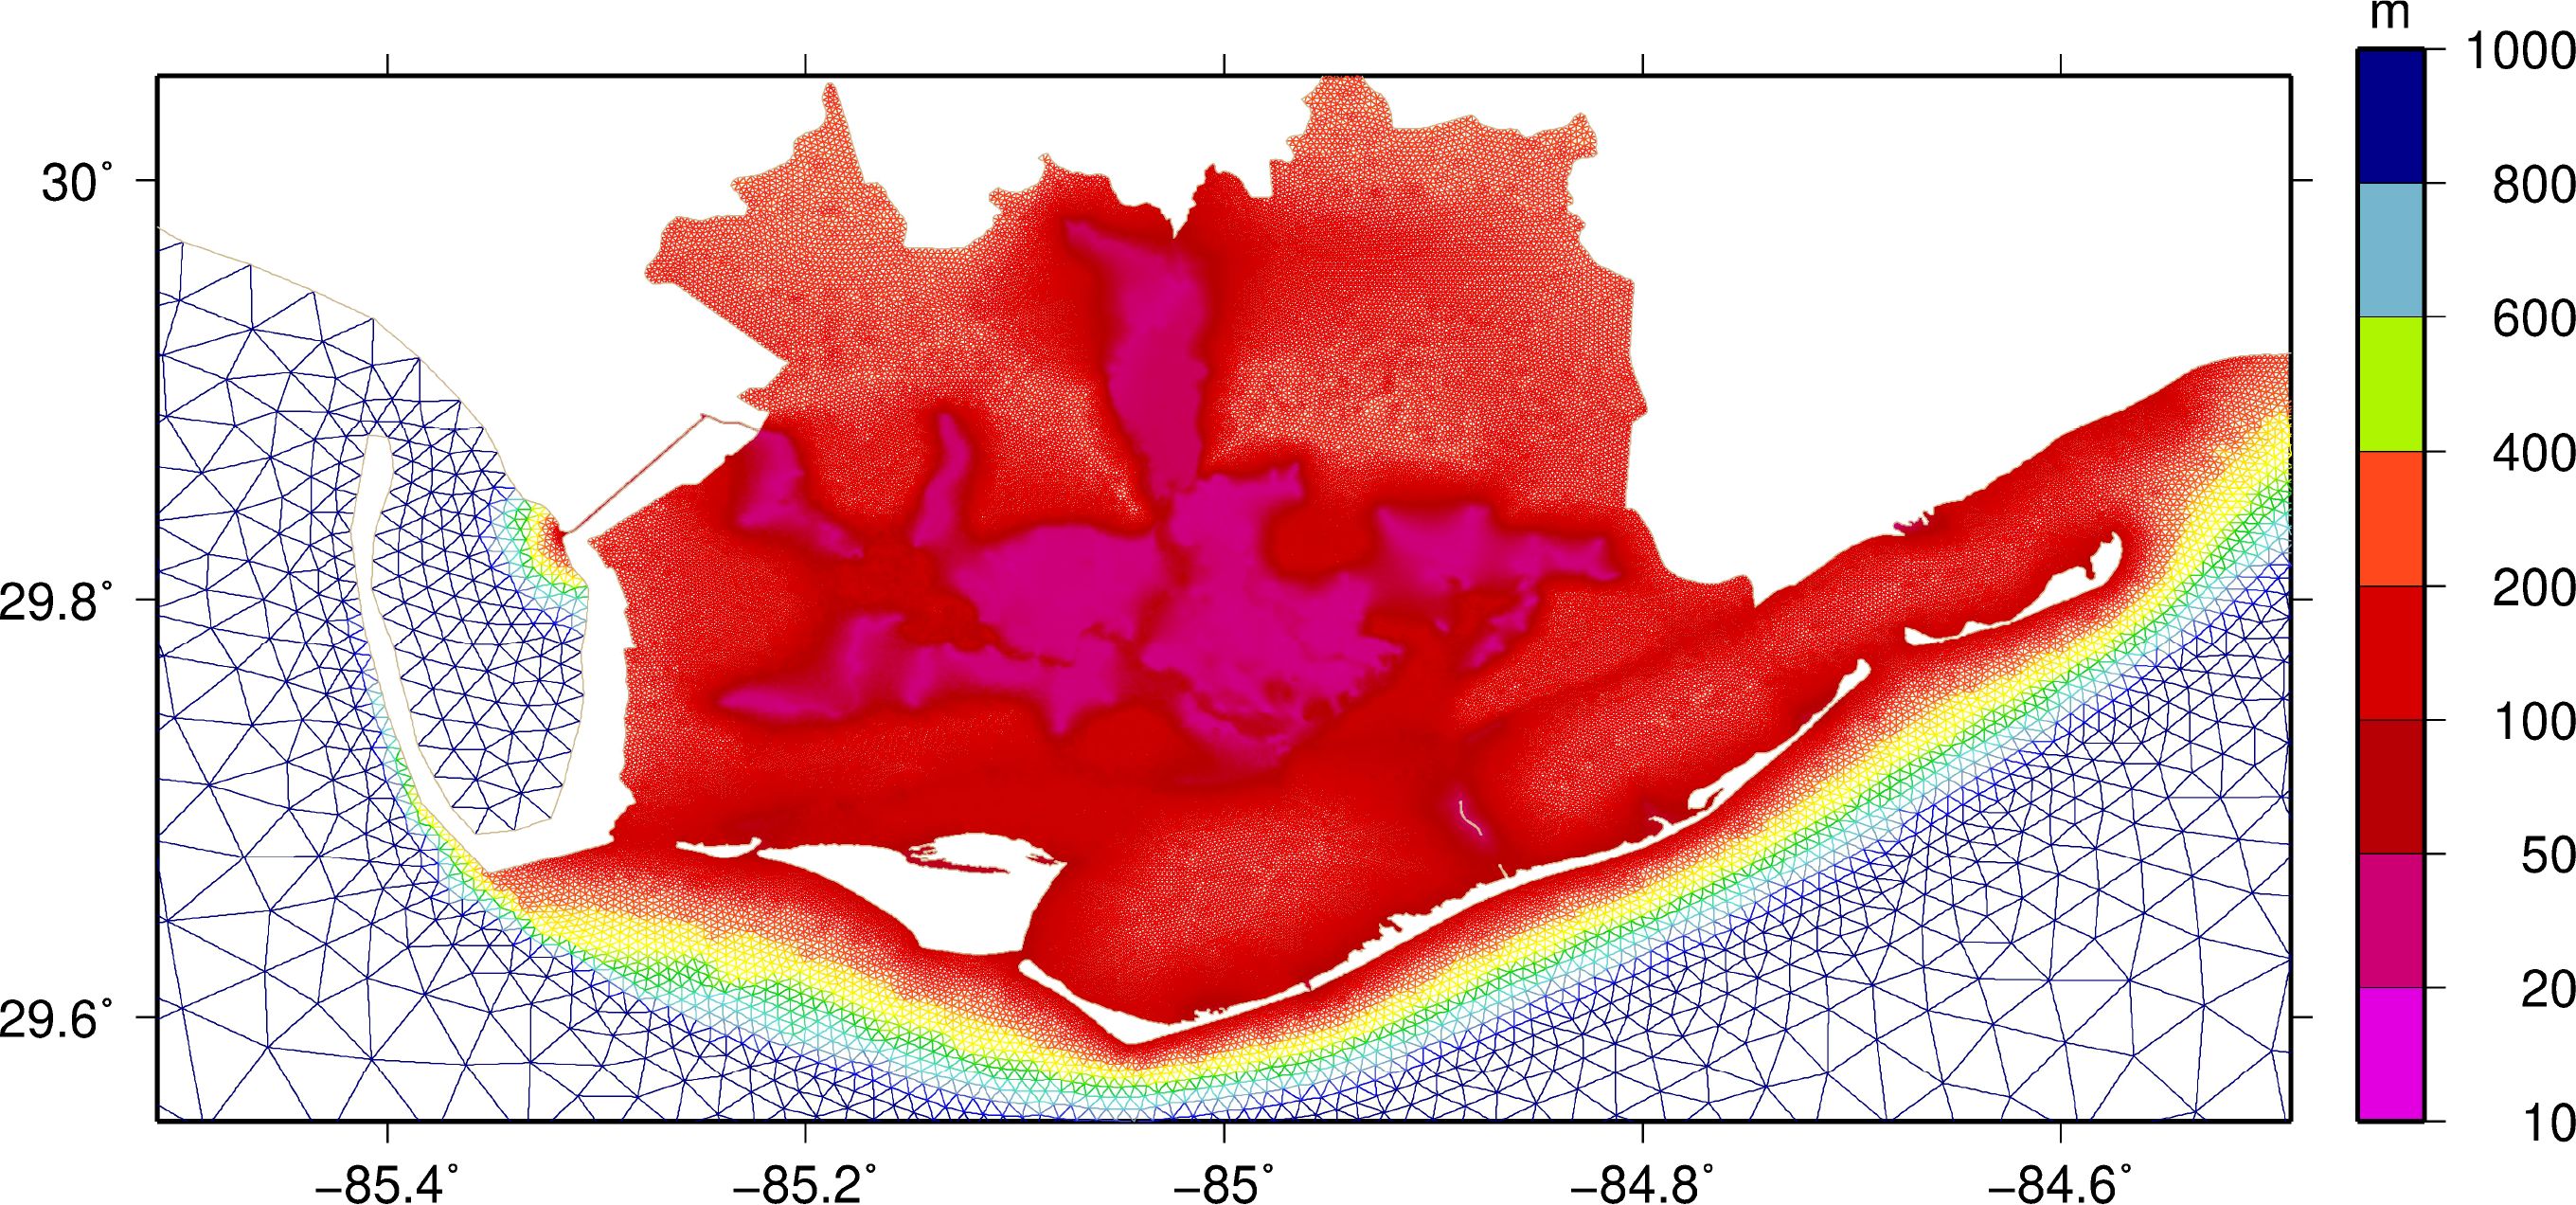
Figure 2. Illustration of the mesh spacing in the Apalachicola Bay to capture hydrodynamic interactions.
Bottom friction was included in the model as spatially varying Manning’s n and was assigned based on the National Land-Cover Database 2001 (Homer et al., 2004; Alizad et al., 2016). The accuracy of lidar-based DEMs is often compromised by dense vegetation such as S. alterniflora and Juncus roemerianus (Hladik and Alber, 2012), leading to overestimated marsh elevations by 0.20 to 0.80 meters (Medeiros et al., 2015). This overestimation affects the precision of flood simulations, particularly during storm surges. This study uses the adjusted DEM developed by (Medeiros et al., 2015), combining ASTER Band 2, IfSAR, and lidar. The DEM’s resolution is 3 m for the Apalachicola National Estuarine Research Reserve (ANERR), which includes the lower 84 km of the Apalachicola River and its floodplain as well as the entire Apalachicola Bay estuary.
2.2 Hydrodynamic model
Advanced Circulation (ADCIRC) version 55.02 solves a modified form of the shallow water equations for water levels and depth-averaged currents on an unstructured finite mesh (Dawson et al., 2006; Kolar et al., 1994a, b; Luettich and Westerink, 2004; Westerink et al., 2008; Luettich et al., 1992). Water levels are solved using the generalized wave continuity equation and currents in the x- and y-directions from the depth-averaged momentum equations (Atkinson et al., 2004; Kolar et al., 1994b; Pringle et al., 2021). The unstructured mesh allows for high mesh resolution in the region of interest and areas with large solution and topographic gradients. The model runs performed herein use a 0.25-second time step, wetting and drying were enabled (threshold depth of 0.1 m), and the advective terms were enabled. Bottom friction was represented using Manning’s n bottom roughness. The ADCIRC model was driven by wind and pressure fields for synthetic tropical cyclones, using the (Garratt, 1977) wind drag formulation to convert wind speed to wind stress.
2.3 Synthetic storm forcing
It is critical to understand regional storm climatology to assess wetlands and barrier islands as coastal defenses. Toro et al. (2011) established storm climatology in the Big Bend region with synthetic storms derived from the Joint Probability Method with Optimal Sampling (JPM-OS). We selected ten synthetic storms (numbers 64, 65, 82, 83, 84, 85, 86, 109, 154, and 155) from the 159 statistically generated by Toro et al. (2011) (Figure 3). These specific storms were chosen based on their attributes: pressure deficit, radius to maximum winds, translation speed, and storm heading (Table 1). Hagen and Bacopoulos (2012) examined coastal flooding on Florida’s coast using synthetic storms generated by Toro et al. (2011) to study the impact of sea-level rise on inundation. They concluded that storms 64, 65, 82, 83, 84, 85, and 86 contributed to the maximum of maximums (MOM) inundation patterns, and simulating these storms can replicate the inundation response set of hundreds of storms.
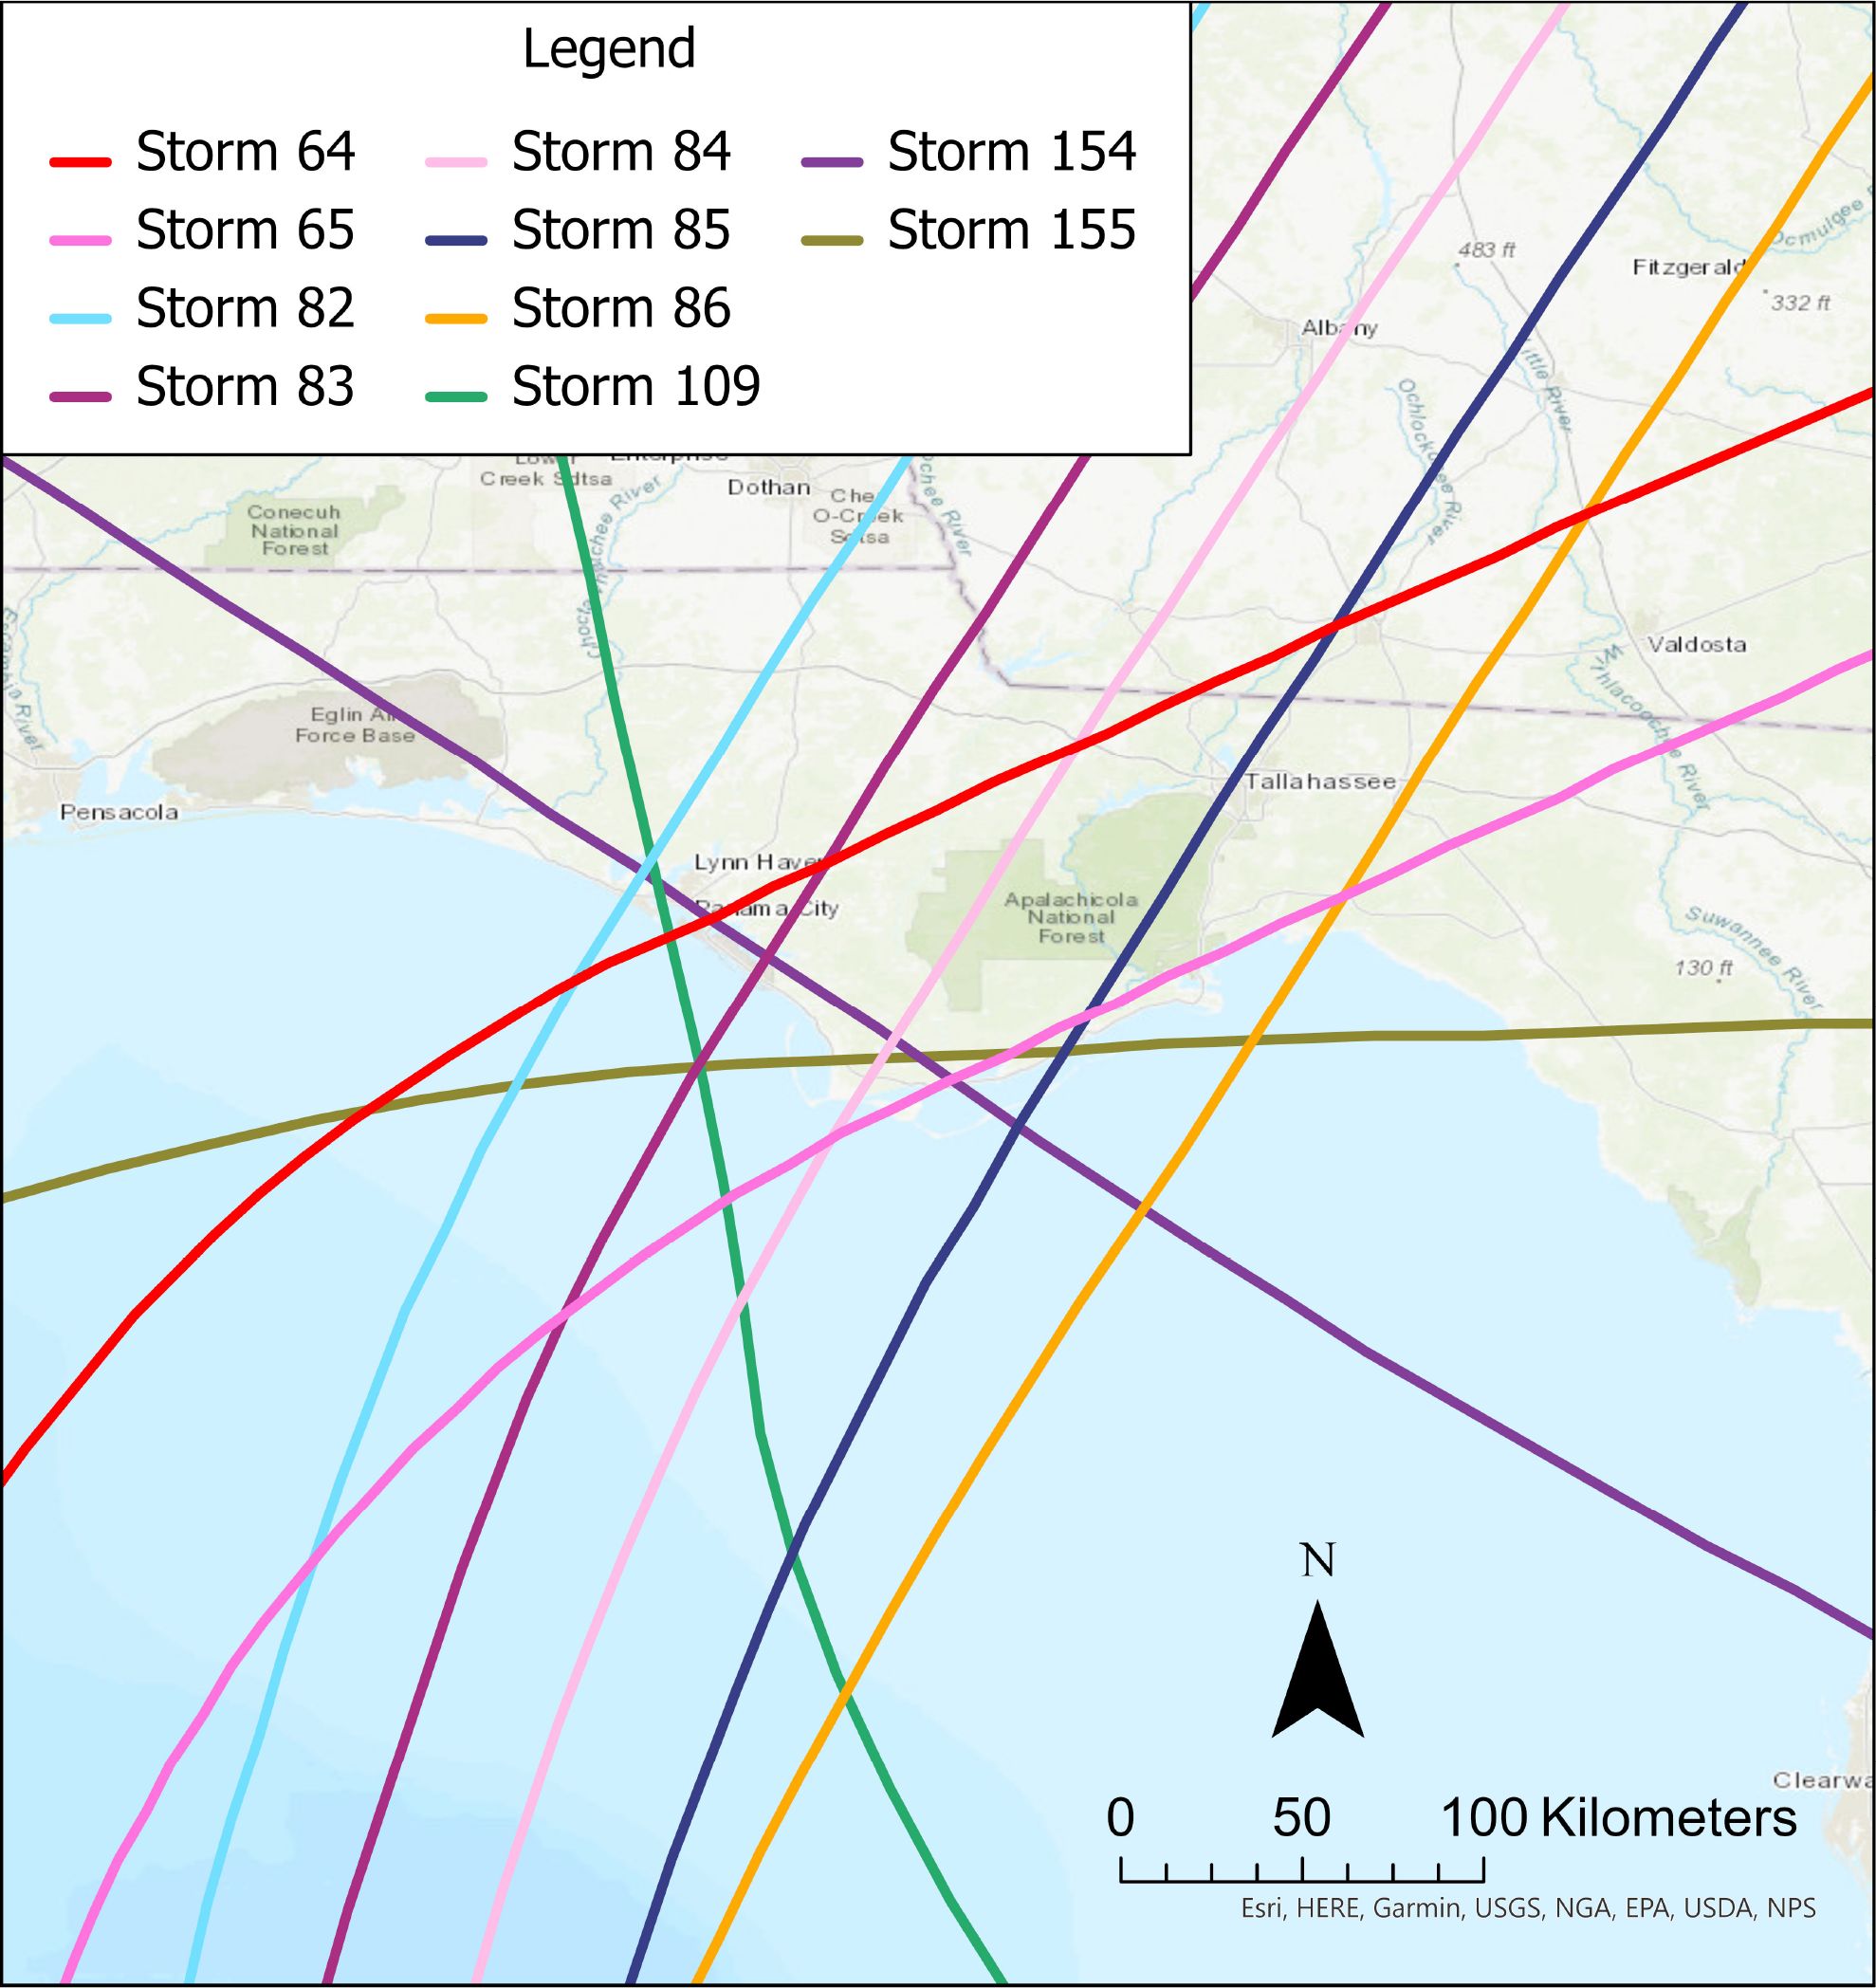
Figure 3. Storm tracks of 10 synthetic storms considered for this study.

Table 1. Attributes (Pressure, Radius, Forward Speed, landfall location) of the ten contributing storms selected for this study.
2.4 Simulation setup
Numerical simulations were conducted to assess the importance of barrier islands and marshlands by sequentially removing barrier islands and applying synthetic storm forcings to each modified coastal configuration. Five scenarios were developed to quantify the water level responses (Figure 4): Complete domain that is the base case (CD), no Dog Island (ND), no Dog and St. George Islands (NDG), no St. Vincent Island (NSV), and no islands (NI). A sixth scenario involved examining the effect of the absence of bed roughness on storm surges by assigning a uniform Manning’s n value of 0.021 across all nodes, which represented open water. The simulated storm surge signals were recorded at the location referred to as “Gauge” (Figure 1). A total of sixty simulations were conducted.
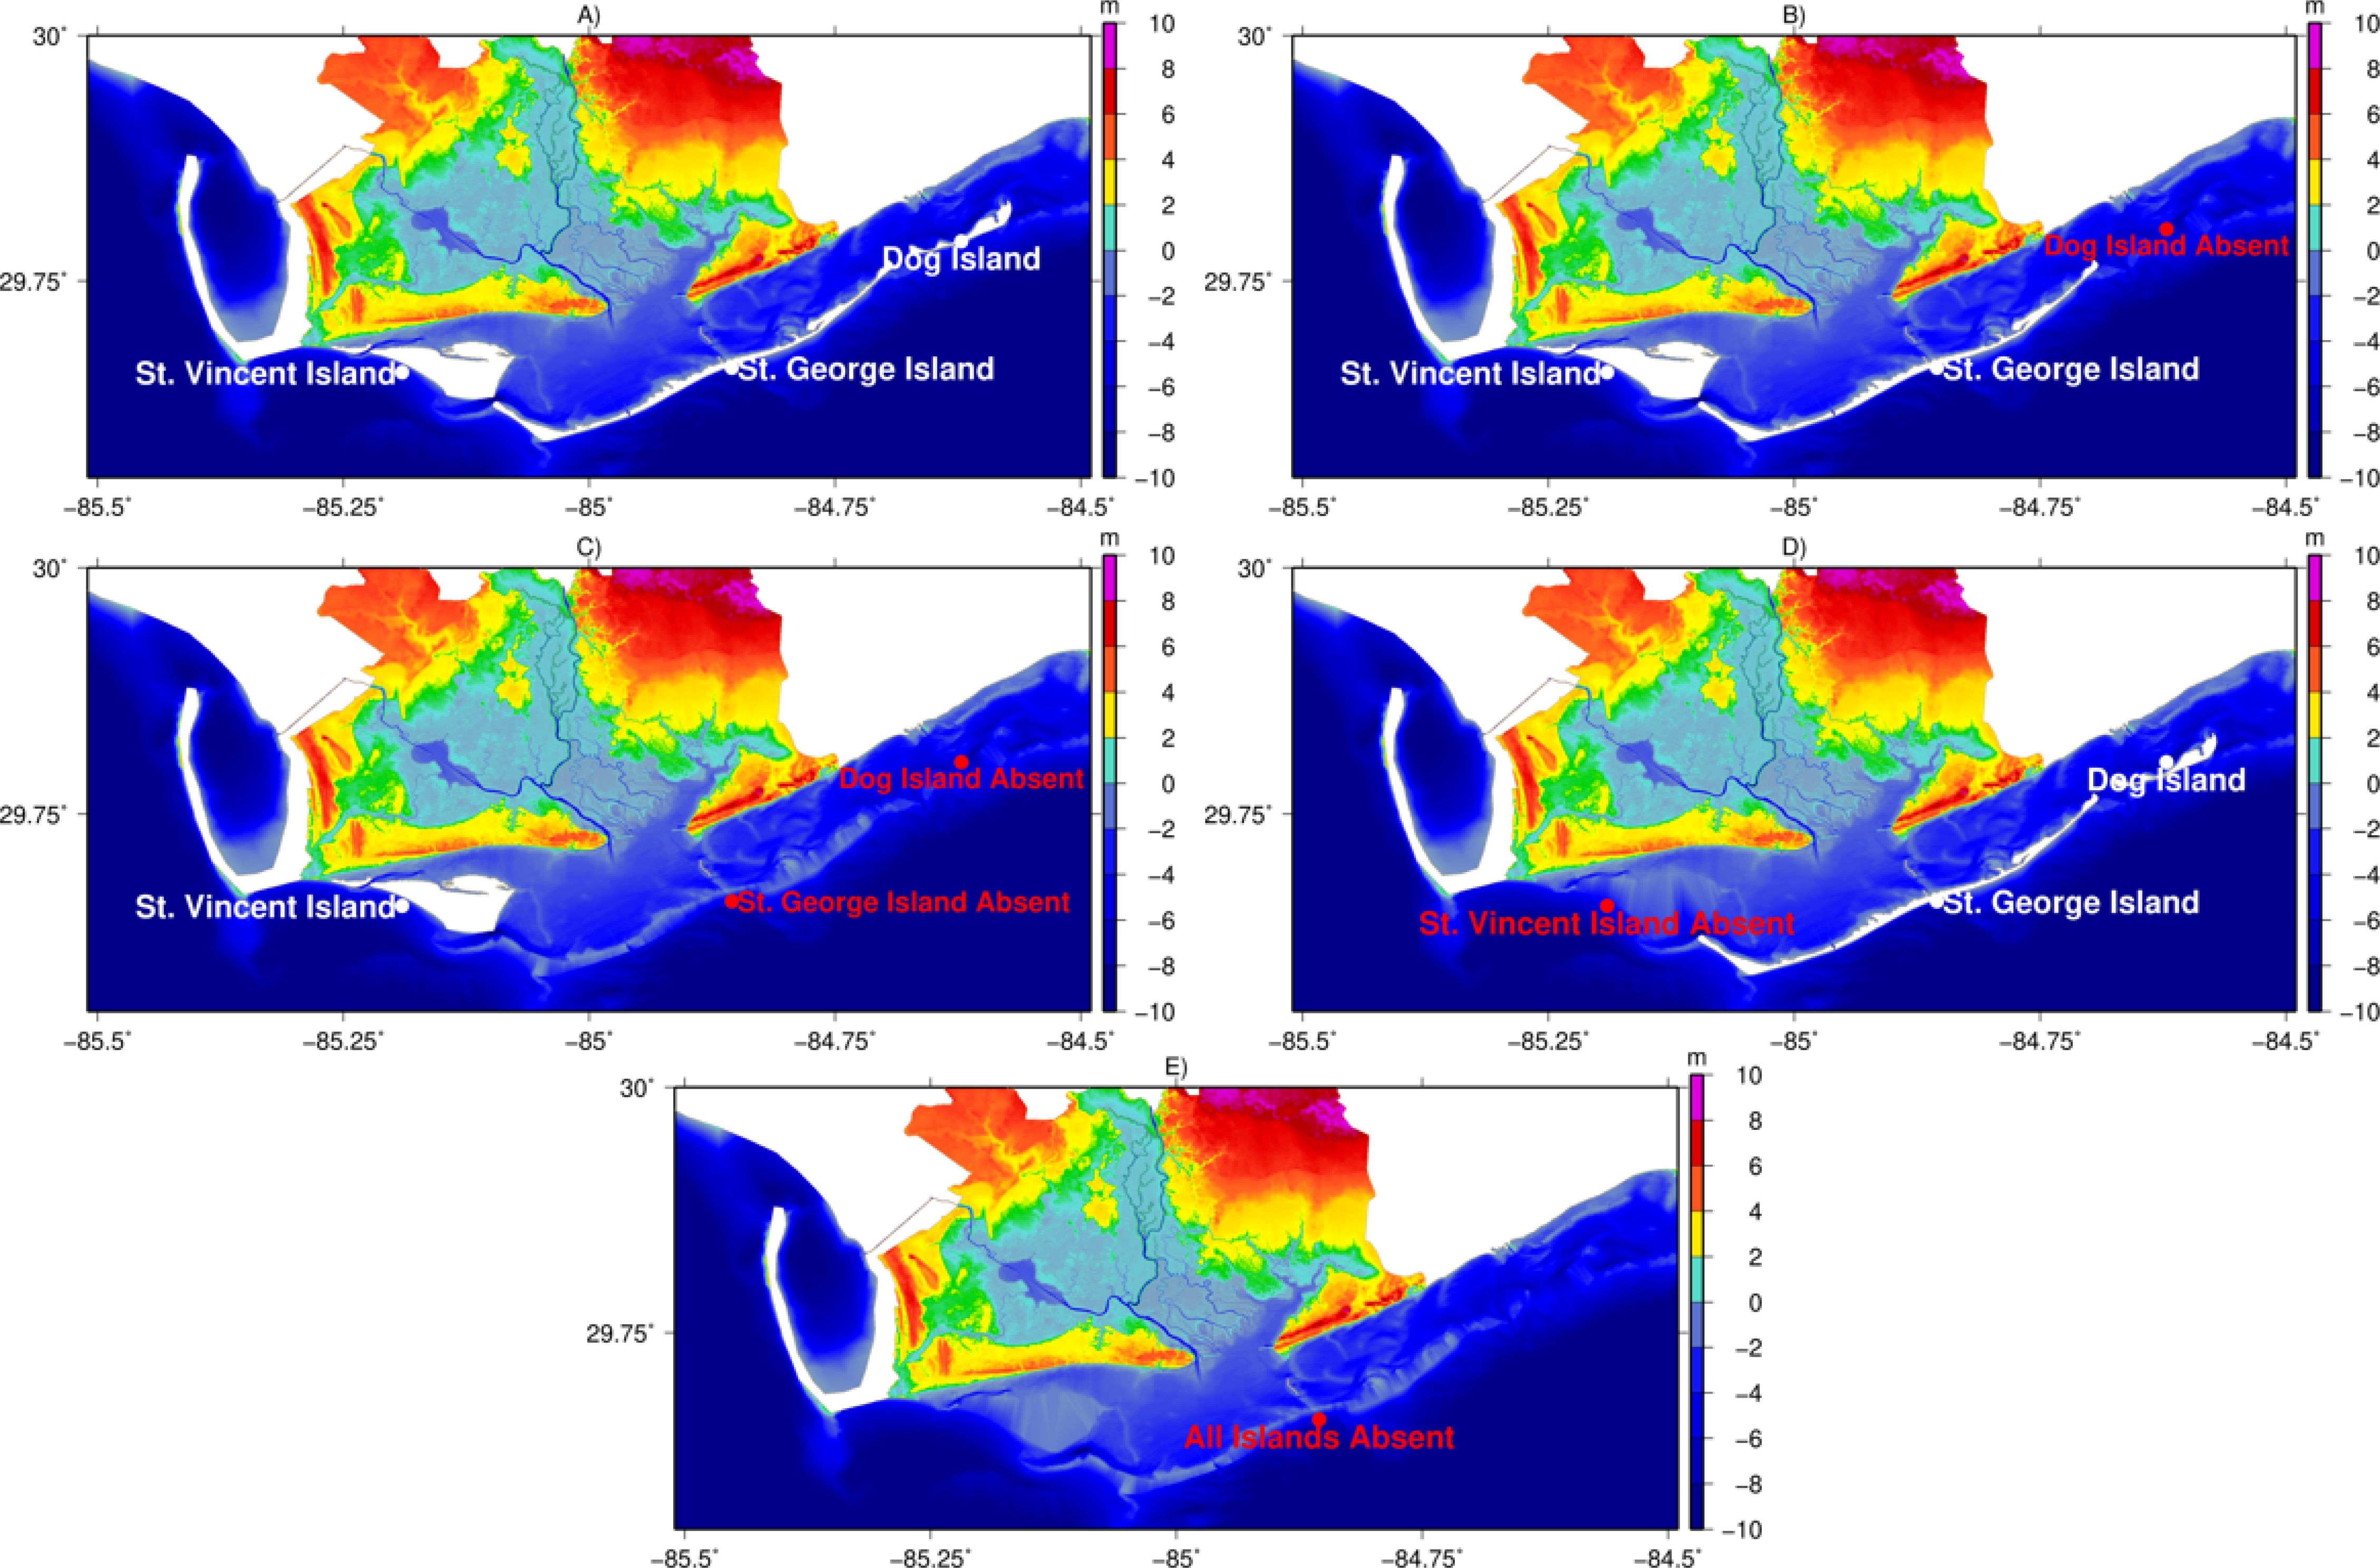
Figure 4. Five Scenarios of barrier island configuration considered in the study (A) Complete Domain (CD) (B) Dog Island absent (ND) (C) Dog and St. George Islands absent (NDG) (D) St. Vincent Island absent (NSV) (E) All Islands absent (NI).
3 Methods
3.1 Extracting estuary geometry
In the real world, rivers, lakes, bayous, and marshes are intertwined, making it hard to separate river channels and marshlands in numerical models. We extracted the actual geometry of the river channels, and then the total inundated area was calculated. This method involved classifying nodes with elevation values less than zero (bathymetry) as a part of the river. These nodes were compared with water elevation data to determine inundated areas. Finally, the area of these water-covered regions (triangular elements) was calculated using the Shoelace formula (Lee and Lim, 2017; Setiawan and Sediyono, 2022). By summing the elemental areas, the total inundated area of the river in the region of interest was calculated. The floodplain marsh area (Figure 5) was also calculated using the same approach as above. Nodes within the desired geographical location were identified, and their corresponding Manning’s n values were sourced from an attribute file. Based on predefined thresholds for Manning’s n values (set for open water, saline marsh, marsh/woodland mix, and others), nodes representing marsh areas were identified. Mesh elements made from these marsh nodes were identified, and their areas were calculated using the Shoelace formula to estimate the total marsh area. The flowchart (Figure 6) represents the flood analysis algorithm detailing the process from data input to area calculations.
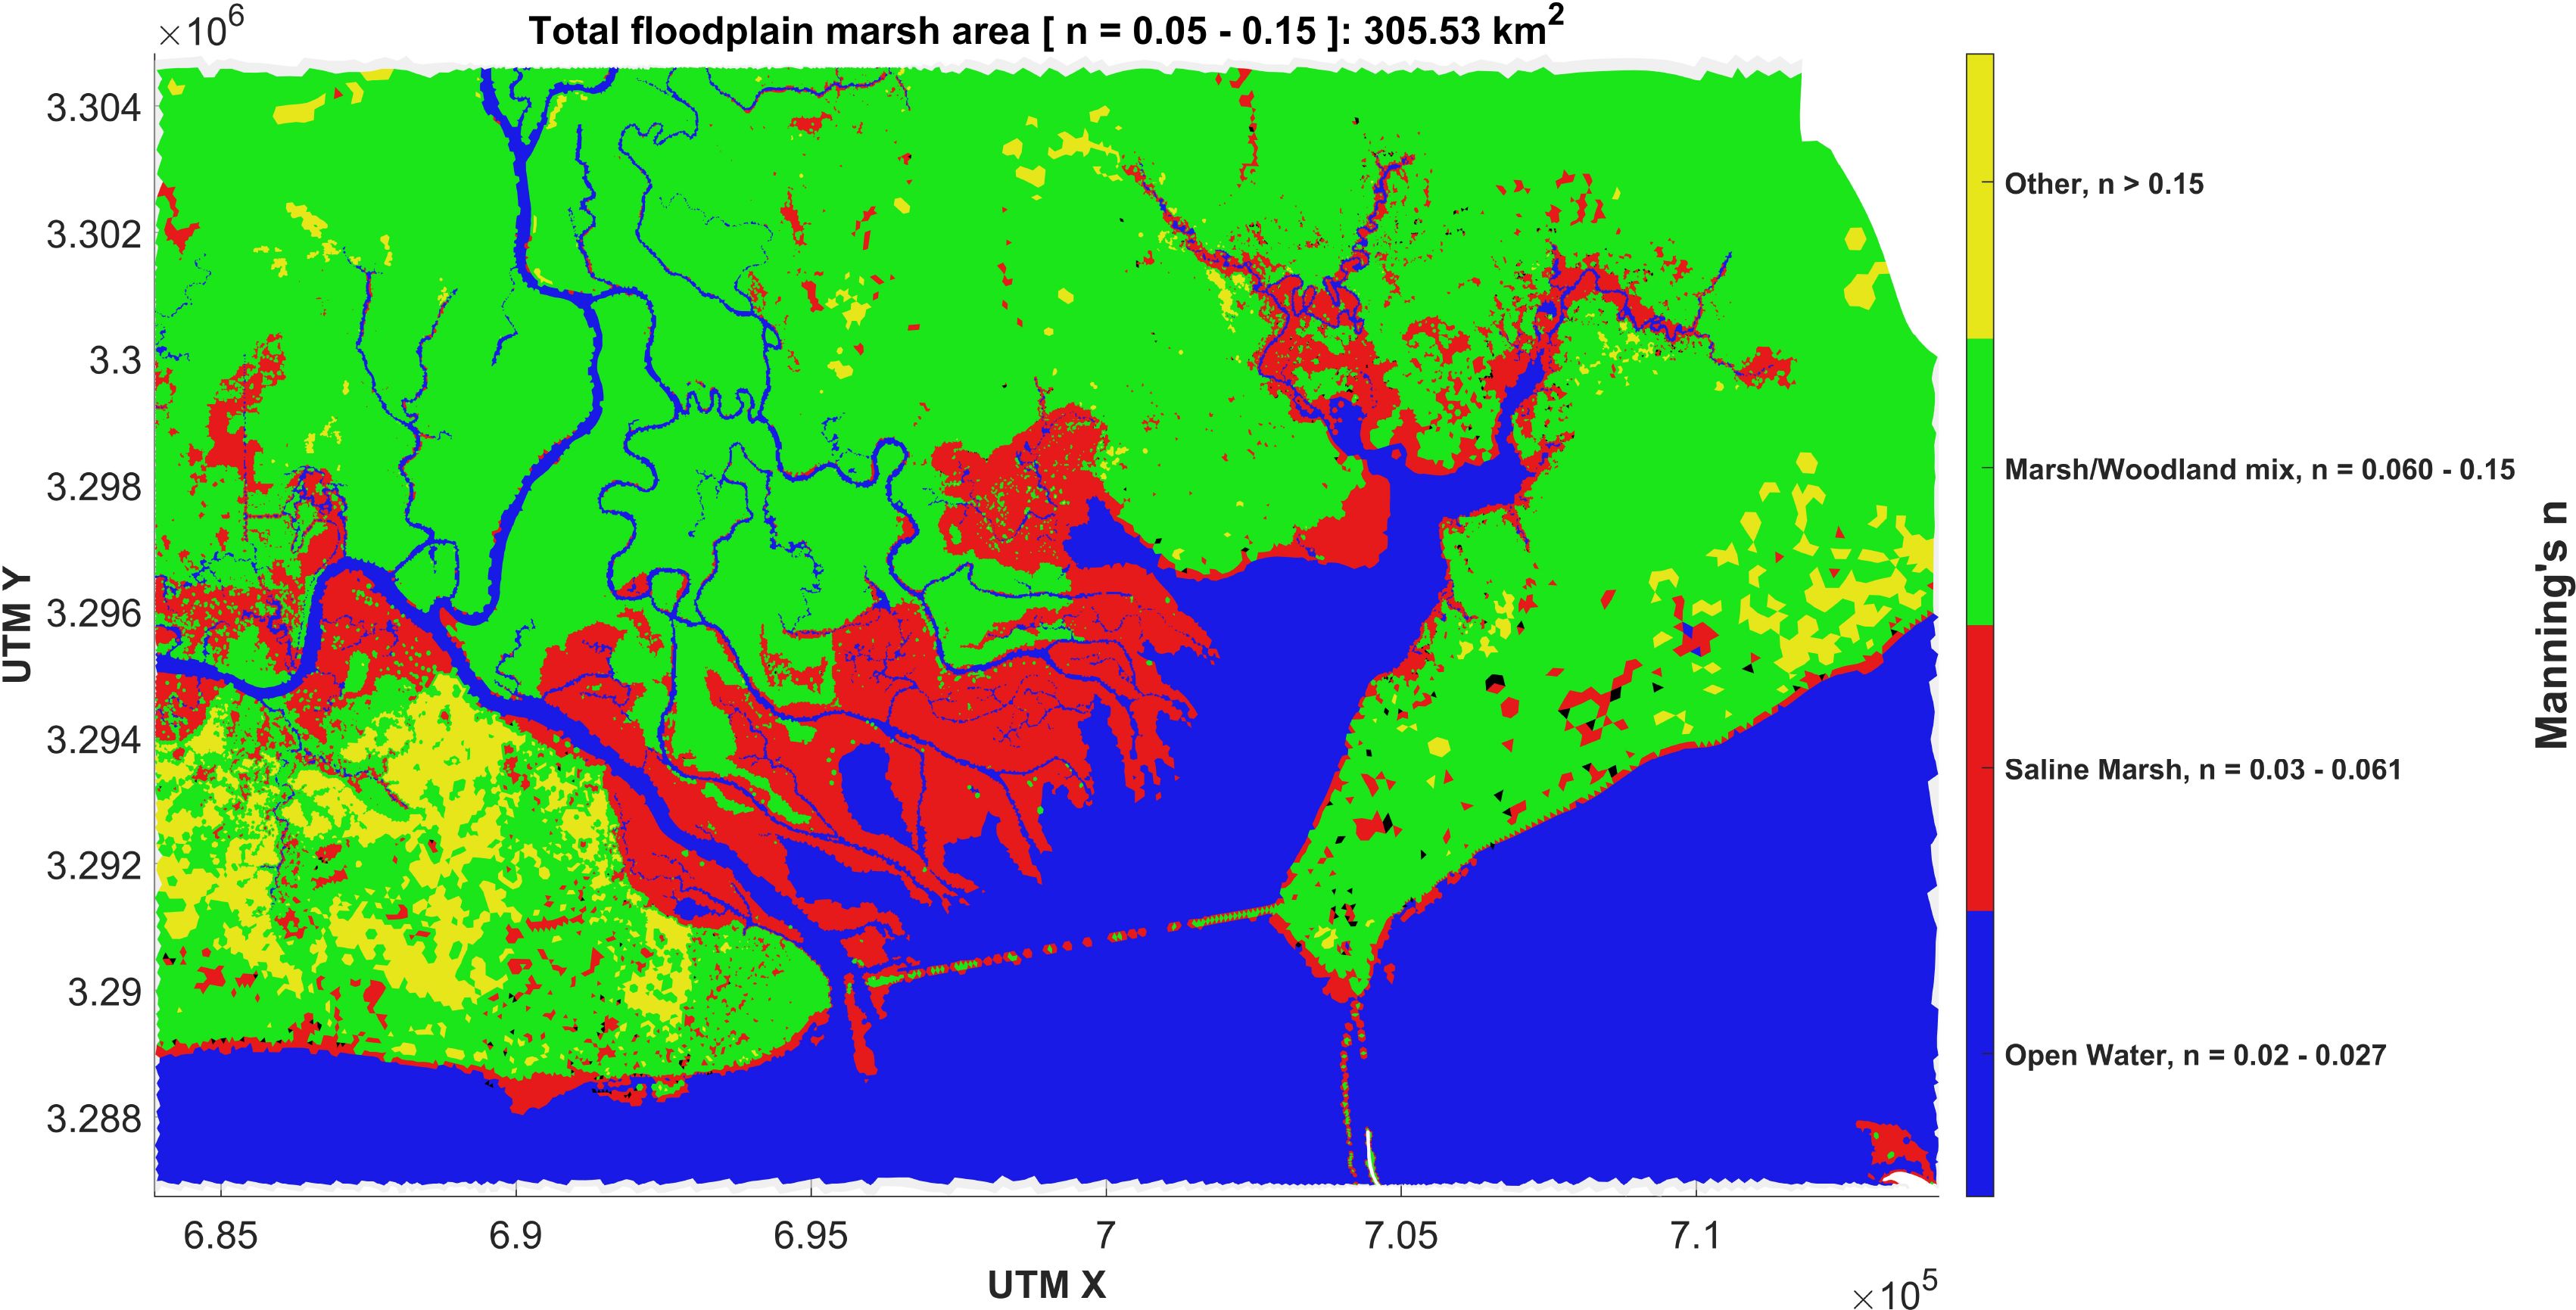
Figure 5. Manning n values of various marsh types for base configuration and the total floodplain marsh area for n values 0.02-0.15.
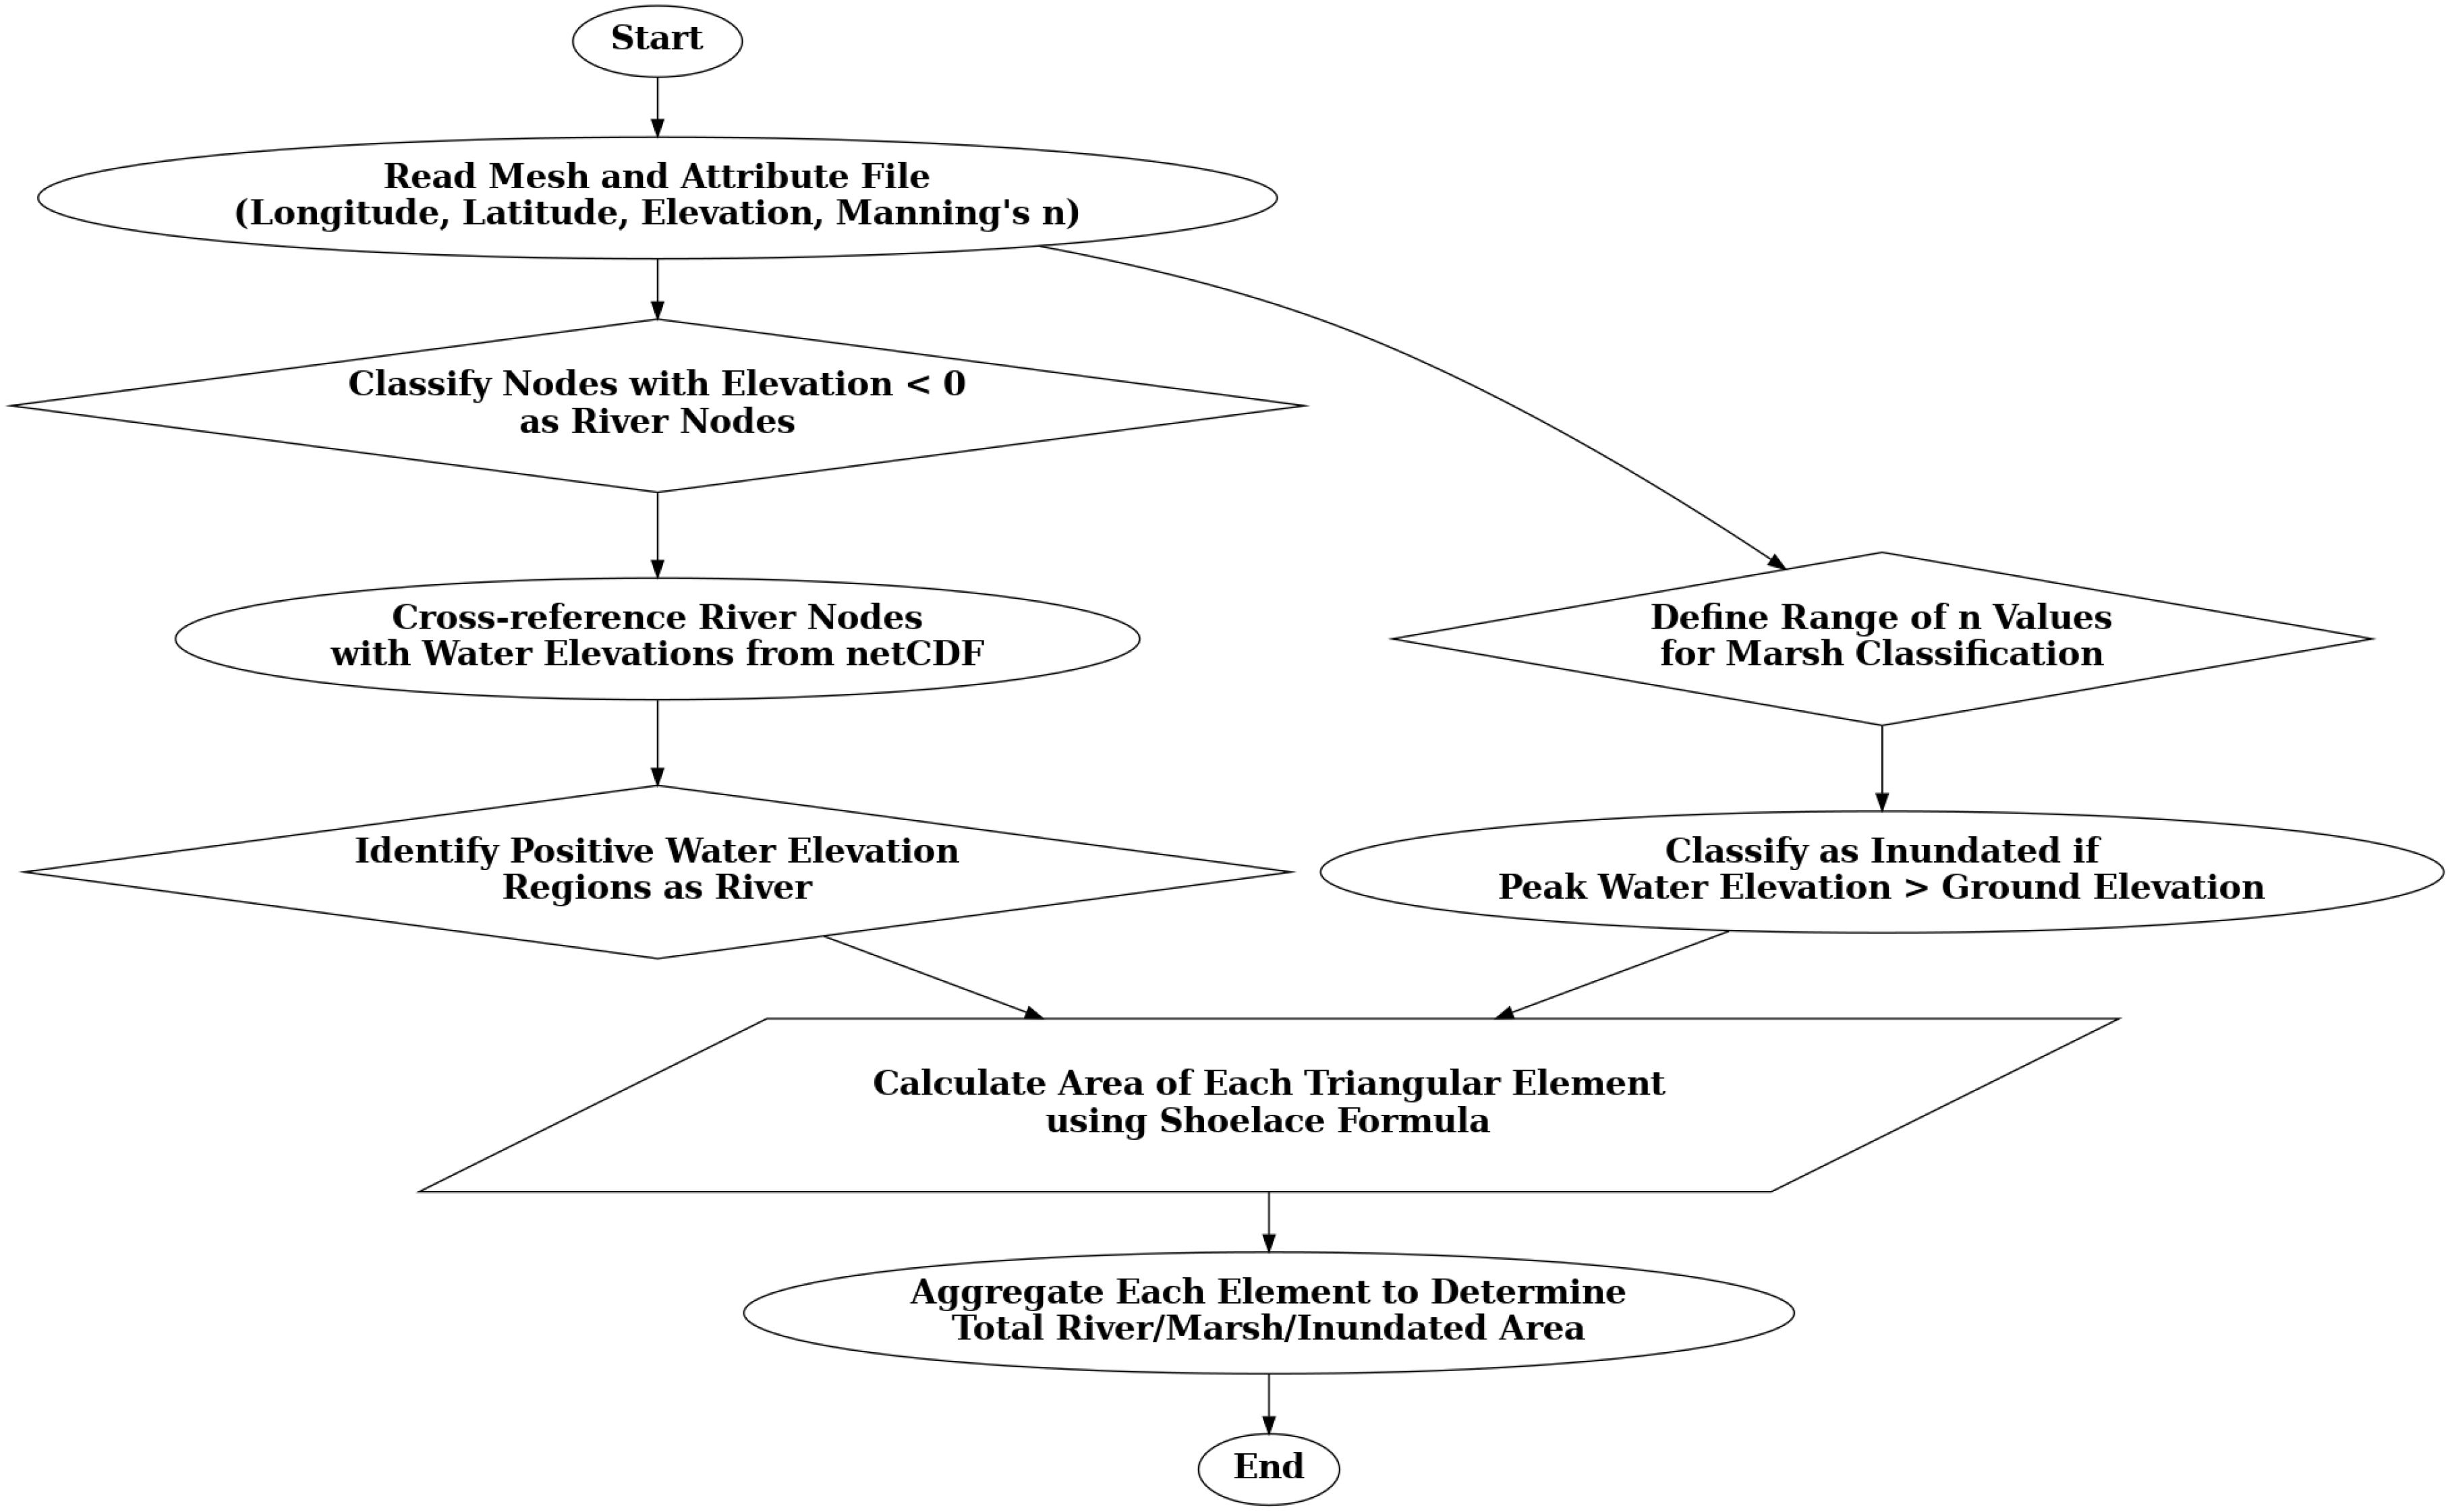
Figure 6. Flowchart of the flood analysis algorithm for extracting the desired estuary geometry.
3.2 Quantifying attenuation rate and inundation analysis
Determining the attenuation rate of storm surge is challenging due to the complexity of landscape features, such as variations in vegetation type and density, branching channels, and the extent of marshes along the shore. This study introduces a new approach to compute the attenuation rate to address this challenge. The wetland is segmented into multiple watersheds or wetland units (Figure 7A) using ArcGIS Pro. This delineation initiates by specifying the ‘outlet’—in this context, the locations where the water exits the wetland, typically the river mouths and associated tributaries. The DEM identifies the flow direction or the hydrological pathway across the terrain leading toward the wetland. Utilizing this directional data, the boundaries of watersheds draining into the wetlands are defined, which outline the areas where inundation will eventually converge into the wetland. Each delineated watershed is anchored by a single outlet, dividing the study area into 95 distinct watersheds and their corresponding outlet points.

Figure 7. (A) Watershed delineation to analyze the surge attenuation due to marsh. (B) Flow lengths inside the watershed for maximum ground inundation or flooding for Storm# 65.
Water levels were sampled every 15 minutes for each grid cell, and peak water surface elevations were extracted for all nodes at each timestep. The rate of attenuation was determined using the equation by Hewageegana et al. (2022) to calculate the change in peak water level and the distance over which the flooding occurs.
where is the spatial average of the difference in peak water level between the marsh starting location and the maximum onshore inundation location, and is the distance from the marsh starting location to the maximum onshore inundation extent. The maximum distance from the marsh edge to the farthest wetted/inundated node is the onshore inundation extent. Each simulation’s inundated area (flooded area) was identified by comparing the peak water elevations at each mesh node with the ground elevations. Specifically, a node was classified as inundated if its peak water elevation exceeded the ground (topo) elevation. For each watershed, the flow length or was determined by measuring the distance from the farthest inundated node within the watershed to its associated outlet point (Figure 7B).
The marsh platform elevation gradient is low, so defining the distance to the outlet based on hydraulic connectivity did not prove helpful in this case. The difference in water elevation was computed, inside each watershed. Finally, the average gradient across all valid watersheds was computed using Equation 1. To calculate the effect of channel width and spacing on flood attenuation, a channel ratio (Cr) was defined to consolidate both effects (Equation 2).
4 Results and discussion
4.1 Effect of barrier islands on surge attenuation
The surge signals from synthetic storms are generated for the case CD (Figure 8). These signals are recorded at the point “Gauge” (Figure 1) within Apalachicola Bay. The surge amplitude (asur) is defined as the maximum surge level, and the surge duration (Tsur) is defined as the duration between the rising limb and falling limb on either side of the crest at half surge amplitude (Figure 8).
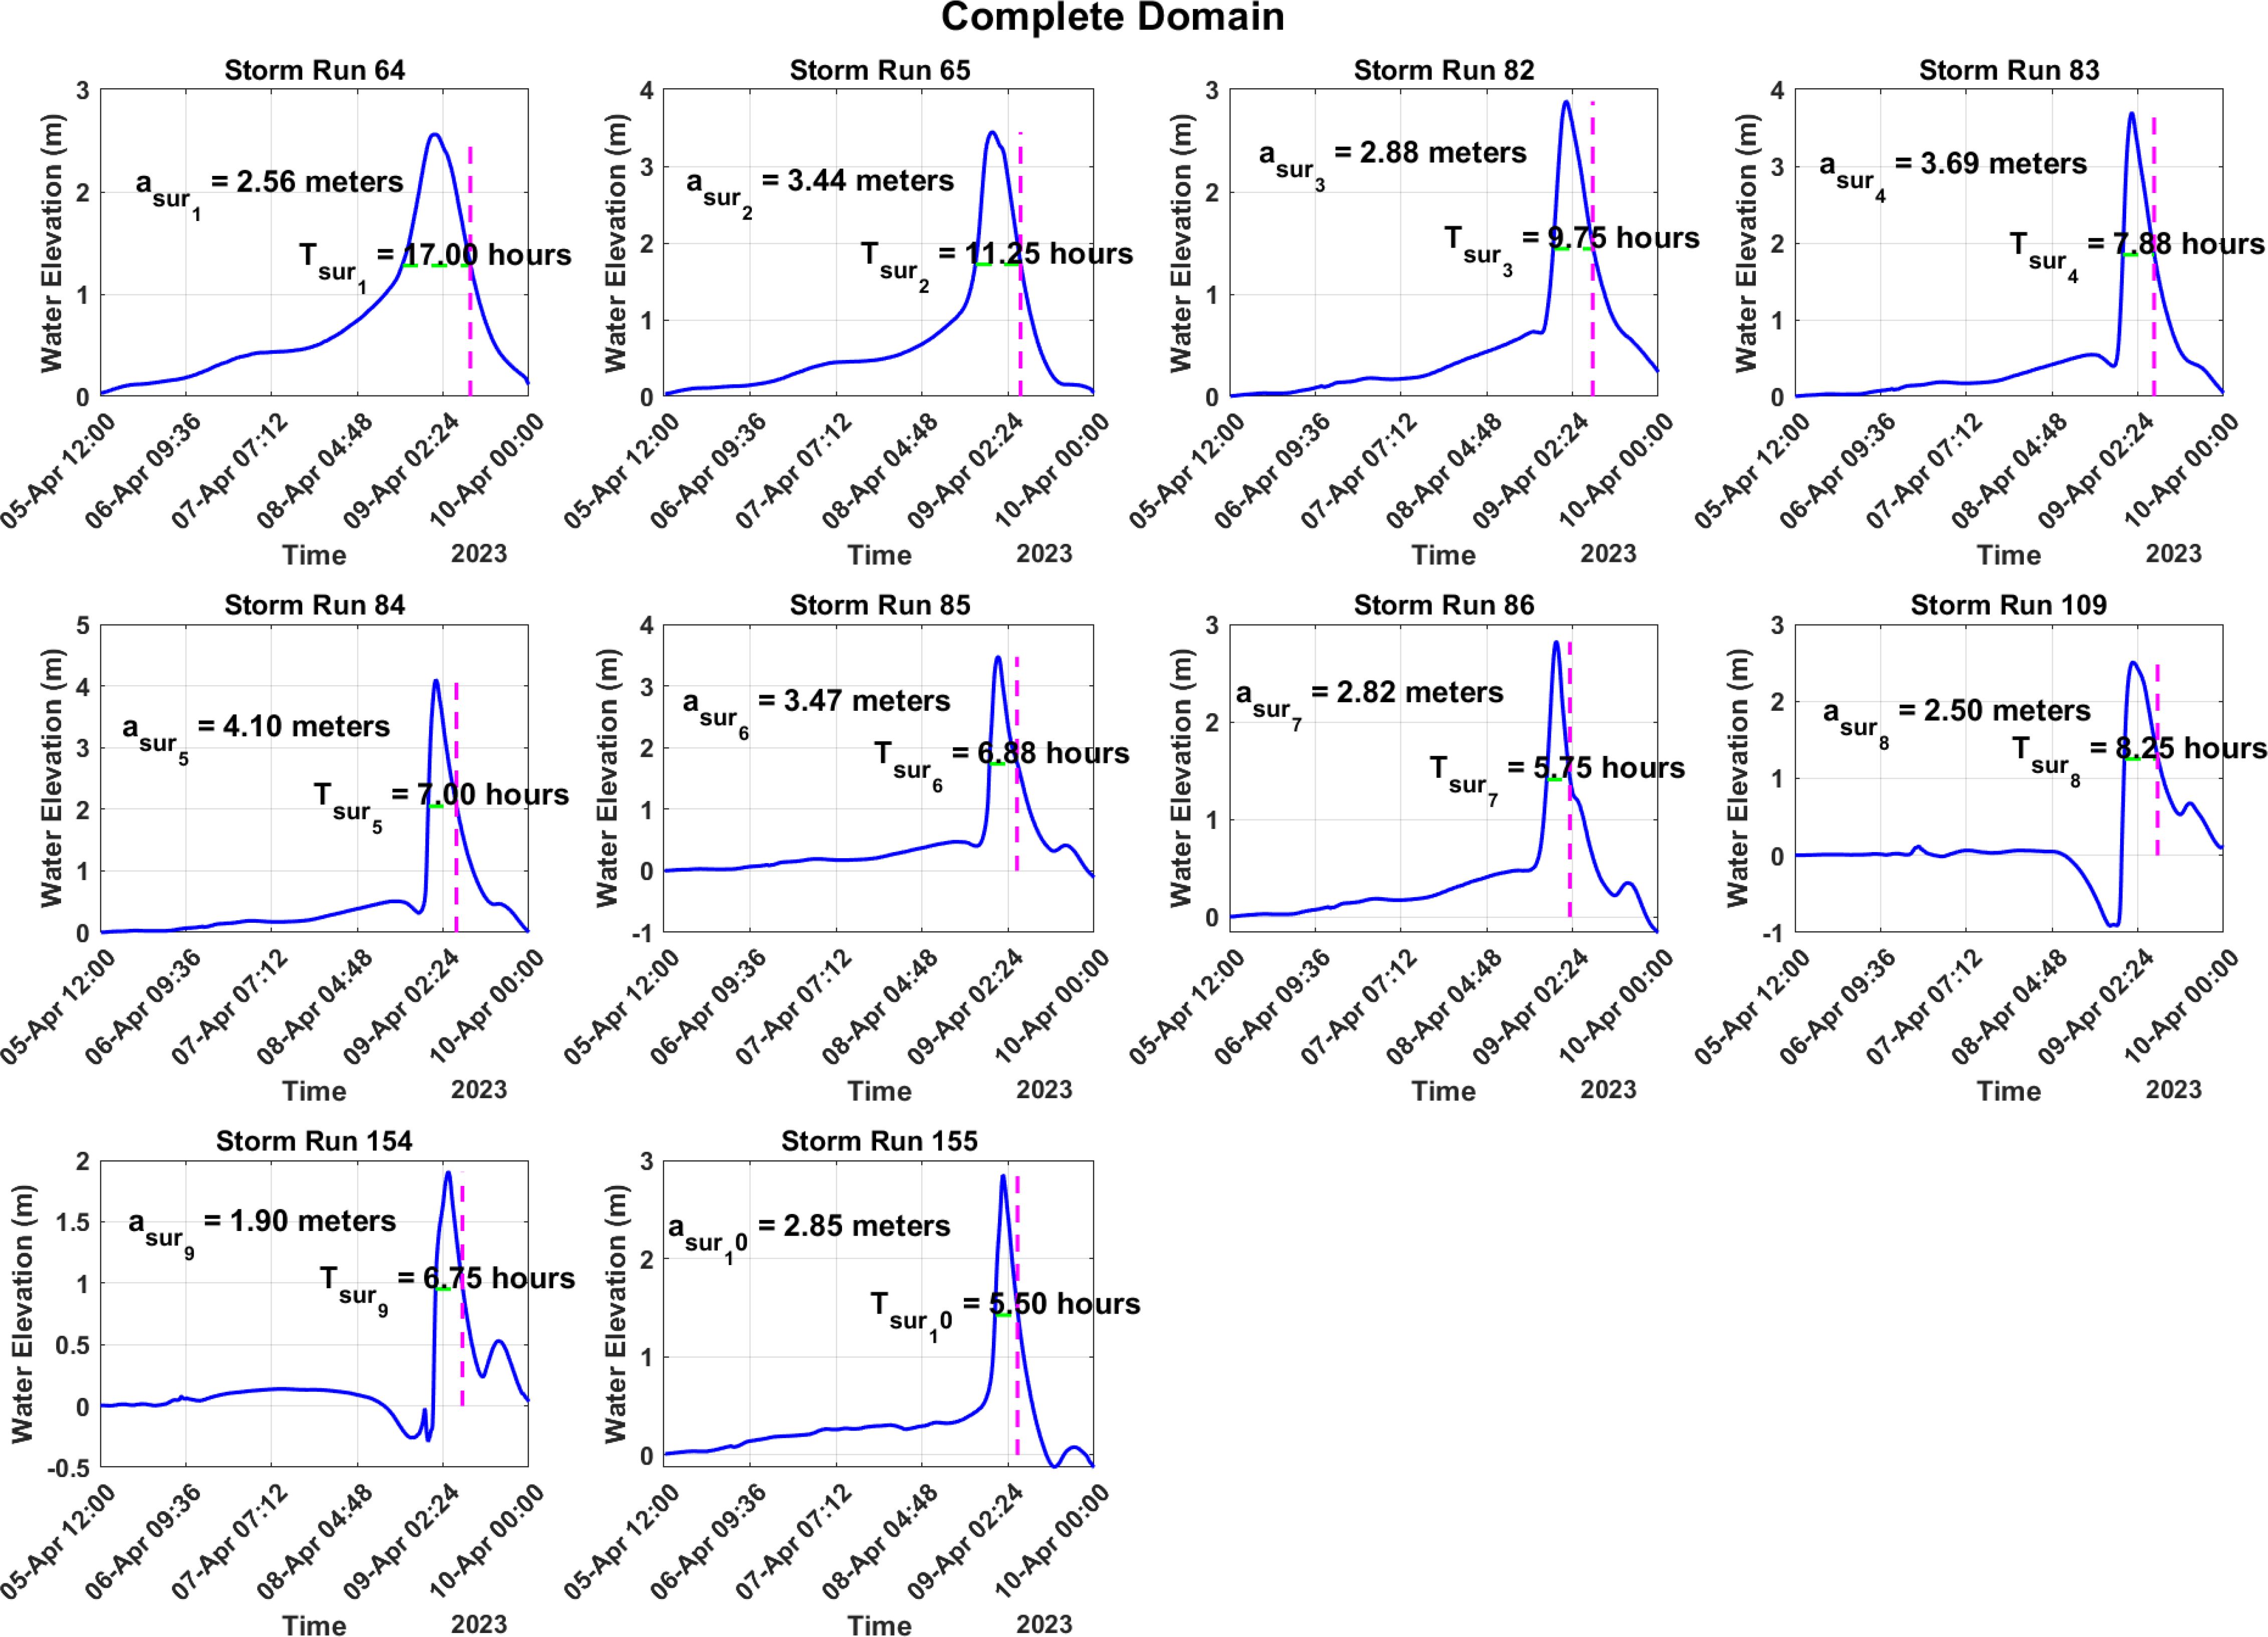
Figure 8. Surge duration and surge amplitude for all the storm runs for the case Complete domain [CD].
The simulation results show that the absence of an island generally leads to higher surge levels (Figure 9). The increase in asur varied from 13.5% in Storm# 64 to 86.8% in Storm Run 154, indicating a protective role of barrier islands in mitigating storm surges. There is an exception in Storm# 86, where a 26.2% reduction in asur is observed, suggesting specific storm dynamics or environmental conditions where island absence might reduce surge impacts. The absence of Dog and George Island (NDG) consistently results in higher surge amplitudes than other individual island removals. For instance, in Storm# 84, the surge amplitude peaks at 5.95 meters, which is one of the highest observed in the study, indicating that these two islands have significant combined protective effects. The impact of St. Vincent Island (NSV scenario) on storm surges shows variability; in some storm runs, such as Storm# 86, the absence of St. Vincent results in a reduced amplitude, which could be attributed to the island’s capacity to retain water, thus modulating the surge impact.
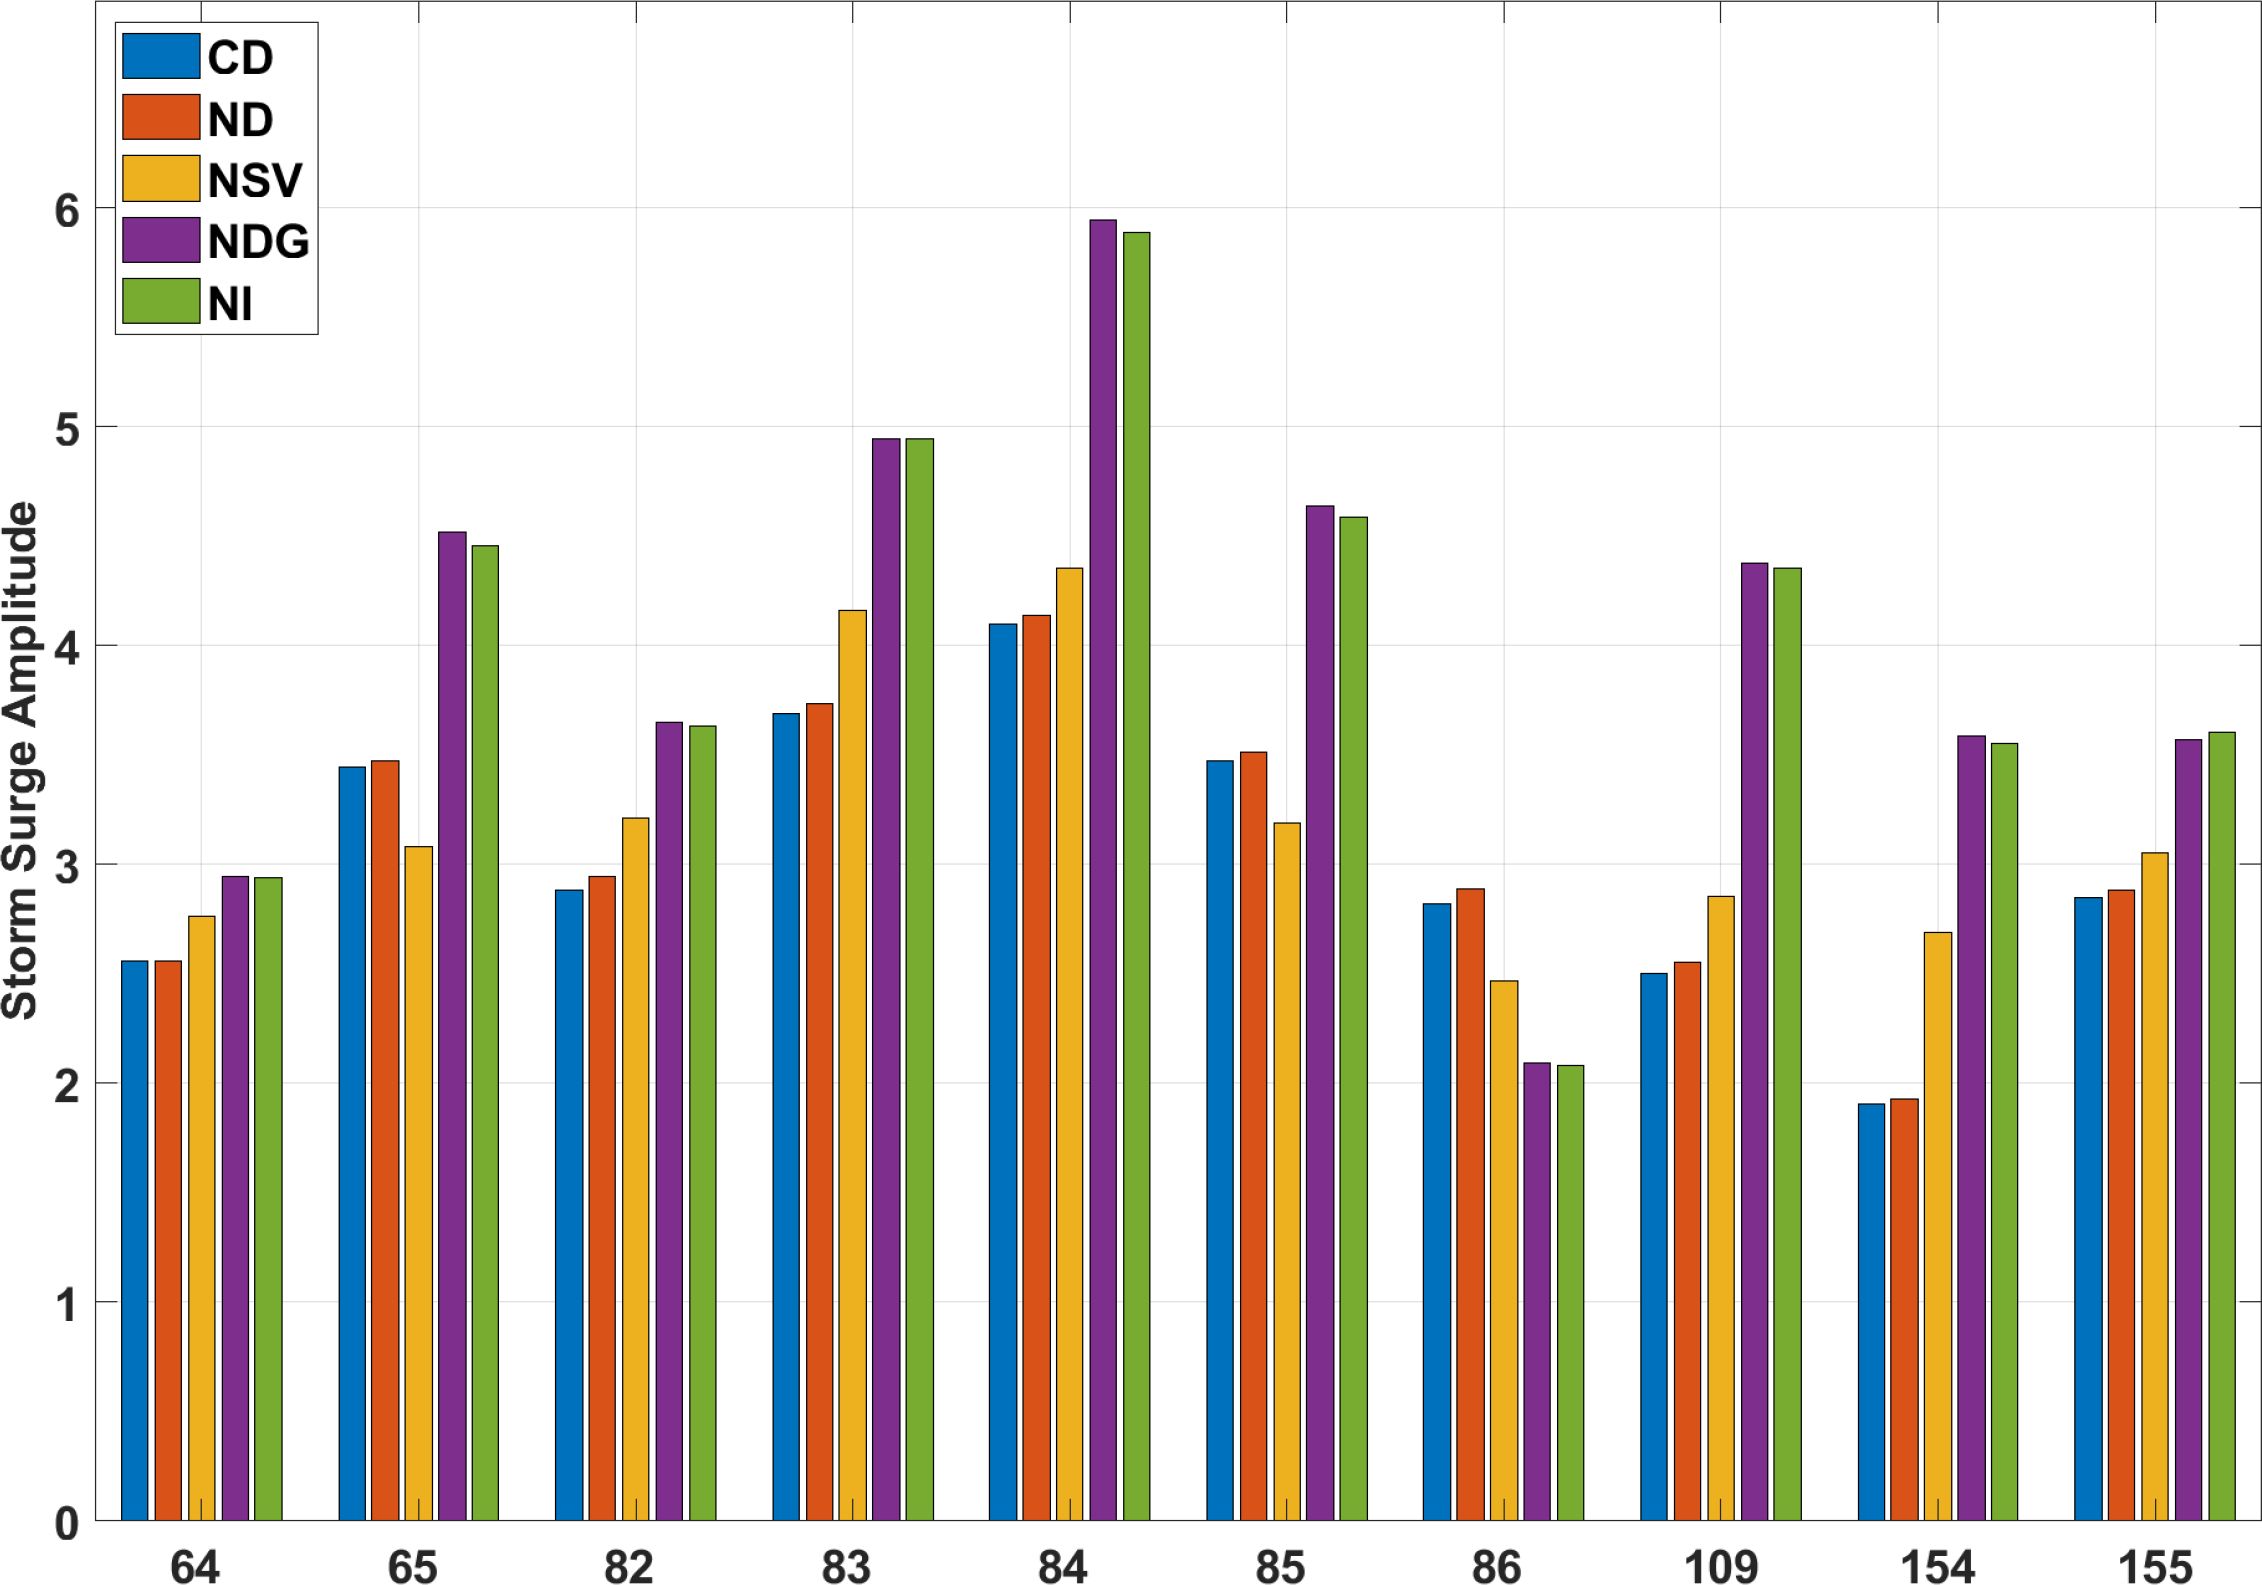
Figure 9. Grouped chart showing the variation in storm surge amplitudes across five cases (CD, ND, NSV, NDG, and NI) for each storm.
The storm tracks (Figure 3) and their landfall location (Table 1) govern the potential impact for each scenario. To examine this relationship across different cases, a heatmap of the storm intensity, denoted by Tsur/asur, was created (Figure 10). For instance, storms# 64 and 154, based on their surge signals, generate intense surges for CD and ND, 64 and 86 for NSV, and 64 and 82 for NDG and NI, respectively.
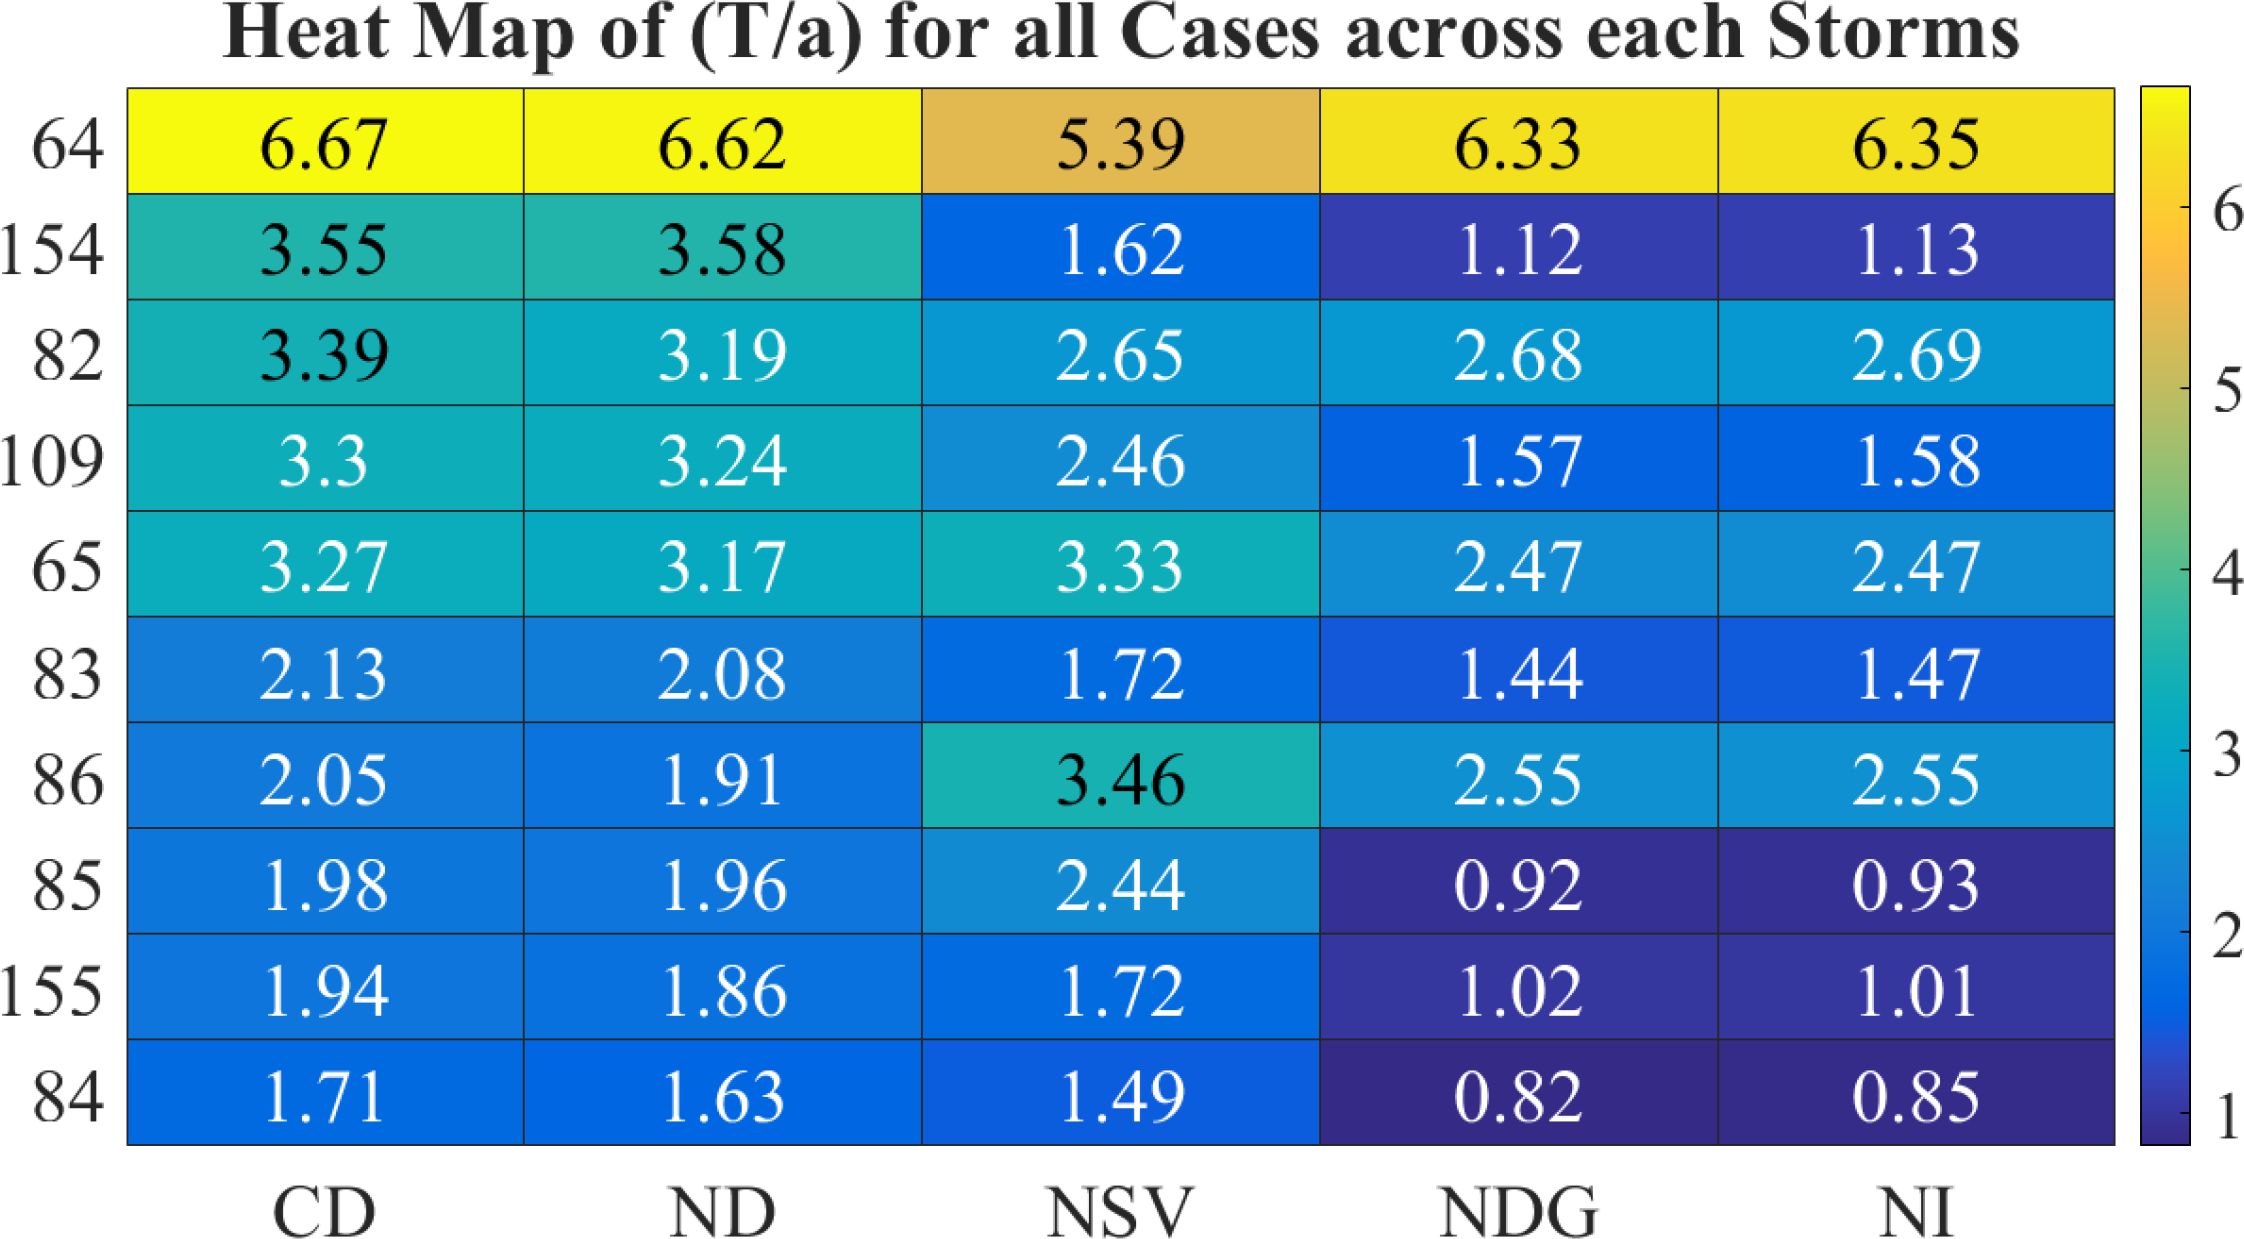
Figure 10. Heatmap of the ratio of surge duration to surge amplitude for various cases across different storms. Color intensity indicates the magnitude of the ratio, providing a visual comparison of the intensity of storms.
4.2 Effect of marsh on surge attenuation
To assess the influence of marsh on storm surge attenuation, we compared the maximum mainland inundation (Figure 11) from the base case CD defined with spatially varying manning’s n to the ‘No Marsh’ case where the manning’s n value was set to 0.021 across the wetland. The absence of the marsh vegetation resulted in more flooding than the absence of barrier islands, with the maximum inundated area more than doubling in some cases (over 100% increase for storm 154).
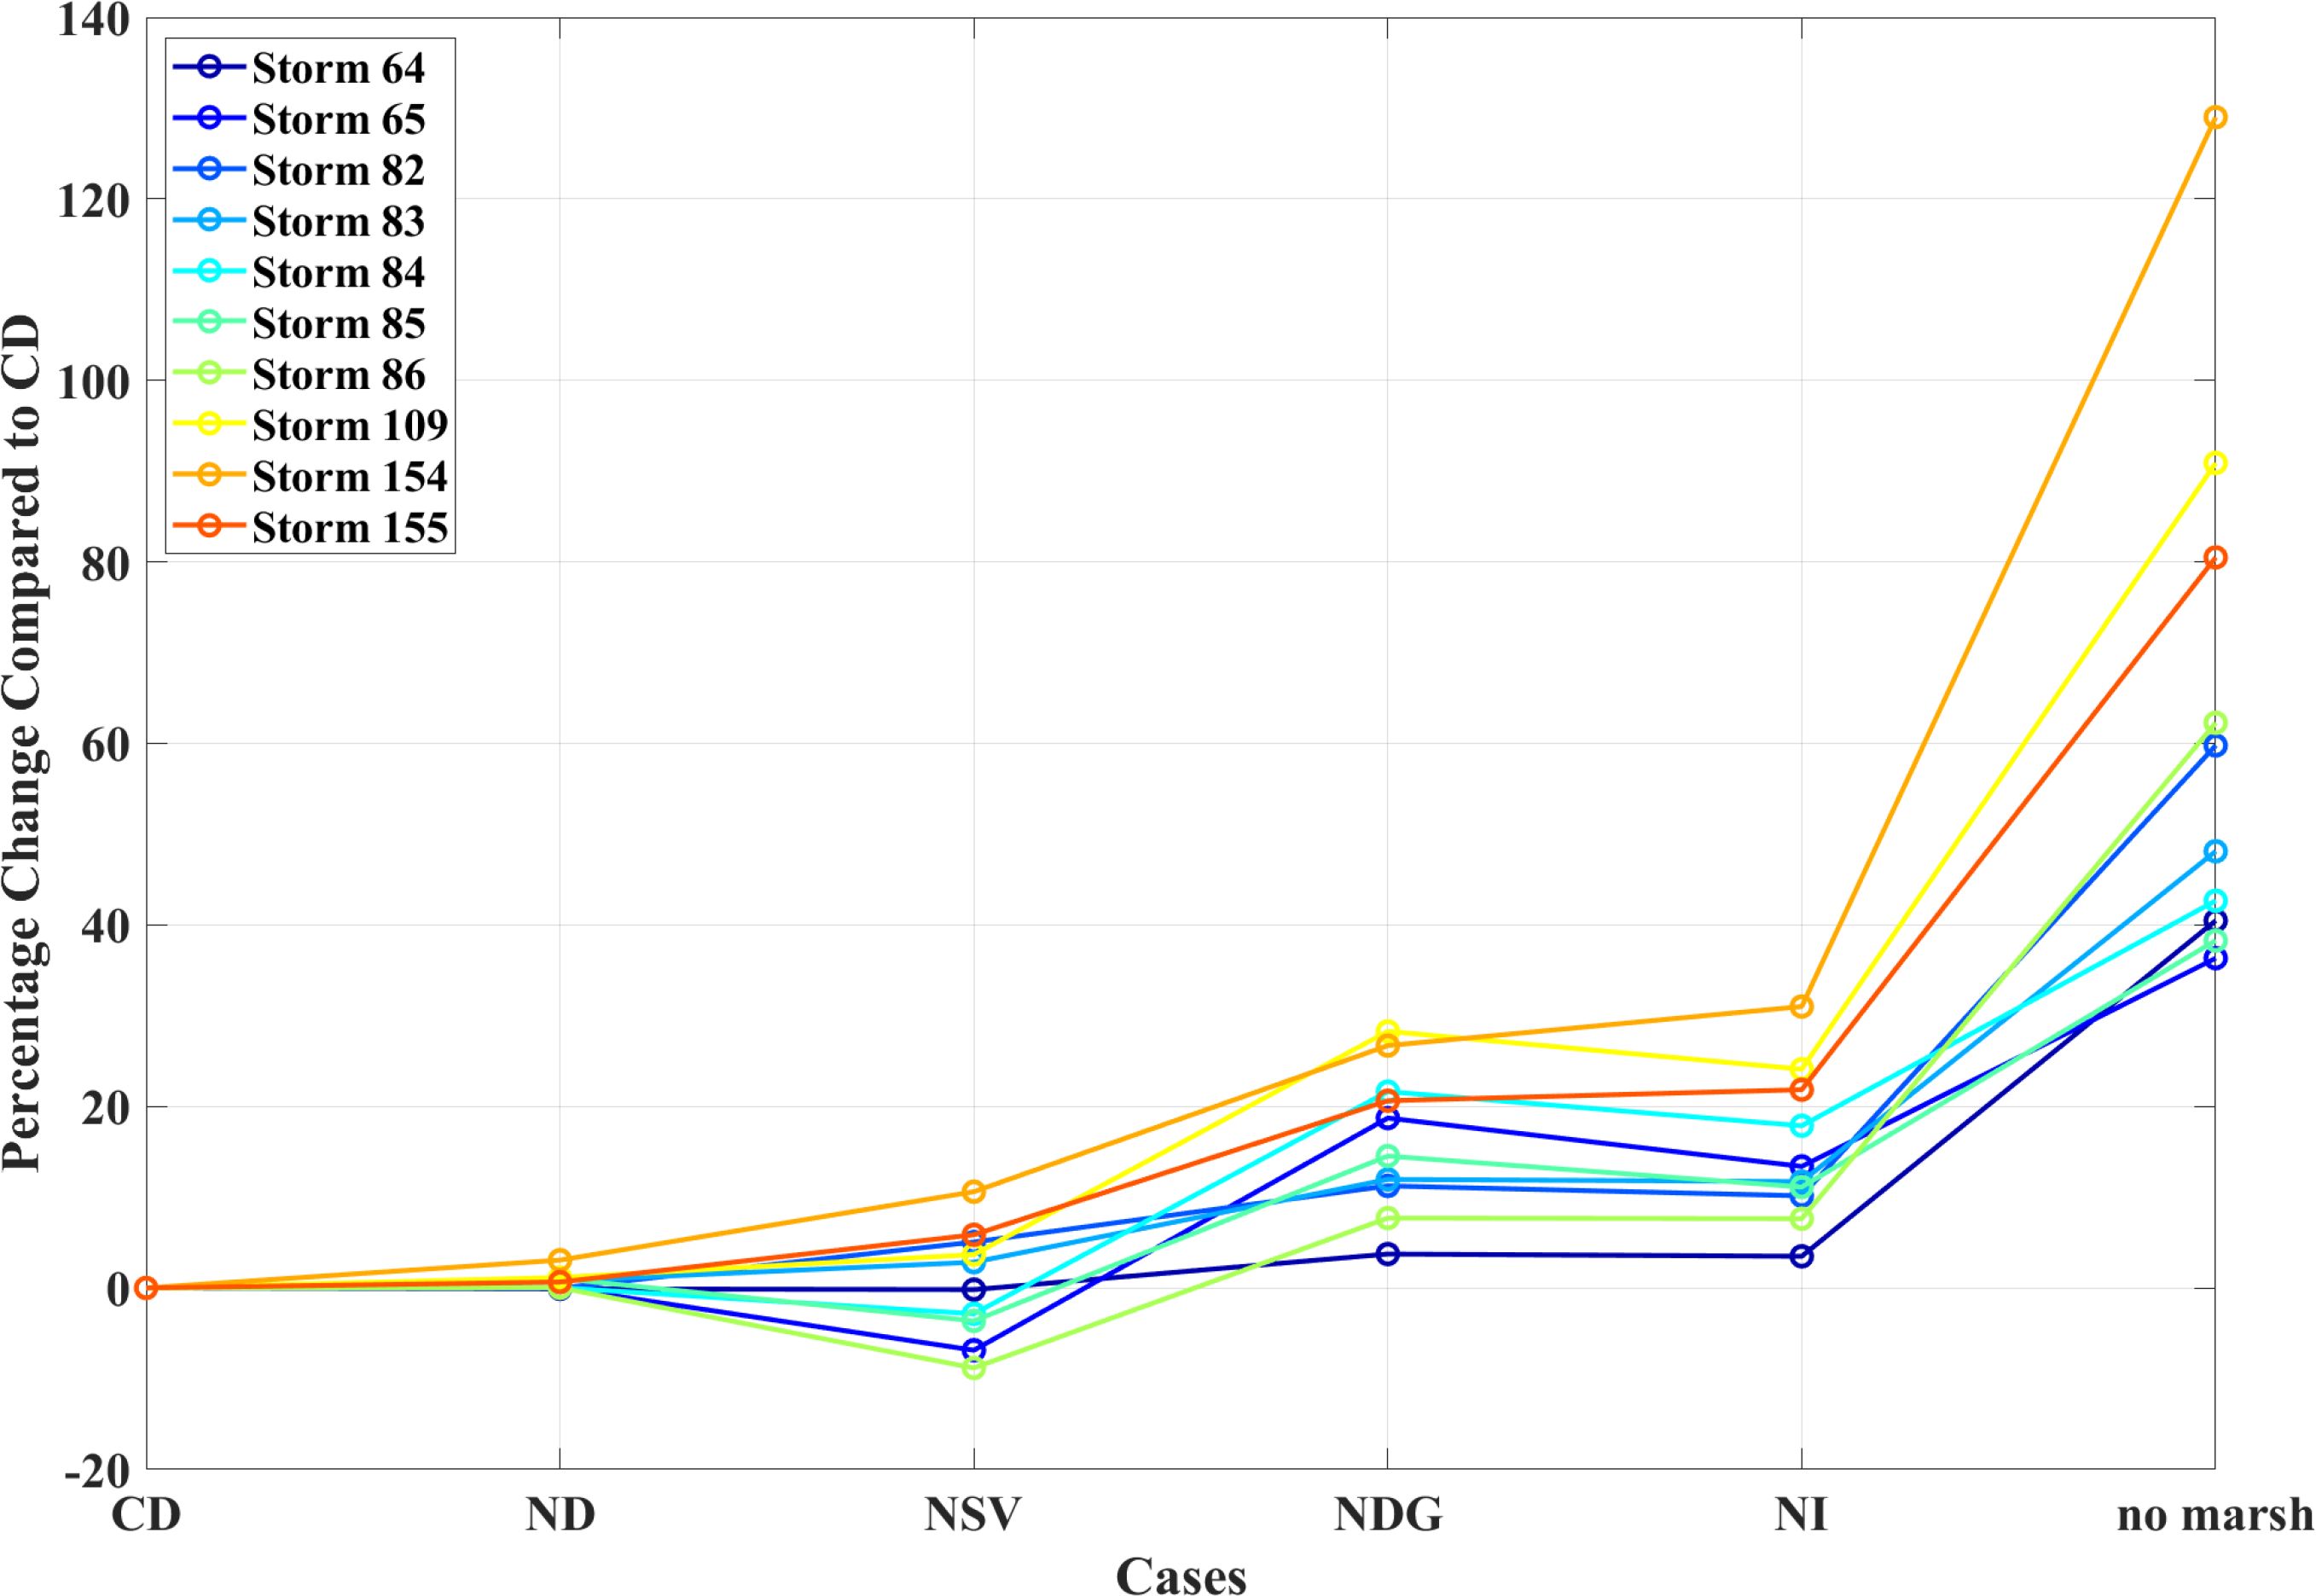
Figure 11. Comparative analysis of maximum inundated areas for different barrier island scenarios compared to existing scenarios.
A descriptive statistical analysis was conducted to understand the maximum inundated area across all 6 cases (Table 2), and the following observations are made:
Table 2. Statistics for all 6 cases for understanding the maximum inundated area (in km2).
1. Role of barrier islands and vegetation: The removal of Dog Island (ND) and St. Vincent Island (NSV) resulted in only a slight increase in the average inundated area compared to the scenario with all islands present (CD). This suggests that both islands play a role in reducing inundation, but their absence does not drastically alter the inundation patterns. The combined absence of Dog and George Islands (NDG) behaves similarly to all Islands absent (NI), leading to the highest increase in inundation area. This emphasizes the collective importance of these barrier islands in protecting inland areas from storm surge inundation. In the” No Marsh” scenario, the inundated area increased to 877.25 km2 from 551.04 km2 [CD], a 59.20% rise.
2. Variability Across Storm Surge Events: The variability indicated by the standard deviation (Table 2) in inundated areas across different storm surge forcings is high for the NDG and NI scenarios. This suggests that the combined absence of Dog and George Islands introduces more variability in how different storm surge events impact the inundated areas. CD and ND, the scenarios with the most islands present, exhibit the least variability, indicating that the presence of islands brings consistency in protection against various storm surges. The standard deviation for the inundated area (km2) in the” No Marsh” case is notably higher at 235.28 compared to 171.81 in the CD scenario. This increased variability suggests that vegetation or bed roughness, in this case, reduces consistency in surge protection across different storm surge events. The presence of marsh vegetation adds a level of resistance to the coastal ecosystem, dampening the impact of varying surge intensities.
4.3 Effect of hydrodynamic forcing and channel ratio
We analyzed the channel ratio (Cr) for all configurations in our study to understand the interactions between storm surge dynamics and the inundation patterns of channels and marshes (Figure 12). In each case, ranging from Complete Domain (CD) to No Islands (NI), the inundated channel area remains constant at 39.68 km2, allowing for a direct comparison of marsh inundation impact.
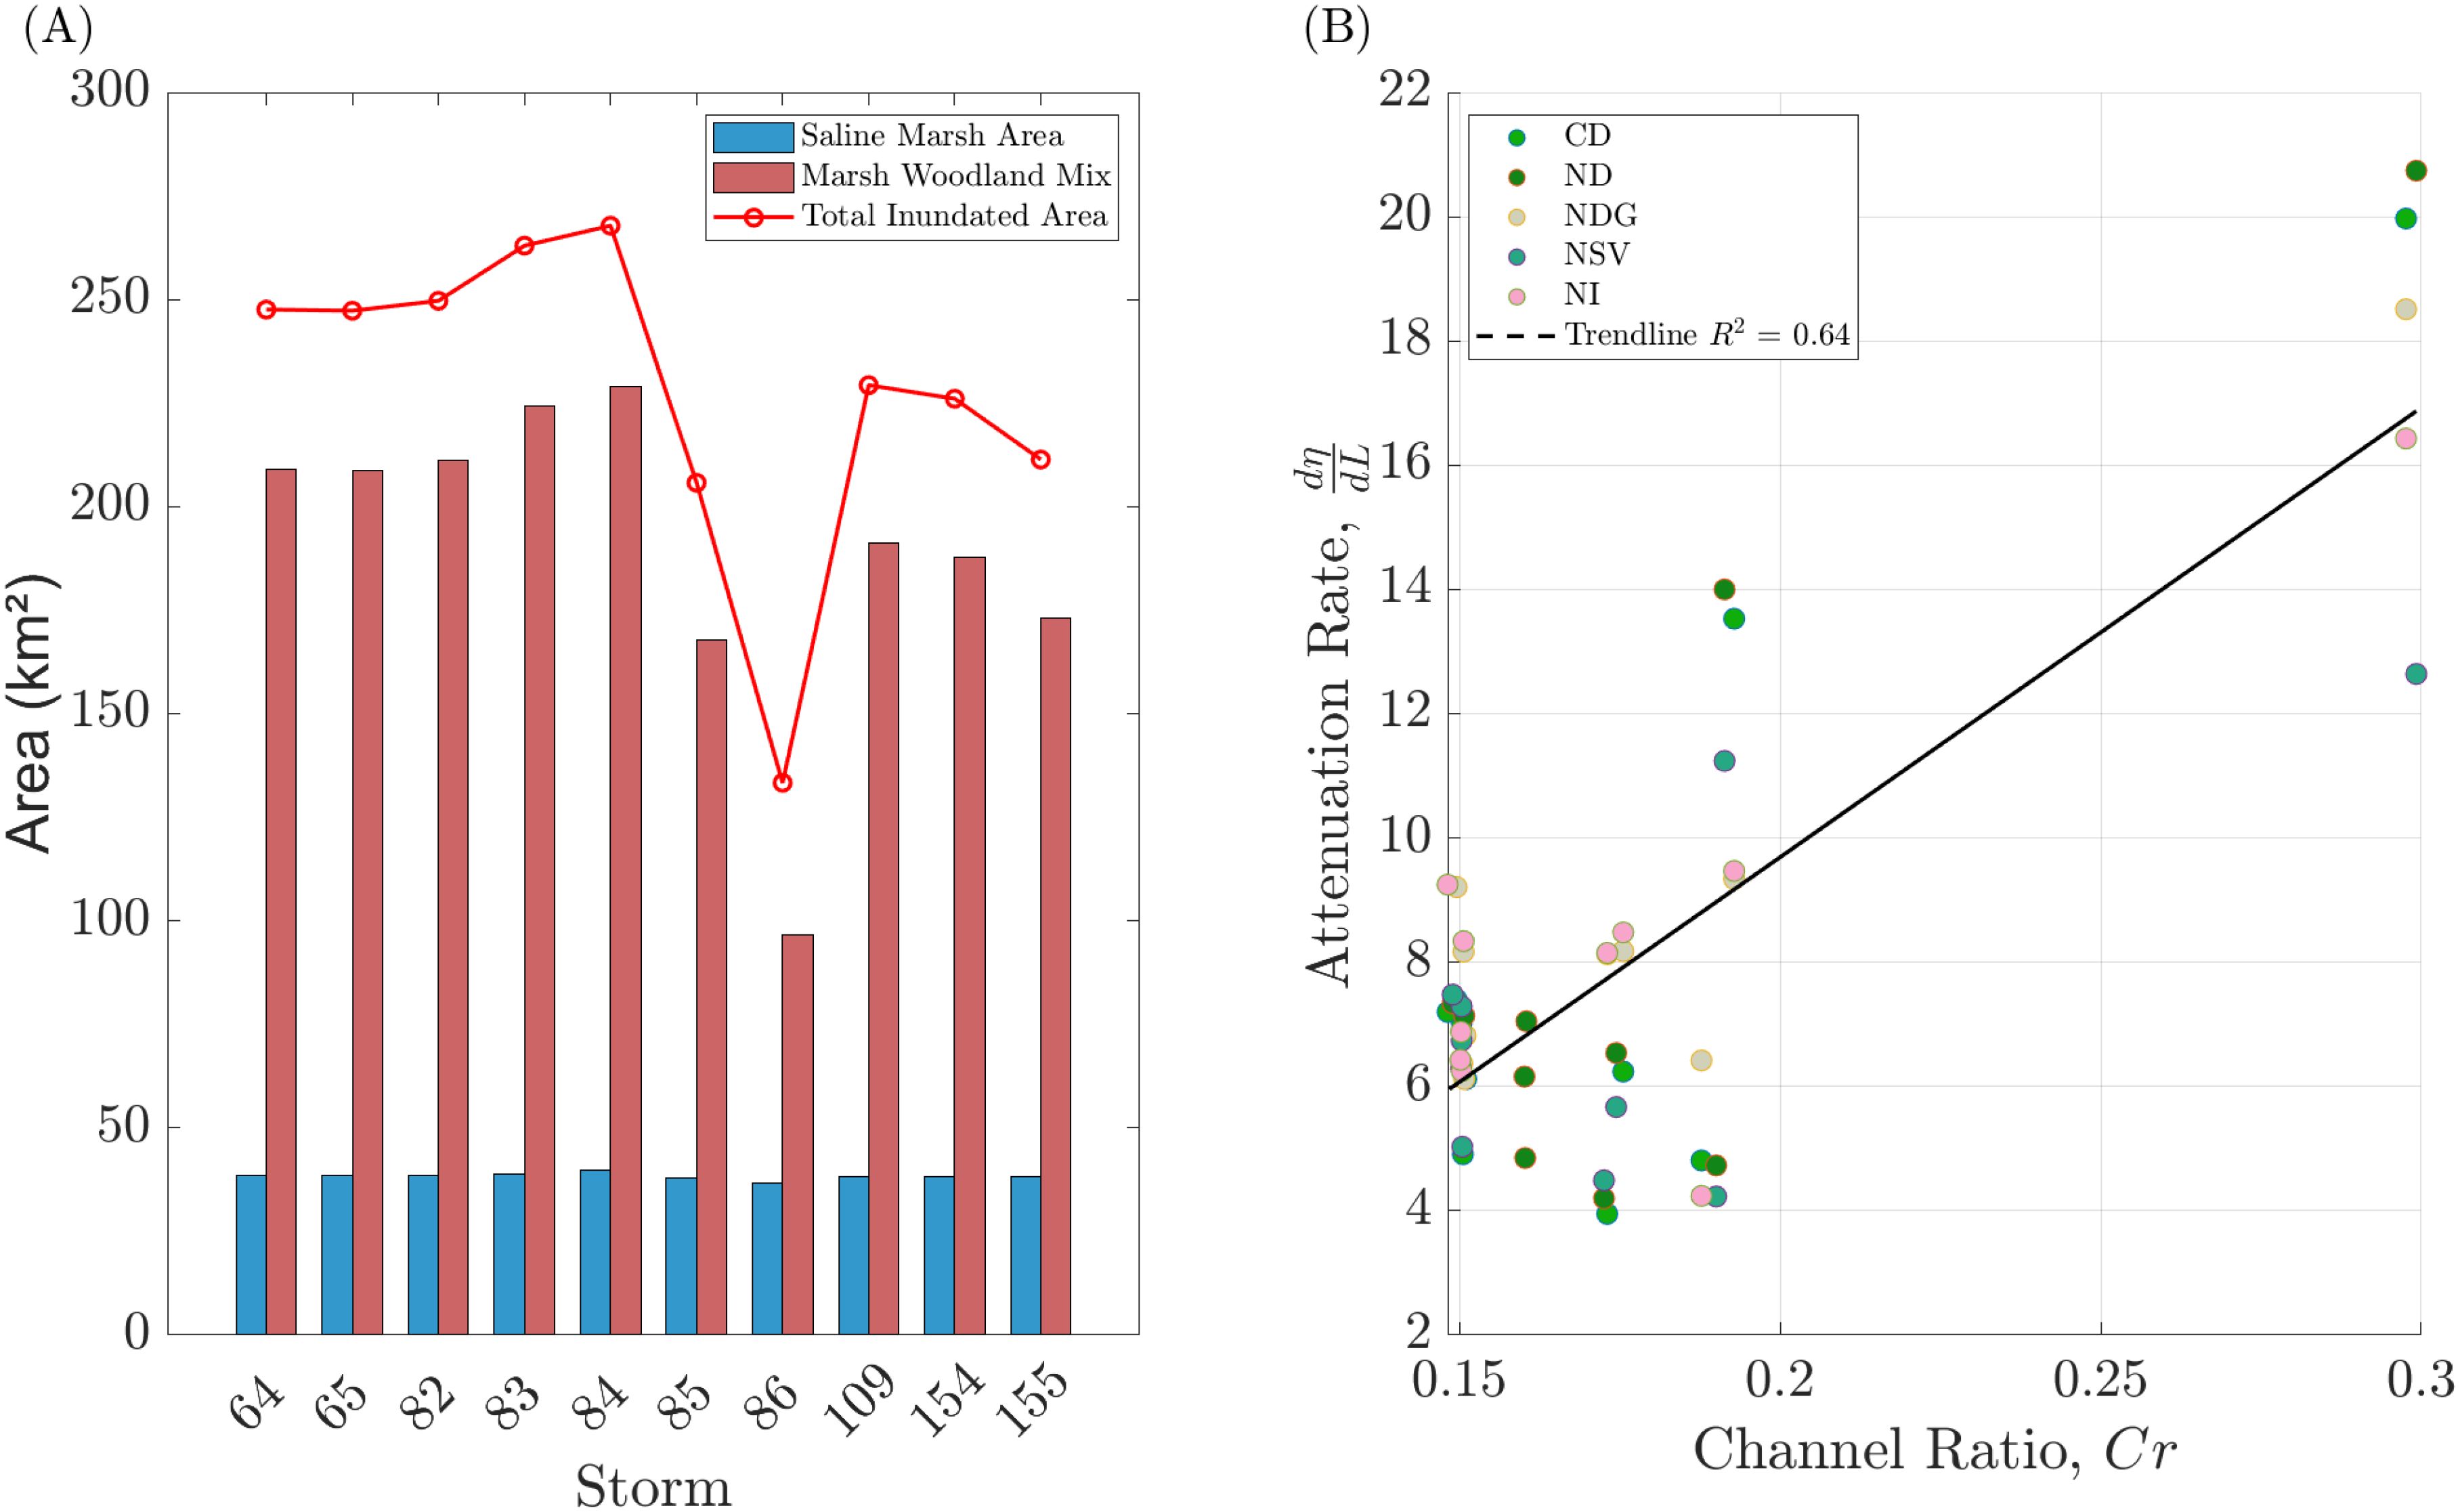
Figure 12. Comparative analysis of coastal marsh areas and channel ratio dynamics across storm events: Panel (A) shows the computed saline marsh area and marsh woodland mix, along with the total inundated marsh area (km2), for varying storm numbers, for the base case CD. Panel (B) shows the trend of the attenuation rate against the channel ratio.
For the case CD, the channel ratios vary across storm events, reflecting the fluctuating impacts on channels and marshes. For example, storm# 86 displays a higher channel ratio (0.297), suggesting a reduced impact on marsh areas due to a lower surge amplitude (2.81 m) and moderate duration (5.75 hr.). In contrast, storm# 84, with its higher amplitude (4.09 m) and longer duration (7 hr.), shows a lower channel ratio (0.148), indicating extensive marsh inundation. Similar patterns are observed in the NDG scenario during storm 84, where the peak marsh inundation correlates with the highest surge amplitudes (5.94 m) and a shorter duration (4.87 hr.). The absence of islands (NI) highlights the marsh inundation as higher surge amplitudes and longer durations consistently lead to lower channel ratios, resulting in extensive flooding. This is seen during storm 83, which combines a high surge amplitude (4.94 m) and extended duration (7.25 hr.) to lower the channel ratio to 0.150. The NSV scenario further underlines a clear trend between storm surge characteristics and the channel ratio, where intense surges (4.35 m, 6.5 hr.) result in higher marsh inundation, reducing the channel ratio (0.148).
The relationship observed between the channel ratio (Cr) and the attenuation rate (Figure 12B) shows an intriguing trend with an R2 value of 0.64 in which higher values of Cr correlate with an increased attenuation rate. Interestingly, in Hewageegana et al. (2022) study based on idealized conditions, observed the opposite trend: attenuation rates decreased as Cr increased. This study observed an increasing trend because as the inundated river channel area was kept constant, an increase in Cr indicates a decrease in the inundated Marsh area based on Equation 2. As the inundation of the marsh area becomes limited, the effect of the marsh dynamics intensifies, resulting in higher attenuation. This relationship underlines the role of balancing channel and marsh areas in understanding optimal flood mitigation outcomes.
4.4 Scale consolidation
The attenuation of storm surge water levels across a wetland segmented into various watersheds is assessed. The attenuation rate in our study is defined as the change in water elevation between two points within a watershed, normalized by the distance between these points. For each watershed, two points are selected: Point A, the outlet point (denoted by a green dot) and Point B, the farthest inundated point from the outlet (connected to point A by a red line) in Figure 7B. Water elevations at each point are determined using the ADCIRC model, while ground elevations are obtained from a Digital Elevation Model (DEM). The attenuation rate is then calculated as shown in Equation 1. To understand the holistic picture of wetland attenuation, we plotted our results obtained from Equation 1 with the prediction feature (P) (Equation 3), which combines the wetland’s spatial scales and the storm’s temporal scales (Figure 13).
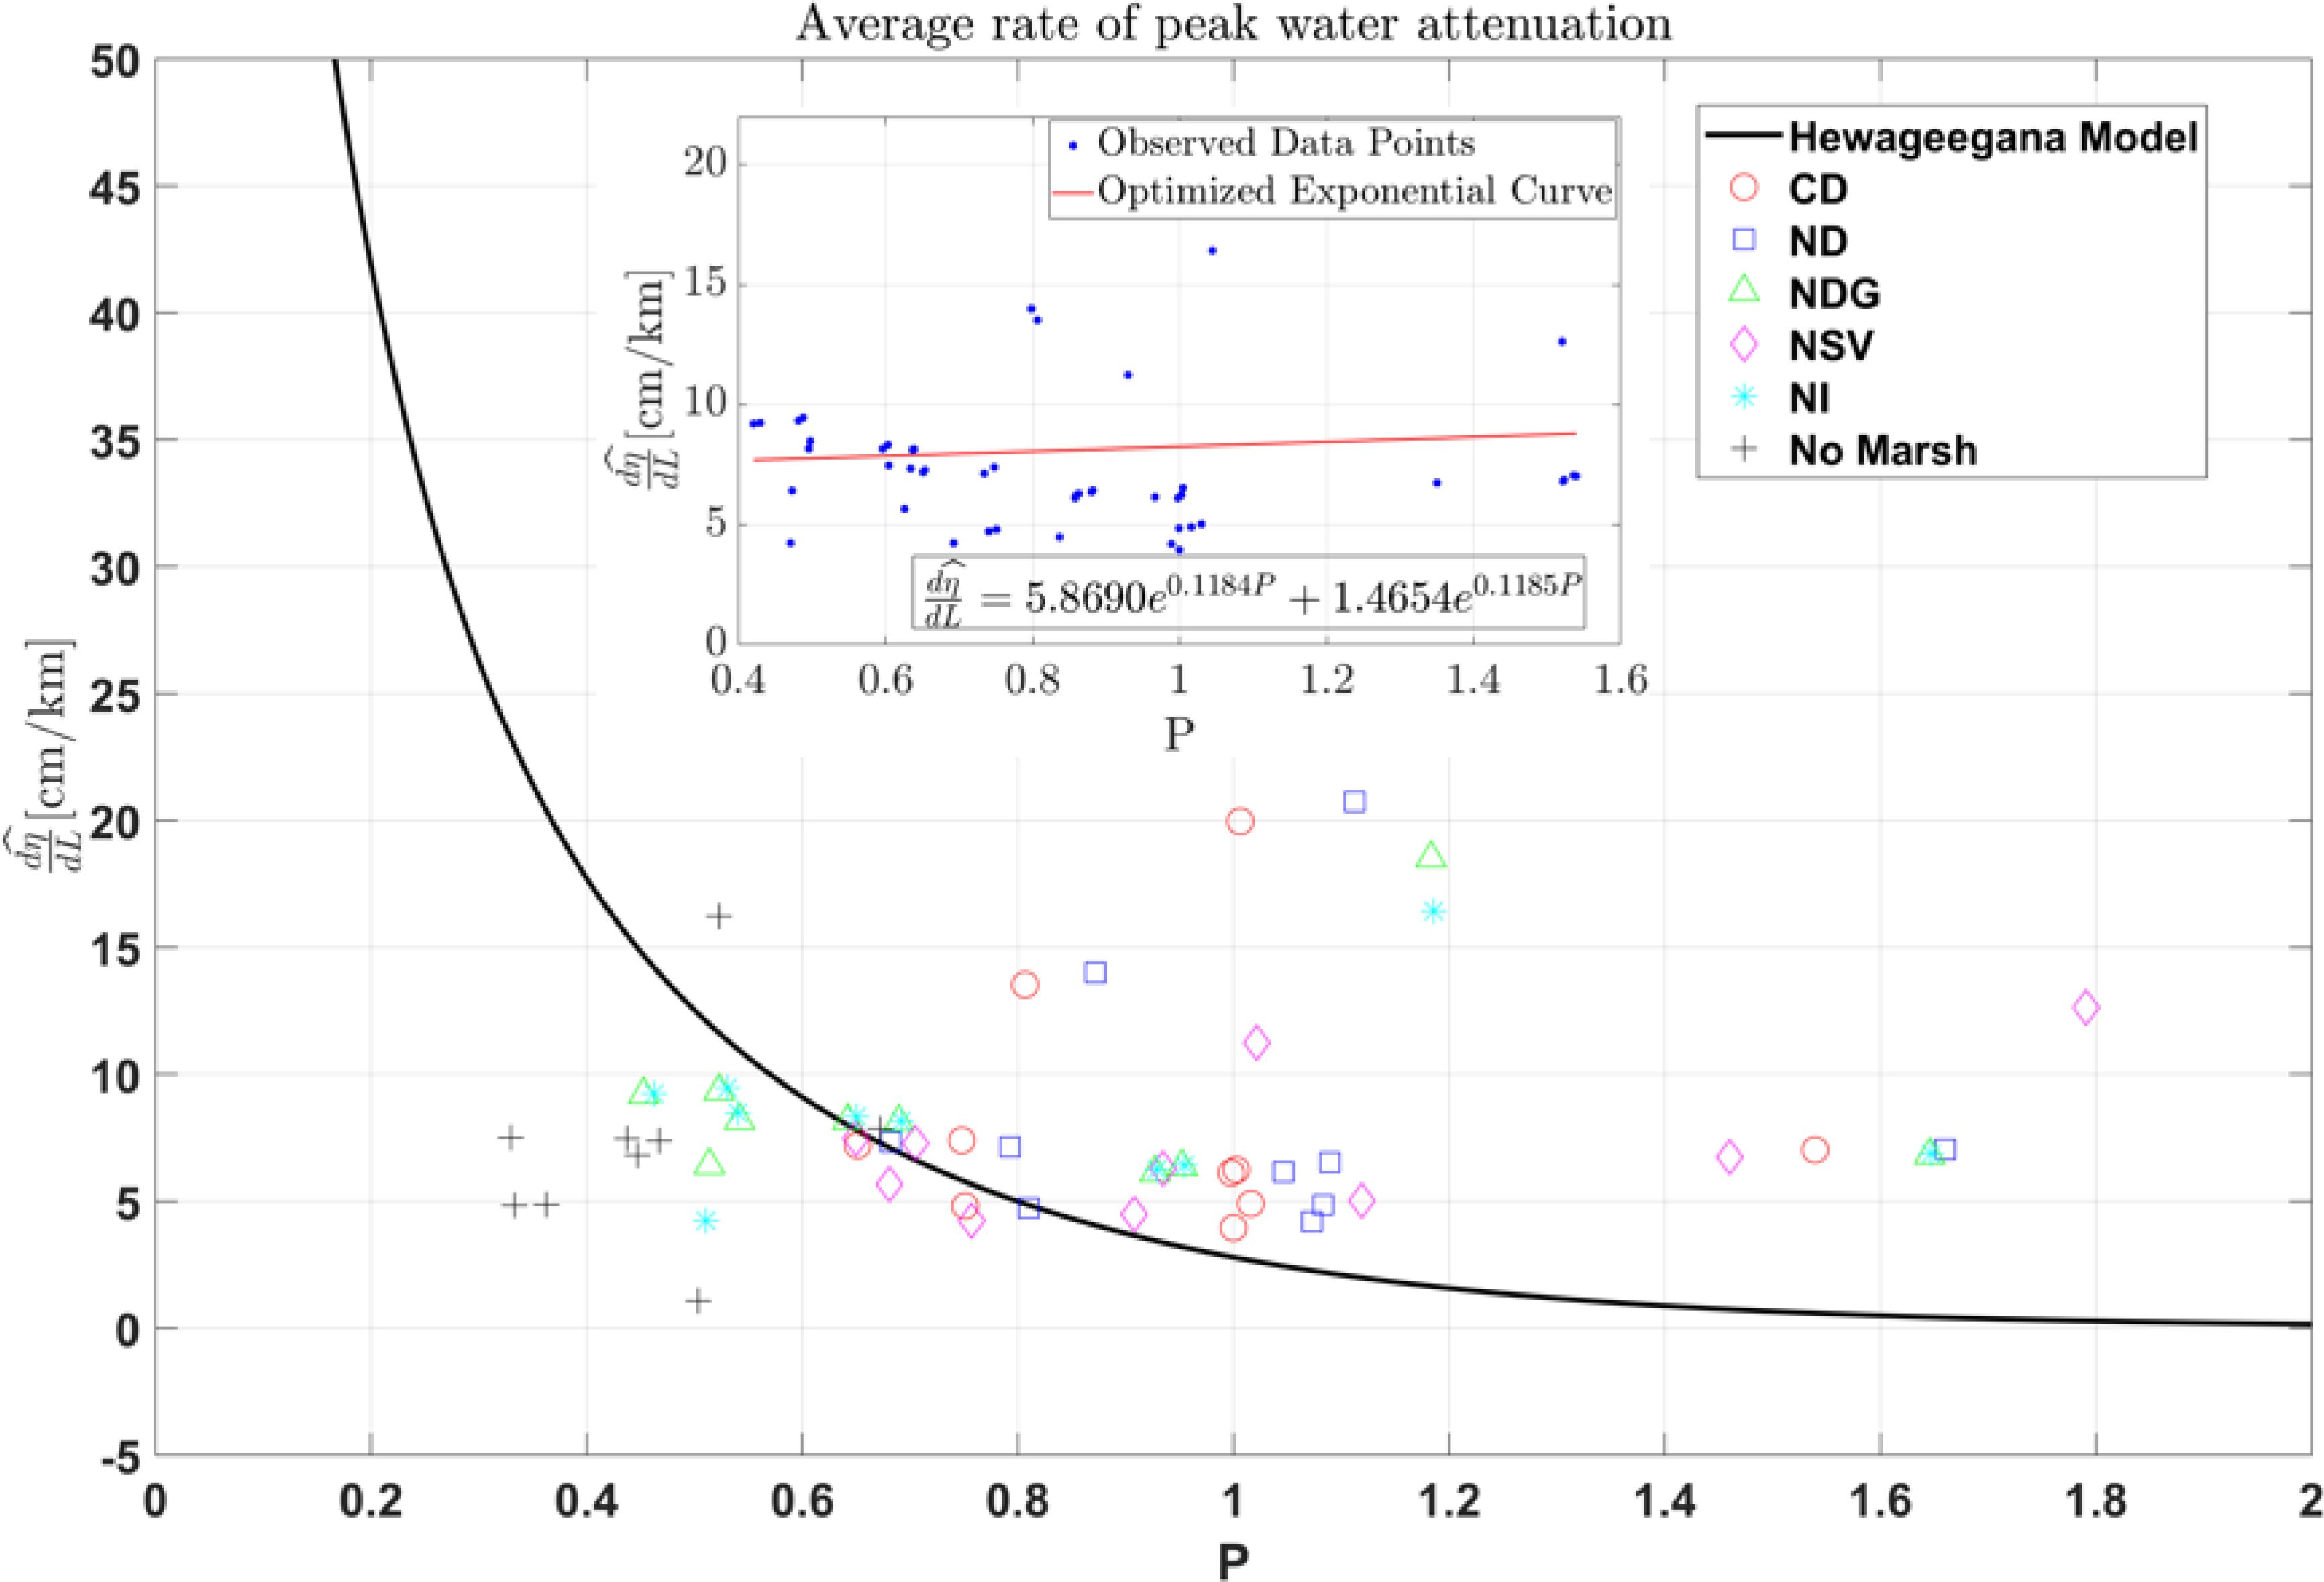
Figure 13. Variation of peak water level attenuation with consolidated prediction feature (P) for all scenarios.
where c, a, and T are constant exponents. The values for the constants are 0.56, 0.47 and 0.67, respectively, adopted from Hewageegana et al. (2022). The results are compared against the Hewageegana et al. (2022) idealized peak water level attenuation exponential function (Equation 4) represented as a black solid line in Figure 13.
In the CD scenario, where both barrier islands and marshes are present, the Prediction factor (P) values range from 0.65 to 1.54, and the corresponding attenuation rate values span from 3.95 to 19.97, indicating effective surge attenuation, particularly at lower P values. The attenuation capacity decreases slightly as P increases, though the system remains relatively effective overall. The ND scenario shows almost a similar pattern as the CD since the removal of Dog Island does not affect the hydrodynamics much. The NDG scenario, with P values ranging from 0.45 to 1.65 and attenuation rate values from 6.12 to 18.51, shows stable attenuation across a broader range of P values. This suggests that despite some reduction in natural defenses, the system maintains a relatively effective attenuation capacity, likely due to other mitigating factors such as vegetation (bed roughness). The NSV scenario, with P values from 0.65 to 1.76 and attenuation rate values between 4.23 and 12.64, shows a sharper decline in attenuation capacity as P increases, indicating greater vulnerability to storm surges under the absence of St. Vincent Island. The NI scenario shows a pattern similar to that of the NSV case. The decline in surge attenuation highlights the critical role of barrier islands in coastal defense. Each island removal reduces the system’s ability to mitigate storm surges. This phenomenon can be partly explained by the island’s impact on modifying flow patterns by creating barriers and potentially influencing flow velocities.
The no marsh scenario, with P values from 0.33 to 0.67 and attenuation rate values between 1.08 and 16.23, shows the most significant decrease in attenuation capacity, particularly at lower P values. The absence of marshlands, critical for dissipating surge energy, leads to poor overall performance in surge mitigation, highlighting its importance. The Hewageegana et al. (2022) model, designed under idealized conditions, assumes a uniform coastal environment with constant bed roughness and regular coastal configurations such as straight channels and no alongshore branches. While this model provides a valuable baseline for storm surge predictions, it needs to include the complexities of natural environments. When comparing our results against the Hewageegana model (Figure 13), scatter around the model’s curve was evident, resulting in an average RMSE value of 7.19. One of the primary reasons for this scatter is the spatial variability in bed roughness. Intertwined channels, tributaries, and alongshore marsh extents within our study area add further complexity. This variability leads to deviations from the model’s predictions, with our observed data reflecting the influence of these real-world complexities. We propose a new predictive model function tailored to the specific conditions of our study area. Using regression analysis, we derived an equation that more accurately accounts for the change in temporal and spatial scales of the storm due to changes in wetland characteristics. While this model provides a more precise representation of storm surge behavior in our context, it is essential to recognize that its applicability may be limited to similar environments.
To capture the attenuation rate with a consolidated prediction factor for our case, a two-term exponential model is employed to establish the relationship between P and , a common approach in modeling to capture non-linear relationships (Lagarias et al., 1998). The function is expressed in Equation 5.
where a1, b1, a2 and b2 are parameters to be optimized using the Nelder-Mead method (Lagarias et al., 1998). Optimization involves minimizing the sum of squared differences between the observed values and those predicted by the model. The attenuation rate function calculated for this study is shown in Equation 6.
Using Equation 6, a value of RMSE 3.79 is obtained, which is a 48% improvement over Equation 4. We integrated the relationship between the attenuation rate and prediction factor obtained in this study (Equation 6) and the Hewageegana et al. (2022) relationship (Equation 4) into a single analytical framework that can give a holistic view of the overall trends and relationships. We utilized a regression approach to integrate data from two distinct exponential models, Equation 4, with P values ranging from 0 to 2, and Equation 6, with P values ranging from 0.3 to 1.6 (observed range in our study). A range of predictor values (P) for both models are generated. These values were then used to calculate the corresponding response values , representing the rate of change of a dependent variable for P. The datasets from these two models were then merged to form a unified set of predictor-response pairs formulated as:
The final attenuation equation (Equation 7) provides an attenuation rate curve specific to the Apalachicola wetlands. In contrast to the attenuation function from Hewageegana et al. (2022), which shows minimal or no attenuation when P > 1 and even negative attenuation as P further increases, our function demonstrates a gradual increase in attenuation once P exceeds one (Figure 14). This behavior reflects the dominant influence of the wetland’s spatial characteristics, specifically the channel ratio discussed in Section 4.3.
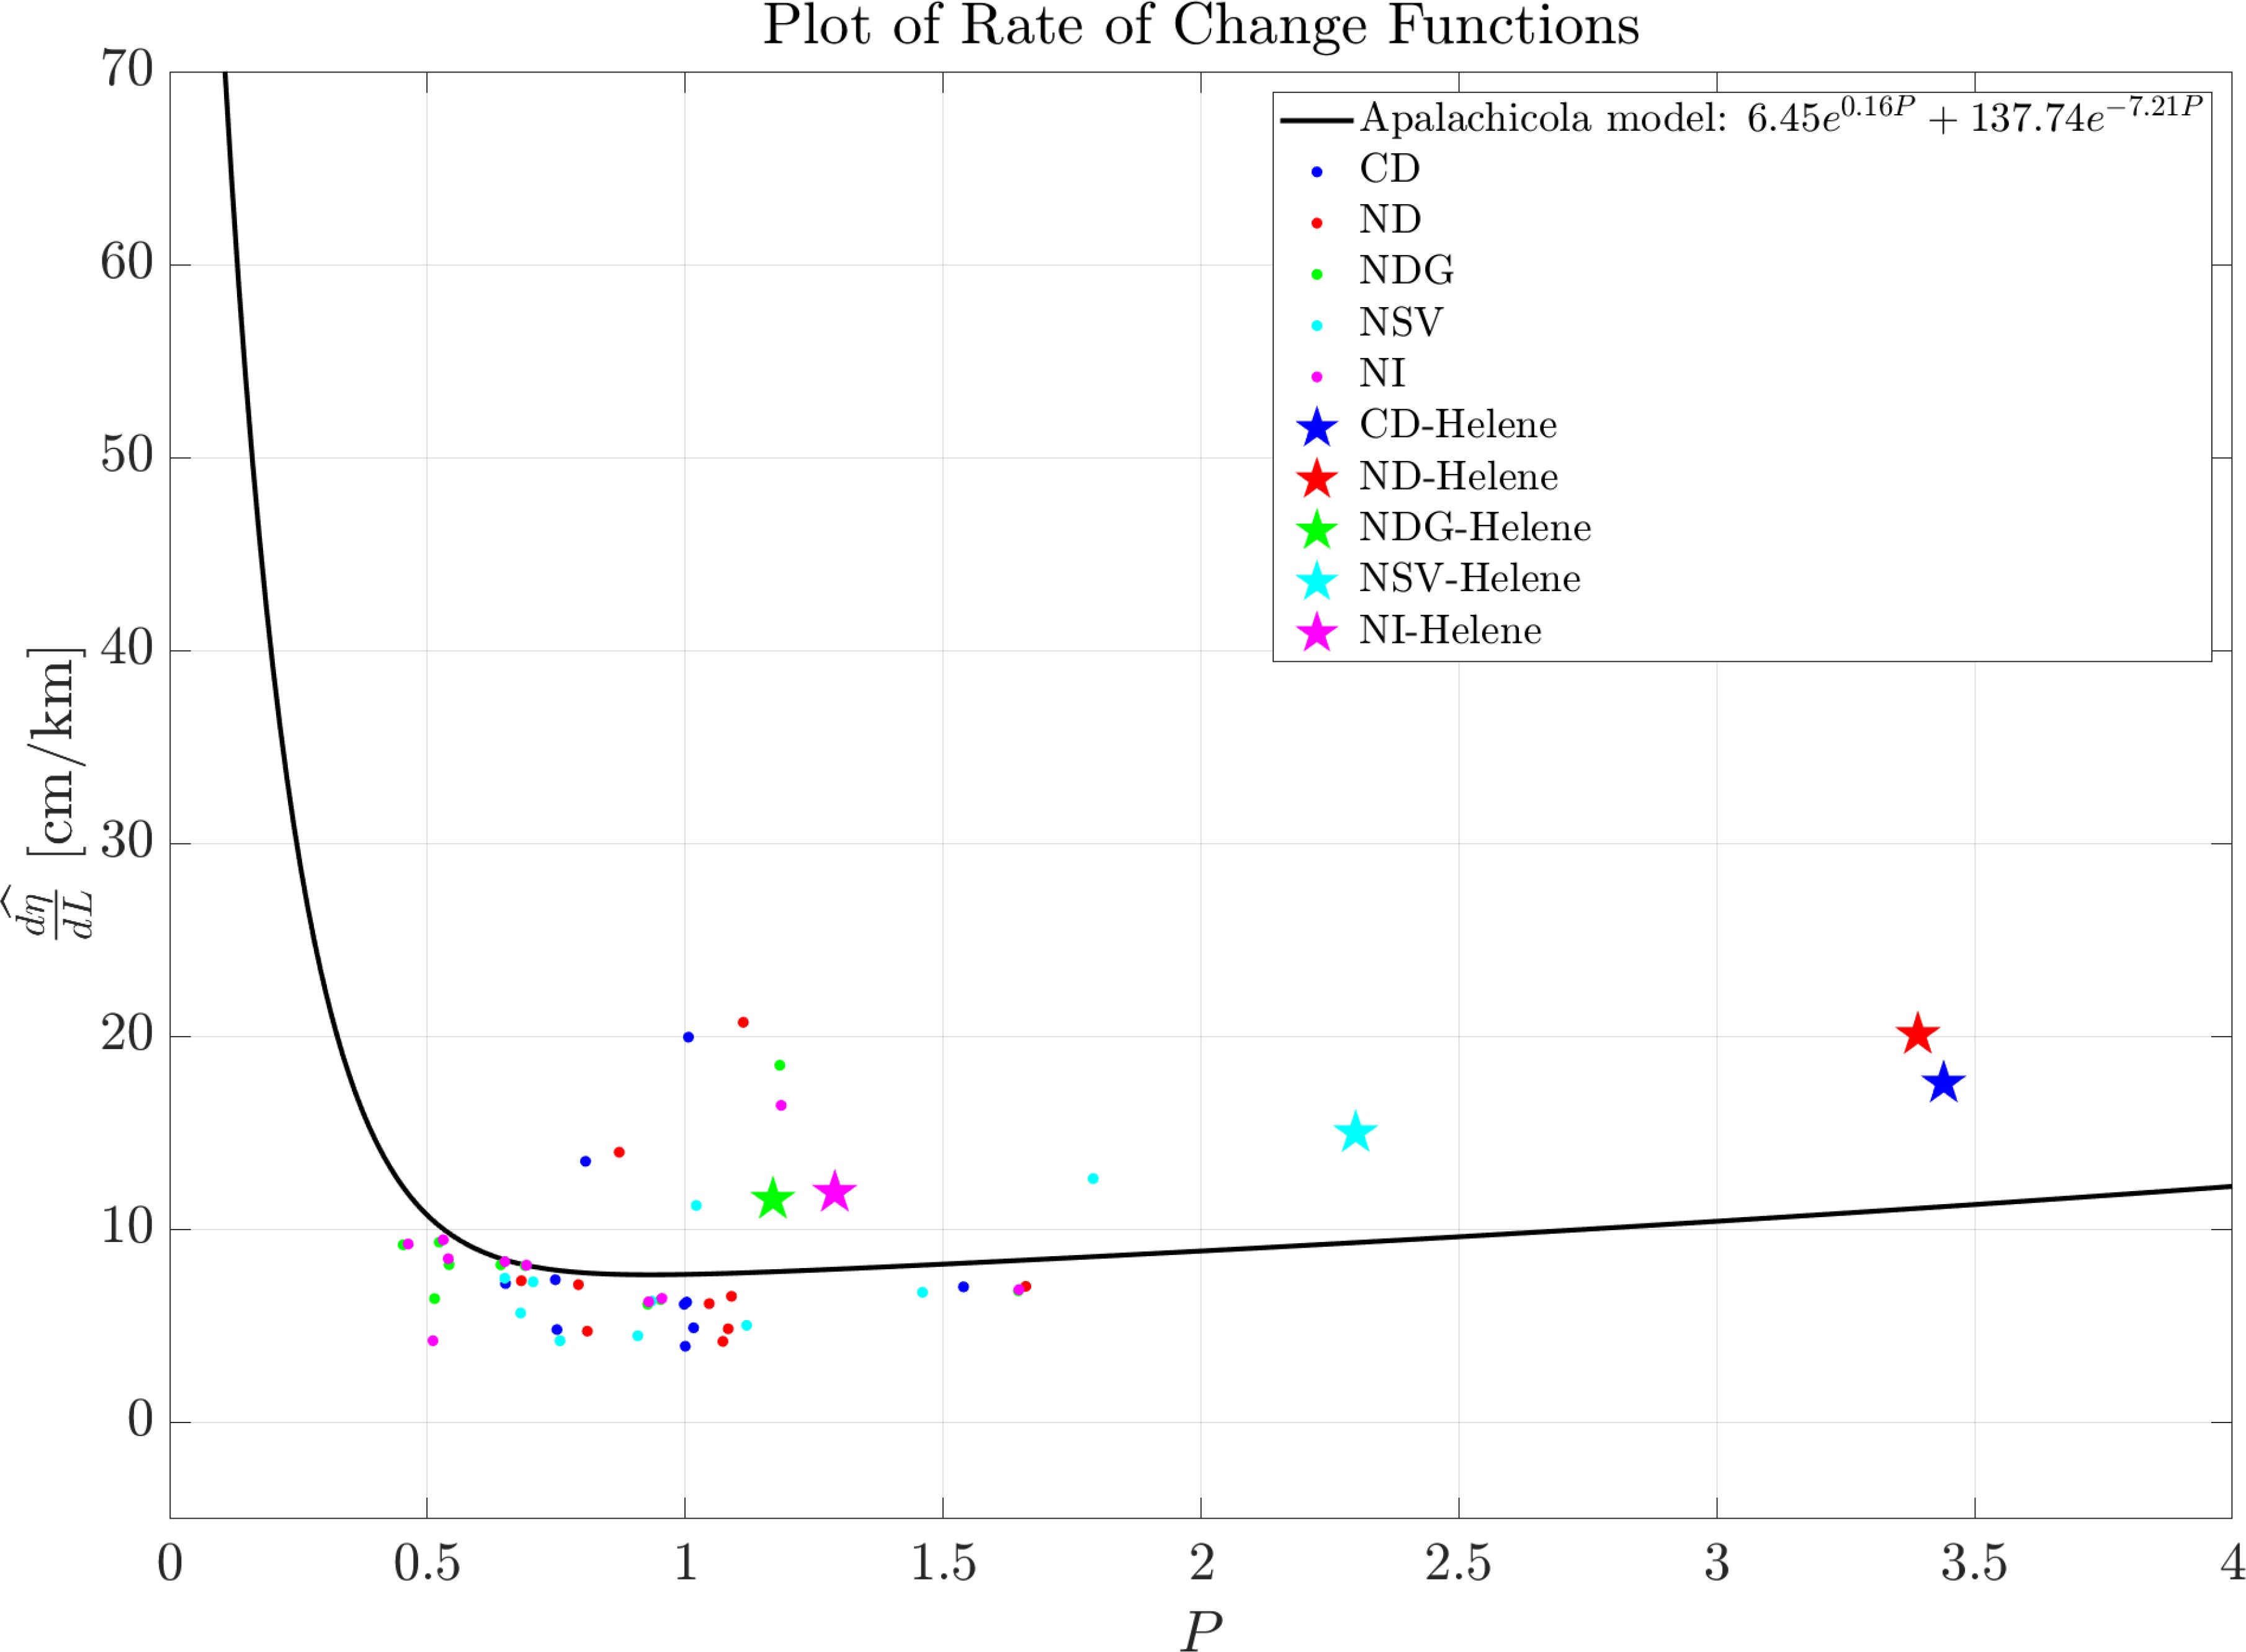
Figure 14. Variation of water level attenuation with consolidated prediction feature (P) for Apalachicola wetland. The rate curve is integrated by combining the Hewageegana et al. (2022) curve for P values less than 0.3 with the observed values from the current study for P values greater than 0.3.
Our attenuation function comprehensively models a wetland system with spatially variable bed roughness, branched channels, and shoreline-extending marshes. Derived using synthetic storm events, this function was further validated by simulating the attenuation rates during Hurricane Helene (Figure 14). Hurricane Helene, a Category 4 storm, made landfall in Florida near the Aucilla River in the Big Bend area on September 26, 2024, around 11 p.m (National Hurricane Center, 2024). The Generalized Asymmetric Holland Model (GAHM) was used to account for the near-field wind and pressure based on the National Hurricane Center’s (NHC) best-track for Hurricane Helene. Details regarding the development of GAHM can be found in Gao (2018) and Dietrich et al. (2018) The modeled attenuation rates during Hurricane Helene closely align with our modeled function, showing an average accuracy of approximately 70%. Higher P values (3-4) were recorded for configurations with all barrier islands present (CD) or with Dog Island absent (ND) compared to scenarios with additional island absence (NDG, NSV, NI). The presence of barrier islands contributed to an higher Cr, as the islands effectively reduced flooding on the marsh, enhancing attenuation. In contrast, when all islands were absent, the marsh experienced greater inundation, leading to lower P values (1-1.5) and reduced Cr, underscoring the islands’ protective role in maintaining marsh attenuation capacity against storm surges.
5 Theoretical maximum attenuation rate
Many studies, including this one, have established that wetlands such as marshes play a vital role in attenuating surge heights in coastal regions, thereby protecting inland areas. However, this protective capability is not limitless; it depends on various factors, including the density and type of vegetation, water depth, flow velocity, and bed friction. Establishing a maximum attenuation rate allows us to quantify the theoretical peak at which a wetland can attenuate water levels before its buffering capacity is overwhelmed. This maximum rate is essential for assessing the resilience of a wetland under extreme storm conditions. For instance, during severe storm surges, wetlands may reach a threshold beyond which their attenuation effect diminishes significantly, making coastal regions more vulnerable to flooding. By identifying this threshold, we can better understand the limitations of natural defenses and guide the design of resilience strategies that combine natural and engineered solutions.
We developed a maximum attenuation rate equation based on the simplified 1D momentum balance equation, incorporating key factors such as bed friction (Manning’s n), water depth (h), and flow velocity (u). The resulting Equation 8, which expresses the attenuation rate Δη/L in terms of friction slope (Sf), provides valuable insights into how physical and environmental conditions influence storm surge attenuation. For further details, refer to the Supplementary Material on the complete derivation of the maximum attenuation rate equation.
The derived equation shows that the attenuation rate is governed by bed friction and the flow’s physical characteristics, such as water depth and velocity. In the context of our study, this framework allows for the estimation of a theoretical maximum attenuation due to flow through a marsh, focusing on the influence of frictional forces and marsh geometry. By assuming steady flow and small marsh areas, the model isolates the key factors affecting water surface elevation changes over a given flow length L.
To quantify the influence of physical parameters, we performed a sensitivity analysis (Figure 15), demonstrating how variations in Manning’s n, water depth h, and velocity u affect the attenuation rate. The relationship between water velocity and depth is captured by the scaling parameter , which assumes a proportional relationship between velocity and the square root of depth, as supported by previous studies (Friedrichs and Aubrey, 1996; Neumeier and Amos, 2006).
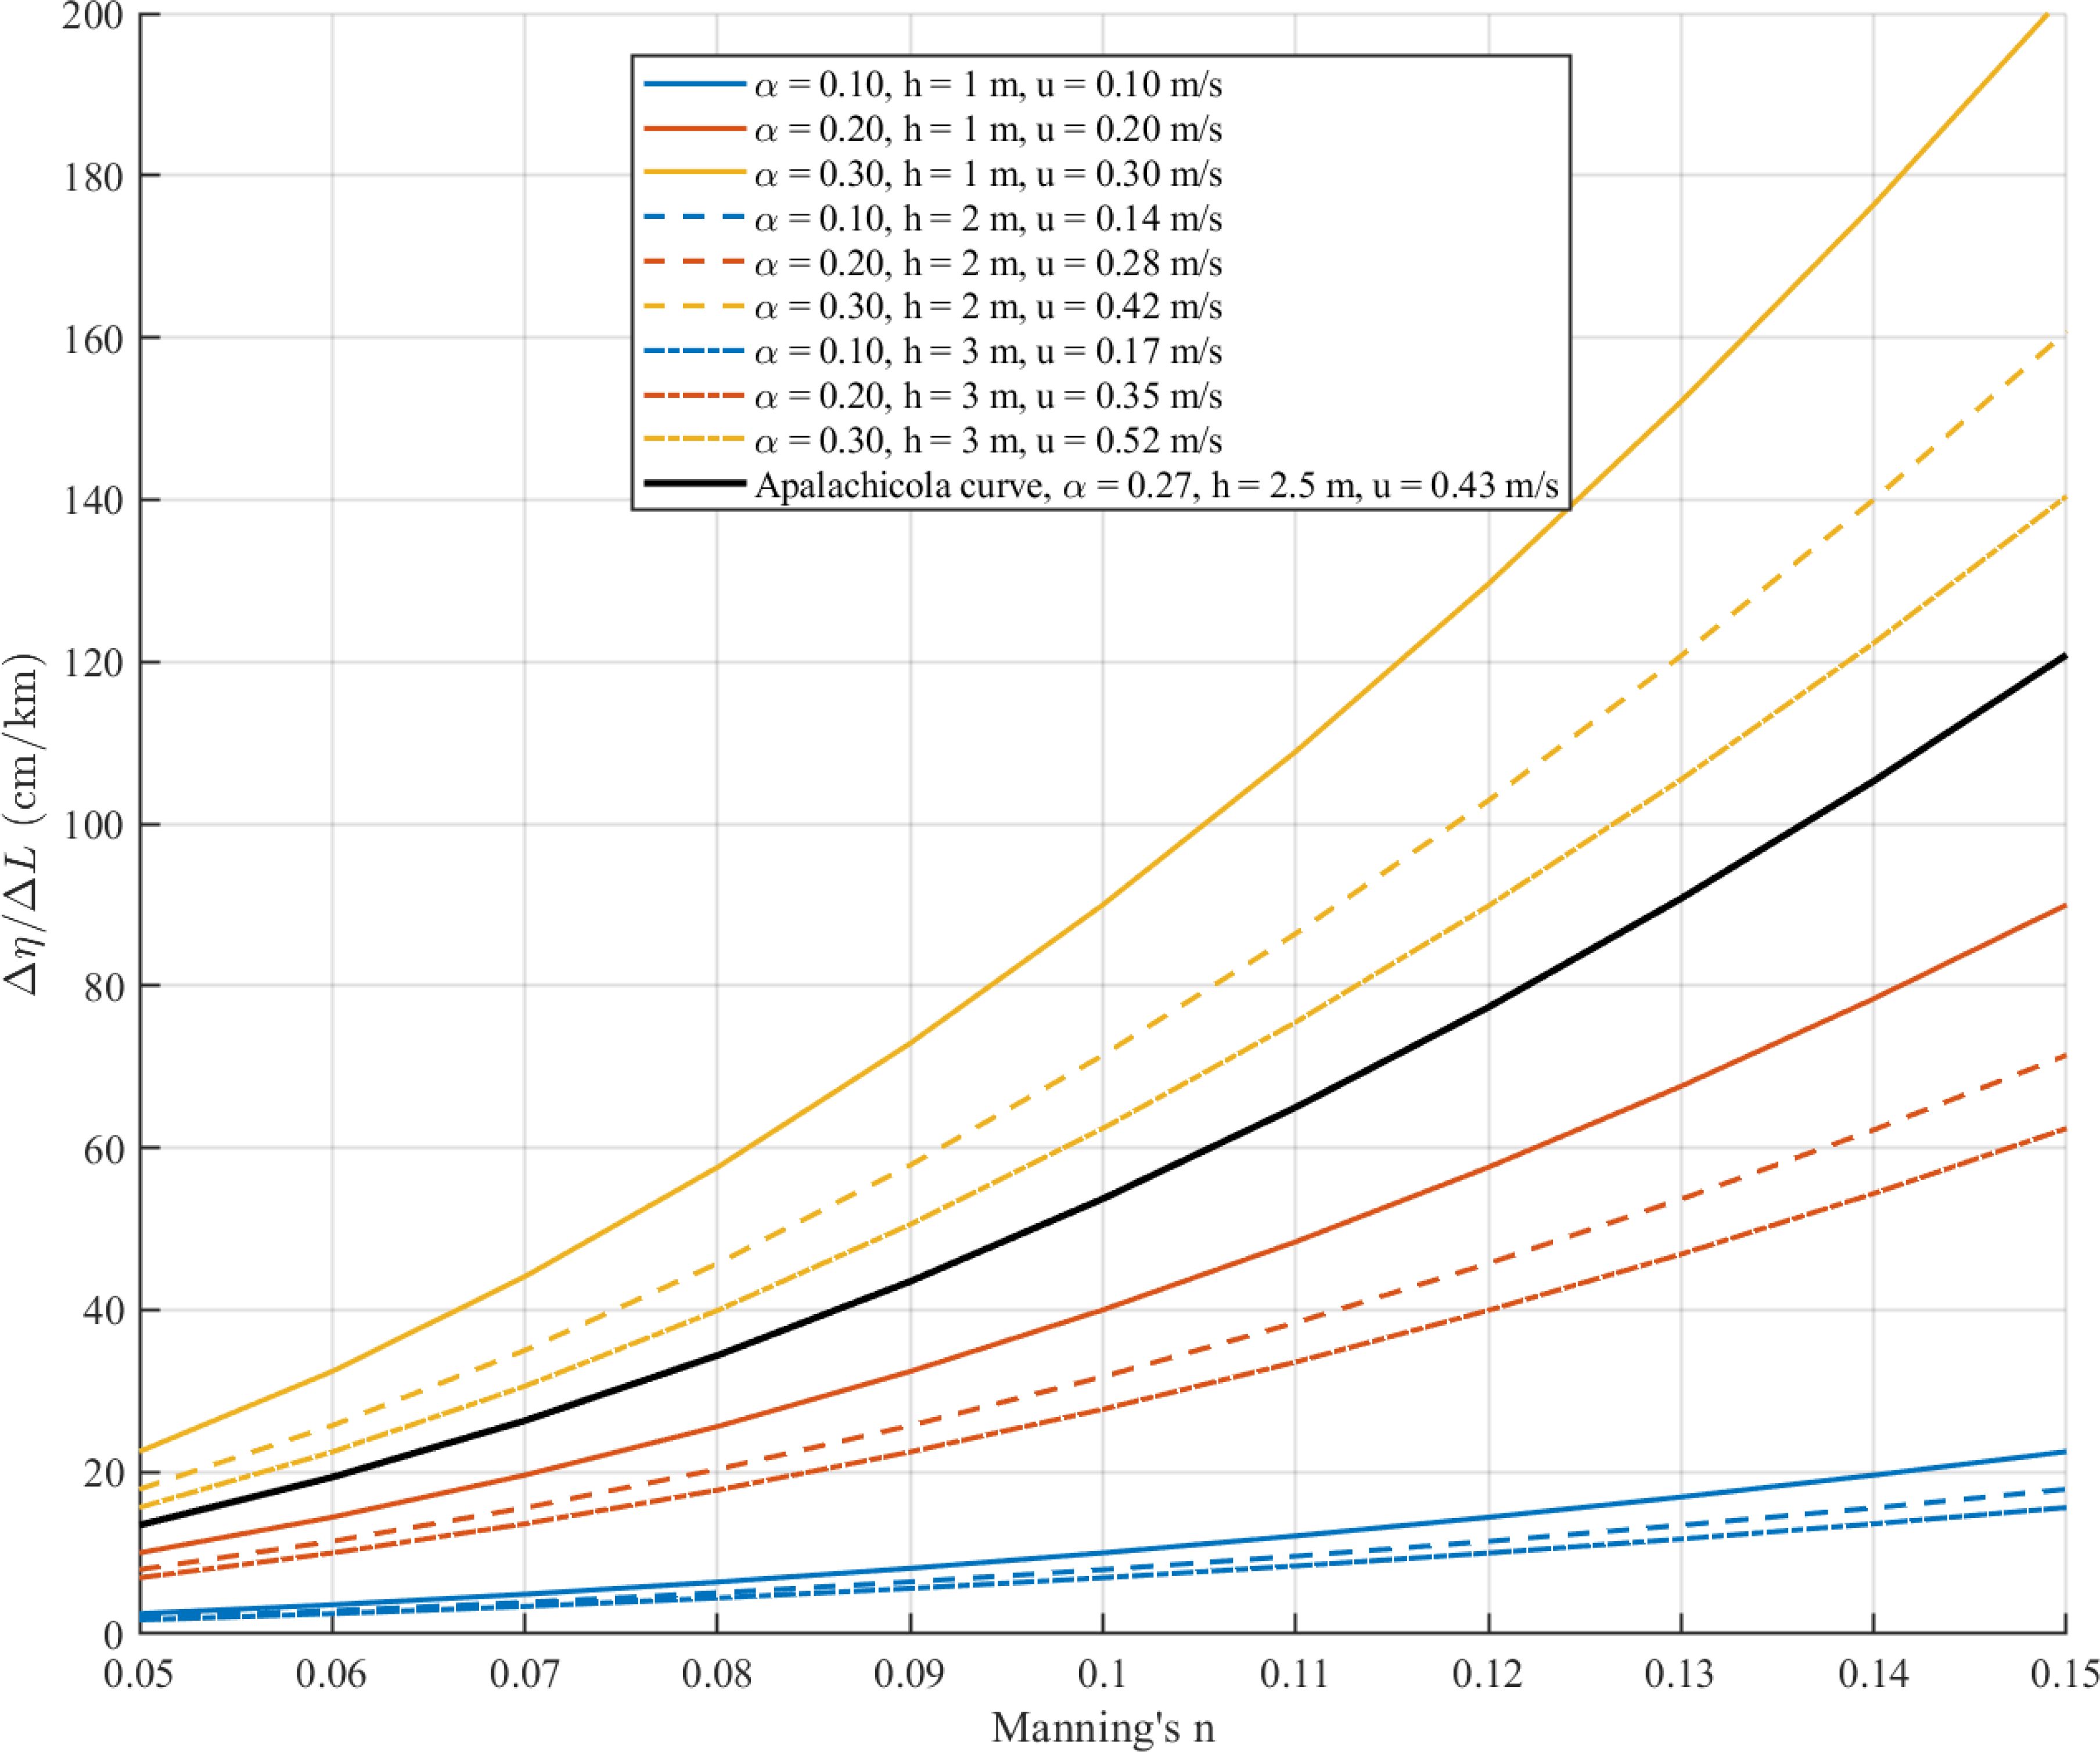
Figure 15. Sensitivity of attenuation rate Δη/L to Manning’s n for various water depths (h) and scaling parameters (α) with the Apalachicola curve (in black).
We considered water depths of (h = 1, 2, 3 m) to capture a representative range of conditions typically encountered in coastal and marsh environments. Shallow water, such as (h = 1, m), is characteristic of marshes and intertidal zones, where frictional interactions with vegetation and the seabed heavily influence wave energy dissipation. In such environments, bottom friction and surface roughness are key in dissipating energy (Friedrichs and Aubrey, 1996). For deeper water depths, such as h = 2−3m, we focus on conditions more representative of storm surge events. The α values are calculated based on the velocity range from (0.1 – 0.6, m/sec) that is typically observed in coastal marsh and estuarine systems (Leonard and Luther, 1995; Kjerfve and Proehl, 1979).
The results of the sensitivity analysis (Figure 15) show that the attenuation rate increases quadratically with n, as expected, since surface roughness is critical in dissipating wave energy. This finding aligns with previous studies that have shown higher roughness values, commonly associated with vegetated marshes and natural barriers, tend to reduce flow velocities and attenuate storm surges more effectively due to increased frictional forces (Wamsley et al., 2010; Moller¨ et al., 2014).
We observe an increase in the attenuation rate for higher values of α, which represent scenarios with relatively higher velocities or shallower depths. The higher velocities may amplify frictional effects, resulting in stronger energy dissipation. As α increases from 0.1 to 0.3, corresponding to velocities ranging from 0.1m/sec to 0.6m/sec, the attenuation rates become more sensitive to changes in n. This may be due to higher velocities causing more intense interaction between the flow and the rough surface, leading to greater energy losses. It is important to note that this formulation assumes that the marsh has a linear slope (no bumps and valleys) and that there are no tidal creeks.
We plotted a curve for Apalachicola conditions, characterized by an average of all maximum water depths observed from the model across all watersheds (h = 2.5m) and an average of maximum water velocity (0.43 m/sec) at the farthest inundated node, reflecting real-world dynamics in the Apalachicola coastal region. Attenuation rates ranging from 13-120 cm/km are observed for bed roughness varying from sparse and short vegetation (n = 0.05) to dense and taller vegetation (n = 0.15). This curve is crucial for understanding the upper limit of water energy dissipation that can be achieved in the Apalachicola region under storm surge or high-flow scenarios. By understanding the maximum attenuation capacity, coastal engineers and environmental planners can optimize the placement and design of natural defenses, such as marshes or barrier islands, to achieve the highest possible energy dissipation.
6 Conclusion
This study focuses on understanding storm surge dynamics and their interaction with coastal ecosystems, particularly the role of barrier islands, marsh vegetation, and channel characteristics in a real-world landscape. By simulating various scenarios, including removing barrier islands and marshes, we could quantify the protective capabilities of these natural features. Our results indicate that eliminating barrier islands led to an increase of up to 15% in flooding areas, while marsh absence—defined by spatial bed roughness—resulted in up to a 60% rise in flooding. Additionally, the calculated attenuation rates for different storm surge scenarios highlight the variability in protection offered by these natural features. The results demonstrate that barrier islands and marsh vegetation are critical in reducing surge amplitudes and protecting inland areas. Our proposed attenuation rate function based on the Apalachicola Bay prediction factor addresses idealized models’ limitations by incorporating the complexities of real-world coastal environments. This includes considering spatial variability in bed roughness, complex channel networks (channel-to-marsh ratios), and the varied influence of barrier islands in our simulation. Our new approach of delineating watersheds within the study area to calculate attenuation rates during storm surges allows for a spatially detailed and context-specific analysis of surge impacts. By effectively combining the trend of the response variable from the theoretical model by Hewageegana et al. (2022) with our simulation results, we established a unified general equation that offers a more comprehensive and realistic modeling approach for assessing surge impacts in different coastal settings with an improved RMSE of 48%. We observed higher channel ratios, corresponding to a smaller inundated marsh area relative to the channel area, produced high attenuation rates. We derived a relationship between the maximum attenuation rate using a 1D momentum-based equation, accounting for Manning’s n, water depth, and water velocity. This is a critical metric for understanding the upper limits of a wetland’s capacity to mitigate storm surges. This sensitivity analysis revealed that bed roughness and water depth changes significantly affect attenuation rates, particularly in shallow, highly vegetated regions. While the predictive attenuation function proposed in this study is unique to the Apalachicola wetland, the overall methodology offers a framework that can be adapted to other coastal environments. The approach provides insights into how natural defenses, such as marshes and barrier islands, can be integrated into resilience planning. This is especially relevant for nature-based solutions, which can complement or reduce the need for traditional engineered defenses like seawalls. By quantifying the surge attenuation potential of ecosystems, this study guides policymakers on prioritizing coastal restoration and land use projects. The findings also underscore the importance of natural defenses in mitigating storm surges and preserving coastal ecosystems. Understanding the relationship between landscape features and surge attenuation will enable more informed decisions regarding conservation and development, ultimately enhancing coastal resilience in the face of rising sea levels and increasingly severe storms. Future work should refine these models, incorporate additional environmental factors, such as sediment transport and vegetation dynamics, and integrate tidal forcing and seasonal sea-level change to evaluate its combined effects with storm surges to provide an even more comprehensive real-world hydrodynamcis of coastal protection mechanisms.
Data availability statement
The original contributions presented in the study are included in the article/Supplementary Material. Further inquiries can be directed to the corresponding author.
Author contributions
AG: Conceptualization, Data curation, Formal analysis, Investigation, Methodology, Software, Validation, Visualization, Writing – original draft, Writing – review & editing. MB: Conceptualization, Data curation, Formal analysis, Funding acquisition, Investigation, Methodology, Project administration, Resources, Supervision, Validation, Visualization, Writing – original draft, Writing – review & editing. CW: Formal analysis, Funding acquisition, Project administration, Resources, Supervision, Validation, Visualization, Writing – original draft, Writing – review & editing.
Funding
The author(s) declare financial support was received for the research, authorship, and/or publication of this article. This work was supported by the US Army Corps of Engineers Engineering With Nature® Initiative through Cooperative Ecosystem Studies Unit Agreement Award W912HZ2020031. Model simulations were conducted on the University of Georgia Advanced Resource Computing Resource Center (GACRC) Sapelo2 High Peformance Computing Cluster.
Conflict of interest
The authors declare that the research was conducted in the absence of any commercial or financial relationships that could be construed as a potential conflict of interest.
Generative AI statement
The author(s) declare that no Generative AI was used in the creation of this manuscript.
Publisher’s note
All claims expressed in this article are solely those of the authors and do not necessarily represent those of their affiliated organizations, or those of the publisher, the editors and the reviewers. Any product that may be evaluated in this article, or claim that may be made by its manufacturer, is not guaranteed or endorsed by the publisher.
Supplementary material
The Supplementary Material for this article can be found online at: https://www.frontiersin.org/articles/10.3389/fevo.2025.1524570/full#supplementary-material
References
Alizad K., Hagen S. C., Morris J. T., Bacopoulos P., Bilskie M. V., Weishampel J. F., et al. (2016). A coupled, two-dimensional hydrodynamic-marsh model with biological feedback. Ecol. Model. 327, 29–43. doi: 10.1016/j.ecolmodel.2016.01.013
Atkinson J. H., Westerink J. J., Hervouet J. M. (2004). Similarities between the quasi-bubble and the generalized wave continuity equation solutions to the shallow water equations. Int. J. Numerical Methods Fluids 45, 689–714. doi: 10.1002/fld.v45:7
Barbier E. B., Georgiou I. Y., Enchelmeyer B., Reed D. J. (2013). The value of wetlands in protecting southeast louisiana from hurricane storm surges. PLoS One 8, e58715. doi: 10.1371/journal.pone.0058715
Bilskie M., Hagen S., Medeiros S., Cox A., Salisbury M., Coggin D. (2016). Data and numerical analysis of astronomic tides, wind-waves, and hurricane storm surge along the northern gulf of Mexico. J. Geophysical Research: Oceans 121, 3625–3658. doi: 10.1002/2015JC011400
Bridges T. S., Burks-Copes K. A., Bates M. E., Collier Z. A., Fischenich J. C., Piercy C. D., et al. (2015). Use of natural and nature-based features (NNBF) for coastal resilience (Vicksburg, MS: Environmental Laboratory, U.S. Army Engineer Research and Development Center).
Browder G., Ozment S., Bescos I. R., Gartner T., Lange G. M. (2019). Integrating green and gray (Washington, DC: World Bank and World Resources Institute).
Congressional Budget Office (CBO) (2019). Expected costs of damage from wind and storm surge. Available online at: https://www.cbo.gov/system/files/2019-04/55019-ExpectedCostsFromWindStorm.pdf.
Dawson C., Westerink J. J., Feyen J. C., Pothina D. (2006). Continuous, discontinuous and coupled discontinuous–continuous galerkin finite element methods for the shallow water equations. Int. J. Numerical Methods Fluids 52, 63–88. doi: 10.1002/fld.v52:1
Dietrich J., Muhammad A., Curcic M., Fathi A., Dawson C., Chen S. S., et al. (2018). Sensitivity of storm surge predictions to atmospheric forcing during hurricane isaac. J. Waterway Port Coastal Ocean Eng. 144, 04017035. doi: 10.1061/(ASCE)WW.1943-5460.0000419
Friedrichs C. T., Aubrey D. G. (1996). Uniform bottom shear stress and equilibrium hyposometry of intertidal flats. Mixing in Estuaries and Coastal Seas., 405–429. doi: 10.1029/ce050p0405
Gao J. (2018). On the surface wind stress for storm surge modeling. The University of North Carolina at Chapel Hill, North Carolina, United States.
Garratt J. (1977). Review of drag coefficients over oceans and continents. Mon. Wea. Rev. 105, 915–929. doi: 10.1175/1520-0493(1977)105<0915:RODCOO>2.0.CO;2
Grzegorzewski A. S., Cialone M., Lansen A. J., van Ledden M., Smith J., Wamsley T. (2009). The influence of barrier islands on hurricane-generated storm surge and waves in Louisiana and Mississippi. Coastal Engineering 2008, 1037–1049. doi: 10.1142/9789814277426_0087
Grzegorzewski A. S., Cialone M. A., Wamsley T. V. (2011). Interaction of barrier islands and storms: implications for flood risk reduction in louisiana and mississippi. J. Coast. Res. 59, 156–164. doi: 10.2112/SI59-016.1
Gupta A., Behera M. R. (2024). Effectiveness of emergent coastal vegetation as a defense system to mitigate debris load on a structure during extreme events. Ocean Sci. J. 59, 62. doi: 10.1007/s12601-024-00188-5
Gupta A., Heidarpour A., Behera M. R. (2022). Effect of structure orientation and debris initial orientation on peak debris loading during tsunami: An experimental and numerical investigation. Appl. Ocean Res. 121, 103075. doi: 10.1016/j.apor.2022.103075
Hagen S., Bacopoulos P. (2012). Coastal flooding in florida’s big bend region with application to sea level rise based on synthetic storms analysis. Terrestrial Atmospheric Oceanic Sci. 23, 481. doi: 10.3319/tao.2012.04.17.01(wmh)
Hewageegana V., Bilskie M., Woodson C., Bledsoe B. (2022). The effects of coastal marsh geometry and surge scales on water level attenuation. Ecol. Eng. 185, 106813. doi: 10.1016/j.ecoleng.2022.106813
Hladik C., Alber M. (2012). Accuracy assessment and correction of a lidar-derived salt marsh digital elevation model. Remote Sens. Environ. 121, 224–235. doi: 10.1016/j.rse.2012.01.018
Homer C., Huang C., Yang L., Wylie B., Coan M. (2004). Development of a 2001 national land-cover database for the United States. Photogrammetric Eng. Remote Sens. 70, 829–840. doi: 10.14358/PERS.70.7.829
IPCC. (2019). IPCC Special Report on the Ocean and Cryosphere in a Changing Climate. eds. H.-O Pörtner, D.C. Roberts, V. Masson-Delmotte, P. Zhai, M. Tignor, E. Poloczanska, K. Mintenbeck, A. Alegría, M. Nicolai, A. Okem, J. Petzold, B. Rama, N.M. Weyer. Cambridge, UK and New York, NY, USA: Cambridge University Press. 755 pp. doi: 10.1017/9781009157964
Kolar R. L., Gray W. G., Westerink J. J., Luettich R. A. (1994a). Shallow water modeling in spherical coordinates: Equation formulation, numerical implementation, and application. J. Hydraulic Res. 32, 3–24. doi: 10.1080/00221689409498786
Kolar R. L., Westerink J. J., Cantekin M. E., Blain C. A. (1994b). Aspects of nonlinear simulations using shallow-water models based on the wave continuity equation. Comput. Fluids 23, 523–538. doi: 10.1016/0045-7930(94)90017-5
Krauss K. W., Doyle T. W., Doyle T. J., Swarzenski C. M., From A. S., Day R. H., et al. (2009). Water level observations in mangrove swamps during two hurricanes in florida. Wetlands 29, 142–149. doi: 10.1672/07-232.1
Lagarias J. C., Reeds J. A., Wright M. H., Wright P. E. (1998). Convergence properties of the nelder–mead simplex method in low dimensions. SIAM J. optimization 9, 112–147. doi: 10.1137/S1052623496303470
Lawler S., Haddad J., Ferreira C. M. (2016). Sensitivity considerations and the impact of spatial scaling for storm surge modeling in wetlands of the mid-atlantic region. Ocean Coast. Manage. 134, 226–238. doi: 10.1016/j.ocecoaman.2016.10.008
Lee Y., Lim W. (2017). Shoelace formula: Connecting the area of a polygon and the vector cross product. Mathematics Teacher 110, 631–636. doi: 10.5951/mathteacher.110.8.0631
Leonard L. A., Luther M. E. (1995). Flow hydrodynamics in tidal marsh canopies. Limnol. Oceanogr. 40 (8), 1474–1484. doi: 10.4319/lo.1995.40.8.1474
Livingston R. J., Iverson R. L., Estabrook R. H., Keys V. E., Taylor J. Jr (1974). Major features of the apalachicola bay system: physiography, biota, and resource management. Florida Scientist, 245–271.
Loder N., Irish J. L., Cialone M., Wamsley T. (2009). Sensitivity of hurricane surge to morphological parameters of coastal wetlands. Estuarine Coast. Shelf Sci. 84, 625–636. doi: 10.1016/j.ecss.2009.07.036
Luettich R. A., Westerink J. J. (2004). Formulation and numerical implementation of the 2d/3d adcirc finite element model version 44.xx. Retrieved December 8, 2004.
Luettich R. A., Westerink J. J., Scheffner N. W. (1992). Adcirc: an advanced three-dimensional circulation model for shelves, coasts, and estuaries. report 1, theory and methodology of adcirc-2dd1 and adcirc-3dl.
McGee B. D., Goree B. B., Tollett R. W., Woodward B. K., Kress W. H. (2006). Hurricane Rita surge data, southwestern Louisiana and southeastern Texas, September to November 2005. (Tech. rep). Data Series. doi: 10.3133/ds220
Medeiros S., Hagen S., Weishampel J., Angelo J. (2015). Adjusting lidar-derived digital terrain models in coastal marshes based on estimated aboveground biomass density. Remote Sens. 7, 3507–3525. doi: 10.3390/rs70403507
Möller I., Kudella M., Rupprecht F., Spencer T., Paul M., Van Wesenbeeck B. K., et al. (2014). Wave attenuation over coastal salt marshes under storm surge conditions. Nat. Geosci. 7, 727–731. doi: 10.1038/ngeo2251
Mortazavi B., Iverson R. L., Huang W., Lewis F. G., Caffrey J. M. (2000). Nitrogen budget of apalachicola bay, a bar-built estuary in the northeastern gulf of Mexico. Mar. Ecol. Prog. Ser. 195, 1–14. doi: 10.3354/meps195001
Narayan S., Beck M. W., Reguero B. G., Losada I. J., Van Wesenbeeck B., Pontee N., et al. (2016). The effectiveness, costs and coastal protection benefits of natural and nature-based defences. PLoS One 11, e0154735. doi: 10.1371/journal.pone.0154735
Narayan S., Beck M. W., Wilson P., Thomas C. J., Guerrero A., Shepard C. C., et al. (2017). The value of coastal wetlands for flood damage reduction in the northeastern usa. Sci. Rep. 7, 1–12. doi: 10.1038/s41598-017-09269-z
National Hurricane Center (2024). Hurricane Helene Tropical Cyclone Update (Accessed October 31, 2024). doi: 10.25921/stkw-7w73
National Oceanic and Atmospheric Administration (NOAA) (2023). Billion-dollar weather and climate disasters: Overview.
Nelson D. R., Bledsoe B. P., Ferreira S., Nibbelink N. P. (2020). Challenges to realizing the potential of nature-based solutions. Curr. Opin. Environ. Sustainability 45, 49–55. doi: 10.1016/j.cosust.2020.09.001
N\eumeier U., Amos C. L. (2006). The influence of vegetation on turbulence and flow velocities in European salt-marshes. Sedimentology 53 (2), 259–277. doi: 10.1111/j.1365-3091.2006.00772.x
Palinkas C. M., Orton P., Hummel M. A., Nardin W., Sutton-Grier A. E., Harris L., et al. (2022). Innovations in coastline management with natural and nature-based features (nnbf): Lessons learned from three case studies. Front. Built Environ. 8, 814180. doi: 10.3389/fbuil.2022.814180
Pringle W. J., Wirasaet D., Roberts K. J., Westerink J. J. (2021). Global storm tide modeling with adcirc v55: Unstructured mesh design and performance. Geoscientific Model. Dev. 14, 1125–1145. doi: 10.5194/gmd-14-1125-2021
Saleh F., Weinstein M. P. (2016). The role of nature-based infrastructure (nbi) in coastal resiliency planning: A literature review. J. Environ. Manage. 183, 1088–1098. doi: 10.1016/j.jenvman.2016.09.077
Setiawan A., Sediyono E. (2022). “Determination of region area in two UTM zone using shoelace formula based on the GADM database” in Proceeding of the 1st international conference on standardization and metrology (ICONSTAM), 2021, 2664, 040006. doi: 10.1063/5.0103178
Shepard C. C., Crain C. M., Beck M. W. (2011). The protective role of coastal marshes: a systematic review and meta-analysis. PLoS One 6, e27374. doi: 10.1371/journal.pone.0027374
Stark J., Van Oyen T., Meire P., Temmerman S. (2015). Observations of tidal and storm surge attenuation in a large tidal marsh. Limnology Oceanography 60, 1371–1381. doi: 10.1002/lno.10104
Stone G. W., Zhang X., Sheremet A. (2005). The role of barrier islands, muddy shelf and reefs in mitigating the wave field along coastal louisiana. J. Coast. Res. 40–55.
Sutton-Grier A. E., Wowk K., Bamford H. (2015). Future of our coasts: The potential for natural and hybrid infrastructure to enhance the resilience of our coastal communities, economies and ecosystems. Environ. Sci. Policy 51, 137–148. doi: 10.1016/j.envsci.2015.04.006
Tahsin S., Medeiros S. C., Singh A. (2016). Resilience of coastal wetlands to extreme hydrologic events in apalachicola bay. Geophysical Res. Lett. 43, 7529–7537. doi: 10.1002/2016GL069594
Temmerman S., Meire P., Bouma T. J., Herman P. M., Ysebaert T., De Vriend H. J. (2013). Ecosystem-based coastal defence in the face of global change. Nature 504, 79–83. doi: 10.1038/nature12859
Toro G. R., Hagen S. C., Atkinson J., Reed C. (2011). Production runs for the big bend region of florida. Fla. Watershed J. 4, 28–35.
van Rees C. B., Hernández-Abrams D. D., Shudtz M., Lammers R., Byers J., Bledsoe B. P., et al. (2023). Reimagining infrastructure for a biodiverse future. Proc. Natl. Acad. Sci. 120, e2214334120. doi: 10.1073/pnas.2214334120
Wamsley T. V., Cialone M. A., Smith J. M., Atkinson J. H., Rosati J. D. (2010). The potential of wetlands in reducing storm surge. Ocean Eng. 37, 59–68. doi: 10.1016/j.oceaneng.2009.07.018
Wamsley T. V., Cialone M. A., Smith J. M., Ebersole B. A., Grzegorzewski A. S. (2009). Influence of landscape restoration and degradation on storm surge and waves in southern louisiana. Natural Hazards 51, 207–224. doi: 10.1007/s11069-009-9378-z
Westerink J. J., Luettich R. A., Feyen J. C., Atkinson J. H., Dawson C., Roberts H. J., et al. (2008). A basin-to channel-scale unstructured grid hurricane storm surge model applied to southern louisiana. Monthly weather Rev. 136, 833–864. doi: 10.1175/2007MWR1946.1
Whelchel A. W., Reguero B. G., van Wesenbeeck B., Renaud F. G. (2018). Advancing disaster risk reduction through the integration of science, design, and policy into eco-engineering and several global resource management processes. Int. J. disaster Risk reduction 32, 29–41. doi: 10.1016/j.ijdrr.2018.02.030
Keywords: storm surge attenuation, barrier islands, wetlands, nature-based solutions, coastal resilience
Citation: Gupta A, Bilskie MV and Woodson CB (2025) The potential of wetlands and barrier islands as a coastal defense in mitigating the storm surge. Front. Ecol. Evol. 13:1524570. doi: 10.3389/fevo.2025.1524570
Received: 07 November 2024; Accepted: 06 January 2025;
Published: 28 January 2025.
Edited by:
Stephanie Dohner, Naval Research Laboratory, United StatesReviewed by:
A. Rita Carrasco, University of Algarve, PortugalGary Zarillo, Florida Institute of Technology, United States
Copyright © 2025 Gupta, Bilskie and Woodson. This is an open-access article distributed under the terms of the Creative Commons Attribution License (CC BY). The use, distribution or reproduction in other forums is permitted, provided the original author(s) and the copyright owner(s) are credited and that the original publication in this journal is cited, in accordance with accepted academic practice. No use, distribution or reproduction is permitted which does not comply with these terms.
*Correspondence: Aditya Gupta, YWRpLmd1cHRhQHVnYS5lZHU=